presentation on financial performance for the quarter/9m
TRANSCRIPT

Presentation on Financial Performance
for the
Quarter/9M December 2015
1

2
Key Business figures- Dec ’15
Global Business increased by 11.2% to Rs. 941468 Cr.
Global Deposits increased by 13.3% to Rs. 548531 Cr.
CASA Deposits increased by 14.3% to Rs. 197922 Cr.
CASA share to Domestic Deposits stood at 40.38%
Global Net Advances increased by 8.4 % to Rs. 392937 Cr.
Share of Small Ticket Adv. at 60.3% of Domestic Non Food Credit.
Operating Profit stood at Rs. 2918 cr. in Q3FY16, grew 6.1% YoY.
NIM stood at 2.87% during 9M FY 16 and 2.75% during Q3FY16.

3
PNB – Key Strengths
Experience of more than 120 years of delivering banking services.
Strong positioning with Pan India presence of 6692 branches, 8884 ATMs, 8316 BCs
and 100 million customers. 64% branches in R/SU locations give us additional
advantage.
Sound NIM with Low Cost Deposits Share around 40.38%.
Well placed funding and liquidity: low dependence on high cost deposits.
Orientation of credit growth through Small ticket Advances.
Robust and agile risk management system: One of the pioneer Bank to get RBI’s
permission to migrate to Advanced Measurement Approach for calculating
Operational Risk Capital Charge on Parallel run Basis.
Digitalization : After pioneering in IT initiatives, Bank is moving fast towards
Digitalization.
PNB is ranked 1st among PSBs in the overall list of 'Most Respected Companies‘ by BW Business World Survey 2015; over all ranking being 51st .
Profitability:
Performance of The Bank
during Q3 FY 16
4
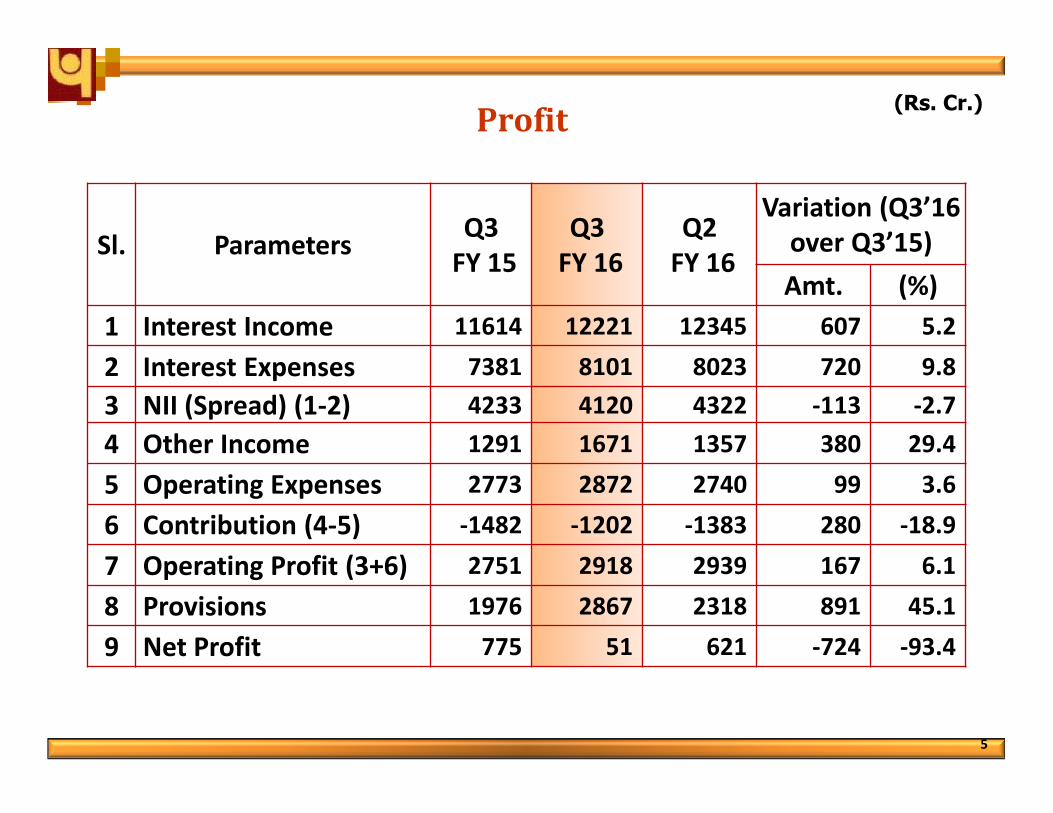
Profit(Rs. Cr.)
5
Sl. Parameters Q3
FY 15
Q3
FY 16
Q2
FY 16
Variation (Q3’16
over Q3’15)
Amt. (%)
1 Interest Income 11614 12221 12345 607 5.2
2 Interest Expenses 7381 8101 8023 720 9.8
3 NII (Spread) (1-2) 4233 4120 4322 -113 -2.7
4 Other Income 1291 1671 1357 380 29.4
5 Operating Expenses 2773 2872 2740 99 3.6
6 Contribution (4-5) -1482 -1202 -1383 280 -18.9
7 Operating Profit (3+6) 2751 2918 2939 167 6.1
8 Provisions 1976 2867 2318 891 45.1
9 Net Profit 775 51 621 -724 -93.4

Provisions
Sl. ParticularsQ3
FY 15
Q3
FY 16
Q2
FY 16
Variation (Q3’16
over Q3’15)
Amt. (%)
1Provision towards NPAs (Net of floating provisions)
1723 3767 2031 2044 118.6
2Standard Advances (incl. Standard Restructured)
135 -392 -43 -527 -390.7
3Depreciation on
Investment -445 123 -73 568 -127.7
4 Income Tax 508 -909 435 -1417 -278.7
5 Others 55 277 -33 223 409.1
6 Total Provision 1976 2867 2318 891 45.1
6
(Rs. Cr.)
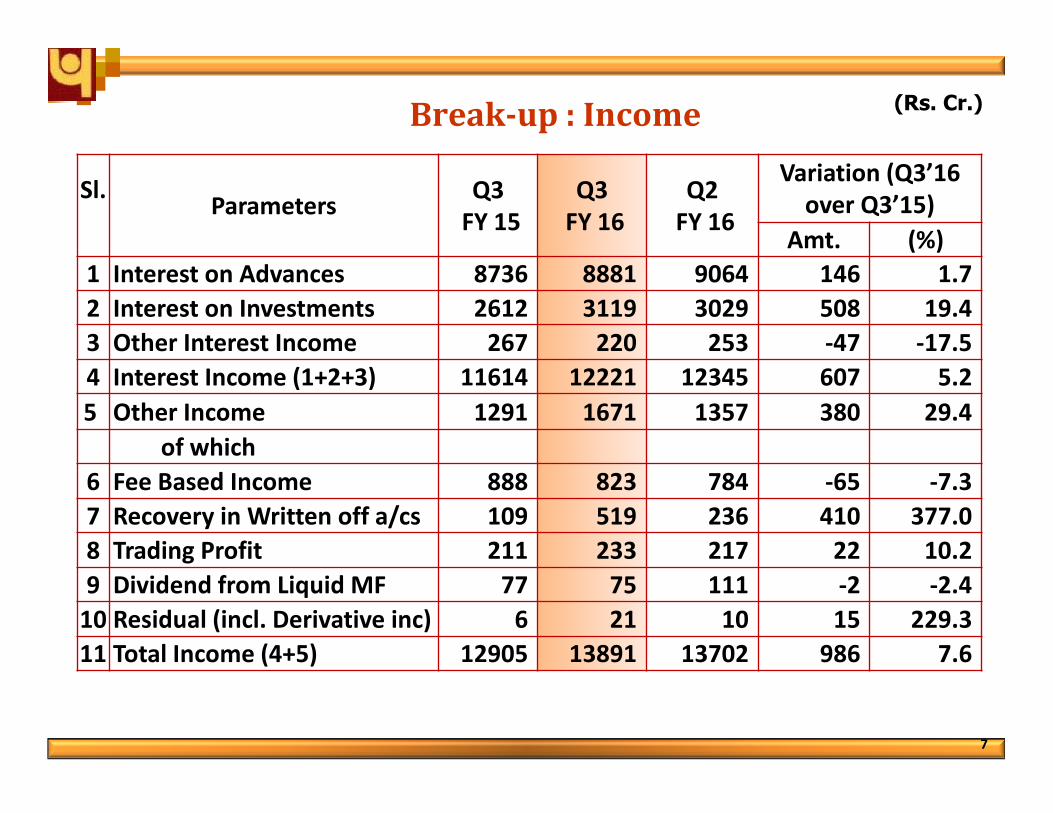
Break-up : Income
Sl.Parameters
Q3
FY 15
Q3
FY 16
Q2
FY 16
Variation (Q3’16
over Q3’15)
Amt. (%)
1 Interest on Advances 8736 8881 9064 146 1.7
2 Interest on Investments 2612 3119 3029 508 19.4
3 Other Interest Income 267 220 253 -47 -17.5
4 Interest Income (1+2+3) 11614 12221 12345 607 5.2
5 Other Income 1291 1671 1357 380 29.4
of which
6 Fee Based Income 888 823 784 -65 -7.3
7 Recovery in Written off a/cs 109 519 236 410 377.0
8 Trading Profit 211 233 217 22 10.2
9 Dividend from Liquid MF 77 75 111 -2 -2.4
10 Residual (incl. Derivative inc) 6 21 10 15 229.3
11 Total Income (4+5) 12905 13891 13702 986 7.6
7
(Rs. Cr.)

Break-up : Expenditure
Sl. Parameters Q3
FY 15
Q3
FY 16
Q2
FY 16
Variation (Q3’16
over Q3’15)
Amt. (%)
1 Intt. Paid on Deposits 6990 7534 7452 544 7.8
2 Intt. Paid on Borrowings 55 35 69 -20 -36.1
3 Others 336 532 502 196 58.4
4 Total Interest Paid (1+2+3) 7381 8101 8023 720 9.8
5 Estab. Expenses 2029 1991 1878 -37 -1.8
Of Which
5a Employee Benefits (AS-15) 853 747 677 -106 -12.5
6 Other Operating Expenses 745 881 863 137 18.3
7 Operating Expenses (5+6) 2773 2872 2740 99 3.6
8 Total Expenses (4+7) 10154 10973 10763 819 8.1
8
(Rs. Cr.)
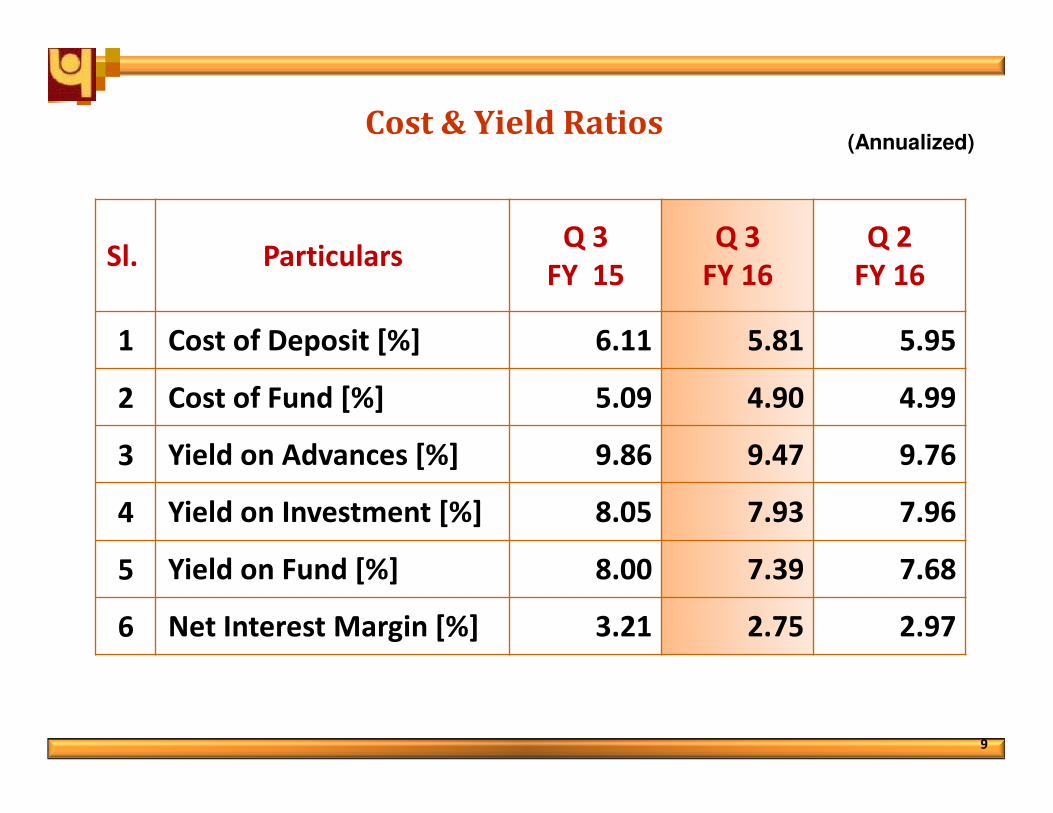
Cost & Yield Ratios (Annualized)
Sl. Particulars Q 3
FY 15
Q 3
FY 16
Q 2
FY 16
1 Cost of Deposit [%] 6.11 5.81 5.95
2 Cost of Fund [%] 5.09 4.90 4.99
3 Yield on Advances [%] 9.86 9.47 9.76
4 Yield on Investment [%] 8.05 7.93 7.96
5 Yield on Fund [%] 8.00 7.39 7.68
6 Net Interest Margin [%] 3.21 2.75 2.97
9

10
Reducing Dependence on High Cost Deposits
Share of CASA & High Cost Dep. Cost of Deposits
6.82
6.33
6.09
5.99 5.975.92
40.86 41.31 40.57 38.94 40.23 40.38
12.49
4.99
2.42
1.200.59 0.53
0.0
2.0
4.0
6.0
8.0
10.0
12.0
14.0
25.0
27.0
29.0
31.0
33.0
35.0
37.0
39.0
41.0
43.0
45.0
Mar'13 Mar'14 Mar'15 Jun'15 Sep'15 Dec'15
Sh
are
of
Hig
h C
ost
De
p.
CA
SA
Sh
are
CASA Share to Dom. Dep. Share of High Cost Dep.

Net Interest Margin (%) (Annualized)
11
Q2 FY 16 Q3 FY 16 HY 1 FY 16 9M FY 16
Domestic NIM 3.37% 3.13% 3.34% 3.27%
3.52 3.52 3.49 3.52 3.44 3.42 3.3 3.27 3.152.90 2.93 2.87

Profitability Ratios (Annualized)
Sl. Particulars Q 3
FY 15
Q 3
FY 16
Q 2
FY 16
1 Return on Assets [%] 0.53 0.03 0.39
2 Return on Net worth [%] 8.32 0.50 6.09
3 Opt. Profit to AWF [%] 1.90 1.76 1.83
4 Cost to Income Ratio [%] 50.20 49.61 48.26
5 Estb. Exp. To Total Exp. [%] 19.98 18.15 17.44
6 Opt. Exp. To AWF [%] 1.91 1.74 1.70
7 Book Value per Share [Rs] 205.73 207.92 207.65
8 Earnings per share [Rs] 17.11 1.08 13.39
12

Profitability:
Performance of The Bank
during 9M FY 16
13

Profit
Sl. Parameters 9M
Dec'14
9M
Dec'15
FY
Mar'15
Variation
(Dec'15 over
Dec'14)
Amt. (%)
1 Interest Income 34665 36600 46315 1935 5.6
2 Interest Expenses 21901 24056 29760 2155 9.8
3 NII (Spread) (1-2) 12764 12544 16556 -220 -1.7
4 Other Income 4086 4425 5891 339 8.3
5 Operating Expenses 8098 7980 10492 -117 -1.4
6 Contribution (4-5) -4012 -3556 -4601 456 -11.4
7 Operating Profit (3+6) 8752 8988 11955 236 2.7
8 Provisions 5997 7596 8893 1599 26.7
9 Net Profit 2755 1393 3062 -1362 -49.4
14
(Rs. Cr.)
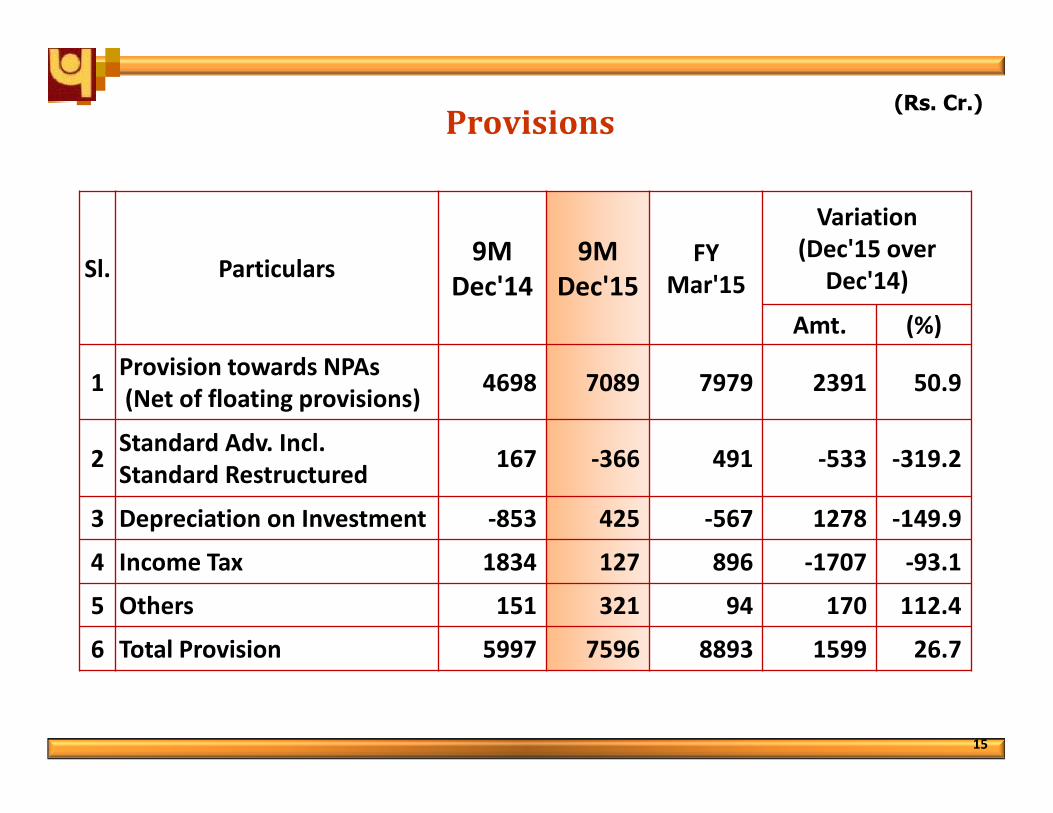
Provisions
Sl. Particulars9M
Dec'14
9M
Dec'15
FY
Mar'15
Variation
(Dec'15 over
Dec'14)
Amt. (%)
1Provision towards NPAs
(Net of floating provisions) 4698 7089 7979 2391 50.9
2Standard Adv. Incl.
Standard Restructured167 -366 491 -533 -319.2
3 Depreciation on Investment -853 425 -567 1278 -149.9
4 Income Tax 1834 127 896 -1707 -93.1
5 Others 151 321 94 170 112.4
6 Total Provision 5997 7596 8893 1599 26.7
15
(Rs. Cr.)

Break-up : Income
Sl. Parameters 9M
Dec'149M
Dec'15
FY
Mar'15
Variation (Dec'15
over Dec'14)
Amt. (%)
1 Interest on Advances 26226 26853 34794 627 2.4
2 Interest on Investments 7819 9054 10600 1234 15.8
3 Other Interest Income 620 694 921 74 11.9
4 Interest Income (1+2+3) 34665 36600 46315 1935 5.6
5 Other Income 4086 4425 5891 339 8.3
of which
6 Fee Based Income 2635 2550 3485 -85 -3.2
7 Recovery in Written off a/cs 682 972 1017 289 42.4
8 Trading Profit 485 612 1023 127 26.1
9 Dividend from Liquid MF 249 259 334 10 4.0
10 Residual (incl Derivative inc) 34 32 32 -2 -6.4
11 Total Income (4+5) 38750 41025 52206 2275 5.9
16
(Rs. Cr.)

Break-up : Expenditure
Sl. Parameters 9M
Dec'14
9M
Dec'15
FY
Mar'15
Variation
(Dec'15 over
Dec'14)
Amt. (%)
1 Intt. Paid on Deposits 20460 22354 27621 1894 9.3
2 Intt. Paid on Borrowings 486 199 567 -287 -59.1
3 Others 955 1503 1571 548 57.4
4 Total Interest Paid (1+2+3) 21901 24056 29760 2155 9.8
5 Estab. Expenses 5830 5418 7337 -412 -7.1
Of Which
5a Employee Benefits (AS-15) 2368 1844 3218 -524 -22.1
6 Other Operating Expenses 2267 2562 3155 295 13.0
7 Operating Expenses (5+6) 8098 7980 10492 -117 -1.4
8 Total Expenses (4+7) 29998 32037 40251 2038 6.8
17
(Rs. Cr.)

Cost & Yield Ratios (Annualized)
Sl. Particulars 9M
Dec’14
9M
Dec’15
FY
Mar’15
1 Cost of Deposit [%] 6.12 5.92 6.09
2 Cost of Fund [%] 5.11 4.98 5.14
3 Yield on Advances [%] 10.01 9.59 9.88
4 Yield on Investment [%] 8.00 7.94 7.99
5 Yield on Fund [%] 8.09 7.58 8.00
6 Net Interest Margin [%] 3.27 2.87 3.15
18

Profitability Ratios (Annualized)
Sl. Particulars 9M
Dec’14
9M
Dec’15
FY
Mar’15
1 Return on Assets [%] 0.64 0.29 0.53
2 Return on Net worth [%] 9.86 4.55 8.12
3 Opt. Profit to AWF [%] 2.04 1.86 2.06
4 Cost to Income Ratio [%] 48.06 47.03 46.74
5 Estb. Exp. To Total Exp. [%] 19.43 16.91 18.23
6 Opt. Exp. To AWF [%] 1.89 1.65 1.81
7 Book Value per Share [Rs] 205.73 207.92 203.24
8 Earnings per share [Rs] 20.29 9.82 16.91
19

Business:
Performance of the Bank
20

Business
Sl. Parameters Dec'14 Mar'15 Dec'15
Variation (Dec'15
over Dec'14)
Amt. (%)
1 Total Business 846634 881913 941468 94834 11.2
Out of Which
Overseas Business 93975 100785 114267 20292 21.6
Overseas Business (USD Mio) 14940 16161 17316 2376 15.9
Share of Overseas Business [%] 11.10% 11.43% 12.14%
2 Total Deposit 484138 501379 548531 64393 13.3
3 Total Advances 362496 380534 392937 30441 8.4
4 CD Ratio[%] 74.87% 75.90% 71.63%
21
(Rs. Cr.)

Deposit
Sl. Parameters Dec'14 Mar'15 Dec'15
Variation (Dec'15
over Dec'14)
Amt. (%)
1 Global Deposit 484138 501379 548531 64393 13.3
2 Overseas Deposit 45201 48350 58437 13236 29.3
Overseas Deposit (USD Mio) 7171 7736 8833 1662 23.2
3 Domestic Deposit 438937 453029 490095 51157 11.7
1.1 Current Deposit 29674 33581 36462 6788 22.9
1.2 SB Deposit 143463 150200 161460 17997 12.5
CASA Deposit (1.1+1.2) 173137 183780 197922 24785 14.3
Share of CASA To Dom. Dep. (%) 39.44% 40.57% 40.38%
1.3 Term Deposit 311001 317598 350610 39608 12.7
Differential Rate Dep. Incl. CD 24183 12123 2913 -21270 -88.0
Share of DRI Dep. to Total % 5.00% 2.42% 0.53%
22
(Rs. Cr.)

Advances- Sectoral
Sl. Parameters Dec'14 Mar'15 Dec’15 Share %
to NFC
Variation Dec'15/
Dec'14
Amt. (%)
1 Global Gross Advances 372086 392422 405210 33124 8.9
2 Overseas Advances 48774 52435 55830 7056 14.5
Overseas Advances (USD Mio) 7769 8425 8483 714 9.2
3 Domestic Gross Advances 323312 339987 349381 26069 8.1
3a Food Credit 6970 5846 6875 -95 -1.4
3b Dom. Non-Food Gr. Adv. [NFC] 316342 334141 342506 26164 8.3
- of Which [Sl.No.4 to 9]
4 Agriculture & Allied 53103 60006 60132 17.6% 7029 13.2
5 Industry 142064 146351 159811 46.7% 17747 12.5
5a MSME Manufacturing 46660 46879 50598 14.8% 3938 8.4
5b Large Industry 95404 99472 109213 31.9% 13809 14.5
6 Retail Loans 46215 48415 54351 15.9% 8136 17.6
6a Housing 19759 21544 25061 7.3% 5302 26.8
6b Car/Vehicle 3923 4089 4572 1.3% 649 16.5
6c Education 4379 4397 4598 1.3% 219 5.0
6d Other Retail Loans 18154 18385 20120 5.9% 1966 10.8
7 Commercial Real Estate 8717 9636 10538 3.1% 1821 20.9
8 NBFC 11572 14191 18485 5.4% 6913 59.7
9 Services & Others 54671 55542 39189 11.4% -15482 -28.3
23
(Rs. Cr.)

24
Moving through Small Ticket Advances
Drivers of Small Ticket Advances
Parameters Dec'14 Mar’15 Dec'15
Variation
Dec'15 over
Dec'14
Amt %
Agriculture 53103 60006 60132 7029 13.2
MSME 81231 85683 92004 10773 13.3
Retail 46215 48415 54351 8136 17.6
Total Small
Ticket180549 194104 206487 25938 14.4
Domestic
Non food
Credit
316342 334141 342506 26164 8.3
Share 57.07% 58.09% 60.29%
(Rs. Cr.)
51.32%
52.94%
57.07%58.09%
60.29%
Dec'13 Mar'14 Dec'14 Mar’15 Dec'15
Share of Small Ticket Advances
Bank is aligning Business strategies with the cyclical movement in the economyBank is aligning Business strategies with the cyclical movement in the economyand thriving to achieve “Profitable Growth from the Grassroots (Branches)”
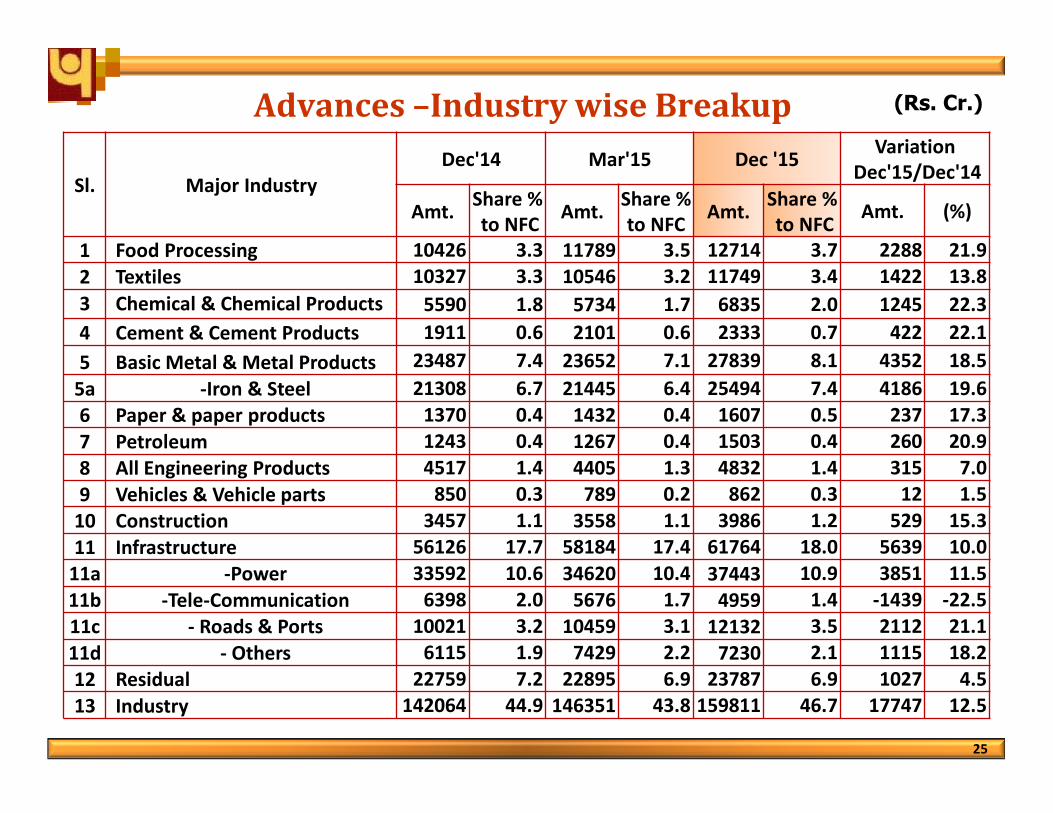
Advances –Industry wise Breakup
Sl. Major Industry
Dec'14 Mar'15 Dec '15Variation
Dec'15/Dec'14
Amt. Share %
to NFCAmt.
Share %
to NFCAmt.
Share %
to NFCAmt. (%)
1 Food Processing 10426 3.3 11789 3.5 12714 3.7 2288 21.9
2 Textiles 10327 3.3 10546 3.2 11749 3.4 1422 13.8
3 Chemical & Chemical Products 5590 1.8 5734 1.7 6835 2.0 1245 22.3
4 Cement & Cement Products 1911 0.6 2101 0.6 2333 0.7 422 22.1
5 Basic Metal & Metal Products 23487 7.4 23652 7.1 27839 8.1 4352 18.5
5a -Iron & Steel 21308 6.7 21445 6.4 25494 7.4 4186 19.6
6 Paper & paper products 1370 0.4 1432 0.4 1607 0.5 237 17.3
7 Petroleum 1243 0.4 1267 0.4 1503 0.4 260 20.9
8 All Engineering Products 4517 1.4 4405 1.3 4832 1.4 315 7.0
9 Vehicles & Vehicle parts 850 0.3 789 0.2 862 0.3 12 1.5
10 Construction 3457 1.1 3558 1.1 3986 1.2 529 15.3
11 Infrastructure 56126 17.7 58184 17.4 61764 18.0 5639 10.0
11a -Power 33592 10.6 34620 10.4 37443 10.9 3851 11.5
11b -Tele-Communication 6398 2.0 5676 1.7 4959 1.4 -1439 -22.5
11c - Roads & Ports 10021 3.2 10459 3.1 12132 3.5 2112 21.1
11d - Others 6115 1.9 7429 2.2 7230 2.1 1115 18.2
12 Residual 22759 7.2 22895 6.9 23787 6.9 1027 4.5
13 Industry 142064 44.9 146351 43.8 159811 46.7 17747 12.5
25
(Rs. Cr.)

Investment
26
Sl. Particulars Dec'14 Mar'15 Dec'15
A Gross Domestic Investment 139943 149266 162532
1 Total SLR 113450 123133 128561
2 Total Non SLR 26493 26133 33971
3 Held To Maturity (HTM) 98547 106969 104103
4 Available For Sale (AFS) 39037 39116 58211
5 Held For trading (HFT) 2359 3181 218
6 Duration (AFS) 4.04 4.97 4.31
7 Modified Duration (AFS) 3.82 4.73 4.10
8 Duration Total Portfolio 4.78 5.09 4.79
9 Modified Duration Total Portfolio 4.58 4.89 4.59
10 Net demand & time Liabilities 434885 455134 480521
11 SLR (%) 26.93 27.19 26.75
11a SLR HTM to Total SLR (%) 84.93 84.97 79.07
12 HTM To Gross Investment (%) 70.42 71.66 64.05
B Investment by overseas branches 1251 2620 3607
C Total Gross Investment (A+B) 141194 151886 166139
(Rs. Cr.)
Domestic Treasury Highlights
27
�Total size of Bank’s Domestic Investment Book as on 31st Dec ’15 stood at
Rs.162532 cr.
� Yield on Investment stood at 7.93% during Q3 FY 16.
�As on 31st Dec ’15, the share of SLR Securities in Total Investment was 79.10 %.
�The Bank had 64% of total domestic in HTM and 36% in AFS as on Dec 2015.
�The per cent of SLR to NDTL as on Dec 2015 was at 26.75 %.
�As on 31st Dec, 2015, the modified duration of AFS investments was 4.10.
�Trading Profit stood at Rs. 612 crore in Q3, FY16 and recorded impressive yoy
growth of 26.1% on yoy basis.

Break up of Gross Credit as per Asset Class
Financial Year
Standard Adv.
(Excl. Std.
Restructured)
Restructured
Standard (O/S)*NPA
Gross
Advances
1 2 (5-4-3) 3 4 5
FY 2012-13 288362 13415 13466 315243
FY 2013-14 321329 19437 18880 359646
FY 2014-15 332643 34084 25695 392422
Dec’15 (9M) 335868 35004 34338 405210
28
Standard Restructured
(as on 31.12.15)CDR SME NON CDR Total
Amount O/S 12462 946 21596 35004
Restructured Accounts (01.04.2015 to 31.12.2015)
CDR SME Non CDR Total Diminution in Fair Value
Standard Adv. 38 240 643 920 31
NPA 0 33 27 60 6
Total 38 272 669 980 37
(Rs. Cr.)

Sector/Industry wise O/S Restructured Accounts-Dec’15
29
Restructuring (Standard): Major Industries
Sl. SectorO/S
Amt
%age
Share
1 Iron & Steel 5979 17.1
2 Infrastructure 15792 45.1
Out of which
Power 12976 37.1
SEBs 8136 23.2
Telecom 260 0.7
3 Chemical/Fertiliser/Drugs 2181 6.2
4 Sugar 1377 3.9
5 Textiles 1125 3.2
6 Manufacturing 1009 2.9
7 Cement 545 1.6
8 Hotel 497 1.4
9 Education 363 1.0
10 Drilling 196 0.6
Sector wise Restructuring
(Standard)
Sl. Sector O/S Amt%age
Share
A Agriculture 254 0.7
B Housing 0 0.0
C Real Estate 44 0.1
D Industry 32730 93.5
E Others 1975 5.6
Total 35004 100.0
(Rs. Cr.)

Non-Performing Assets
Sl. Parameters Dec’14 Mar'15 Dec’15
1 NPA as at the beginning of Yr. 18880 18880 25695
2 Cash Recovery 2234 2925 3357
3 Up-gradation 830 1000 1630
4 Write Off 4754 5920 5076
5 Total Reduction (2+3+4) 7818 9845 10064
6 Fresh Addition 11149 16660 18707
-Fresh slippages 10327 15692 17655
-Debits in existing NPA A/cs 822 968 1052
7 Gross NPAs end period 22211 25695 34338
8 Eligible Deductions incl. Provisions 8424 10298 11355
9 Net NPAs 13788 15396 22983
10 Recovery in written-off debt A/Cs 682 1017 972
Particulars Dec'14 Mar'15 Dec'15
Gross NPA% 5.97% 6.55% 8.47%
Net NPA% 3.82% 4.06% 5.86%
NPA Coverage Ratio 57.27% 58.21% 53.85%
30
(Rs. Cr.)

Capital Adequacy (Basel III)
2.0%
4.0%
6.0%
8.0%
10.0%
12.0%
14.0%
Dec'14 Mar'15 Dec'15
CET
AT I
Tier II
31
11.54% 11.25%12.21%
Dec'14 Mar'15 Dec'15
Tier I 8.50% 9.30% 8.52%
CET 8.22% 8.74% 8.12%
AT I 0.30% 0.56% 0.40%
Tier II 3.04% 2.91% 2.73%
CRAR 11.54% 12.21% 11.25%
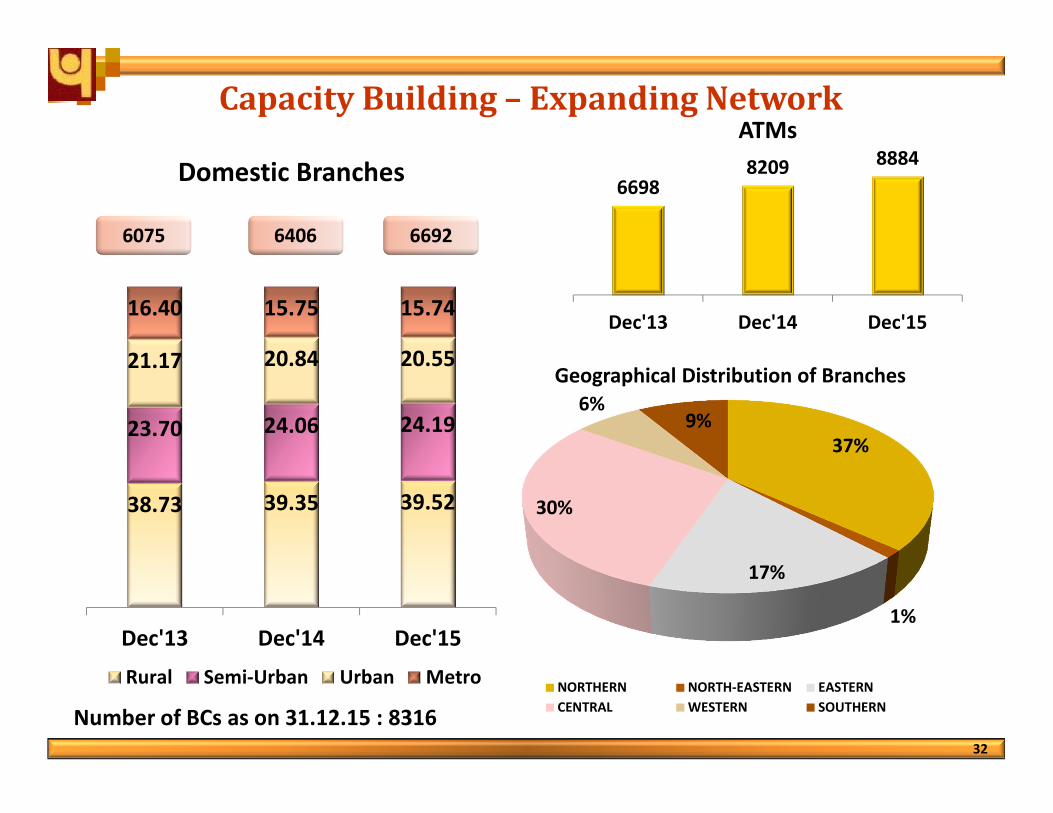
Capacity Building – Expanding Network
Number of BCs as on 31.12.15 : 8316
32
66988209 8884
Dec'13 Dec'14 Dec'15
ATMs
37%
1%
17%
30%
6%9%
Geographical Distribution of Branches
NORTHERN NORTH-EASTERN EASTERN
CENTRAL WESTERN SOUTHERN
38.73 39.35 39.52
23.70 24.06 24.19
21.17 20.84 20.55
16.40 15.75 15.74
Dec'13 Dec'14 Dec'15
Domestic Branches
Rural Semi-Urban Urban Metro
6075 66926406
Global Network
33
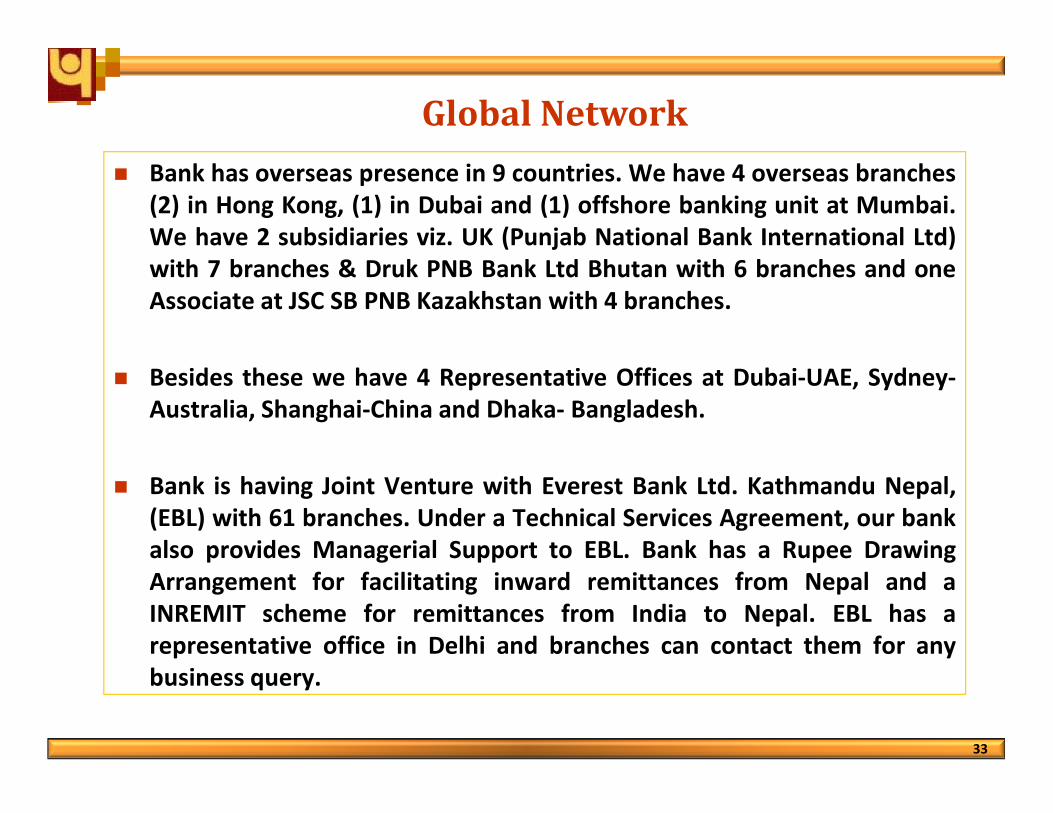
� Bank has overseas presence in 9 countries. We have 4 overseas branches
(2) in Hong Kong, (1) in Dubai and (1) offshore banking unit at Mumbai.
We have 2 subsidiaries viz. UK (Punjab National Bank International Ltd)
with 7 branches & Druk PNB Bank Ltd Bhutan with 6 branches and one
Associate at JSC SB PNB Kazakhstan with 4 branches.
� Besides these we have 4 Representative Offices at Dubai-UAE, Sydney-
Australia, Shanghai-China and Dhaka- Bangladesh.
� Bank is having Joint Venture with Everest Bank Ltd. Kathmandu Nepal,
(EBL) with 61 branches. Under a Technical Services Agreement, our bank
also provides Managerial Support to EBL. Bank has a Rupee Drawing
Arrangement for facilitating inward remittances from Nepal and a
INREMIT scheme for remittances from India to Nepal. EBL has a
representative office in Delhi and branches can contact them for any
business query.
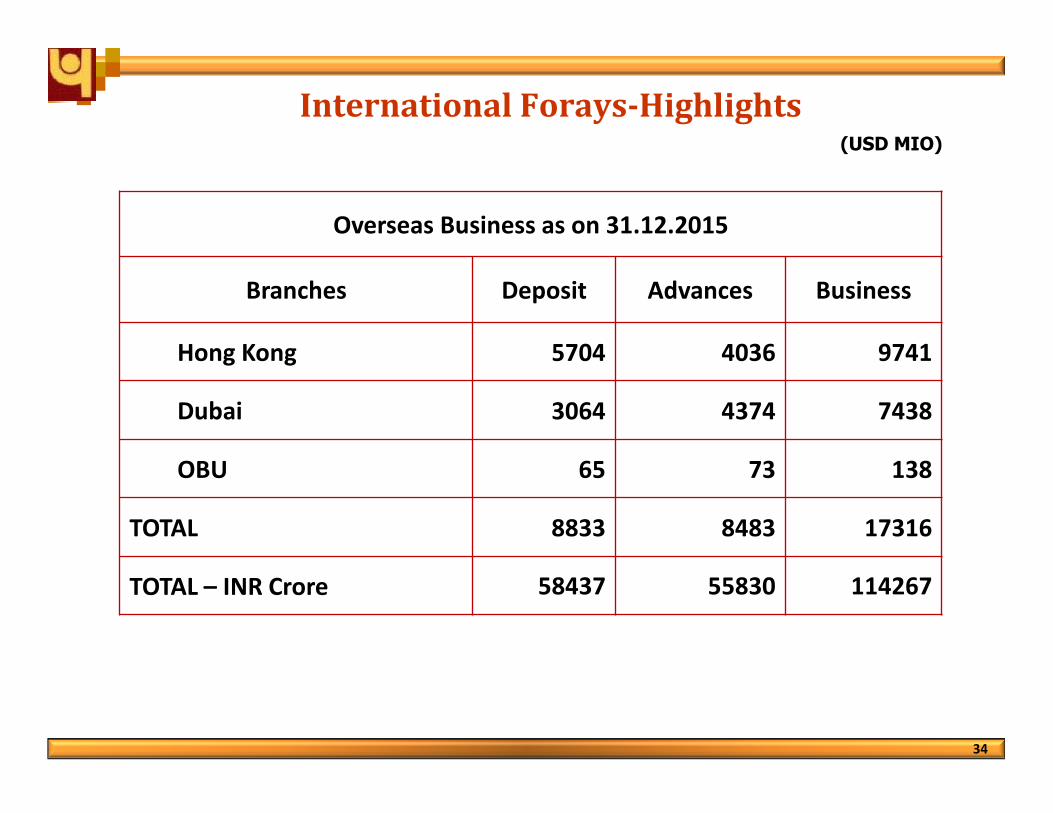
International Forays-Highlights(USD MIO)
34
Overseas Business as on 31.12.2015
Branches Deposit Advances Business
Hong Kong 5704 4036 9741
Dubai 3064 4374 7438
OBU 65 73 138
TOTAL 8833 8483 17316
TOTAL – INR Crore 58437 55830 114267

Shareholding Pattern (%) (31st Dec’15)
Govt., 62.1FIIs, 12.1
Insurance, 14.0
Non-Institutions,
5.7
MF & UTI, 6.1FIs/Banks, 0.1
35

3636
Financial Inclusion as a Business Driver
Sl Particulars (No. in Lakhs) Dec' 14 Dec' 15
1 Accounts opened under PMJDY 58 123
2 -Amt. mobilized under PMJDY (in cr.) 776.4 1324.2
3 -No. of Rupay Card Issued 40 100
4 - A/cs where OD facility is sanctioned under PMJDY nil 1.35
5 A/c s where General Credit cards issued 2.18 2.56
6 Credit provided in various credit based projects - KCC 22.6 23.6
7 Progress under Aadhaar Seeding in PMJDY A/Cs 19.85 57.26
Social Security Schemes- Enrolments
Pradhan Mantri Jivan Jyoti
Bima Yojana
12.47
Pradhan Mantri Suraksha
Bima Yojana
52.14
Atal Pension Yojna 1.49
Total 66.1
Transaction through BCs Dec‘14 Dec'15
No of BCs (Number) 5948 8316
No of Transactions (In Lakh) 23 186
Business mobilized (In cr.) 342 1293
Amount mobilized in BSBDA as on31.12.15 is Rs. 2828 cr.
(No. in Lakhs)

Digitalization Initiatives
37
� New ‘PNB Digital Village’ concept to align with Govt. initiative of Digitising India.
�Mobile App based Banking - ‘PNB Mobiease’ and ‘ATMAssist’, - for a complete SMS
Banking solution and ATM related queries, respectively.
�Online Opening of PPF, RD & Saving A/cs introduced in Internet Banking(IBS).
�Applying for OD in PMJDY A/Cs, Digital Certificate Authentication, E- Interest Certificate
introduced in IBS.
� New ‘Online Locker Booking’ facility throughout the country.
� ‘PIN @ last’ for enhance ATM security.
�Green PIN Model ‘ adopted for setting duplicate PIN for Debit Card.
�‘Bulk note acceptor cum ATM’ a highly efficient multifunction kiosk, launched .
�Tab Banking, PNB Wallet, innovative cards like Image card and other new digital
initiative in offing.
� Focus on expanding base of off-site and on-site e-lobbies with 24*7 services, provided
through 5 machines i.e. ATM, CDM, Cheque deposit machine, PUM and PC with IBS.
� As per Infosys, we are 1st Bank globally to implement Finacle Payment Enterprise
Payments for its domestic set up.
�PNB is the first in implementation of Sparc Super Cluster (M6-32) server in India (across
all sectors) to cater Bank’s requirement.
Striving for Digitalization of operations for better customer experience.Striving for Digitalization of operations for better customer experience.

Leveraging of Digital platform – (Transactions in lakh)
BANK’S PRESENCE IN SOCIAL MEDIA LIKE TWITTER, LINKIDEN ENSURED FOR BETTER CUSTOMER SERVICE.
50
116
Dec' 14 Dec' 15
MOBILE BANKING
307
0
351
8
Dec' 14 Dec' 15
ATM
38
348
Dec' 14 Dec' 15
ECOM
302
412
Dec' 14 Dec' 15
Debit Card Base
55.26
57.97
Dec' 14 Dec' 15
% of business through
Electronic Transactions
95
130
Dec' 14 Dec' 15
INTERNET BANKING

39
MOVING TOWARDS DIGITAL BANKING: Leveraging technology & multiplechannels of delivery to ensure excellent customer experience
IMPROVE ASSET QUALITY AND RISK MANAGEMENT: Thrust on Credit throughbetter due diligence and Post Sanction follow-up
IMPROVE CD RATIO: Moving through small ticket advances and better ratedcorporate accounts
IMPROVE CASA: Improving distribution reach through value added offerings
IMPROVE CUSTOMER SERVICES : Through marketing culture
PEOPLE DEVELOPMENT: Bridging resource gaps through skill development
INCREASE INCOME & CONTROL EXPENDITURE: Shedding high cost depositsand cost rationalization
Strategies Going Forward : PNB Indradhanush
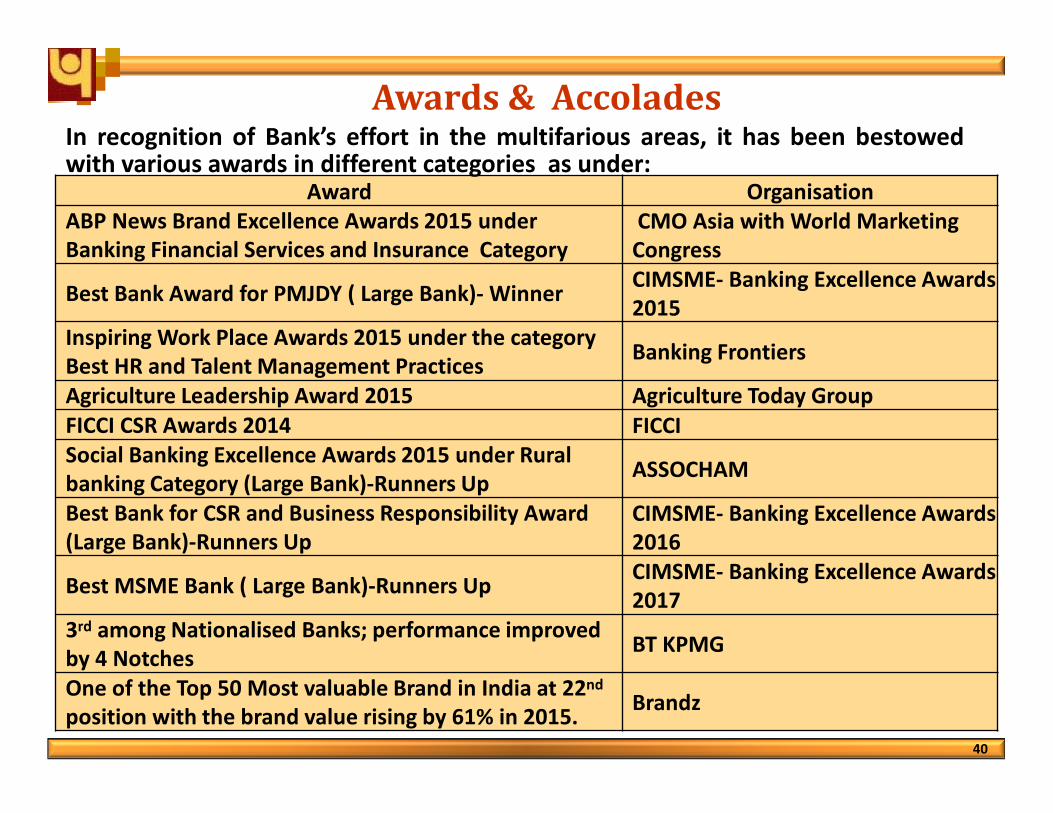
Awards & Accolades
40
Award Organisation
ABP News Brand Excellence Awards 2015 under
Banking Financial Services and Insurance Category
CMO Asia with World Marketing
Congress
Best Bank Award for PMJDY ( Large Bank)- WinnerCIMSME- Banking Excellence Awards
2015
Inspiring Work Place Awards 2015 under the category
Best HR and Talent Management Practices Banking Frontiers
Agriculture Leadership Award 2015 Agriculture Today Group
FICCI CSR Awards 2014 FICCI
Social Banking Excellence Awards 2015 under Rural
banking Category (Large Bank)-Runners UpASSOCHAM
Best Bank for CSR and Business Responsibility Award
(Large Bank)-Runners Up
CIMSME- Banking Excellence Awards
2016
Best MSME Bank ( Large Bank)-Runners UpCIMSME- Banking Excellence Awards
2017
3rd among Nationalised Banks; performance improved
by 4 Notches BT KPMG
One of the Top 50 Most valuable Brand in India at 22nd
position with the brand value rising by 61% in 2015.Brandz
In recognition of Bank’s effort in the multifarious areas, it has been bestowedwith various awards in different categories as under:

41