presentation on results for the 1st quarter fy2019 · fy 2018(e): estimate of the total of idemitsu...
TRANSCRIPT
Presentation on Resultsfor the 1st Quarter FY2019
Idemitsu Kosan Co.,Ltd.August 14, 2019
Copyright©2019 Idemitsu Kosan Co.,Ltd. All Rights Reserved.
Table of Contents1. FY 2019 1st Quarter Results
(1) Overview(2) Segment Information
2. Reference Materials
1

1. FY 2019 1st Quarter Results
・FY 2018(E): Estimate of the total of Idemitsu Kosan and Showa Shell Sekiyu on a 100% consolidated basis
・Segment information: Total of operating income and equityearnings of affiliates (Equity Income)

Copyright©2019 Idemitsu Kosan Co.,Ltd. All Rights Reserved. 3
Crude Oil Price Trends<Monthly Dubai Crude Oil Price Trends and Assumptions for Performance Forecasts>
(USD/Bbl.)
FY 2018 ActualFY 2019 Actual5/15 Assumption
FY 2018 1Q Average: US$72.1/Bbl.
Assumption Announced on 5/15: US$70.0/Bbl.
FY 2019 1Q Average: US$67.4/Bbl.
Apr May Jun Jul Aug Sep Oct Nov Dec Jan Feb Mar

Copyright©2019 Idemitsu Kosan Co.,Ltd. All Rights Reserved. 4Apr May Jun Jul Aug Sep Oct Nov Dec Jan Feb Mar
JPY/USD Exchange Rate (TTM) Trends<Monthly JPY/USD (TTM) Trends and Assumptions for Performance Forecasts>
(JPY/USD)
FY 2019 1Q Average: 109.9 JPY/USD
FY 2018 1Q Average: 109.1 JPY/USD
FY 2018 ActualFY 2019 Actual5/15 Assumption
Assumption Announced on 5/15:
110.0 JPY/USD

Copyright©2019 Idemitsu Kosan Co.,Ltd. All Rights Reserved.
Overview<FY 2019 1st Quarter Results>■Operating income excluding inventory impact + equity income
decreased by ¥48.7 billion year-on-year to ¥31.1 billion, mainly due to decreased earnings from the petroleum segment as a result of reduced refining margins impacted by declined crude prices as well as from the basic chemicals segment
■Ordinary income decreased by ¥83.1 billion year-on-year, to ¥34.6 billion. Gain from step acquisition was recorded on integration with Showa Shell Sekiyu, and as a result, net income attributable to owners of the parent decreased by ¥35.7 billion year-on-year, to ¥36.0 billion
<FY 2019 Performance Forecasts>■Performance forecasts announced on May 15 remain unchanged
5

Copyright©2019 Idemitsu Kosan Co.,Ltd. All Rights Reserved.
FY 2018 1Q FY 2019 1Q
72.1 67.4 (4.7) (6.6%)66.8 63.2 (3.6) (5.3%)619 566 (53) (8.5%)
102.6 95.8 (6.8) (6.6%)109.1 109.9 0.8 0.8%
* Brent prices and Thermal coal prices are averages based on the calendar year (January-March).
Change
FY 2018 1Q(E) FY 2019 1Q1,664.3 1,476.3 (187.9) (11.3%)
116.3 32.7 (83.6) (71.9%)
36.6 1.7 (34.9) (95.4%)79.7 31.1 (48.7) (61.0%)
117.7 34.6 (83.1) (70.6%)(2.8) 17.9 20.7 -
71.7 36.0 (35.7) (49.8%)46.3 34.8 (11.5) (24.8%)
Change
(1) Overview1) Crude Oil / Exchange Rates
2) Consolidated Income Statement (Summary)
(Units: $/Bbl., $/Ton, ¥/$)
(Units: ¥ billions)
Crude Oil (Dubai)Crude Oil (Brent)Naphtha Price (Customs)
Exchange Rate (TTM)Thermal Coal (NEWC)
* Gross average method of inventory valuation* “Inventory impact” represents the impact of inventory valuation and the reduction in book value of inventory assets* Figures rounded to the nearest billion yen
Ordinary IncomeExtraordinary Gain/Loss
Net Sales
Operating Income + Equity Income
(Inventory impact)
(Excluding inventory impact)
Net Income Attributable to Owners of the Parent
(Excluding inventory impact)
6

Copyright©2019 Idemitsu Kosan Co.,Ltd. All Rights Reserved.
(2) Segment Information
7
1) Operating Income + Equity Income(Units: ¥ billions)
FY2019 1Q
Petroleum 73.0 5.2 (67.8) (92.9%)36.4 3.5 (32.9) (90.3%)
Basic Chemicals 16.0 5.9 (10.1) (63.3%)Functional Materials 9.2 6.4 (2.7) (29.8%)Power andRenewable Energy 0.4 0.8 0.4 88.4%
Resources 19.8 16.2 (3.7) (18.5%)Oil Exploration and Production 9.0 6.7 (2.3) (25.3%)Coal 10.9 9.5 (1.4) (13.0%)
Others/Reconciliation (2.2) (1.8) 0.4 -
Total 116.3 32.7 (83.6) (71.9%)79.7 31.1 (48.7) (61.0%)
* Fiscal years for Australian coal operations and Oil Exploration and Production included in the Resources Business end in December
ChangeFY 2018 1Q(E)
(Excluding inventory impact)
(Excluding inventory impact)

Copyright©2019 Idemitsu Kosan Co.,Ltd. All Rights Reserved.
(2) Segment Information
8
2) Analysis of Factors Affecting Operating Income + Equity Income (Excluding inventory impact, year-on-year) (Units: ¥ billions)
FY2018 1Q (E)
FY20191Q
Petroleum Basic Chemicals CoalPower and Renewable Energy
Oil Explorationand Production
Functional Materials Others
Synergies, Equity
Income, etc.
Product Margins Sales
Volume, etc.
Margins, Sales
Volume Price
Sales Volume,
etc.
Price, Sales
Volume
Exploration Costs, FX, etc.
Performance Chemicals,
etc.
ES Business

Reference Materials

Copyright©2019 Idemitsu Kosan Co.,Ltd. All Rights Reserved. 10
1. Overview of the New Integrated Company
2. Financial Reporting(1) FY 2019 Performance
Forecasts Announced on May 15
(2) FY 2019 1st Quarter Results
3. Sensitivity
4. Sales and Production(1) Sales/Production
Volume
5. Market Conditions
6. Refineries Utilization
7. Number of Service Stations
Table of Contents
Copyright©2019 Idemitsu Kosan Co.,Ltd. All Rights Reserved.
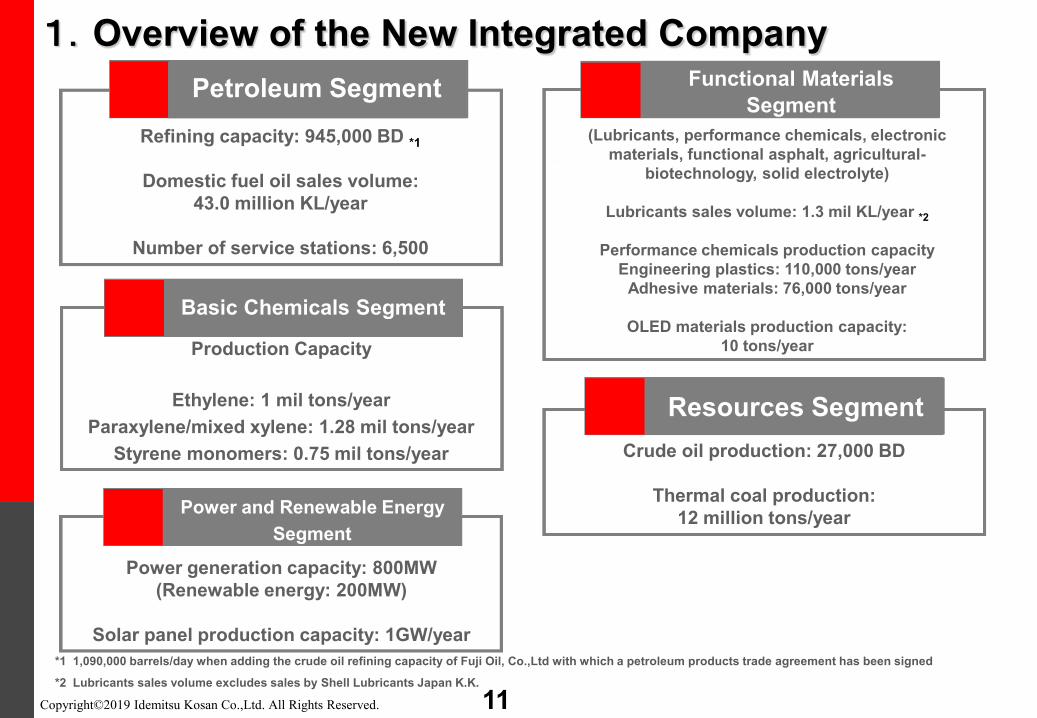
1.Overview of the New Integrated Company
11*1 1,090,000 barrels/day when adding the crude oil refining capacity of Fuji Oil, Co.,Ltd with which a petroleum products trade agreement has been signed
*2 Lubricants sales volume excludes sales by Shell Lubricants Japan K.K.
※1
※2
Resources Segment
Functional Materials SegmentPetroleum Segment
Basic Chemicals Segment
Power and Renewable Energy Segment
Crude oil production: 27,000 BD
Thermal coal production:12 million tons/year
Production Capacity
Ethylene: 1 mil tons/yearParaxylene/mixed xylene: 1.28 mil tons/year
Styrene monomers: 0.75 mil tons/year
Refining capacity: 945,000 BD *1
Domestic fuel oil sales volume: 43.0 million KL/year
Number of service stations: 6,500
Power generation capacity: 800MW(Renewable energy: 200MW)
Solar panel production capacity: 1GW/year
(Lubricants, performance chemicals, electronic materials, functional asphalt, agricultural-
biotechnology, solid electrolyte)
Lubricants sales volume: 1.3 mil KL/year *2
Performance chemicals production capacityEngineering plastics: 110,000 tons/year
Adhesive materials: 76,000 tons/year
OLED materials production capacity: 10 tons/year

Copyright©2019 Idemitsu Kosan Co.,Ltd. All Rights Reserved. 12
69.3 70.0 0.7 1.0%71.0 72.0 1.0 1.4%621 650 29 4.7%
107.1 93.0 (14.1) (13.1%)110.8 110.0 (0.8) (0.7%)
* Brent prices and Thermal coal prices are averages based on the calendar year (January-December).
Net Sales 6,866.6 6,790.0 (76.6) (1.1%)
Operating Income+ Equity Income
229.1 220.0 (9.1) (4.0%)
10.8 0.0 (10.8) (100.0%)218.3 220.0 1.7 0.8%
Ordinary Income 236.5 228.5 (8.0) (3.4%)Extraordinary Gain/Loss (55.7) 10.0 65.7 -
Net Income Attributable to Owners of the Parent
94.5 160.0 65.5 69.3%
87.0 160.0 73.0 83.9%
2.Financial Reporting
1) Crude Oil / Exchange Rates
2) Consolidated Income Statement (Summary)
(Units: $/Bbl., $/Ton, ¥/$)
(Units: ¥ billions)
Crude Oil (Dubai)Crude Oil (Brent)Naphtha Price (Customs)
Exchange Rate (TTM)Thermal Coal (NEWC)
FY2018(E) FY2019 Forecast Change
FY2018(E) FY2019 Forecast Change
(Inventory impact)
(Excluding inventory impact)
(Excluding inventory impact)
* Gross average method of inventory valuation* “Inventory impact” represents the impact of inventory valuation and the reduction in book value of inventory assets* Figures rounded to the nearest billion yen
(1) FY 2019 Performance Forecasts Announced on May 15

Copyright©2019 Idemitsu Kosan Co.,Ltd. All Rights Reserved.
3) Segment Information (Operating Income + Equity Income)
13
Petroleum 79.8 78.0 (1.8) (2.3%)
69.0 78.0 9.0 13.0%
Basic Chemicals 50.4 45.5 (4.9) (9.8%)
Functional Materials 33.2 39.0 5.8 17.4%Power andRenewable Energy (7.5) 2.0 9.5 -
Resources 88.5 61.0 (27.5) (31.1%)
37.1 21.0 (16.1) (43.4%)
51.5 40.0 (11.5) (22.3%)Others/Reconciliation (15.4) (5.5) 9.9 -
229.1 220.0 (9.1) (4.0%)218.3 220.0 1.7 0.8%
(Units: ¥ billions)
(Excluding inventory impact)
Oil Exploration and Production
Coal
(Excluding inventory impact)Total
FY2018(E) FY2019 Forecast Change
* Fiscal years for Australian coal operations and Oil Exploration and Production included in the Resources Business end in December
2.Financial Reporting(1) FY 2019 Performance Forecasts Announced on May 15

Copyright©2019 Idemitsu Kosan Co.,Ltd. All Rights Reserved.
(2) FY 2019 1st Quarter Results
14
1) Net Sales by Segment
1,299.9 1,169.5 (130.3) (10.0%)154.1 113.5 (40.6) (26.4%)106.9 97.1 (9.8) (9.2%)
34.6 29.3 (5.3) (15.4%)
68.1 66.4 (1.7) (2.6%)
20.3 15.3 (5.0) (24.6%)
47.8 51.1 3.2 6.8%
0.6 0.5 (0.1) (19.3%)1,664.3 1,476.3 (187.9) (11.3%)
Change
PetroleumBasic ChemicalsFunctional MaterialsPower andRenewable Energy
Resources
Others/Reconciliation
(Oil Exploration and Production)(Coal)
Total
FY 2018 1Q (E) FY 2019 1Q
(Units: ¥ billions)
2.Financial Reporting

Copyright©2019 Idemitsu Kosan Co.,Ltd. All Rights Reserved. 15
2) Extraordinary Gains/Losses
Change
Gain on Sales of Fixed Assets 0.2 1.9 1.7Gain on Sales of affiliate Stock 0.2 0.0 (0.2)Gain on Transfer of business 2.3 0.0 (2.3)Other 6.4 18.6 12.2Total Extraordinary Gains 9.1 20.5 11.4Loss on Sale and Depletionof Fixed Assets
0.6 1.6 1.1
Impairment Losses 10.4 0.0 (10.4)Other 0.9 1.0 0.1Total Extraordinary Losses 11.9 2.6 (9.3)
(2.8) 17.9 20.7Total Extraordinary Gains/Losses
(2) FY 2019 1st Quarter Results
(Units: ¥ billions)
FY 2018 1Q (E) FY 2019 1Q
2.Financial Reporting

Copyright©2019 Idemitsu Kosan Co.,Ltd. All Rights Reserved.
③連結貸借対照表
16
参考:統合に伴うのれん等償却対象資産 3,150億円
4/1/2019 6/30/2019 Change
141.7 117.8 (23.9) 1,781.2 1,700.0 (81.2)
1,677.8 1,593.8 (84.0) 1,060.4 1,054.2 (6.2)
1,819.5 1,711.6 (107.9) 2,841.6 2,754.2 (87.4)
1,410.4 1,440.7 30.3 1,255.6 1,264.6 9.0
920.5 918.8 (1.7) 53.2 52.3 (0.9)
2,330.9 2,359.6 28.7 1,308.8 1,317.0 8.2
4,150.4 4,071.2 (79.2) 4,150.4 4,071.2 (79.2)
0.75 0.84 0.1
1,077.1 1,185.3 108.2
30.3% 31.1% 0.8%Equity Ratio (%)
Noncontrolling Interests
Total CurrentLiabilitiesTotal FixedLiabilities
Total Liabilities
4/1/2019 6/30/2019 Change
Cash and Deposits
Receivables,Inventory, etc.Total CurrentAssets
Fixed Assets
Other Fixed Assets
Total Fixed Assets
Total Assets
(Units: ¥ billions)
Shareholders’ Equity/ Other Comprehensive Income
Total Net Assets
Total Liabilities and Net Assets
Net D/E Ratio (X)
Net Interest-bearing Debt
(2) FY 2019 1st Quarter Results3) Extraordinary Gains/Losses
16
2.Financial Reporting
※Assets to be amortized associated with integration:¥315.0 billion

Copyright©2019 Idemitsu Kosan Co.,Ltd. All Rights Reserved. 17
3. Sensitivity(1) Impact of a US$1/bbl. Increase in Crude Oil Prices on FY Earnings
(2) Impact of a 1 JPY/USD Appreciation on FY Earnings
* In addition to the above, the resources and other businesses are impacted by fluctuations in exchange rates with other currencies (NOK, AUD, etc.)
Increase in refineryfuel costs, etc. (¥1.0billion)
Inventory impact ¥5.0 billion¥4.0 billion
Oil Exploration & Production ¥1.0 billion
Petroleum
Decrease in refineryfuel costs, etc. ¥0.5 billion
Inventory impact (¥3.0 billion) (¥2.5 billion)
Basic Chemicals (¥0.5 billion)Oil Exploration & Production -
Petroleum
Copyright©2019 Idemitsu Kosan Co.,Ltd. All Rights Reserved.
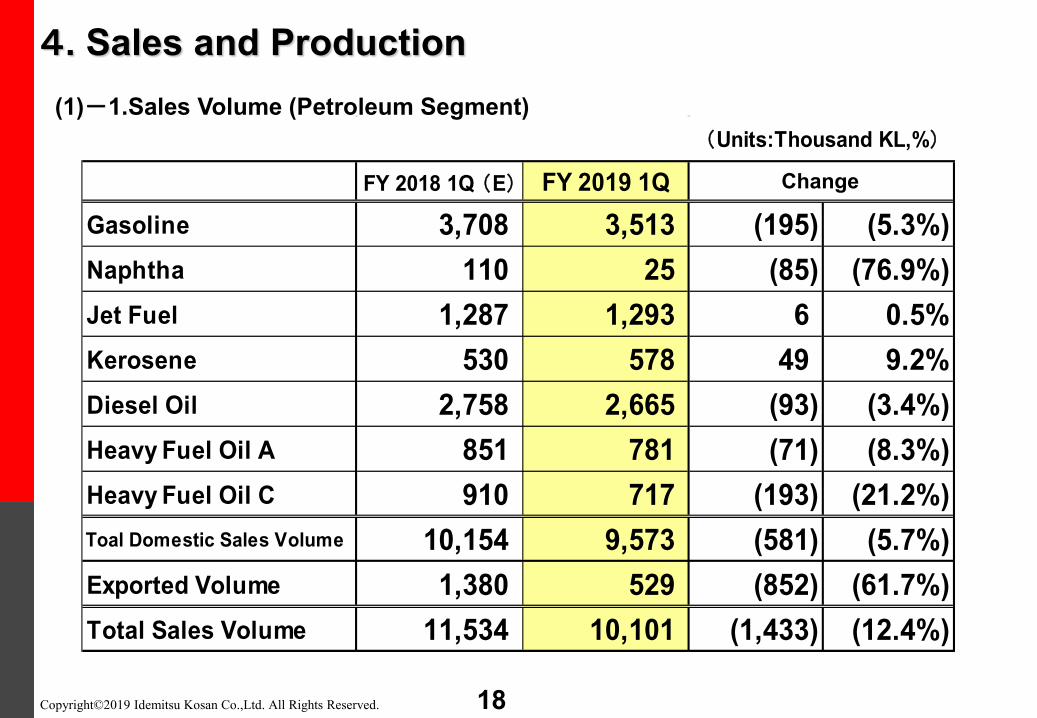
(Units:Thousand KL,%)
FY 2018 1Q (E) FY 2019 1QGasoline 3,708 3,513 (195) (5.3%)Naphtha 110 25 (85) (76.9%)Jet Fuel 1,287 1,293 6 0.5%Kerosene 530 578 49 9.2%Diesel Oil 2,758 2,665 (93) (3.4%)Heavy Fuel Oil A 851 781 (71) (8.3%)Heavy Fuel Oil C 910 717 (193) (21.2%)Toal Domestic Sales Volume 10,154 9,573 (581) (5.7%)Exported Volume 1,380 529 (852) (61.7%)Total Sales Volume 11,534 10,101 (1,433) (12.4%)
Difference
(1)-1.Sales Volume (Petroleum Segment)
18
4. Sales and Production
Change

Copyright©2019 Idemitsu Kosan Co.,Ltd. All Rights Reserved.
(Units:Million kWh, %)
FY 2018 1Q(E) FY 2019 1QRetail Power Sales 490 593 103 21.0%
Difference
(Units:Thousand KL,Thousand tons,%)
FY 2018 1Q FY 2019 1QLubricants 312 301 (11) (3.5%)Performance Chemicals 114 103 (11) (9.6%)*Includes sales of overseas licenses
*Lubricant oil sales volume excludes sales by Shell Lubricants Japan K.K.
Difference
(Units:Thousand tons, %)
FY 2018 1Q(E) FY 2019 1QBasic Chemicals 1,116 1,047 (69) (6.2%)
Difference
(1)-2.Sales Volume (Basic Chemicals Segment)
19
4. Sales and Production
(1)-3.Sales Volume (Functional Materials Segment)
(1)-4.Sales Volume (Power and Renewable Energy Segment)
Change
Change
Change

Copyright©2019 Idemitsu Kosan Co.,Ltd. All Rights Reserved.
(Units:Thousand tons)
FY 2018 1Q FY 2019 1QEnsham 959 1,008 49 5.1%Muswellbrook 388 338 (50) (12.8%)Boggabri 1,151 1,194 43 3.8%Tarawonga 163 0 (163) (100.0%)
Sub Total 2,661 2,540 (120) (4.5%)Malinau 321 328 6 2.0%Total Production Volume 2,982 2,868 (114) (3.8%)*Figures based on interst owned by Idemitsu Group*Fiscal years for Oil Exploration and Production and Coal operations end in December
Difference
(Units:Thousand BOED)
FY 2018 1Q FY 2019 1QNorway 28.8 24.0 (4.8) (16.7%)
Total('000BOE) 2,589 2,156 (433) (16.7%)*Figures based on interest owned by Idemitsu's resource development subsidiaries
Difference
20
4. Sales and Production(1)-5.Oil E&P – Production Volume ,including Gas (Resources Segment)
(1)-6. Coal – Production Volume (Resources Segment)
Change
Change
Copyright©2019 Idemitsu Kosan Co.,Ltd. All Rights Reserved.
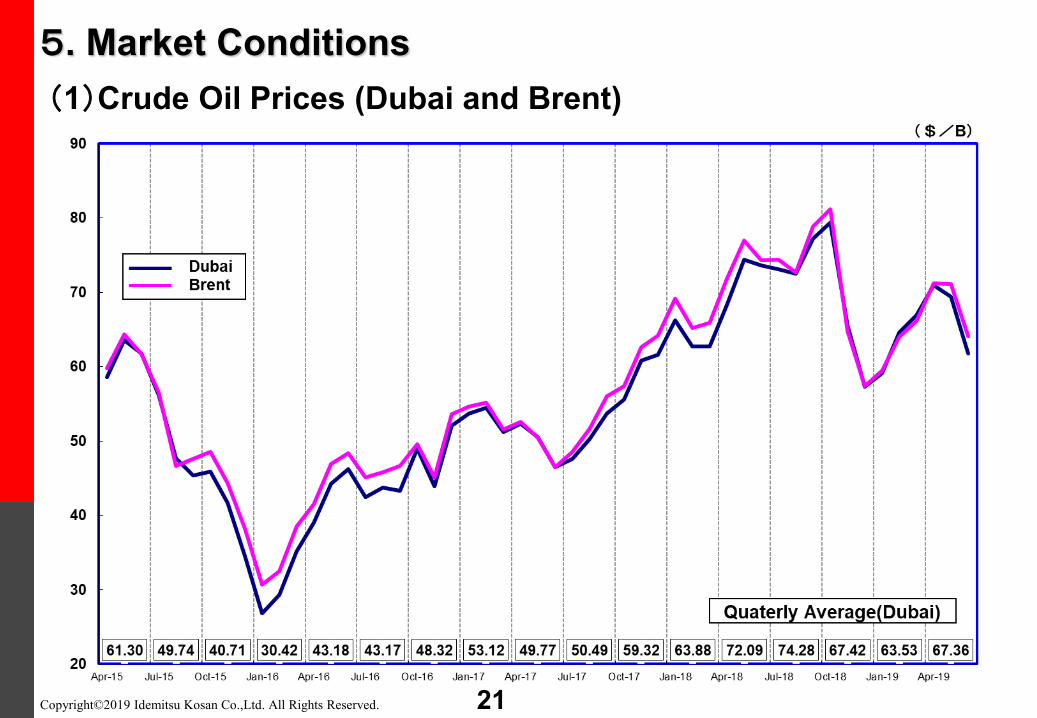
5. Market Conditions(1)Crude Oil Prices (Dubai and Brent)
21

Copyright©2019 Idemitsu Kosan Co.,Ltd. All Rights Reserved.
(2)Gasoline, Crude Oil CIF (Prices and Spreads)5. Market Conditions
22

Copyright©2019 Idemitsu Kosan Co.,Ltd. All Rights Reserved.
5. Market Conditions
23
(3)Diesel Oil – Crude Oil CIF (Prices and Spreads)

Copyright©2019 Idemitsu Kosan Co.,Ltd. All Rights Reserved.
5. Market Conditions
24
(4)Paraxylene, Mixed xylene, Naptha (Prices and Spreads)

Copyright©2019 Idemitsu Kosan Co.,Ltd. All Rights Reserved.
5. Market Conditions
25
(5)Styrene Monomer, Naptha (Prices and Spreads)

Copyright©2019 Idemitsu Kosan Co.,Ltd. All Rights Reserved.
6.Refineries Utilization
26
7.Number of Service Stations
FY2015 FY2016 FY2017 FY2018 FY2019 1Q
Idemitsu 86% 88% 88% 88%80%
Showa Shell 91% 85% 88% 93%
FY2015 FY2016 FY2017 FY2018 FY2019 1Q
Idemitsu 3,666 3,589 3,545 3,501 3,476
Showa Shell 3,193 3,123 3,028 2,964 2,943
Total 6,859 6,712 6,573 6,465 6,419
Capacity Utilization(%) BCD
(Locations)

Copyright©2019 Idemitsu Kosan Co.,Ltd. All Rights Reserved.
Precaution statement about forecasts
27
Any information about forecasts for the Company’s operating results,management strategy and management policy contained in this documentsother than historical facts is prepared, according to judgments made by thetop management of the Company based on information available as of thepublication of the document.
Actual business environments contain potential risk factors anduncertainties including economic situations, crude oil prices, trends inpetroleum products, market conditions, currency exchange rates andinterest rates.
Consequently, actual operating results of the Company may substantiallydiffer from forecasts due to changes in the important factors mentionedabove.