présentation powerpoint - engie.com · &oceania. strategy & transformation plan sectoral...
TRANSCRIPT
July 2017
2
SUMMARY
3 AT A GLANCE
4 ENGIE today
5 Low CO2 power generation
6 Leader in global infrastructure
7 Integrated customer solutions
8 ENGIE around the world
9 STRATEGY & TRANSFORMATION PLAN
10-13 Sectoral context
14 Strategy
15-18 Transformation plan
19 CSR Objectives
25 ENGIE AND YOU*
26-27 ENGIE stock
28 Bonus dividend
29 Actionaria 2017
30 Useful information
31 Agenda
20 2017 FINANCIAL HALF-YEAR RESULTS*21 Ahead of schedule on the transformation plan
22 Key figures
23 Understand 2017 half-year results
24 2017-2018 financial objectives
Navigation through this document is facilitated by an interactive summary that takes you directly to the pages you want and allows
you to return to the summary at any time, using the arrow in the bottom right-hand corner of each page. Clickable links also
provide more details about some subjects.
* Updated to 28 july 2017
AT A GLANCE
ENGIE today
Low Co2 power generation
Leader in global infrastructure
Integrated customer solutions
ENGIE around the world
3
4
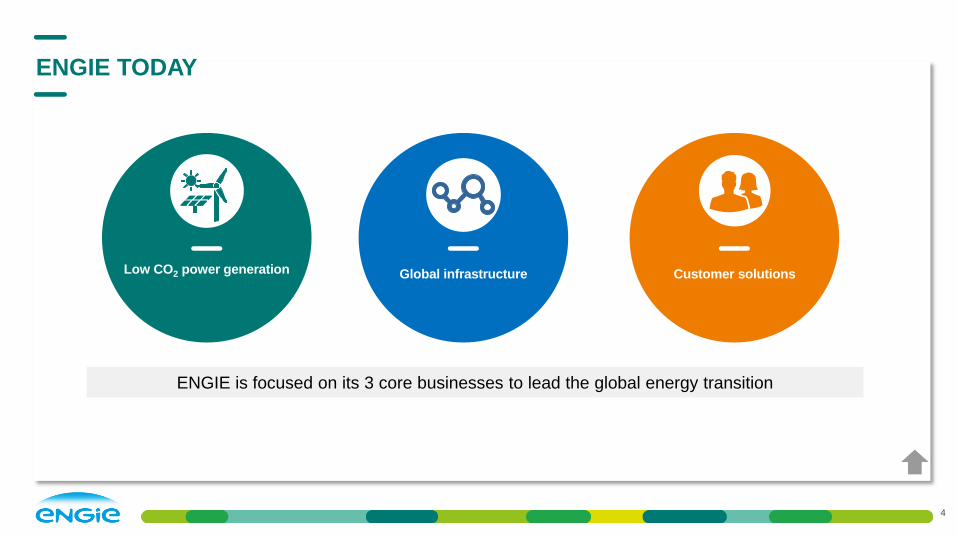
ENGIE TODAY
Customer solutions Low CO2 power generation Global infrastructure
ENGIE is focused on its 3 core businesses to lead the global energy transition
5
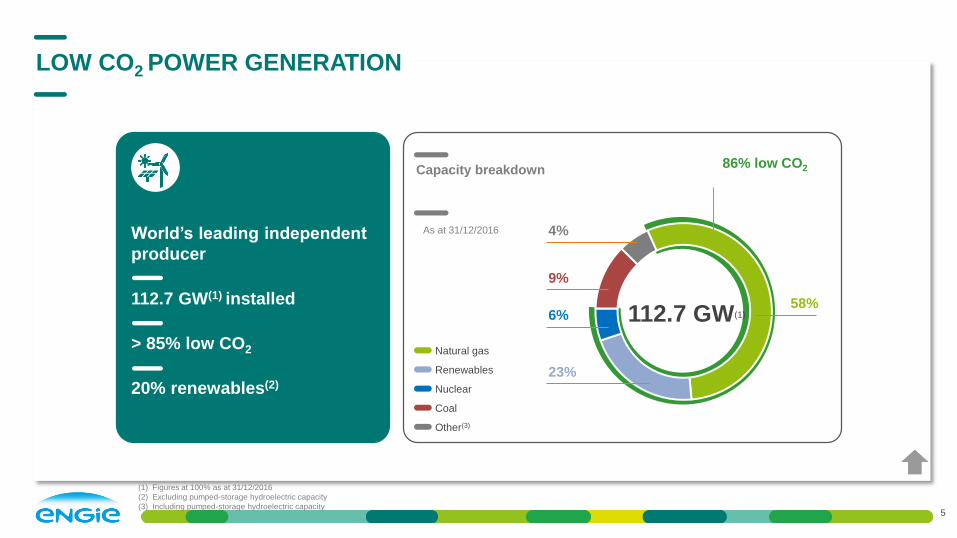
LOW CO2 POWER GENERATION
Natural gas
Renewables
Nuclear
Coal
Other(3)
4%
9%
6%
23%
58%
86% low CO2
112.7 GW(1)
World’s leading independent
producer
112.7 GW(1) installed
> 85% low CO2
20% renewables(2)
(1) Figures at 100% as at 31/12/2016
(2) Excluding pumped-storage hydroelectric capacity
(3) Including pumped-storage hydroelectric capacity
Capacity breakdown
As at 31/12/2016
6
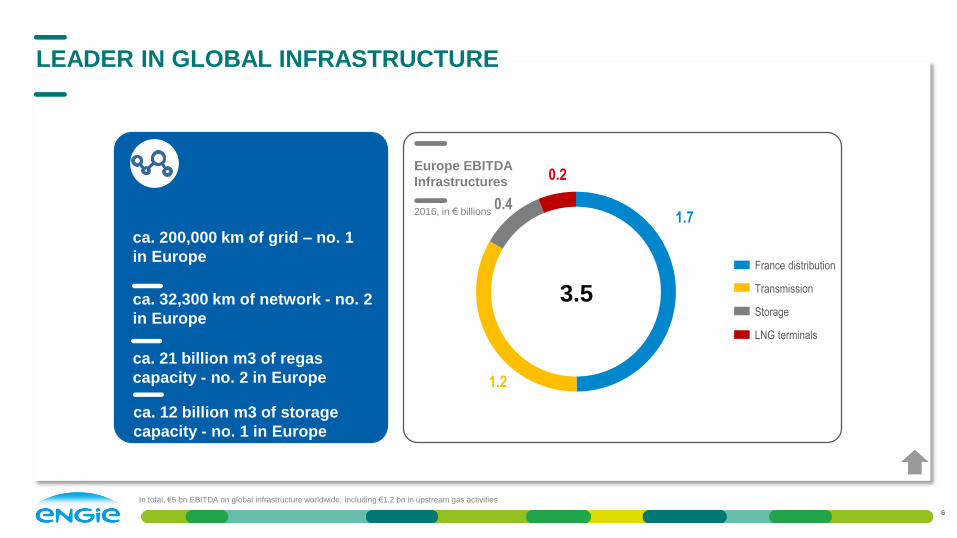
LEADER IN GLOBAL INFRASTRUCTURE
France distribution
Transmission
Storage
LNG terminals
3.5
0.2
1.7
1.2
0.4
Europe EBITDA
Infrastructures
2016, in € billions
ca. 32,300 km of network - no. 2
in Europe
ca. 21 billion m3 of regas
capacity - no. 2 in Europe
ca. 12 billion m3 of storage
capacity - no. 1 in Europe
ca. 200,000 km of grid – no. 1
in Europe
In total, €5 bn EBITDA on global infrastructure worldwide, including €1.2 bn in upstream gas activities
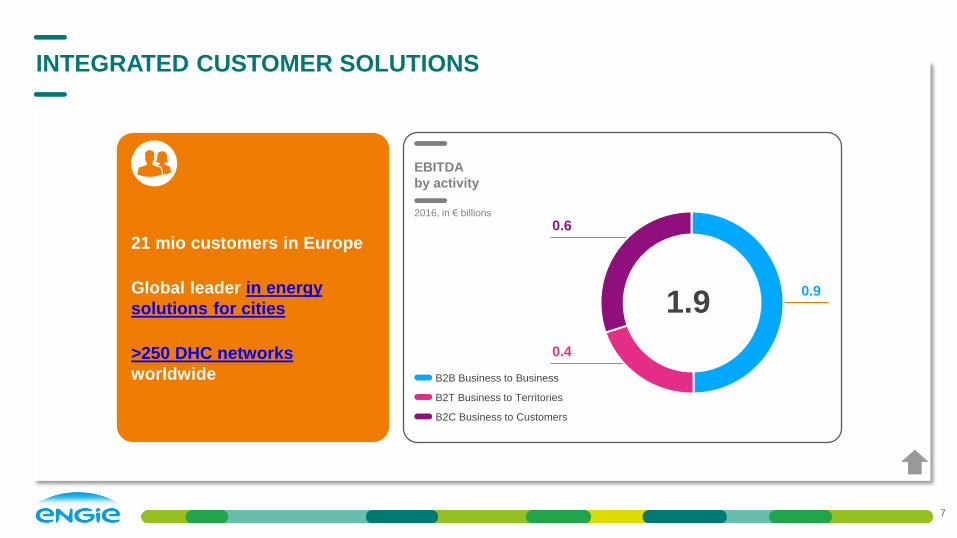
21 mio customers in Europe
Global leader in energy
solutions for cities
>250 DHC networks
worldwide
7
INTEGRATED CUSTOMER SOLUTIONS
EBITDA
by activity
2016, in € billions
0.6
0.4
0.9
1.9
B2B Business to Business
B2T Business to Territories
B2C Business to Customers
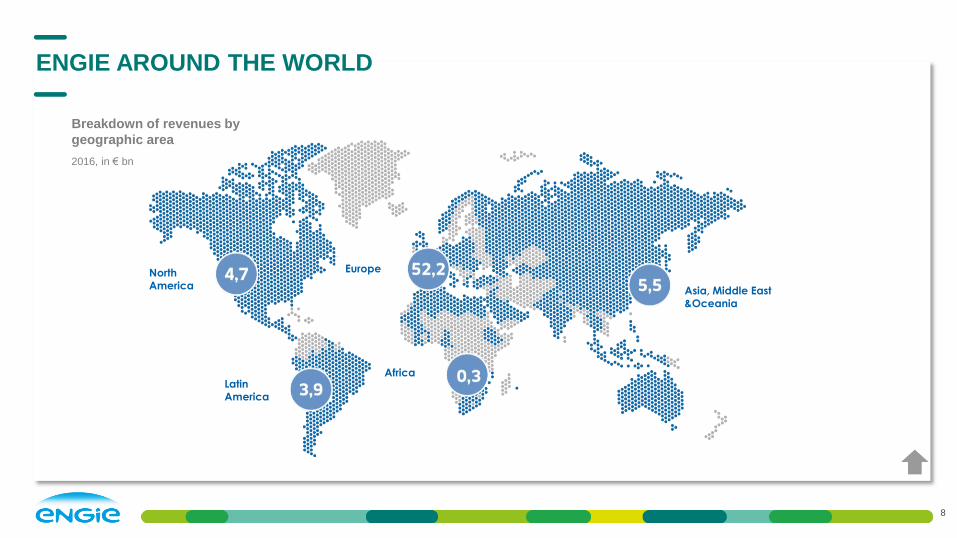
Breakdown of revenues by
geographic area
8
ENGIE AROUND THE WORLD
2016, in € bn
North America
Latin America
Europe
Africa
Asia, Middle East &Oceania
STRATEGY &
TRANSFORMATION
PLAN
Sectoral context
Strategy
Transformation plan
9
Pave the way for the future
CSR objectives
10
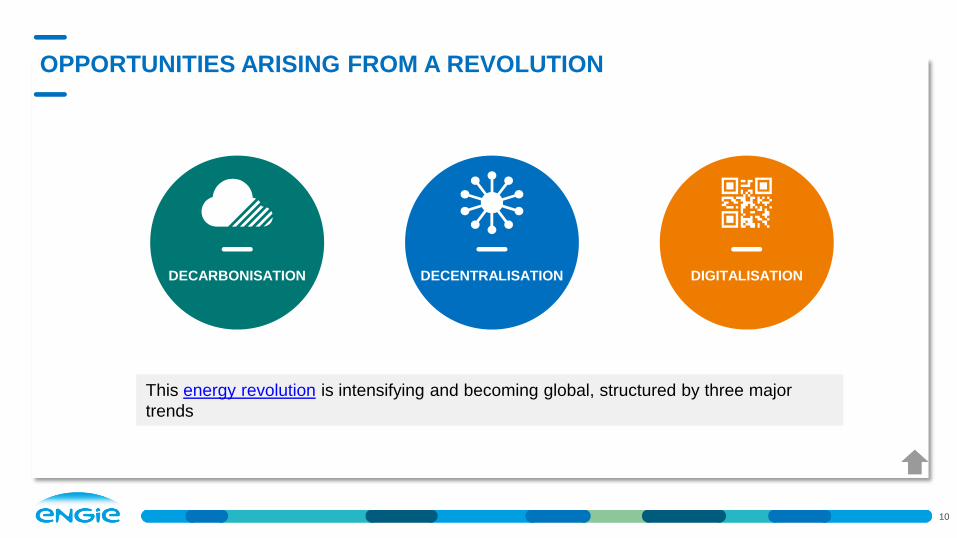
OPPORTUNITIES ARISING FROM A REVOLUTION
DECARBONISATION DECENTRALISATION DIGITALISATION
This energy revolution is intensifying and becoming global, structured by three major
trends
10,000
8,000
6,000
4,000
2,000
0
16%
12%
8%
4%
0%
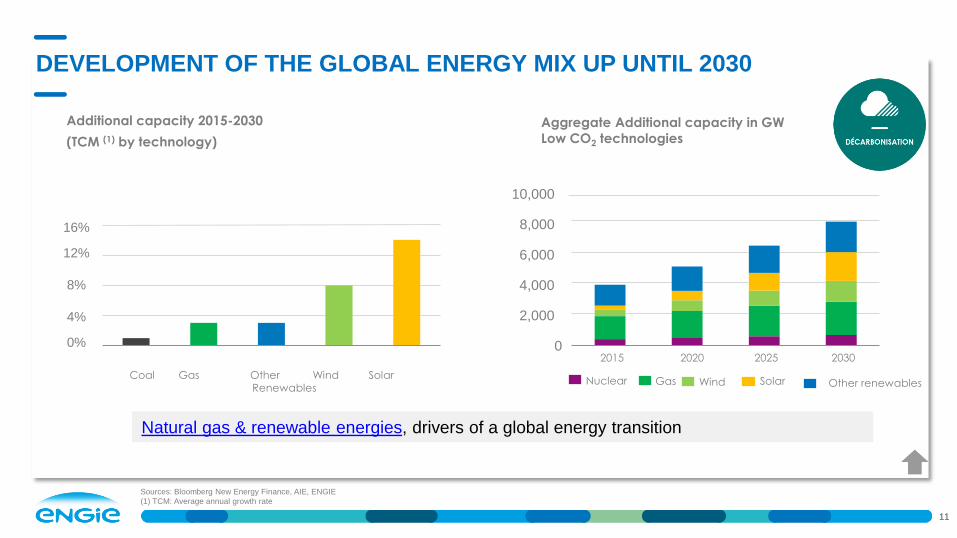
Aggregate Additional capacity in GW
Low CO2 technologies
Coal Gas Other Wind SolarRenewables
Nuclear Gas Wind Solar Other renewables
2015 2020 2025 2030
Sources: Bloomberg New Energy Finance, AIE, ENGIE
(1) TCM: Average annual growth rate
11
DEVELOPMENT OF THE GLOBAL ENERGY MIX UP UNTIL 2030
Natural gas & renewable energies, drivers of a global energy transition
Additional capacity 2015-2030
(TCM (1) by technology)
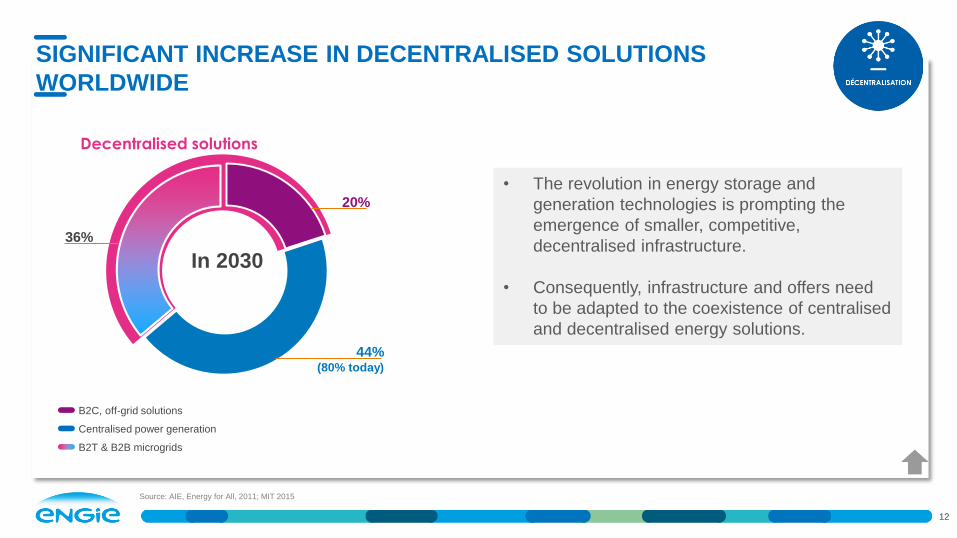
44%(80% today)
36%
20%
Decentralised solutions
In 2030
12
SIGNIFICANT INCREASE IN DECENTRALISED SOLUTIONS
WORLDWIDE
Source: AIE, Energy for All, 2011; MIT 2015
B2C, off-grid solutions
Centralised power generation
B2T & B2B microgrids
• The revolution in energy storage and
generation technologies is prompting the
emergence of smaller, competitive,
decentralised infrastructure.
• Consequently, infrastructure and offers need
to be adapted to the coexistence of centralised
and decentralised energy solutions.
13
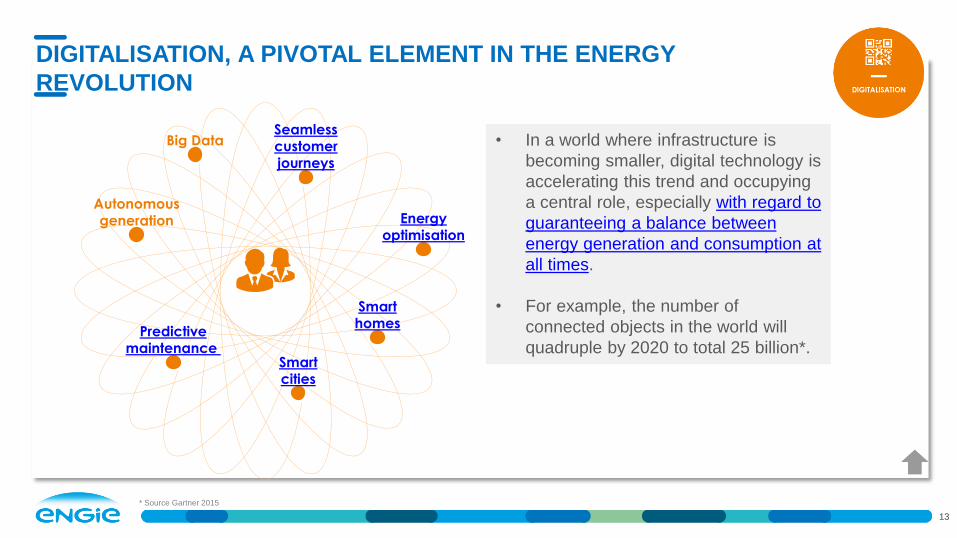
DIGITALISATION, A PIVOTAL ELEMENT IN THE ENERGY
REVOLUTION
• In a world where infrastructure is
becoming smaller, digital technology is
accelerating this trend and occupying
a central role, especially with regard to
guaranteeing a balance between
energy generation and consumption at
all times.
• For example, the number of
connected objects in the world will
quadruple by 2020 to total 25 billion*.
Big Data
Autonomousgeneration
Predictivemaintenance
Energyoptimisation
Smarthomes
Smartcities
Seamlesscustomerjourneys
* Source Gartner 2015
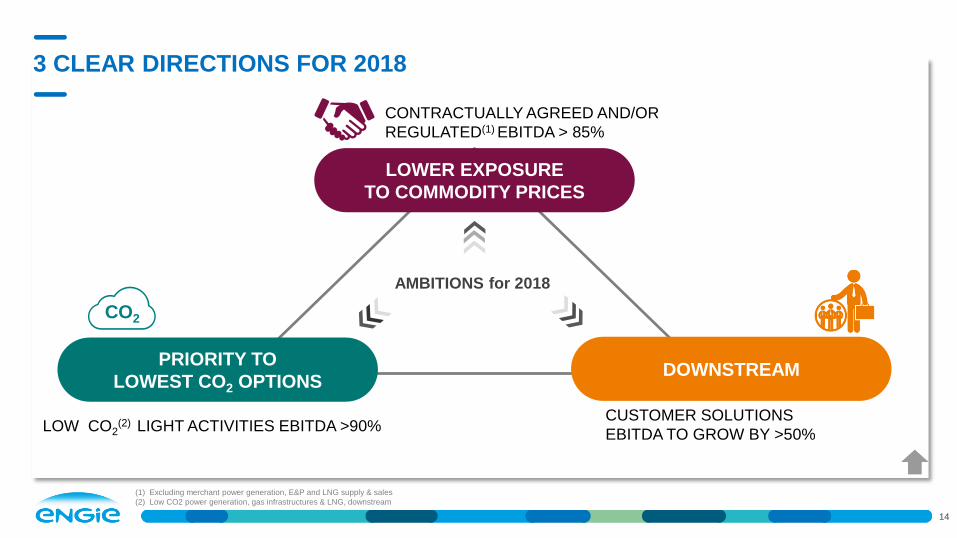
AMBITIONS for 2018
LOWER EXPOSURE
TO COMMODITY PRICES
DOWNSTREAMPRIORITY TO
LOWEST CO2 OPTIONS
LOW CO2(2) LIGHT ACTIVITIES EBITDA >90%
CO2
CONTRACTUALLY AGREED AND/OR
REGULATED(1) EBITDA > 85%
CUSTOMER SOLUTIONS
EBITDA TO GROW BY >50%
(1) Excluding merchant power generation, E&P and LNG supply & sales
(2) Low CO2 power generation, gas infrastructures & LNG, downstream
14
3 CLEAR DIRECTIONS FOR 2018
15
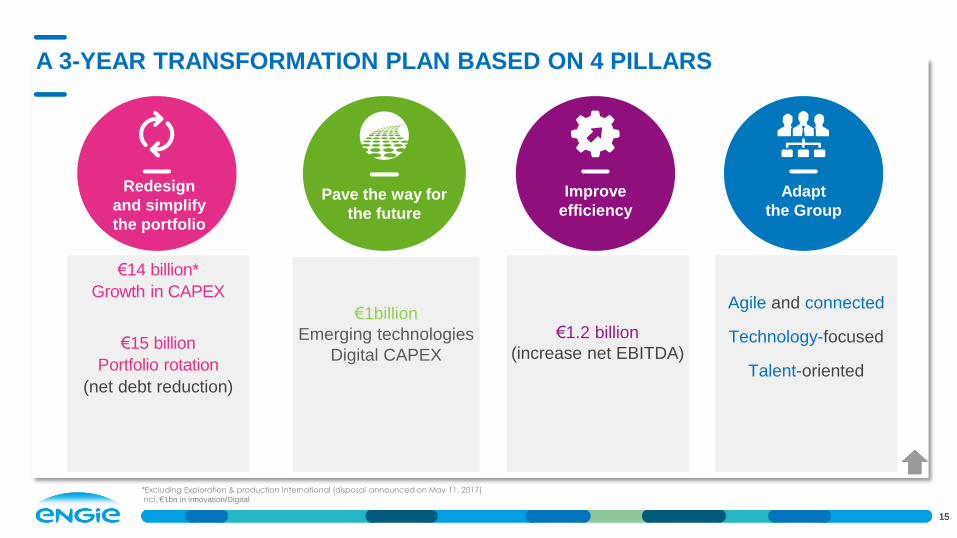
A 3-YEAR TRANSFORMATION PLAN BASED ON 4 PILLARS
*Excluding Exploration & production International (disposal announced on May 11, 2017)
ncl. €1bn in innovation/Digital
15
Agile and connected
Technology-focused
Talent-oriented
Adapt
the Group
Redesign
and simplify
the portfolio
€14 billion*
Growth in CAPEX
€15 billion
Portfolio rotation
(net debt reduction)
Pave the way for
the future
€1billion
Emerging technologies
Digital CAPEX
Improve
efficiency
€1.2 billion
(increase net EBITDA)
16
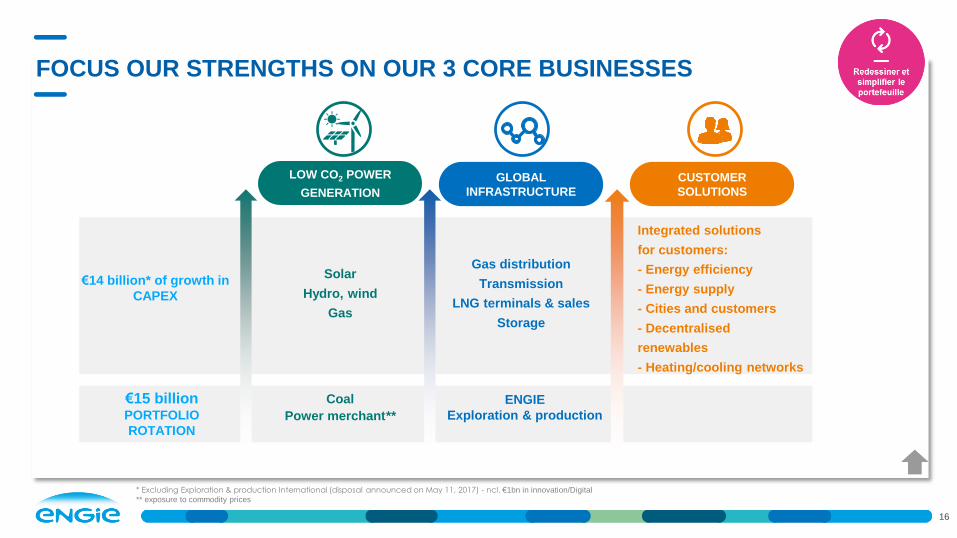
FOCUS OUR STRENGTHS ON OUR 3 CORE BUSINESSES
Coal
Power merchant**
ENGIE
Exploration & production
€14 billion* of growth in
CAPEX
€15 billionPORTFOLIO
ROTATION
Integrated solutions
for customers:
- Energy efficiency
- Energy supply
- Cities and customers
- Decentralised
renewables
- Heating/cooling networks
Gas distribution
Transmission
LNG terminals & sales
Storage
Solar
Hydro, wind
Gas
GLOBAL
INFRASTRUCTURE
LOW CO2 POWER
GENERATION
CUSTOMER
SOLUTIONS
* Excluding Exploration & production International (disposal announced on May 11, 2017) - ncl. €1bn in innovation/Digital
** exposure to commodity prices
17
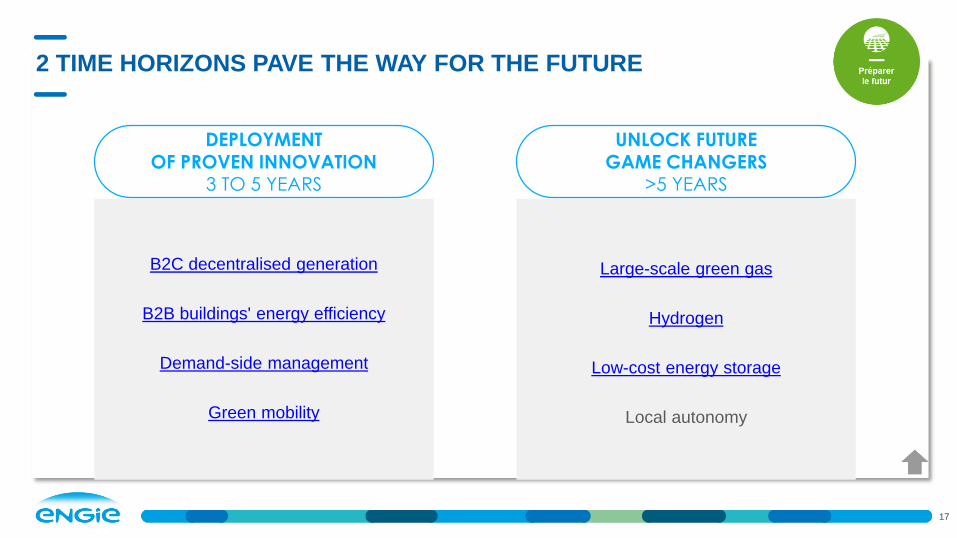
2 TIME HORIZONS PAVE THE WAY FOR THE FUTURE
B2C decentralised generation
B2B buildings' energy efficiency
Demand-side management
Green mobility
DEPLOYMENTOF PROVEN INNOVATION
3 TO 5 YEARS
Large-scale green gas
Hydrogen
Low-cost energy storage
Local autonomy
UNLOCK FUTUREGAME CHANGERS
>5 YEARS
18
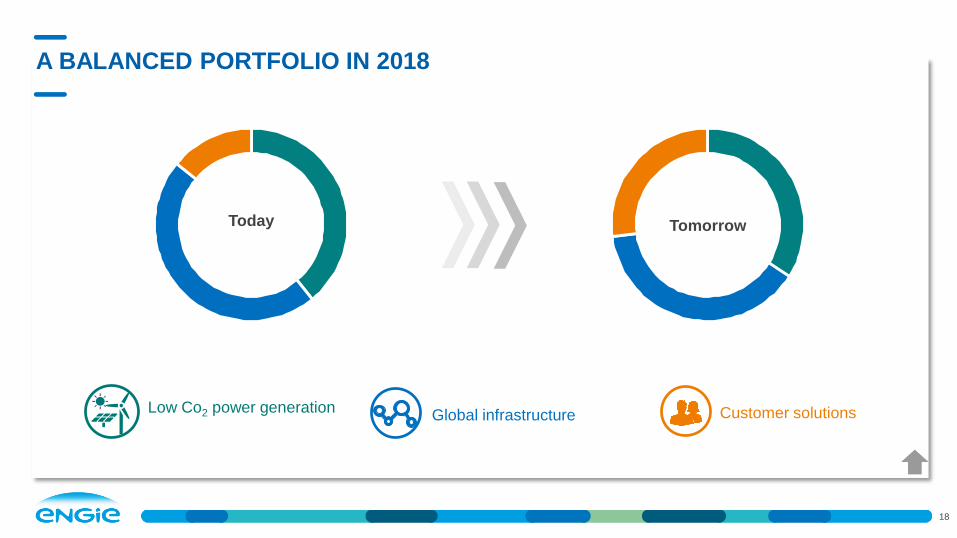
A BALANCED PORTFOLIO IN 2018
Global infrastructure Customer solutions
Today Tomorrow
Low Co2 power generation
19
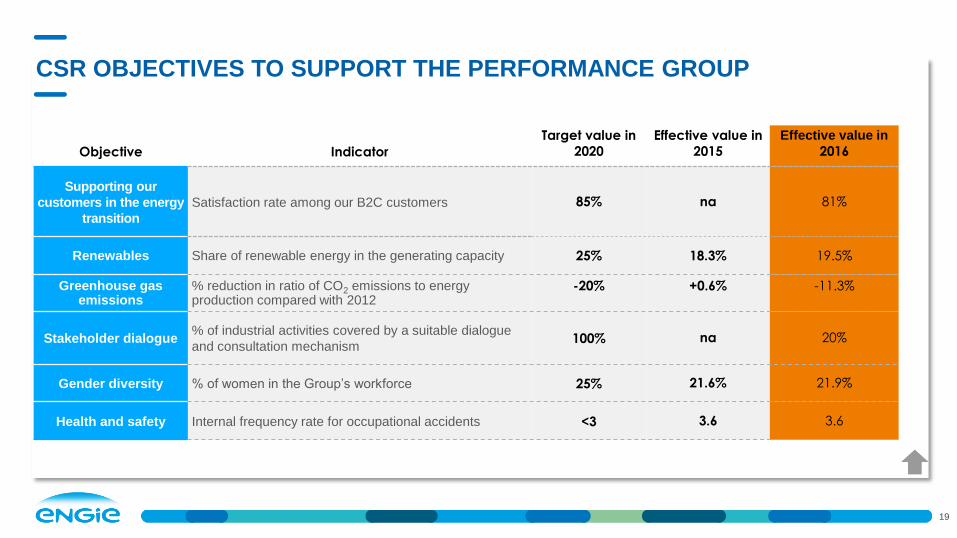
CSR OBJECTIVES TO SUPPORT THE PERFORMANCE GROUP
Objective Indicator
Target value in
2020
Effective value in
2015
Effective value in
2016
Supporting our
customers in the energy
transition
Satisfaction rate among our B2C customers 85% na 81%
Renewables Share of renewable energy in the generating capacity 25% 18.3% 19.5%
Greenhouse gasemissions
% reduction in ratio of CO2 emissions to energy production compared with 2012
-20% +0.6% -11.3%
Stakeholder dialogue% of industrial activities covered by a suitable dialogue
and consultation mechanism100% na 20%
Gender diversity % of women in the Group’s workforce 25% 21.6% 21.9%
Health and safety Internal frequency rate for occupational accidents <3 3.6 3.6
2017 HALF-YEAR
RESULTS
20
Understand the half-year results
Ahead of schedule on the transformation
plan
Key figures
2017-2018 financial objectives
21
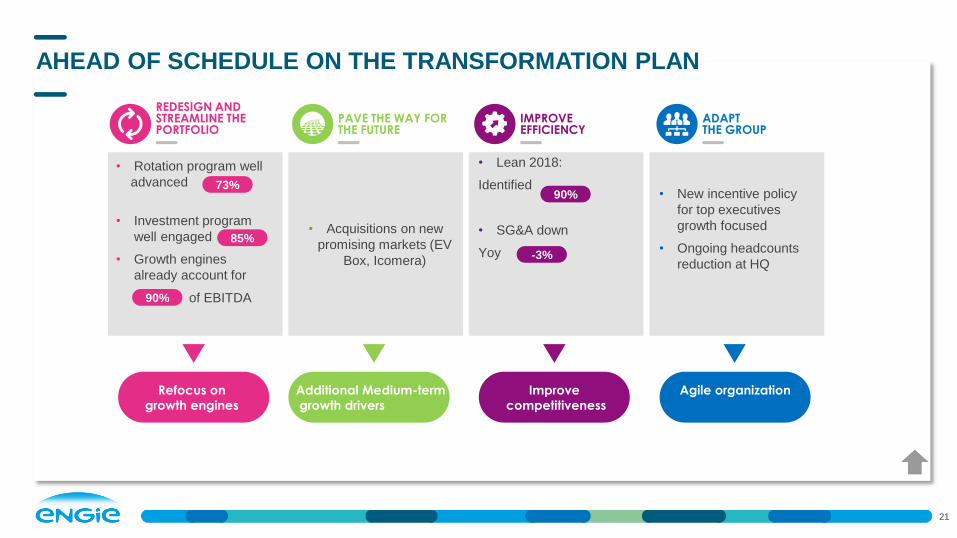
AHEAD OF SCHEDULE ON THE TRANSFORMATION PLAN
• Acquisitions on new
promising markets (EV
Box, Icomera)
• Lean 2018:
Identified
• SG&A down
Yoy
• New incentive policy
for top executives
growth focused
• Ongoing headcounts
reduction at HQ
PAVE THE WAY FOR THE FUTURE
IMPROVE EFFICIENCY
REDESIGN AND STREAMLINE THE PORTFOLIO
ADAPT THE GROUP
Additional Medium-term
growth drivers
Improve
competitiveness
Refocus on
growth engines
Agile organization
• Rotation program well
advanced
• Investment program
well engaged
• Growth engines
already account for
of EBITDA
73%
85%
90%
90%
-3%
22
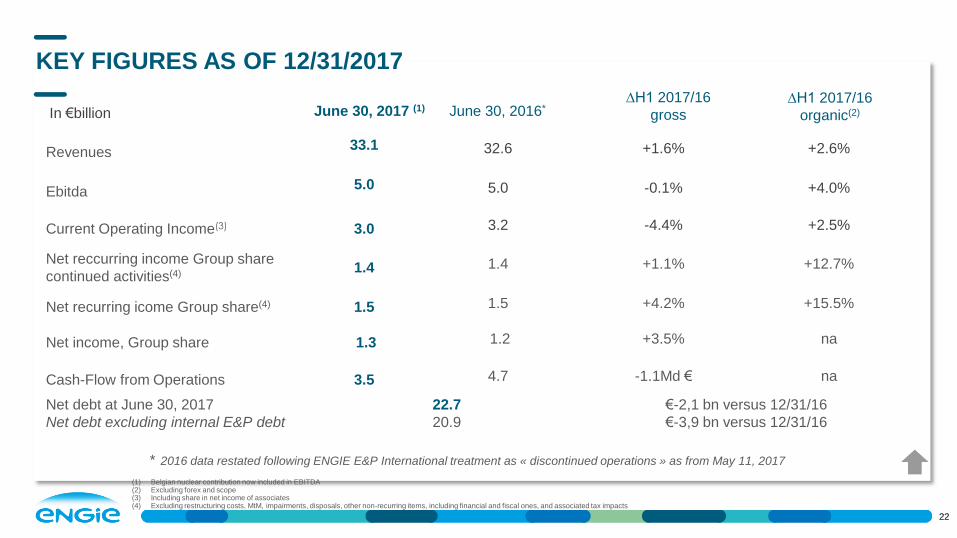
KEY FIGURES AS OF 12/31/2017
In €billion
Revenues33.1 32.6 +1.6% +2.6%
Ebitda5.0 5.0 -0.1% +4.0%
Current Operating Income(3) 3.0 3.2 -4.4% +2.5%
Net reccurring income Group share
continued activities(4) 1.4 1.4 +1.1% +12.7%
Net recurring icome Group share(4) 1.5 1.5 +4.2% +15.5%
Net income, Group share 1.3 1.2 +3.5% na
Cash-Flow from Operations 3.5 4.7 -1.1Md € na
Net debt at June 30, 2017
Net debt excluding internal E&P debt
22.7
20.9
€-2,1 bn versus 12/31/16
€-3,9 bn versus 12/31/16
* 2016 data restated following ENGIE E&P International treatment as « discontinued operations » as from May 11, 2017
22
June 30, 2016*∆H1 2017/16
organic(2)June 30, 2017 (1)∆H1 2017/16
gross
(1) Belgian nuclear contribution now included in EBITDA (2) Excluding forex and scope (3) Including share in net income of associates (4) Excluding restructuring costs, MtM, impairments, disposals, other non-recurring items, including financial and fiscal ones, and associated tax impacts
23
COMMENTS ON THE HALF-YEAR ACCOUNTS
Read the press release
Solid first half 2017 results, in line with our 2017 annual targets
Revenues increased by +1.6% on a reported basis to EUR 33.1 billion and by +2.6% on an organic basis compared with first half 2016. Adjusted for the
unfavorable evolution of temperatures in France, which have been less cold this semester compared to the same period last year, the organic growth
amounts to +3.0%.
EBITDA amounted to EUR 5.0 billion, globally stable (-0.1%) on a reported basis but up +4.0% on an organic basis. On this organic basis, EBITDA is driven
by the positive impacts of (i) the Lean 2018 performance program, (ii) the sustained performance of the Group's growth engines, (iii) the commissioning of
new assets in Latin America and (iv) a good performance of thermal power generation activities in Europe and Australia.
Net recurring income Group share amounted to EUR 1.5 billion, stable compared with first half 2016. It includes EUR 103 million of net recurring income
Group share from ENGIE E&P International activities classified in "Discontinued operations".
Net recurring income Group share relating to continued operations amounted to EUR 1.4 billion for the six months ended June 30, 2017, up +1.1%
compared with first half 2016, driven by an improvement in recurring net financial result.
Net income Group share amounted to EUR 1.3 billion for first half 2017.
Net income Group share relating to continued operations amounted to EUR 1.3 billion for the six months ended June 30, 2017, stable compared with first
half 2016. It includes the negative impacts of fair value adjustments to hedges of commodity purchases and sales, and charges to restructuring provisions,
which were partially offset by the positive impacts of (i) a reduction in the cost of debt, (ii) lower net impairment losses than the previous year, and (iii) gains
on disposals.
Net debt stood at EUR 22.7 billion at June 30, 2017, down EUR 2.1 billion since December 31, 2016, mainly due to cash flow from operations and the
impacts of the portfolio rotation program.
24
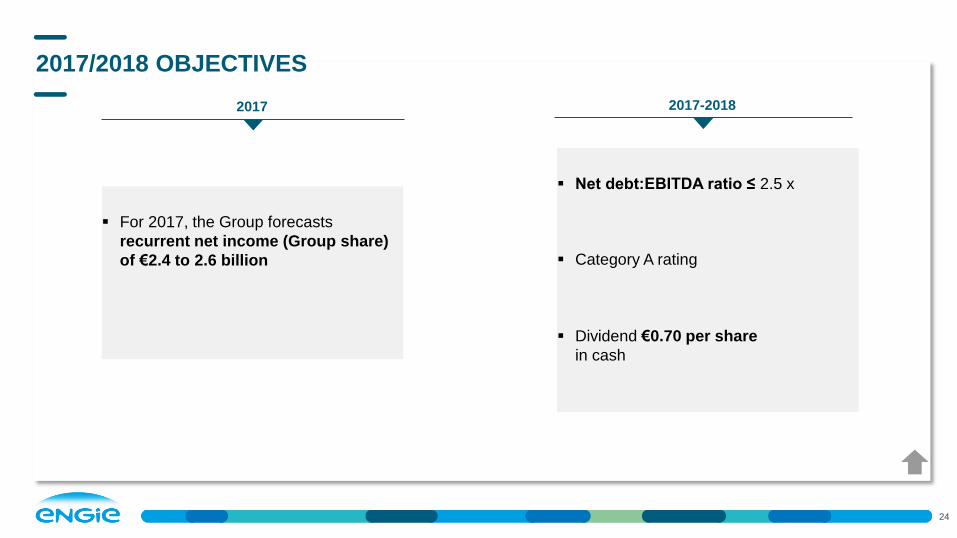
2017/2018 OBJECTIVES
Net debt:EBITDA ratio ≤ 2.5 x
Category A rating
Dividend €0.70 per share
in cash
2017-20182017
For 2017, the Group forecasts
recurrent net income (Group share)
of €2.4 to 2.6 billion
ENGIE
AND YOU
ENGIE stock
Bonus dividend
Actionaria
Useful information
Contents
25
IndicesMarketsStock market information
26
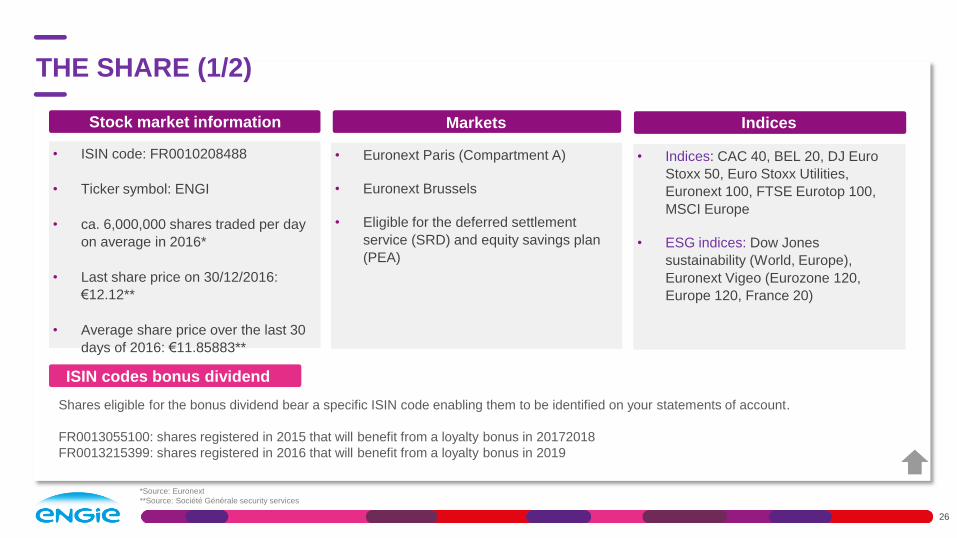
THE SHARE (1/2)
Shares eligible for the bonus dividend bear a specific ISIN code enabling them to be identified on your statements of account.
FR0013055100: shares registered in 2015 that will benefit from a loyalty bonus in 20172018
FR0013215399: shares registered in 2016 that will benefit from a loyalty bonus in 2019
• ISIN code: FR0010208488
• Ticker symbol: ENGI
• ca. 6,000,000 shares traded per day
on average in 2016*
• Last share price on 30/12/2016:
€12.12**
• Average share price over the last 30
days of 2016: €11.85883**
• Euronext Paris (Compartment A)
• Euronext Brussels
• Eligible for the deferred settlement
service (SRD) and equity savings plan
(PEA)
• Indices: CAC 40, BEL 20, DJ Euro
Stoxx 50, Euro Stoxx Utilities,
Euronext 100, FTSE Eurotop 100,
MSCI Europe
• ESG indices: Dow Jones
sustainability (World, Europe),
Euronext Vigeo (Eurozone 120,
Europe 120, France 20)
ISIN codes bonus dividend
*Source: Euronext
**Source: Société Générale security services
27
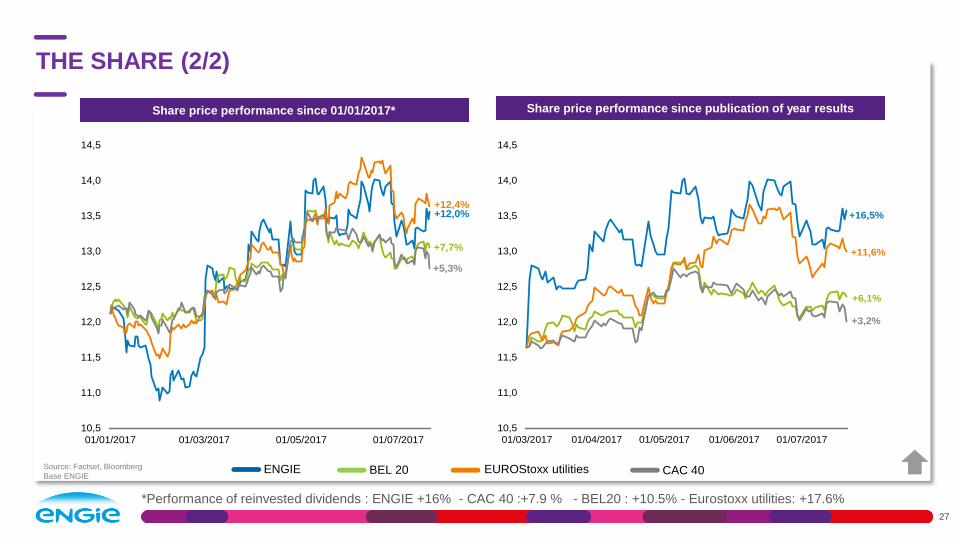
THE SHARE (2/2)
Gross
change in %
Gross
change in %
Source: Factset, Bloomberg
Base ENGIE
Share price performance since 01/01/2017*
*Performance of reinvested dividends : ENGIE +16% - CAC 40 :+7.9 % - BEL20 : +10.5% - Eurostoxx utilities: +17.6%
ENGIE BEL 20 EUROStoxx utilities CAC 40
10,5
11,0
11,5
12,0
12,5
13,0
13,5
14,0
14,5
01/01/2017 01/03/2017 01/05/2017 01/07/2017
+12,0% +12,4%
+7,7%
+5,3%
10,5
11,0
11,5
12,0
12,5
13,0
13,5
14,0
14,5
01/03/2017 01/04/2017 01/05/2017 01/06/2017 01/07/2017
+16,5%
+11,6%
+6,1%
+3,2%
Share price performance since publication of year results
28
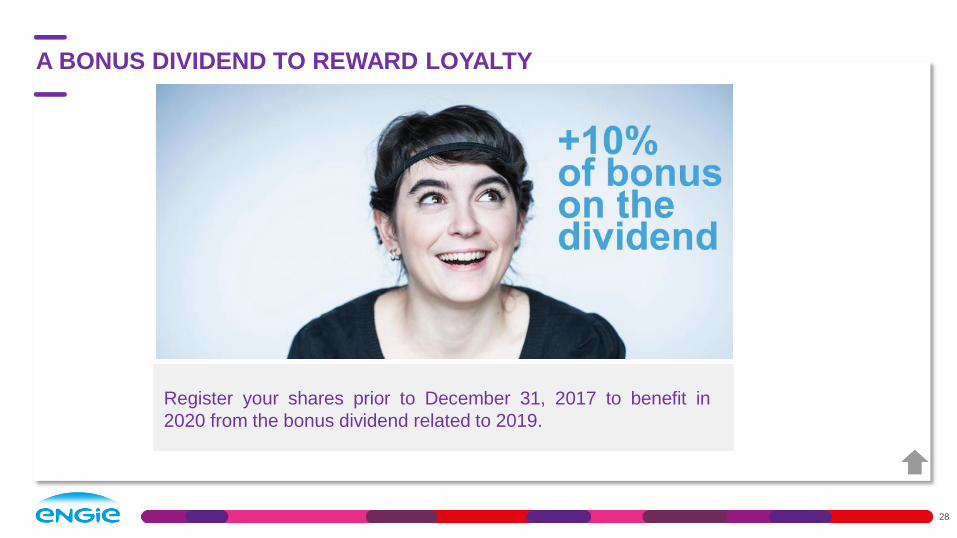
A BONUS DIVIDEND TO REWARD LOYALTY
Register your shares prior to December 31, 2017 to benefit in
2020 from the bonus dividend related to 2019.

29
2017 ACTIONARIA
The Shareholders Relations team will be
pleased to welcome you to the Palais des
congrès de Paris for 2 days.
2 days of meetings and exchanges to
discover the Group's news and activities.
Isabelle Kocher, CEO of ENGIE, will be
holding a shareholder meeting on Friday 24
November at 12:00 in the Maillot room.
Do not hesitate to contact us to receive a free
invitation!
RDV on Thursday, 23 and Friday, November 24, 2017 for 20 years of Actionaria
New schedules and a nocturne on Thursday!
Thursday, November 23: from 1 pm to 10 pm
Friday, November 24: from 9:30 am to 8 pm
30
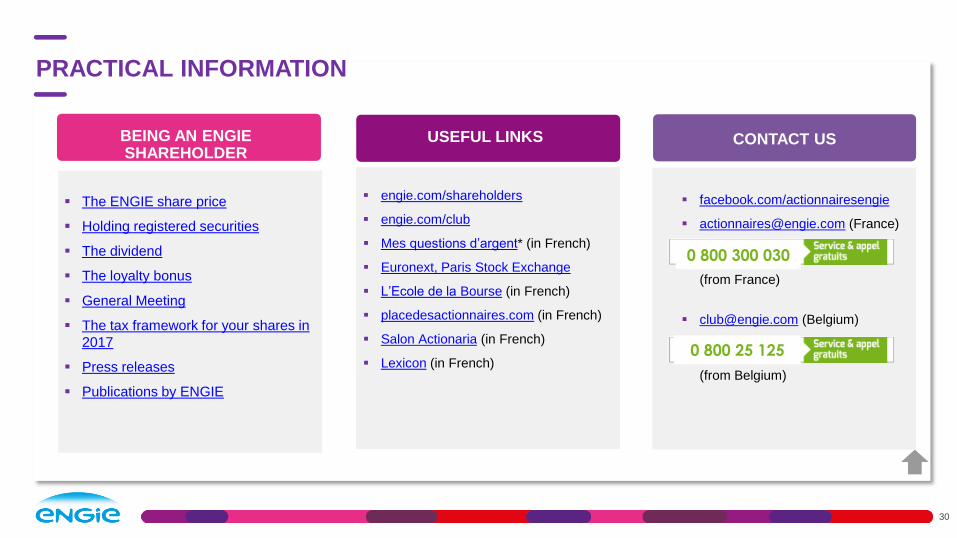
PRACTICAL INFORMATION
The ENGIE share price
Holding registered securities
The dividend
The loyalty bonus
General Meeting
The tax framework for your shares in
2017
Press releases
Publications by ENGIE
HOLDING ENGIE SECURITIESBEING AN ENGIE SHAREHOLDER
USEFUL LINKS
engie.com/shareholders
engie.com/club
Mes questions d’argent* (in French)
Euronext, Paris Stock Exchange
L’Ecole de la Bourse (in French)
placedesactionnaires.com (in French)
Salon Actionaria (in French)
Lexicon (in French)
CONTACT US
facebook.com/actionnairesengie
[email protected] (France)
(from France)
[email protected] (Belgium)
(from Belgium)
0 800 300 030
0 800 25 125
31
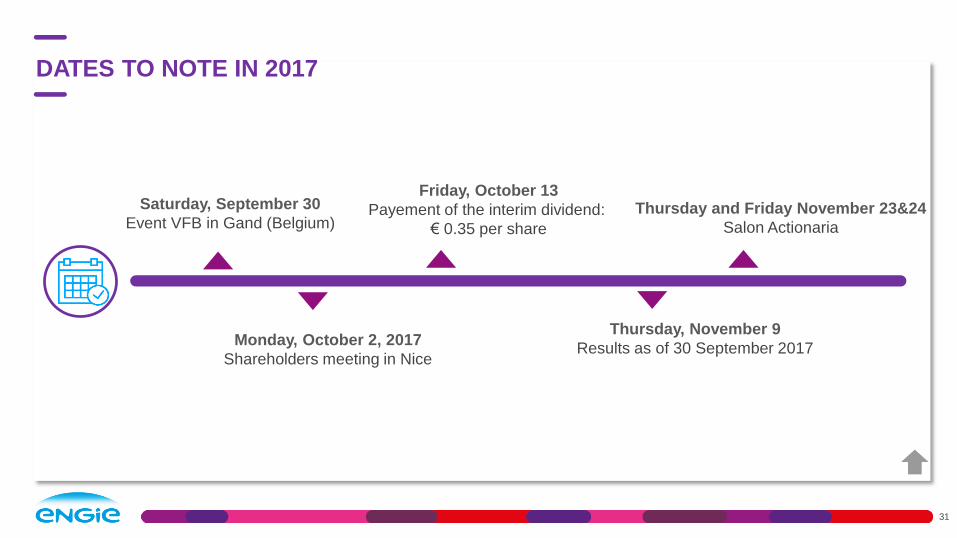
DATES TO NOTE IN 2017
Thursday, November 9
Results as of 30 September 2017
Thursday and Friday November 23&24
Salon Actionaria
Monday, October 2, 2017
Shareholders meeting in Nice
Friday, October 13
Payement of the interim dividend:
€ 0.35 per share
Saturday, September 30
Event VFB in Gand (Belgium)