presentation skills - david r. moore
TRANSCRIPT

Expectations Slide Construction Slide Visuals Tables and Data Final Tips Presentation Rubric Conclusion
Presentation Skills
David Moore1
Loyola Marymount University1
FNCE 3415 Valuation & Financial ModelingApril 21, 2021

Expectations Slide Construction Slide Visuals Tables and Data Final Tips Presentation Rubric Conclusion
Purpose
Discuss your company.Discuss your valuation.The story is just as important as the valuation.
Why is Tesla going to grow? or face difficulties?What is Tesla’s path? Competitive advantage? Risks?

Expectations Slide Construction Slide Visuals Tables and Data Final Tips Presentation Rubric Conclusion
Structure
Company BioNature of business, products, financial performance...
Industry overviewConsumer trends, growth, competitors...
Role of a key event in your valuation (ex. COVID)DCF: Key assumptions and justificationSensitivity analysisPublic comps: Selection of multiples and justificationsFootball field chart and conclusion (recommendation)

Expectations Slide Construction Slide Visuals Tables and Data Final Tips Presentation Rubric Conclusion
Day of Presentation
10-12 Minutes for presentation, 5-8 minutes for Q&A andfeedbackDress professional, camera must be on.Please arrive early and have slides ready.Email me slides before presentation.

Expectations Slide Construction Slide Visuals Tables and Data Final Tips Presentation Rubric Conclusion
Slide Construction
Do not put too much information/text on one slide:Bullet points are very useful.You do not want the audience to have to read the slides.Slides are a road-map of your presentation.Visuals are great way to tell a story. Use when possible.
Expectations Slide Construction Slide Visuals Tables and Data Final Tips Presentation Rubric Conclusion
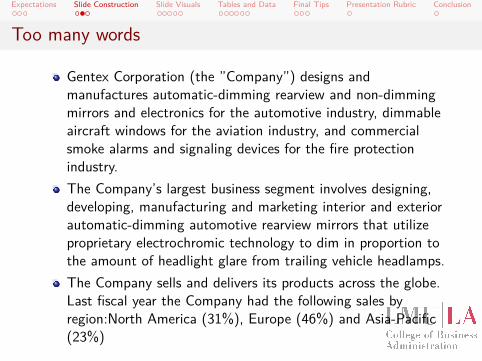
Too many words
Gentex Corporation (the ”Company”) designs andmanufactures automatic-dimming rearview and non-dimmingmirrors and electronics for the automotive industry, dimmableaircraft windows for the aviation industry, and commercialsmoke alarms and signaling devices for the fire protectionindustry.The Company’s largest business segment involves designing,developing, manufacturing and marketing interior and exteriorautomatic-dimming automotive rearview mirrors that utilizeproprietary electrochromic technology to dim in proportion tothe amount of headlight glare from trailing vehicle headlamps.The Company sells and delivers its products across the globe.Last fiscal year the Company had the following sales byregion:North America (31%), Europe (46%) and Asia-Pacific(23%)

Expectations Slide Construction Slide Visuals Tables and Data Final Tips Presentation Rubric Conclusion
Better...
Designs and manufactures:Automatic dimming rearview mirrors (98% of revenues)Dimmable aircraft windows and other products (only 2%).
Unit shipment by regionNorth America: 31%Europe 46%Asia-Pacific: 23%
Visual
Expectations Slide Construction Slide Visuals Tables and Data Final Tips Presentation Rubric Conclusion
Slide visuals
Using images or charts can help tell story or display data.Image should help tell your story.Chart should be properly labeled.Add a punchline, if applicable.

Expectations Slide Construction Slide Visuals Tables and Data Final Tips Presentation Rubric Conclusion
A better, better slide
Better Slide

Expectations Slide Construction Slide Visuals Tables and Data Final Tips Presentation Rubric Conclusion

Expectations Slide Construction Slide Visuals Tables and Data Final Tips Presentation Rubric Conclusion
Using Images
...buy-backs have a flaw: they can create perverse incen-tives to pay out too much cash, damaging firms’ balance-sheets and their ability to invest. For a start, both investorsand managers can become addicted to the temporary ‘pop’that a buy-back can give to a share price.

Expectations Slide Construction Slide Visuals Tables and Data Final Tips Presentation Rubric Conclusion
Another Use of Images
Glacier coverage has decreased by 70% from 1980-2012.

Expectations Slide Construction Slide Visuals Tables and Data Final Tips Presentation Rubric Conclusion
Using Tables
Less is more.Use a chart when possible.All data is not created equally.
Draw audience to what is important.
Expectations Slide Construction Slide Visuals Tables and Data Final Tips Presentation Rubric Conclusion
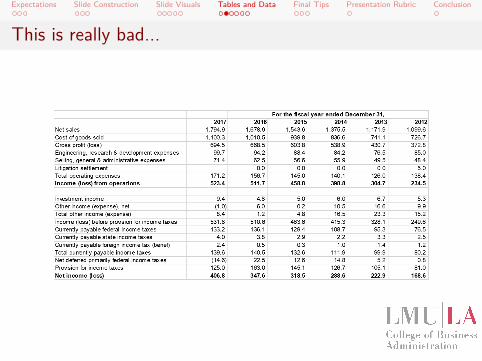
This is really bad...

Expectations Slide Construction Slide Visuals Tables and Data Final Tips Presentation Rubric Conclusion
Better

Expectations Slide Construction Slide Visuals Tables and Data Final Tips Presentation Rubric Conclusion
Best
Gentex’s profit margin has increased since 2013.

Expectations Slide Construction Slide Visuals Tables and Data Final Tips Presentation Rubric Conclusion
Table vs Graph

Expectations Slide Construction Slide Visuals Tables and Data Final Tips Presentation Rubric Conclusion
Table vs Graph

Expectations Slide Construction Slide Visuals Tables and Data Final Tips Presentation Rubric Conclusion
Presenting Do’s
Speak confidently and with enthusiasmMake eye contactRespect time limitKnow your audienceKnow your slidesIntroduce yourself

Expectations Slide Construction Slide Visuals Tables and Data Final Tips Presentation Rubric Conclusion
Presenting Don’ts
Read slides!!!Speak too slow or fastStumble (um...um...um...)Dismiss questionsHave too many slides, too much text, or too much data

Expectations Slide Construction Slide Visuals Tables and Data Final Tips Presentation Rubric Conclusion
Last tips
Use a company logoUse consistent colors themeUse the same fontAvoid “stock” photosPractice, Practice, Practice!!
Think Broadway Play not random bar improv night.

Expectations Slide Construction Slide Visuals Tables and Data Final Tips Presentation Rubric Conclusion
Rubric
Presentation is worth 60 points:5 points Professional attire5 points Time management25 points Presentation delivery and Q&A25 points Presentation content

Expectations Slide Construction Slide Visuals Tables and Data Final Tips Presentation Rubric Conclusion
Conclusion
Story is just as important as valuation.Use slides to help tell your valuation story.Only have 10 minutes, think about what is most important!!KISS (keep it simple, stupid)