presentation title here - mwrd.org
TRANSCRIPT

WELCOME
TO THE JANUARY EDITION
OF THE 2020
M&R SEMINAR SERIES

BEFORE WE BEGIN
• SAFETY PRECAUTIONS– PLEASE FOLLOW EXIT SIGN IN CASE OF EMERGENCY EVACUATION
– AUTOMATED EXTERNAL DEFIBRILLATOR (AED) LOCATED OUTSIDE
• PLEASE SILENCE CELL PHONES AND/OR SMART DEVICES
• QUESTION AND ANSWER SESSION WILL FOLLOW PRESENTATION
• PLEASE FILL EVALUATION FORM
• SEMINAR SLIDES WILL BE POSTED ON MWRD WEBSITE (https://mwrd.org/seminars)
• STREAM VIDEO WILL BE AVAILABLE ON MWRD WEBSITE (https://mwrd.org/seminars - after authorization for release is arranged)

Nicholas J. Menninga, PE, DEE
• Mr. Menninga is the General Manager at the Downers Grove Sanitary District, where he has worked since 2004. He has over 35 years of experience in the wastewater industry, including roles in a state regulatory agency, as a consulting engineer, and practicing public utility management.
• Mr. Menninga received his Bachelor of Science in Chemical Engineering from the University of Illinois, Urbana. He is an Illinois licensed Professional Engineer, an Illinois Class 1 Wastewater Treatment Plant Operator and a Diplomate of the American Academy of Environmental Engineers (DEE). He has been the president of IAWA and co-chair of NACWA Energy Committee.

Pursuit of Energy Neutrality at theDowners Grove Sanitary District
Nick Menninga, General Manager
January 24, 2020
4

Agenda
Background
Improved Efficiency / Energy Reduction
Energy Production / Use Of Resources

Downers Grove Sanitary District
11/22 MGD average/peak
full treatment capacity
Primary clarification
Single-stage nitrification
Tertiary sand filtration
Oversized anaerobic
digestion
Sludge dewatering and aging
Excess flow primary and
disinfection to 110 MGD total

Wastewater Treatment
Energy Needs
Pumping
Secondary Treatment – Aeration
Buildings – HVAC/Lighting
Other Small Process Motors
Sludge Digestion – Heat/Mixing
7

Basic Treatment Scheme
Pumping
Energy
Blower
Energy
TO
DIGESTION

Pumping
Centrifugal Pumps
Electric Motors
40 Feet Vertical
Lift
11 Million Gallons
per Day
9

Activated Sludge/Aeration
10

Anaerobic Digestion
11

Building Spaces
12

The Management Challenge
Energy: 15% of operating budget
Cost-effective reductions: good business
practice / expected by rate payers
Synergies
Staff skills
Automation/controls
Existing energy infrastructure
Available technologies
External funding
13

Energy Types and Needs Electricity
Pumping
Aeration
Other process
Support (buildings, outside lighting, etc)
Natural Gas
Heating – Building
Heating - Process
Digester Gas
Heating - Process

Historic Energy Use Kw
h /
year
0
2,000,000
4,000,000
6,000,000
8,000,000
10,000,000
12,000,000
14,000,000
16,000,000
18,000,000
2002
2003
2004
2005
2006
2007
2008
2009
2010
2011
2012
2013
2014
2015
2016
2017
2018
2019
bio-gas flared
bio-gas used
natural gas
electricity
Abandon Old CHP

Model Program – Strass, Austria
TOTAL ENERGY USE
TOTAL ENERGY PRODUCTION
NET ZERO

Matching the Model
0
2000000
4000000
6000000
8000000
10000000
12000000
14000000
16000000
2002
2003
2004
2005
2006
2007
2008
2009
2010
2011
2012
2013
2014
2015
2016
2017
2018
2019
energy tot
dig gas used
dig gas avail
CHP ProjectsEfficiency Improvements
Gas Production
Kw
h /
year

Energy
Reduction/Efficiency
Aeration System Improvements – 7 year
payback on $1 million (after $250,000
grant)
Pumping Station VFDs – 3 year payback on
$50,000 (after $20,000 grant)
Lighting Upgrades – 3 year payback on
$25,000 (grant funding varies)
HVAC
◦ Desiccant Dehumidifier – 8 year payback on
$100,000
◦ Geothermal/Effluent Water Heat Pumps – 0
year payback (replacement program as old
units fail - $5,000 per year)
◦ Absorption Chiller – 7 year payback on $10,000
MORE TO COME

Aeration in wastewater
treatment
19
blower
sewage
controls
oxygen meter
diffusers
air

Energy
Reduction/Efficiency
Aeration System Improvements – 7 year
payback on $1.15 million (after $250,000
grant)
New turbo-blower
New diffusers
New tank configuration
DO/Amm control

Energy
Reduction/Efficiency
Pumping Station VFDs – 3 year payback
on $50,000 (after $20,000 grant)
Replaced Flo-matchers at two lift
stations
Liquid rheostat tied to water level
10% electric efficiency
One VFD per pump
SCADA controls using pressure level
sensor (Birdcage)
95% + electric efficiency

Energy
Reduction/Efficiency
Lighting Upgrades – 3 year payback on
$25,000 (grant funding varies)
Conducted up-front inventory study
Systematically retro-fitted entire plant
over 7 years
Fluorescents, LEDs, and timer switches
District staff installed

Energy
Reduction/Efficiency HVAC
◦ Desiccant Dehumidifier – 8 year payback on
$100,000
◦ Geothermal/Effluent Water Heat Pumps – 0
year payback (replacement program as old
units fail - $5,000 per year)
◦ Absorption Chiller – 7 year payback on
$10,000

Energy
Reduction/Efficiency
Grit Blower – 3 year payback on $12,000
(after $22k grant)
Replaced 8-stage centrifugal
Rotary lobe
½ the energy use

Energy Reduction Trend
0
2,000,000
4,000,000
6,000,000
8,000,000
10,000,000
12,000,000
14,000,000
16,000,000
18,000,000
20
02
20
03
20
04
20
05
20
06
20
07
20
08
20
09
20
10
20
11
20
12
20
13
20
14
20
15
20
16
20
17
20
18
20
19
bio-gas flared
bio-gas used
natural gas
electricity
Kw
h /
year
Dehumidifier
Aeration Improvements

Energy ProductionAvailable Resource: Sludge
Incineration – need to
dewater first – net energy
concerns
Bio-fuel cell – very early
stages of development
Improved Gas Production
More feed stock (grease,
food, etc)
Improved feed stock
(WAS lysis, improved
thickening)
Better digester mixing

Grease Trap Cleaning and
Hauling
Restaurant Sewer Interceptors
Needed for Sewer Operation
Require Regular Pumping
Pumped Liquid has Limited Uses
Pumped Liquid needs
Transportation
Co-Digestion Provides Benefits
27

Grease Receiving Equipment Converted grit tank (10,000 gallons) with screen and modified
submersible mixer
Second dedicated tank (30,000 gallons) with same features

Grease Pumping Set-up
Progressive cavity pump
Grease grinder
Piping Clean-out
◦ Piping Clean-out

Controls
SCADA timers, tank level

Revenue
Typical Charge - $50/1,000 gallons
Minor Compared to Total User Billing
– 2-3%
Variety of Compatible Hauled
Wastes:
Septage
FOG
Landfill Leachate
Industrial
Commercial Food Waste

High Strength Waste
Characteristics
Main digestate: liquid with 2-5% solids in solution
(70-80% volatile)
High strength waste desired: liquid/slurry,
compatible (food-type), highly volatile
Selected restaurant sewer grease trap waste
Pump-able slurry
Haulers use ‘single use’ (sewage/food) vehicles
90%+ volatile content
Trying different food-waste slurries case-by-case

Gas Production – 20% More
Sludge Flow
0
2000000
4000000
6000000
8000000
10000000
12000000
14000000
2002 2003 2004 2005 2006 2007 2008 2009 2010 2011 2012 2013 2014 2015
Digester Gas Production – KWH/YR
Begin Co-Digestion

Challenges
Material handling
Pipes clog
Material coagulates
Comes with debris
Consistent supply
Limited supply
Carbon/energy balance in plant

Digester Mixing
Pearth Mixers in 2 Primary Digesters
Replaced CRP system with gas-mix system in 3rd
Critical digestion effectiveness
Secondary Digesters for Fill and Draw, Gas Storage
35

Energy Generation Projects
Goal: Produce sufficient energy to
meet reduced energy demand
FOG/Food Waste Receiving Station =
Increased Biogas Production – ARRA
funding
Combined Heat and Power - > $1
million grant funding
◦ Electricity Generation
◦ Digester Heating

Gas Use Gas Cleaning
Iron sponge – H2S
Dehumidification
Carbon - siloxanes
Combined Heat and Power
Engine Fuel
Electric Generator
Off-set grid power $
Renewable Energy Credits $
Hot Water – Digester heat
Direct Fuel – HVAC
Pipeline gas?
Vehicle fuel?

Combined Heat and Power
and Anaerobic Digestion
38
digester
bio-gas
recirculating sludge
heat
exchanger
flare excess
electricity
CHP engine genset
hot water
sludge

Energy Generation Projects
Combined Heat and Power Phase 1 -
$670,000 grant funding
◦ Gas cleaning
◦ Electricity Generation
◦ Digester Heating

Energy Generation Projects Combined Heat and Power Phase 2 -
$500,000 grant funding
◦ Second engine genset with heat
recovery
◦ Minor gas cleaning system upgrades
◦ Total CHP investment $3.5 million after
grants, 10-year payback

Challenges
Understanding electricity and REC
market
Coordination with electric utility
High-maintenance equipment – new
‘normal’

Sludge Dewatering Gravity Sludge Drying Beds
– Auger used to aid dewatering
Belt Filter Press – Polymer and Electricity

Biosolids Disposal
Class A product
Public distribution
Soil supplement with
fertilizer value
Long holding time (3-year)
process
Increased production from
co-digestion

Analytical Testing in Biosolids
Fertilizer Content – N/P/K
Toxic Metals/Organics – 129 Priority Pollutants
Pathogens – Salmonella, Fecal Coliform, Helminth Ova, Enterovirus
Vector Attraction – Volatile Solids Reduction

Financial Impacts
Project Capital Costs (from Capital Reserves): $6.9
million
Grant Funding (from IDCEO, ICECF): $1.5 million
Annual Reduction in Energy Cost: $350,000
Annual Revenue Collecting FOG: $250,000
Typical Customer Monthly Cost Savings: $2.50 (~8% of
$30 monthly bill)
45
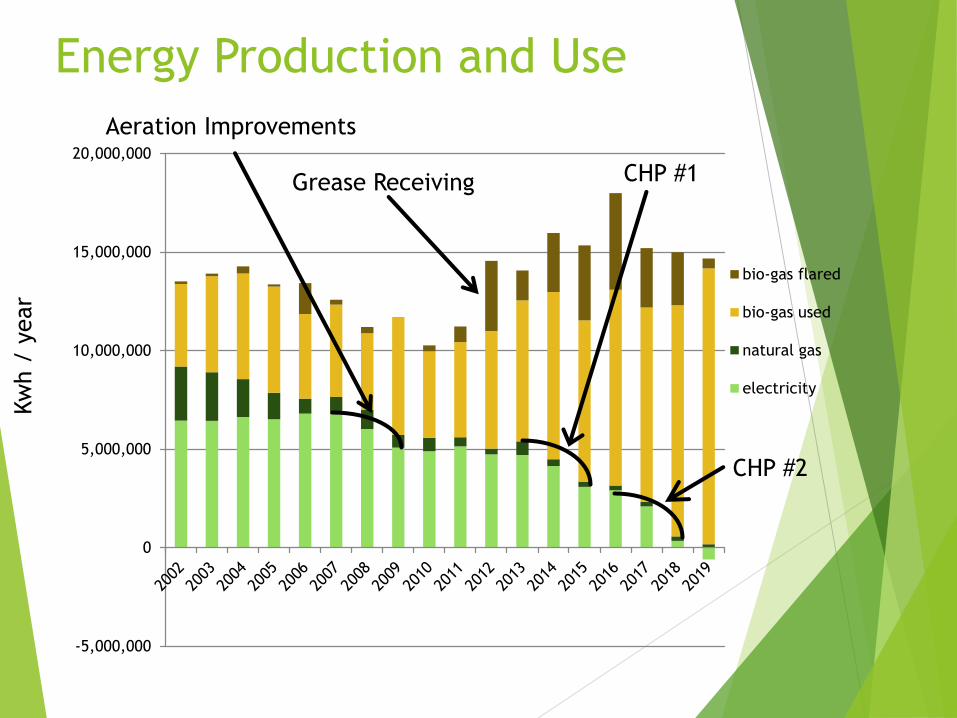
-5,000,000
0
5,000,000
10,000,000
15,000,000
20,000,000
bio-gas flared
bio-gas used
natural gas
electricity
Energy Production and UseKw
h /
year
Grease Receiving CHP #1
CHP #2
Aeration Improvements

0
2000000
4000000
6000000
8000000
10000000
12000000
14000000
16000000
2002
2003
2004
2005
2006
2007
2008
2009
2010
2011
2012
2013
2014
2015
2016
2017
2018
2019
energy tot
bio-gas used
dig gas avail
Matching the Model
CHP ProjectsEfficiency Improvements
Gas Production
Kw
h /
year

Monthly Scoreboard
Energy Used Energy Produced Net Energy
July2018 548 MWH 607 MWH -59 MWH
August2018 654 MWH 579 MWH 75 MWH
September2018 739 MWH 599 MWH 140 MWH
October2018 942 MWH 715 MWH 227 MWH
November2018 957 MWH 911 MWH 46 MWH
December2018 995 MWH 817 MWH 178 MWH
January2019 1,014 MWH 861 MWH 153 MWH
February2019 862 MWH 864 MWH -2 MWH
March2019 958 MWH 1,005 MWH -47 MWH
April2019 845 MWH 846 MWH -1 MWH
May2019 873 MWH 888 MWH -15 MWH
June2019 826 MWh 893 MWH -67 MWH48

49
Strategic Partnerships

Public Relations
Web Page
Newsletter
Coordination with EAGs
Open House
Education Tours
50

Conclusions
Energy is a controllable expense
Energy reduction technologies are
compatible with wastewater O&M skill-sets
Energy reduction is cost-effective
Opportunities of all sizes are available
Grant / other funding opportunities
continue
51
Conclusions
Getting to net-zero is a process
Each step/project needs to provide value
Getting to net-zero takes time
Grant opportunities are important
incentives
52
