presentation to the british society of sugar technologists ... · capital investment plan...
TRANSCRIPT

Presentation to the British Society of Sugar Technologists
17th April 2012.
Simon MitchellS&BE Business Development Director
.
u per z lCountry Paper on Brazil

2
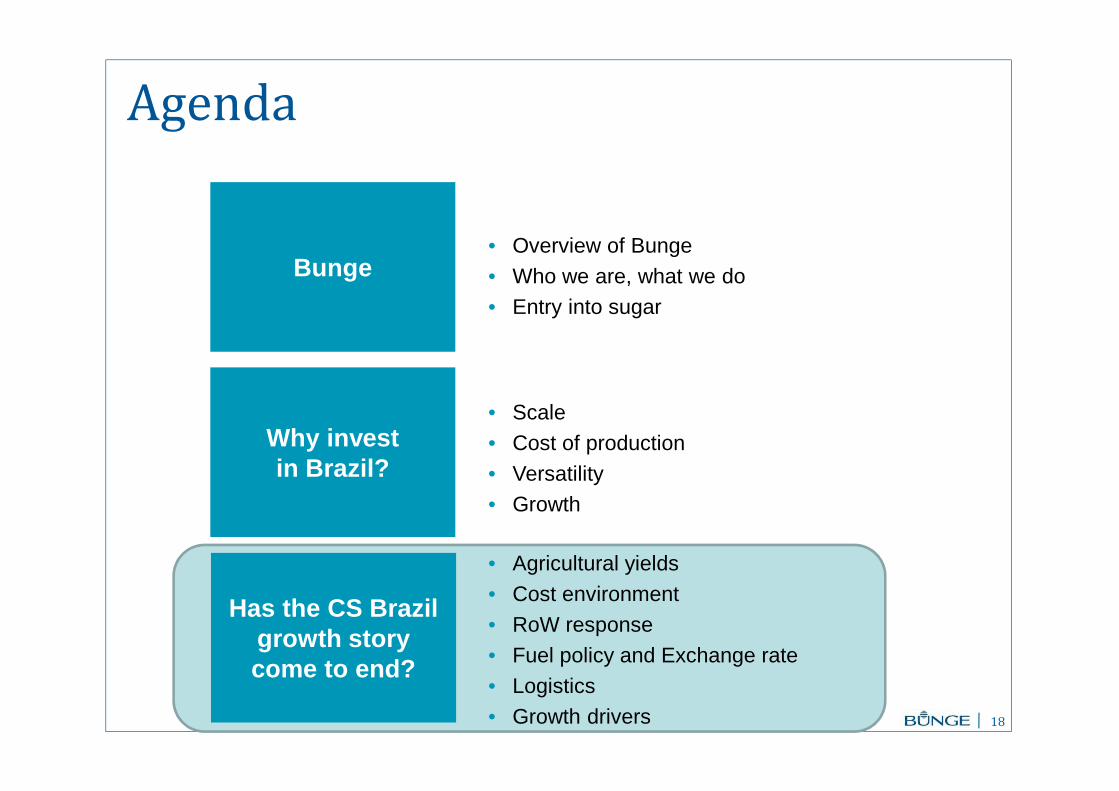
Agenda
Bunge
Why invest in Brazil?
• Overview of Bunge• Who we are, what we do• Entry into sugar
• Scale• Cost of production• Versatility• Growth
Has the CS Brazilgrowth storycome to end?
• Agricultural yields• Cost environment• RoW response• Fuel policy and Exchange rate • Logistics• Growth drivers

3
We Are a Leading Global Agribusiness & Food Company
KEY FACTS
Employees: 37,000
Facilities: 400+
Countries of Operations: 30+
CAPITAL INVESTMENT PLAN
Fertilizer 10%
Food & Ingredients
15%
Agribusiness45%
Sugar & Bioenergy
30%
• A leader in oilseed processing
• A leader in global grain and
oilseed marketing
• Retail fertilizer in Brazil
• Fertilizer operations in
Argentina and the U.S.
• 50% stake in JV with OCP in
Morocco
• Leading producer of consumer
bottled oil brands in South
America, Europe and Asia
• Leading supplier to food service
companies and food processors
in North America
• Leading corn and wheat miller
in the Americas
Fertilizer Agribusiness Food & Ingredients
• 20 MMT sugarcane milling
capacity producing sugar, ethanol
and electricity
• #2 in global trade and distribution
Sugar & Bioenergy

4
What We Do — From Feed to Food to Fuel
Bunge processes soybeans, rapeseed, canola, sunflower seeds, corn, wheat,
sugarcane and other agricultural commodities to make products and ingredients
with numerous applications.
• Feed for animals
• Cooking oils, margarines and
shortenings
• Sugar and ethanol from sugarcane
• Milled corn, wheat and rice for
cereal, snacks, baked goods, beer
and other foods
• Oils used in solvents, inks,
lubricants, hydraulic fluid, foam
and other applications
• Fertilizers that help farmers
produce quality crops

5
A global, integrated, coordinated Chain is essential
Farmer• Soy• Corn• Wheat• Sorghum• Barley• Canola• Rapeseed• Sunseed• Flaxseed• Sugar cane
Product Origination• Storing• Blending• Drying• Financing
Basic Processing• Soybean• Rapeseed• Canola• Sunseed• Specialty
seeds• Raw sugar
Logistics• Rail• Truck• Barge• Ocean
vessel
Sales & Distribution• Raw material• Protein meal• Vegetable oil• Financial
services
Refining, Value Added & Packaging• Edible oils• Margarine• Mayonnaise• Corn, wheat &
rice products• Refined sugar
and ethanol
Risk Management
Value creation shifts along the chain
Agribusiness ChainFood &
Ingredients

6
Bunge’s development in Sugar & Bioenergy
0020052005
q d MAcquired Moema:
� mi 5 mills with 13.7 mmt of apacicapacity
� l Expands Bunge total apaci t mmtcapacity to 20mmt
020102 62 620062006 20072007 0020082008 2 92 920092009
e u r Started sugar trading & s merchandising
p i noperation
� c u Acquired Santa u ll 1s Juliana mill (1st
sasset)
� d v m n Started development f e ro n o mof Pedro Alfonso mill
� is d d a e is d d a e Raised dedicated Raised dedicated u d g a d u d g a d funding to expand funding to expand
o oSugar & BioenergySugar & Bioenergy
� re s Acquired 60% stake in o t r u c n Monte Verde sugarcane
ilmill
� re t e Acquired Tate & Lyle r d sugar trading &
e h i g u smerchandizing business
� d h Announced JV with o h t l n Itochu in Santa Juliana
o A oand Pedro Afonso
111120112011
This raised Bunge’s share of production capacity in Brazil to
~3.6%:
Major Oil companies now own 15% of production

7
Agenda
Bunge
Why invest in Brazil?
• Overview of Bunge• Who we are, what we do• Entry into sugar
• Scale• Cost of production• Versatility• Growth
Has the CS Brazilgrowth storycome to end?
• Agricultural yields• Cost environment• RoW response• Fuel policy and Exchange rate • Logistics• Growth drivers

8
SSUSAUSA
Sao Paulo
Territory: 8.5 million km2
This creates significant logistics challenges!
The distances are vast....
Scale: Just to put into context how big Brazil is!
9Source: UNICAMP
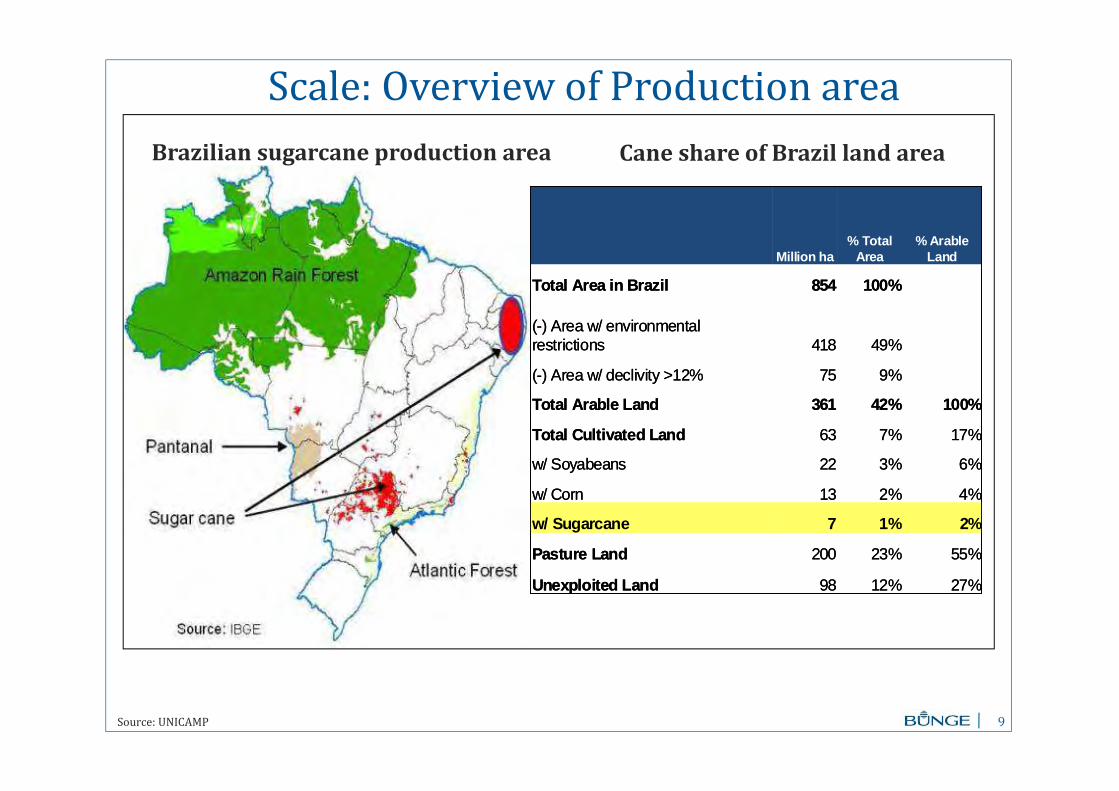
Scale: Overview of Production area
Million ha % Total
Area % Arable
Land
Total Area in Brazil 854 100%
(-) Area w/ environmental restrictions 418 49%
(-) Area w/ declivity >12% 75 9%
Total Arable Land 361 42% 100%
Total Cultivated Land 63 7% 17%
w/ Soyabeans 22 3% 6%
w/ Corn 13 2% 4%
w/ Sugarcane 7 1% 2%
Pasture Land 200 23% 55%
Unexploited Land 98 12% 27%
Brazilian sugarcane production area Cane share of Brazil land area

10
Scale: Brazil has experienced huge growth in cane production
200
250
300
350
400
450
500
550
600
99-00 01-02 03-04 05-06 07-08 09-10 11-12
CS Sugarcane Crush (MMT)
NEARLY 300% GROWTH IN 10 YEARS
?

11
Moema Ownership%
MTBA
DF
TO
MS
PR
MG
RibeirãoPreto RJ
ES
Paranaguá
Santos
Vitória
Scale: Large players benefit from flexible and efficient clusters
Moema (SP)
Frutal (MG)
Ouroeste (SP)
Guariroba (SP)
Itapagipe (MG)
MonteVerde (MS)*
SantaJuliana (MG)*
PedroAfonso (TO)*
OriginalBungeMills
AdditionalMills fromMoema Group
* Bunge has a 80% stake at Pedro Afonso and Santa Juliana and 60% stake at Monteverde.
SP
12
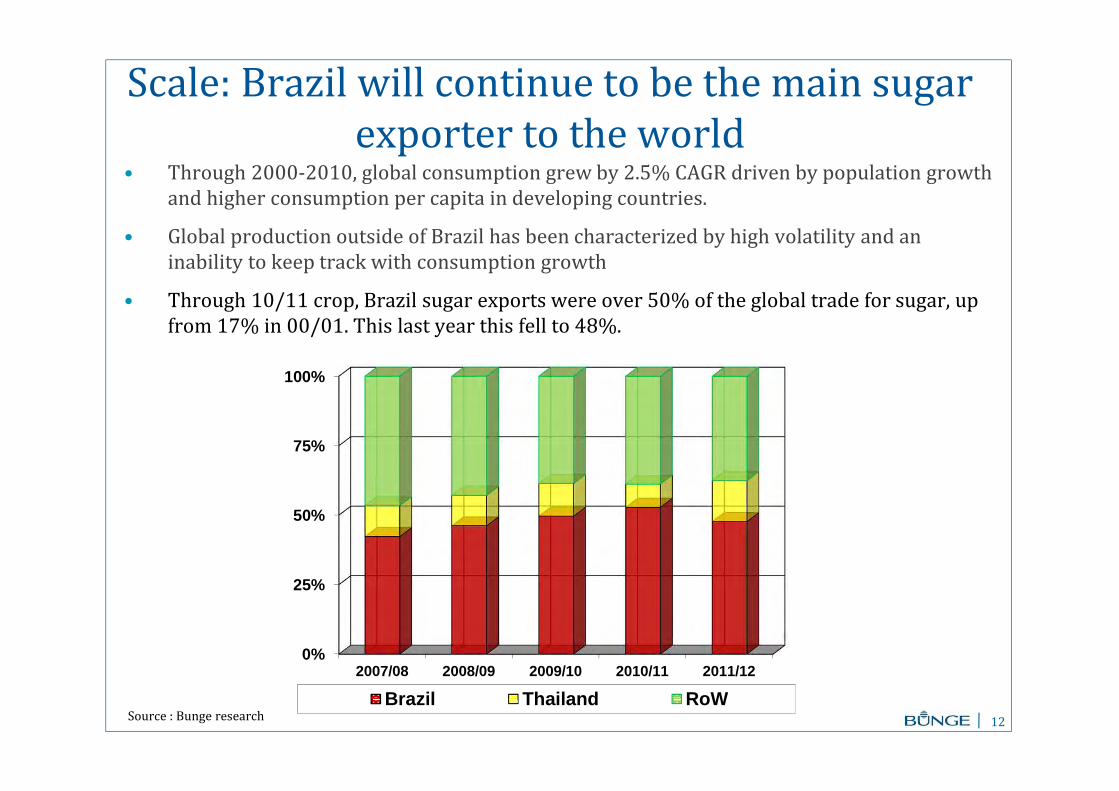
Scale: Brazil will continue to be the main sugar exporter to the world
• Through 2000-2010, global consumption grew by 2.5% CAGR driven by population growth and higher consumption per capita in developing countries.
• Global production outside of Brazil has been characterized by high volatility and an inability to keep track with consumption growth
• Through 10/11 crop, Brazil sugar exports were over 50% of the global trade for sugar, up from 17% in 00/01. This last year this fell to 48%.
0%
25%
50%
75%
100%
2007/08 2008/09 2009/10 2010/11 2011/12
Brazil Thailand RoWSource : Bunge research

13
Cost of production: Brazil still the world leader, but losing its cost advantage
CS Brazil’s cost advantage vs. Top 4 RoW exporters
(Ex-Mill - US$ / mt)
Source : LMC International
Has encouraged a supply side response from RoW, but which other country has the land, agronomics and cost
structure to materially increase supply ?
0
20
40
60
80
2003/04 2004/05 2005/06 2006/07 2007/08 2008/09 2009/10 2010/11 2011/12

14
There is significant versatility for the uses of Sugar cane
Cane Mill Ethanol
Sugar
Co-Gen
Ethanol
Molasses
Power
Juice
Cellulosic Ethanol
(Potential for new technology to mature
in the future)
Fermentation to Food and Feed products
e.g. amino acids (Lysine, Threonine, MSG), Organic Acids (Citric Acid, Lactic Acid), Vitamins (Vitamin C)…
Processing to Industrial Chemicals
Ethanol based ethylene and thermoplastics Fermentation to other chemicals
Fermentation to Biofuels and Hydrocarbons
e.g. Diesel and lubricants; short-term oleochemicals or edible products, new fermentation technologies and catalysts being developed
A
C
B
Vinasses + Ashes
(Fertilizer used in house)

15
Versatility: Brazil can respond to sugar/ethanol S&D and pricing
38%
40%
42%
44%
46%
48%
50%
52%
2001-02 2003-04 2005-06 2007-08 2009-10 2011-12
CS crush ATR mix to sugar(% to sugar)
Brazil can relatively easily switch from sugar to ethanolSource : Bunge

16
Growth: Global sugar S&D will remain tight
Assumes: - Normal weather patterns
- CS Brazil capacity to grow by ~10mmt by 2020- RoW will grow by ~25mmt by 2020- S&D kept in balance by CS Brazil
140
150
160
170
180
190
200
210
2000/01 2002/03 2004/05 2006/07 2008/09 2010/11 2012/13 2014/15 2016/17 2018/19
World Production Consumption MMT
World production CS Brazil Expansion Production Consumption

17
Growth: Brazil ethanol demand (led by fuel ethanol) will outstrip supply
0
10
20
30
40
50
60
2005 2007 2009 2011 2013 2015
Total ethanol production Total potential ethanol demand
Ethanol production in million m3
Source : Bunge estimates
18
Agenda
Bunge
Why invest in Brazil?
• Overview of Bunge• Who we are, what we do• Entry into sugar
• Scale• Cost of production• Versatility• Growth
Has the CS Brazilgrowth storycome to end?
• Agricultural yields• Cost environment• RoW response• Fuel policy and Exchange rate • Logistics• Growth drivers

19
Brazil Agricultural yields under pressure
Financially stretched mills have under-invested in the field, hence the recent increase in average age of the cane
TRS (kg/mt) Yield (mt/ha) evolution
65.00
70.00
75.00
80.00
85.00
90.00
2005/20062007/20082009/2010 2011/12
Yield (mt/ha)
125.00
130.00
135.00
140.00
145.00
150.00
2000/01 2003/04 2006/07 2009/10
TRS (kg/mt) in CS Brazil
Source Bunge

20
Trends increasing production costs• High financial costs: Many mills paying the price for over expansion (2006 – 2009)
• New social law requires mills to concede social benefits for the traditional workers from the NO/NE and minimum wages increasing faster than inflation
• Green cane protocol requires mills to stop cane burning by 2014 pushing mills into aggressive mechanisation schedules with;
– Loss of sugar content volume and ATR
– Shortage of trained labour
– High capital outlay
– Long lead time to efficient returns from mechanization
• Over last 5 years UNICA suggest field production costs have increased by 38.5%, mainly in land leasing (+57.12%), but also manpower (+47.12%) and mechanisation (+28.17%)
But leading millers have invested significantly in agriculture to address this underperformance
Source : Bunge Research

21
Brazil’s Cost Environment has recently been difficult
$400
$600
$800
$1,000
$1,200
$1,400
$1,600
7-J
an
-08
7-M
ar-
08
7-M
ay
-08
7-J
ul-
08
7-S
ep
-08
7-N
ov
-08
7-J
an
-09
7-M
ar-
09
7-M
ay
-09
7-J
ul-
09
7-S
ep
-09
7-N
ov
-09
7-J
an
-10
7-M
ar-
10
7-M
ay
-10
7-J
ul-
10
7-S
ep
-10
7-N
ov
-10
7-J
an
-11
7-M
ar-
11
7-M
ay
-11
7-J
ul-
11
Global Rebar Price Trend by Aug 1, 2011Rebar N.America FOB Midwest mill $/t
Rebar Europe Delivered $/t
Rebar East Aisa Import CFR $/T
Rebar Shanghai Inc VAT $/T
Shanghai rebar FOB
Inflation(US$ c/lb)
Steel(US$c/lb)
Very hostile to manufacturing in Brazil
0
2
4
6
8
10
12
14
16
2000 2001 2002 2003 2004 2005 2006 2007 2008 2009 2010 2011 2012 2013 2014 2015 2016
%
Year
Inflation
Infla…
Construction Index
Cost of borrowing
Steel prices expanding (SBB)
Inflation to rise 6% compound through to 2016 (IMF)
Domestic cost of borrowing 12%. 6% in real terms (Tradingeconomics.com)
Construction costs outstripping inflation
CAGR = 8.2%
Sources: IMF, SBB, Tradingeconomics.com, Bunge Research

22
The RoW is catching up
Africa constrained by high political risk, water issues, high transport costs from the interior and high capital costs.
India constrained by water issues
Asia Pacific concentrates 60% of the worlds population and struggles for available land
Russia/ Ukraine possible regime change and investment plus increasing beet yields
EU expanding post regime reform and increasing beet yields
35’ North
35’ South

23
Ethanol growth driver for capacity has disappeared
In 2011, Brazil imported 1.7bln litres of ethanol
Brazil Production of ethanol (hydrous and anhydrous)
Source: Unica
0
5,000
10,000
15,000
20,000
25,000
30,000
2005/2006 2006/2007 2007/2008 2008/2009 2009/2010 2010/2011
Anhydrous ethanol Hydrous ethanol

24
Brazilian Fuel Policy results in an upper cap on domestic gasoline prices
At current pricing and FX, Petrobras is losing moneyEthanol prices historically have been capped at 70% of gasoline
prices

25
Motor vehicle Fleet Projections Brazil
0.00
5.00
10.00
15.00
20.00
25.00
30.00
35.00
40.00
45.00
50.00
2005 2006 2007 2008 2009 2010 2011 2012 2013 2014 2015 2016 2017 2018 2019 2020
FFV cars Gasoline cars Alcohol cars
Can the fuel policy be maintained?
• Petrobras is absorbing losses on fuel imports
• Exports of ethanol have dramatically declined
• Potential demand for hydrous not being satisfied
– 2008 – 80% satisfied
– 2011 – 40% satisfied
(1) Massive growth in flexfuel demand from rapidly expanding economy and credit availability
(2) Brazil gasoline consumption now exceeds gasoline production capacity and increased volumes now rely on gasoline imports*
(3) Ethanol production declined at the expense of sugar
(4) Brazil currently starting to rely on US imports of ethanol
Source : Bunge analysis – considering UNICA/ANP forecasts
* Will reverse [2018-2020] when Pre-Salt oil fields are developed and new refineries come on stream

26
Brazilian Inflation and Exchange Rates
Brazilian inflation and exchange rate (Bloomberg – YoY % change, Real/US$)
Strong Real +
• Curb on inflation
Weak Real -
• Competitiveness for the industry1.5
2
2.5
3
3.5
0%
4%
8%
12%
16%Inflation %
US$/R$

27
Logistics: Santos remains the leading corridor for the mills in the CS State
Centre South
Santos Paranagua
Crop 09/10 19 4.8
Crop 15/16 24 - 26.5 6 - 6.5
Crop 20/21 26.5 - 31 6.5 – 8
It needs on-going investment to prevent logistics congestion and overload!
MMT
70% of sugar through Santos and 18% through Paranagua.> $500m planned investments to improve the Santos line-up

28
US legislation requires Brazil ethanol
Sugar ethanol is one of two commercial available Advanced Biofuels under the Federal RFS 2
California's Low Carbon Fuel Standard (LCFS) will mandate sugar ethanol use to lower carbon intensity
Evolution of US Renewable Fuels Standards 2 Mandates in Bln Gal
EU / Japan / China are deficit markets which continue to rely on Brazil
These markets in the medium term willing to pay a premium over domestic consumers
EU has legislative targets which require up to 6.2bn litres of imports (Brazil included)
Growing demand for Brazilian Ethanol exports
0
5
10
15
20
25
30
35
40
2008 2009 2010 2011 2012 2013 2014 2015 2016 2017 2018 2019 2020 2021 2022
Bln
Gal
lon
s Conventional Biofuels (corn ethanol mainly
Cellulosic Biofuels (no real substitute)
Other advanced (Brazil ethanol mainly)
Renewable Diesel (limited upside)
Source : Unica; RFS legislation
With high oil prices, global demand for fuel ethanol is expected to grow significantly!

29
Brazil Sugar Production and Exports
0
5,000
10,000
15,000
20,000
25,000
30,000
35,000
40,000
45,000
50,000
2000
/0120
01/02
2002
/0320
03/04
2004
/0520
05/06
2006
/0720
07/08
2008
/0920
09/10
2010
/1120
11/12
2012
/1320
13/14
2014
/1520
15/16
2016
/1720
17/18
2018
/1920
19/20
Sugar production (m mt) Exports (potential) Exports w hites (kmt) Exports raw s (kmt)
Brazil: Sugar Production and exports 2020Sugar crystallisation will not rise in proportion with cane production, but capacity will expand to keep the S&D in broad balance
Export expansion Consolidation
Source : Bunge forecasts

30
Growing demand for new Cane Products
0
10
20
30
40
50
60
70
80
2010/11 2012/13 2014/15 2016/17 2018/19
New Products
Cane crush (m mt)
Date
Mt million
e.g.
Amtris
Mitsui / DOW
Solazyme
Various
green plastic
packaging
initiatives

31