presentation to the oklahoma council on student affairs · personal/culinary services - $29,640...
TRANSCRIPT

Presentation to the Oklahoma Council on Student Affairs
Economic Importance of Higher Education in Oklahoma
November 10, 2011
1
Higher Education Impacts the Oklahoma Economy
•The Oklahoma State Regents for Higher
Education (OSRHE) contracted with Regional
Economic Models, Inc. (REMI) to analyze the
economic contribution of higher education on
Oklahoma. The results of this analysis
demonstrate the state’s economic dependenceupon higher education and, more specifically, its
graduates.

Higher Education Impacts the Oklahoma Economy
• Higher Education’s large contribution over time results in small investments in the present yielding large returns in the future. For example, in the first analysis year, $1.099 billion of state higher education funding results in $6.76 billion of economic activity. In other words, one dollar from the state enables $5.15 of additional economic activity that is directly attributable to the activities linked to the institutions of higher education. Furthermore, that initial investment of one dollar yields $27.07 over the analysis period as the effects of graduate earnings and productivity make their mark on the economy.

160 0 20 40 60 80 100 120 14005%10%15%
PROFESSIONAL
DEGREE
DOCTORATE
DEGREE
MASTER’S DEGREE
BACHELOR’S DEGREE
ASSOCIATE
DEGREE
SOME COLLEGE
NO DEGREE
HIGH SCHOOL
GRADUATE
LESS THAN HIGH
SCHOOL
ANNUAL
SALARIES IN 2009
UNEMPLOYMENT
RATE IN 2010
$146,659
$116,305
$87,913
$68,812
$49,835
$47,484
$39,937
$30,958
2.4
1.9
4.0
5.4
7.0
9.2
10.3
Source: Bureau of the Census; Bureau of Labor Statistics
14.9 4
- -
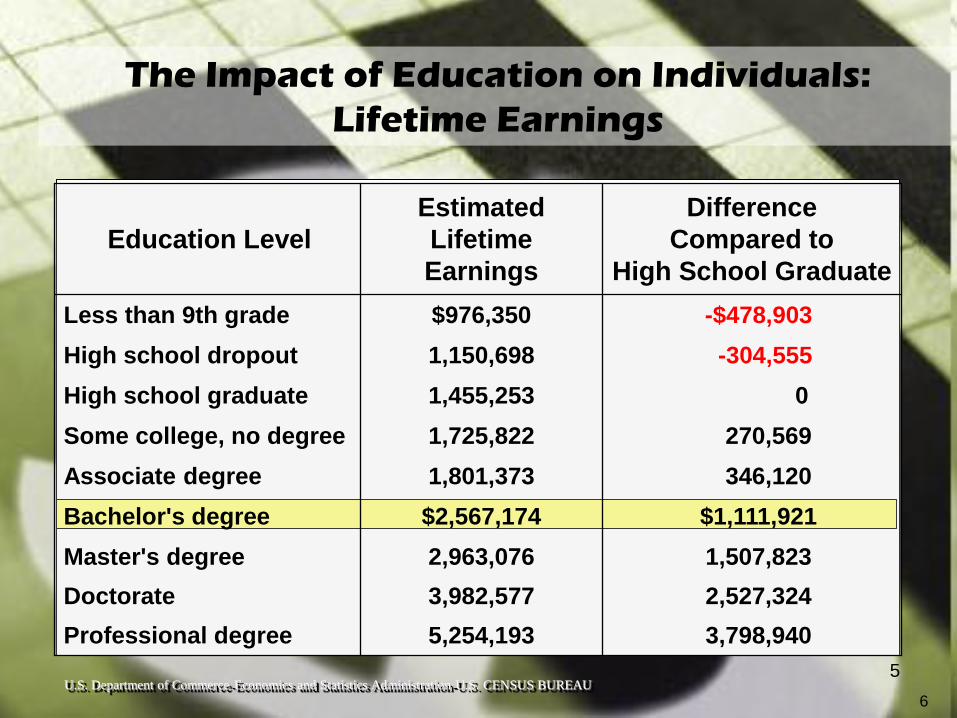
The Impact of Education on Individuals: Lifetime Earnings
Education Level
Estimated
Lifetime
Earnings
Difference
Compared to
High School Graduate
Associate degree
Some college, no degree
High school graduate
High school dropout
Less than 9th grade
1,801,373
1,725,822
1,455,253
1,150,698
$976,350
346,120
270,569
0
-304,555
-$478,903
Bachelor's degree $2,567,174 $1,111,921
Professional degree
Doctorate
Master's degree
5,254,193
3,982,577
2,963,076
3,798,940
2,527,324
1,507,823
U.S. Department of Commerce Economics and Statistics Administration U.S. CENSUS BUREAU
6
5

Engineering - $42,021
Health Professions - $36,384
Engineering Technologies - $34,191
Computer Sciences - $33,054
Education - $32,629
Personal/Culinary Services - $29,640
Business Management/Marketing - $27,219
Architecture - $25,241
Protective Services - $24,599
Mechanics and Repairers - $24,596
Liberal Arts - $24,221
Physical Sciences - $23,658
Mathematics - $21,756
2010 Average Salaries by Field of Study after 1 Year
6
Source: 2011 Employment Outcomes
Report and the Oklahoma
Employment and Security
Commission
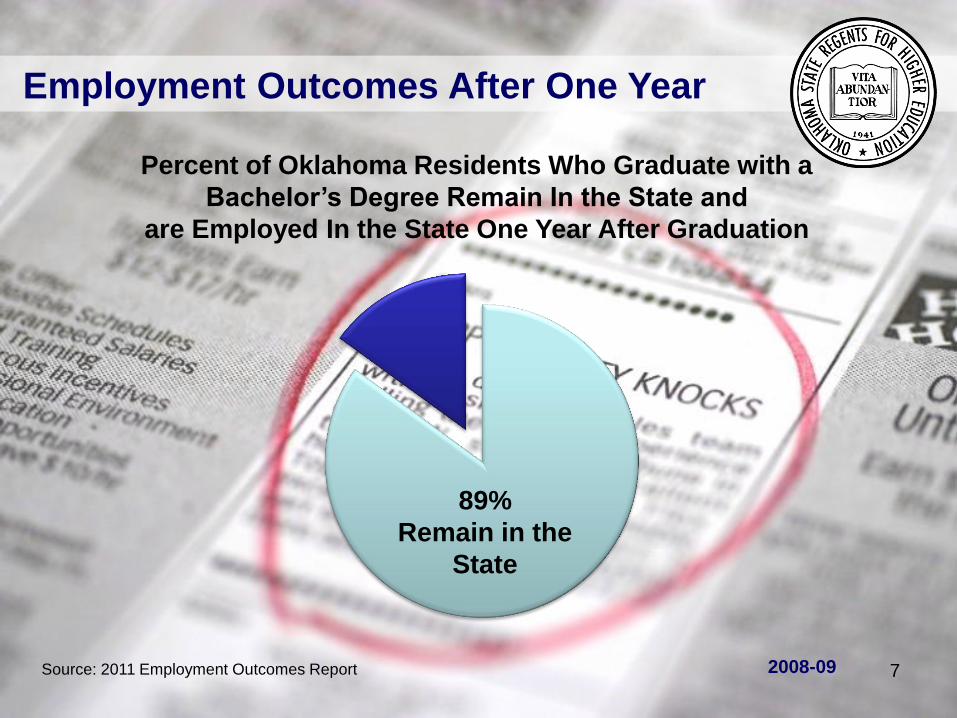
Employment Outcomes After One Year
Percent of Oklahoma Residents Who Graduate with a
Bachelor’s Degree Remain In the State and
are Employed In the State One Year After Graduation
89%
Remain in the
State
Source: 2011 Employment Outcomes Report 2008-09 7
8

9
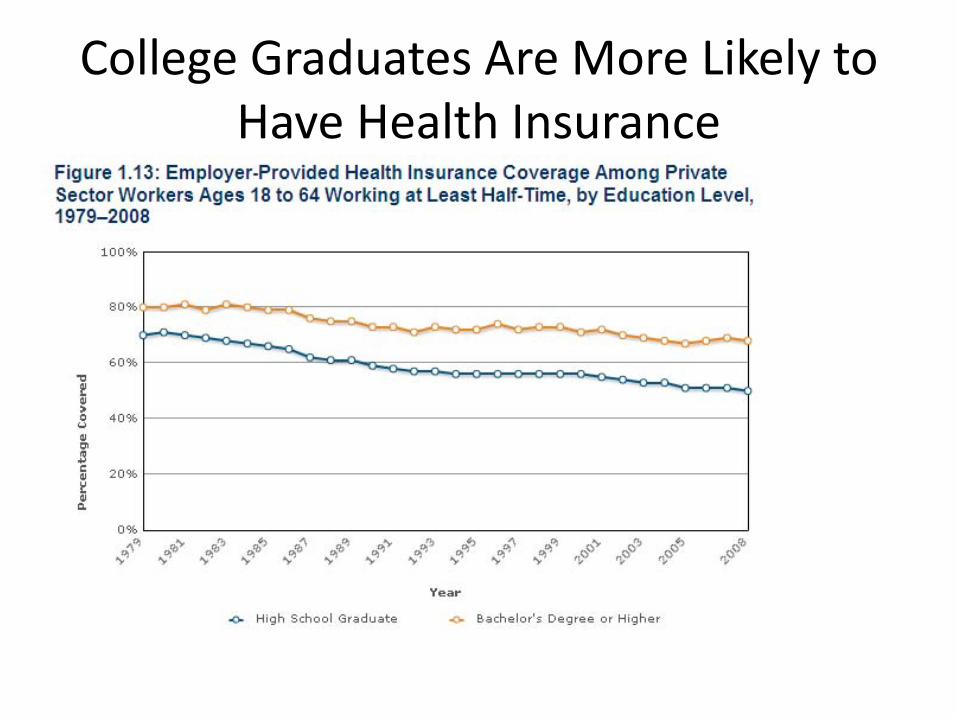
College Graduates Are More Likely to
Have Health Insurance
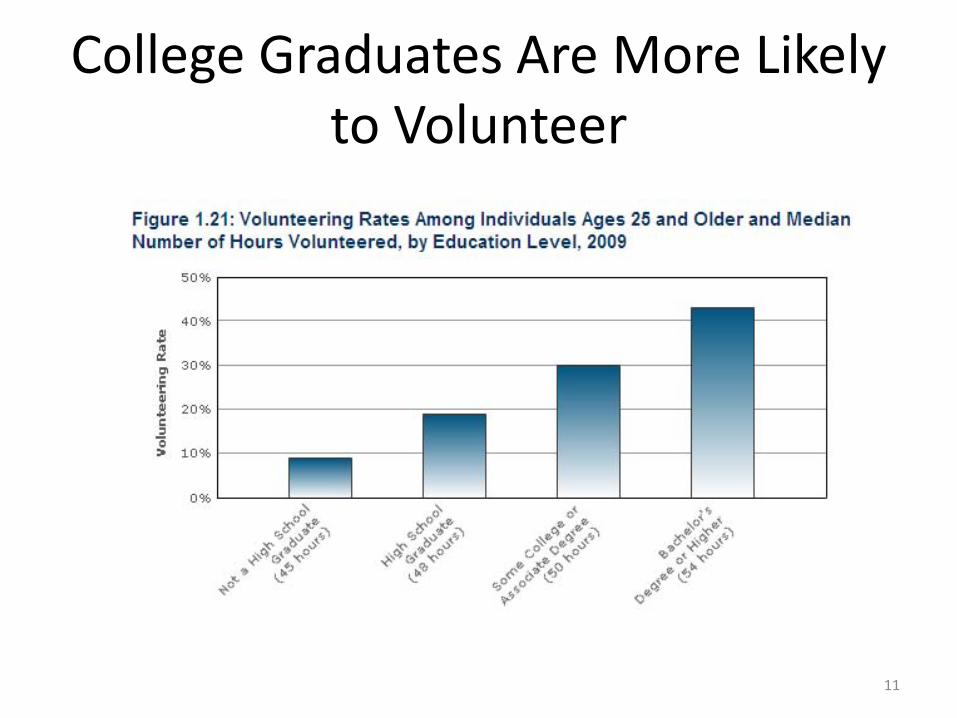
College Graduates Are More Likely to Volunteer
11
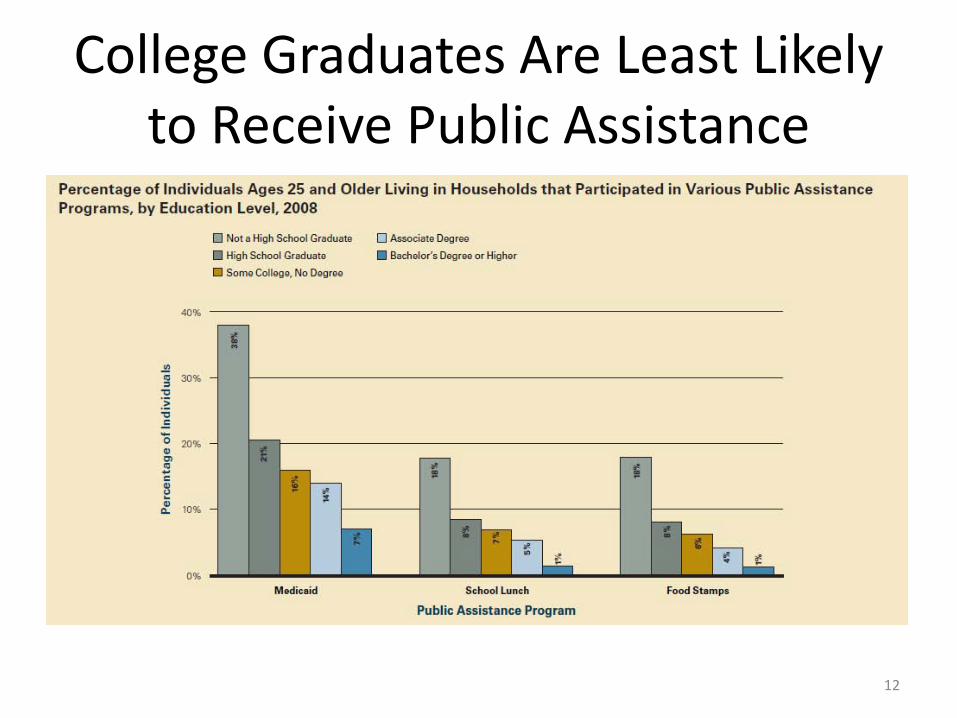
College Graduates Are Least Likely to Receive Public Assistance
12
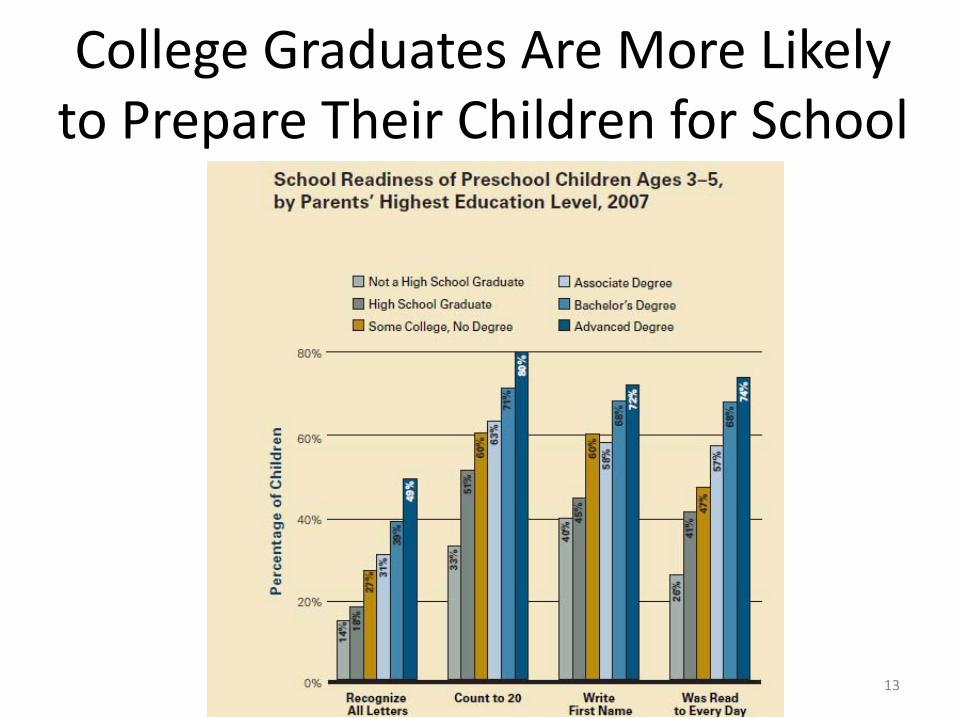
College Graduates Are More Likely to Prepare Their Children for School
13

1,000
3,000
5,000
7,000
9,000
11,000
13,000
15,000
2007-08 2000-01 2001-02 2002-03 2003-04 2004-05 2005-06 2006-07
1,717 2,004
2,982
5,889
9,155
12,101
Number of Oklahoma’s Promise Scholarship
Recipients
As of 10-20-10. Assumes 1% annual increases in OK Promise high school enrollment and 65% completion rate
of high school requirements for scholarship eligibility.
2008-09 2009-10
17,000
19,000
14,670
16,928
18,282
19,409
2010-11
20,900
2011-12
20,27521,000
15
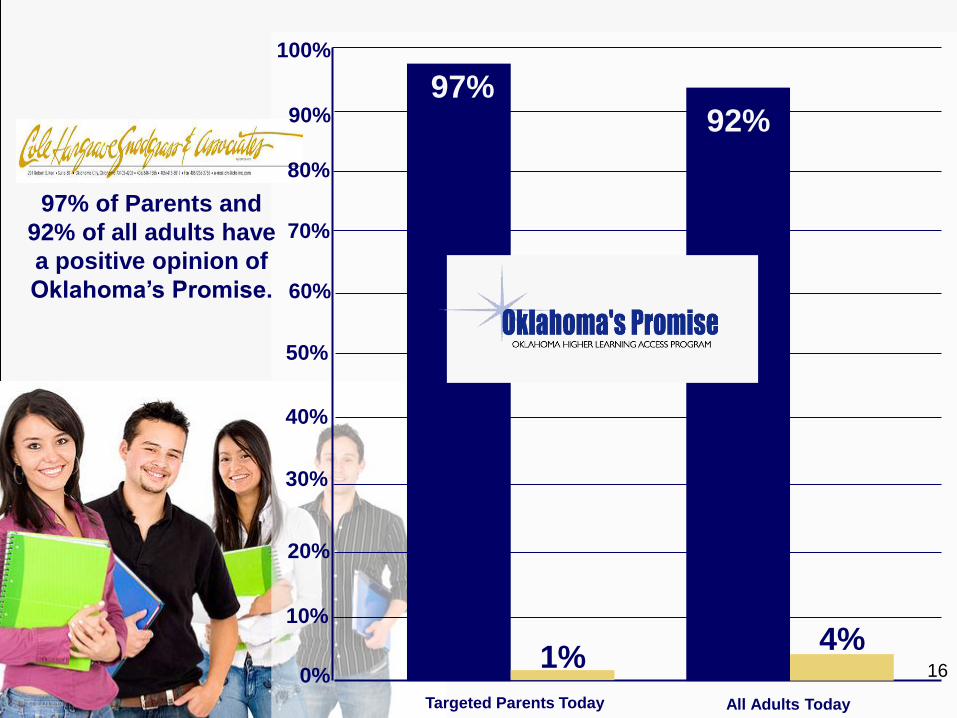
100%
90%
80%
97% of Parents and
92% of all adults have 70%
a positive opinion of
Oklahoma’s Promise. 60%
50%
40%
30%
20%
97% 92%
1% 4%
16
10%
0% Targeted Parents Today All Adults Today
25%
20%
15%
10%
5%
0%
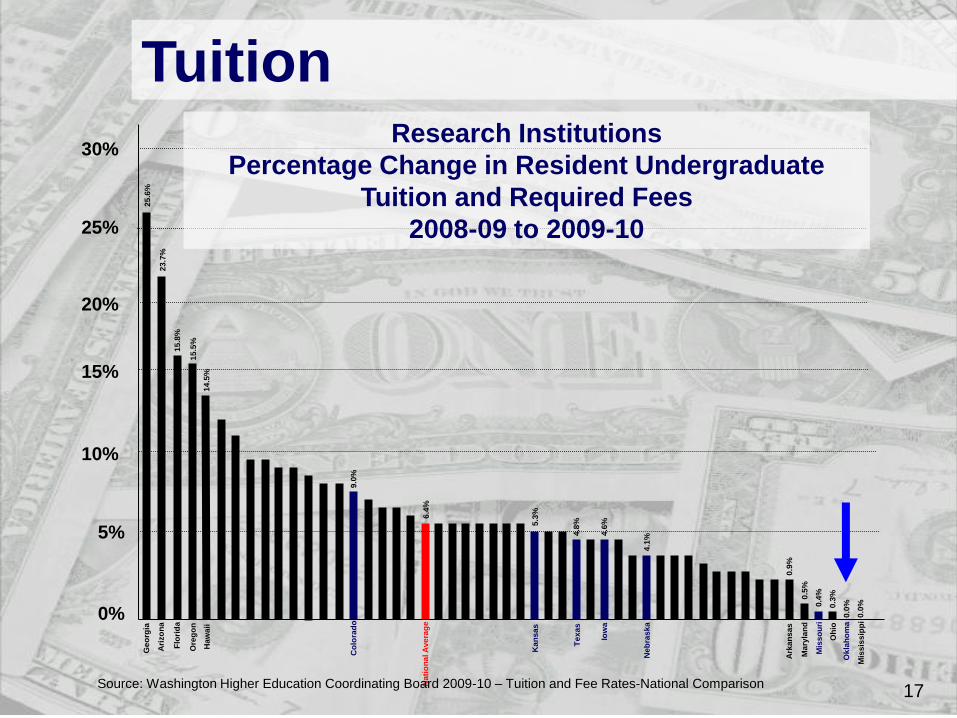
Tuition 2
5.6
%
23
.7%
15
.8%
15
.5%
14
.5%
30% Research Institutions
Percentage Change in Resident Undergraduate
Tuition and Required Fees
2008-09 to 2009-10
9.0
%
6.4
%
5.3
%
4.8
%
4.6
%
4.1
%
Ark
an
sa
s
0.9
%
Ma
ryla
nd
0
.5%
0.4
%
Mis
so
uri
0.3
%O
hio
Ok
lah
om
a 0
.0%
0.0
%
Mis
sis
sip
pi
Ge
org
ia
Ari
zo
na
Flo
rid
a
Ore
go
n
Haw
aii
Co
lora
do
Na
tio
na
l A
ve
rag
e
Kan
sa
s
Te
xa
s
Iow
a
Neb
ras
ka
Source: Washington Higher Education Coordinating Board 2009-10 – Tuition and Fee Rates-National Comparison 17

30%
25%
20%
15%
10%
5%
0%
Tuition G
eo
rgia
28
.7%
Cali
forn
ia2
6.2
%
Ari
zo
na
21
.3%
Wa
sh
ing
ton
14
.2%
13
.9%
F
lori
da
Co
lora
do
13
.1%
Na
tio
na
l A
ve
rag
e6
.7%
Te
xa
s6
.6%
Kan
sa
s
5%
6
.
4.4
%
Neb
ras
ka
Regional Universities
Percentage Change in Resident Undergraduate
Tuition and Required Fees
2008-09 to 2009-10
Source: Washington Higher Education Coordinating Board 2009-10 – Tuition and Fee Rates-National Comparison
4.1
%
Iow
a
Ark
an
sa
s
2.3
%
1.6
%O
hio
1.0
%M
on
tan
a
0.0
%M
iss
ou
ri
Mis
sis
sip
pi
0.0
%
0.0
%
Ok
lah
om
a
18
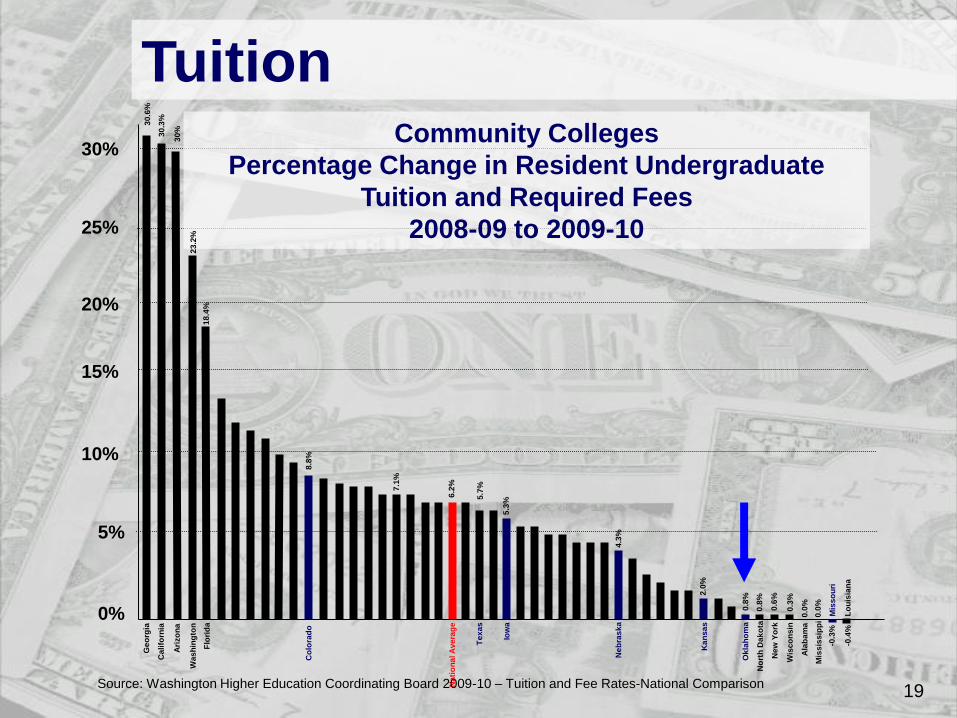
30%
25%
20%
15%
10%
5%
0%
Tuition 3
0.6
%
30
.3%
30
%
18
.4%
8.8
%
7.1
%
6.2
%
5.7
%
5.3
%
4.3
%
2.0
%
0.8
%
0.8
%
0.6
%
0.3
%
0.0
%
0.0
%
Mis
so
uri
Lo
uis
ian
a
Community Colleges
Percentage Change in Resident Undergraduate
Tuition and Required Fees
2008-09 to 2009-10
23
.2%
Ge
org
ia
Cali
forn
ia
Ari
zo
na
Wa
sh
ing
ton
Flo
rid
a
Co
lora
do
Na
tio
na
l A
ve
rag
e
Te
xa
s
Iow
a
Neb
ras
ka
Source: Washington Higher Education Coordinating Board 2009-10 – Tuition and Fee Rates-National Comparison
Ka
ns
as
Ok
lah
om
a
No
rth
Da
ko
ta
New
Yo
rk
Wis
co
ns
in
Ala
ba
ma
Mis
sis
sip
pi
-0.3
%
-0.4
%
19
20
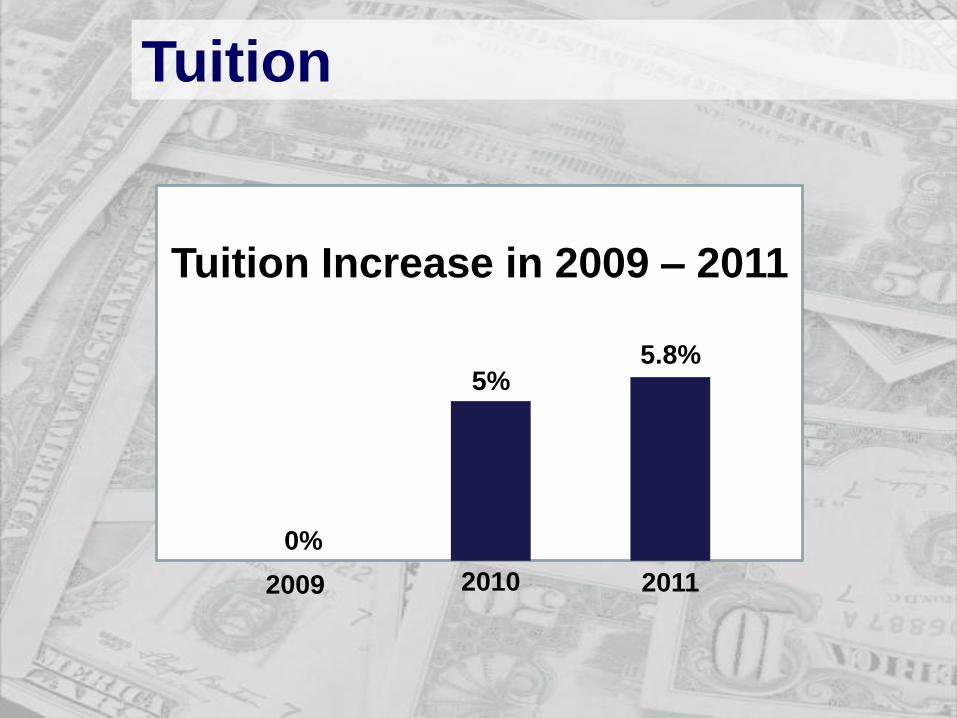
Tuition
5% 5.8%
Tuition Increase in 2009 – 2011
0%
2009 2010 2011

Percentage of the higher education budget paid with state appropriations:
Source: OSRHE, Educational and General Budgets Summary & Analysis, June 2010
100%
75.3% 75%
69.3%
49.5%50% 44.8% 44.7% 41%
25%
1988 1990 2008 2009 2010 2011

22
Budget Cuts
Total Appropriations for Operations
FY09-10 FY10-11 FY11-12
-1.05% -5.80%
-6.28%
23
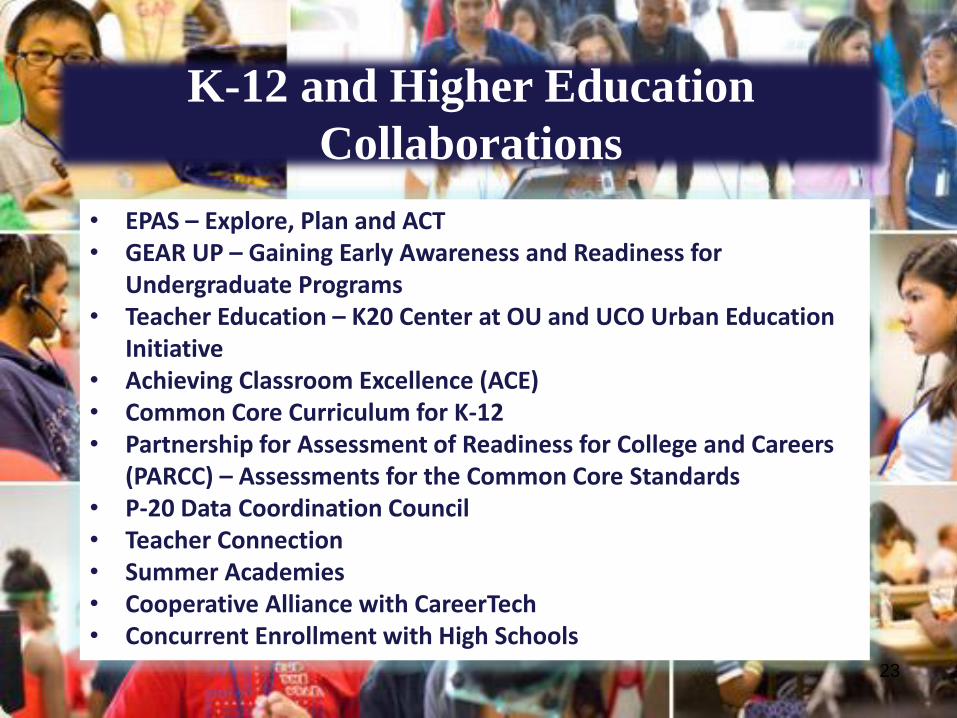
K-12 and Higher Education
Collaborations
• EPAS – Explore, Plan and ACT • GEAR UP – Gaining Early Awareness and Readiness for
Undergraduate Programs • Teacher Education – K20 Center at OU and UCO Urban Education
Initiative • Achieving Classroom Excellence (ACE) • Common Core Curriculum for K-12 • Partnership for Assessment of Readiness for College and Careers
(PARCC) – Assessments for the Common Core Standards • P-20 Data Coordination Council • Teacher Connection • Summer Academies • Cooperative Alliance with CareerTech • Concurrent Enrollment with High Schools
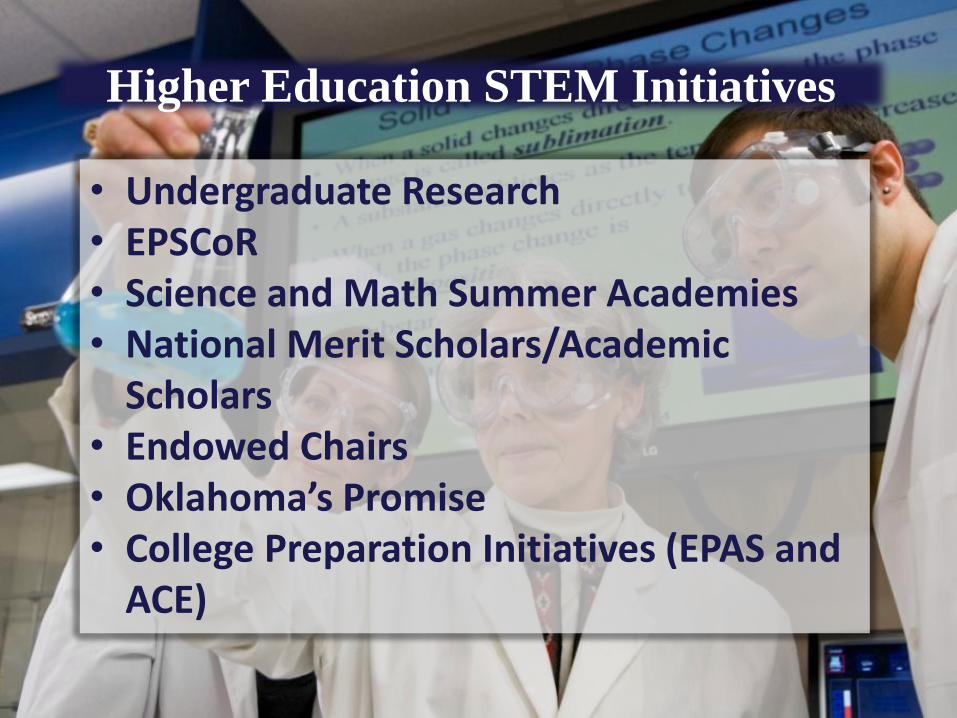
• Undergraduate Research • EPSCoR • Science and Math Summer Academies • National Merit Scholars/Academic
Scholars • Endowed Chairs • Oklahoma’s Promise • College Preparation Initiatives (EPAS and
ACE)
Higher Education STEM Initiatives
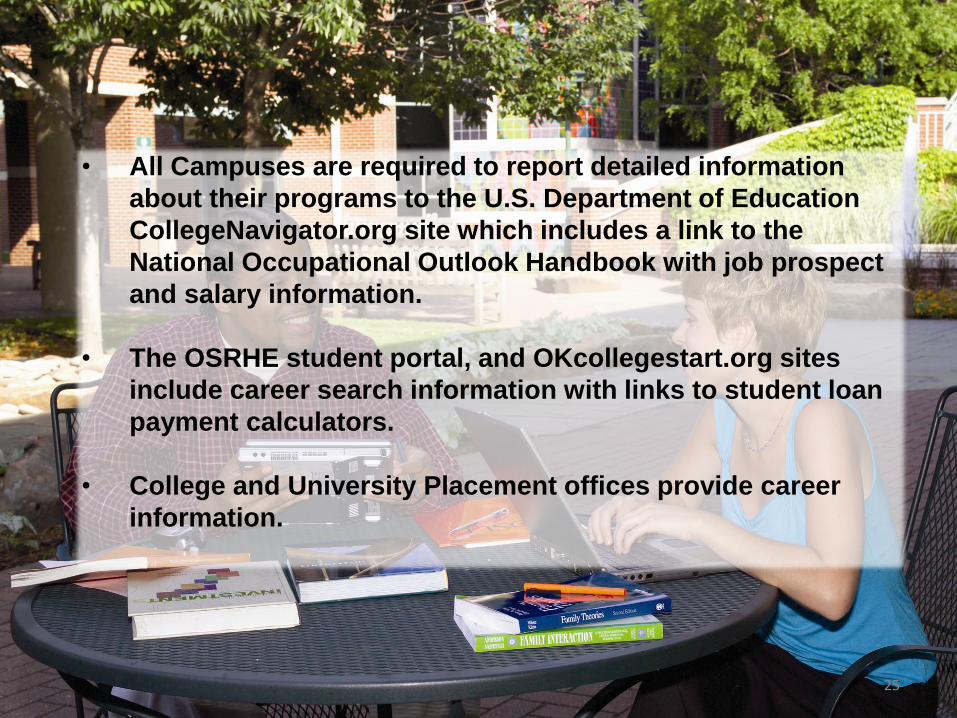
• All Campuses are required to report detailed information
about their programs to the U.S. Department of Education
CollegeNavigator.org site which includes a link to the
National Occupational Outlook Handbook with job prospect
and salary information.
• The OSRHE student portal, and OKcollegestart.org sites
include career search information with links to student loan
payment calculators.
• College and University Placement offices provide career
information.
25
Response to Market Needs
• The State Regents Program review for new and existing programs evaluate employer and student demand for the program.
• Low producing and low demand programs are deleted on average 34 programs per year since 2004-05 totaling over 241 programs deleted.
26
Link Academic Programs to the needs of Business
• Healthcare, Allied Health and Nursing
• Engineering • Aviation • Wind Turbine Technologies
27

Academic Scholars
38%
All
Sch
ola
rs
Okl
aho
ma
47%
No
n R
esi
de
nt
36%
All
Sch
ola
rs
Okl
aho
ma
16
%
42%
No
n R
esi
de
nt
45%
!cademic Scholar’s Program Graduates Employed in Oklahoma
73%
65%
Okl
aho
man
52%51%
All
Sch
ola
rs
All
Sch
ola
rs
Okl
aho
ma
Okl
aho
ma
26
%
No
n R
esi
den
t
30
%
59%
No
n R
esi
den
t
All
Sch
ola
rs
39
%
No
n R
esi
de
nt
2002-03 2003-04 2004-05 2005-06 2006-07 28
18
%
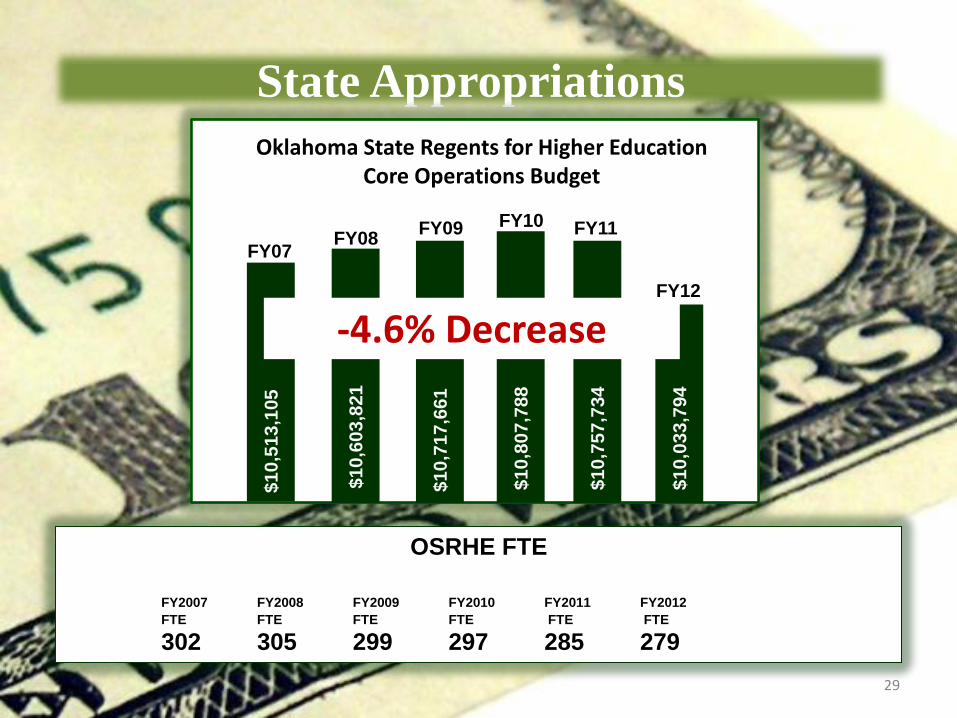
State Appropriations
29
OSRHE FTE
FY2007 FY2008 FY2009 FY2010 FY2011 FY2012
FTE FTE FTE FTE FTE FTE
302 305 299 297 285 279
Oklahoma State Regents for Higher Education Core Operations Budget
$1
0,5
13
,105
$1
0,6
03
,821
$1
0,7
17
,661
$1
0,8
07
,788
$1
0,7
57
,734
$10,0
33,7
94
FY07 FY08
FY09 FY10 FY11
FY12
-4.6% Decrease

Questions?
Tony Hutchison
30