presentation to the public utilities board of manitoba to the public utilities board of manitoba ......
TRANSCRIPT

Presentation to the Public Utilities Board of Manitoba
Manitoba Hydro GRAHearing Start Date: January 5, 2011

2
Presentation Summary
• Corporate Profile• Financial Update• General Rate Application• Rate Comparisons• Energy Conservation Programs• Risk Management• IFRS• Current Water Conditions

3
Corporate Profile at March 31, 2010• $2 billion annual revenue• $12 billion assets• 532 000 electricity customers• 264 000 natural gas customers• Exports to over 30 wholesale customers in USA &
Canada• Electricity rates the lowest in North America• Ranked #1 in Customer Satisfaction by CEA

4
Corporate Profile at March 31, 2010 (cont’d)
• 6 200 employees• A Top 100 Employer in Canada• Leader in Aboriginal employment• Ranked #1 in Safety by CGA• Power Smart Program one of the most aggressive in
North America

5
Financial Update

6
Consolidated Financial ResultsIncome Statement for the Fiscal Year Ended March 31 ($ millions)
2010 2009REVENUEElectric
Manitoba 1,172$ 1,161$ Extraprovincial 427 623
Gas 454 580 2,053 2,364
Cost of gas sold 316 431 1,737$ 1,933$
EXPENSESOperating and administrative 456 442 Finance expense 410 471 Depreciation and amortization 384 368 Water rentals and assessments 121 123 Fuel and power purchased 104 176 Capital and other taxes 99 87
1,574$ 1,667$
NET INCOME 163$ 266$

7
Consolidated Financial ResultsIncome Statement for the Six Months Ended September 30 ($ millions)
2010 2009REVENUEElectric
Manitoba 541$ 532$ Extraprovincial 236 223
Gas 97 123 874 878
Cost of gas sold 53 77 821$ 801$
EXPENSESOperating and administrative 230 222 Finance expense 219 226 Depreciation and amortization 200 193 Water rentals and assessments 56 58 Fuel and power purchased 58 43 Capital and other taxes 48 51
811$ 793$
NET INCOME 10$ 8$
8
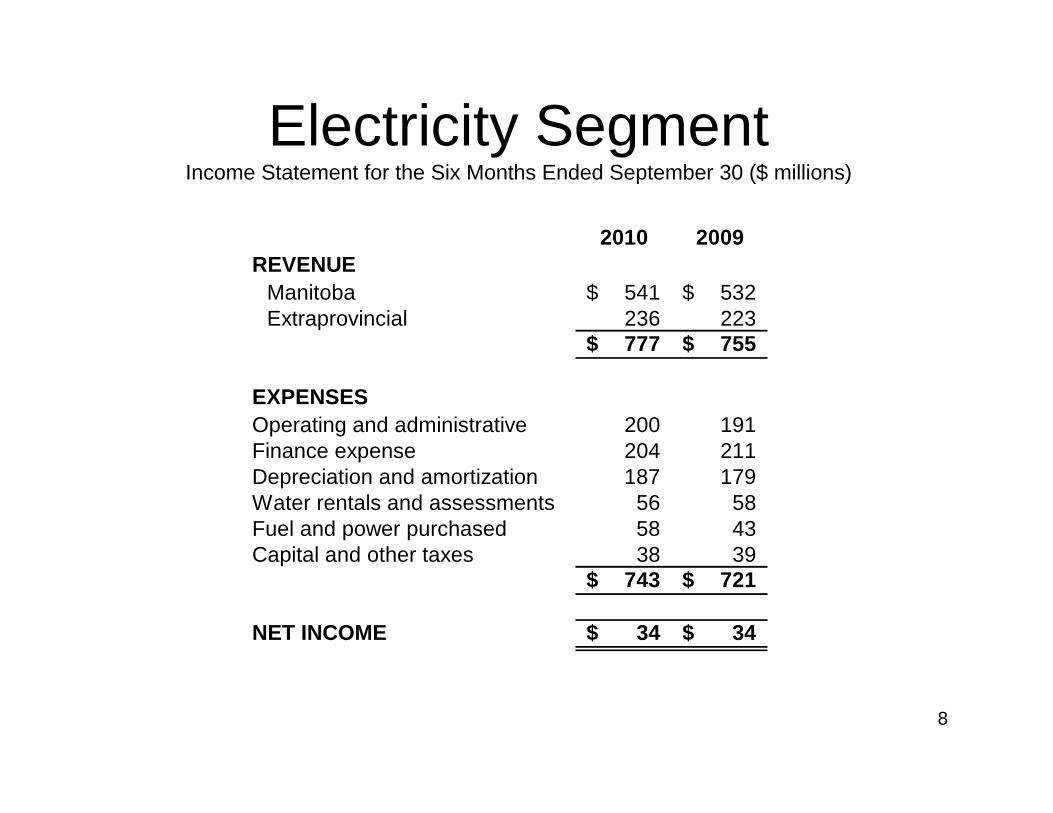
Electricity SegmentIncome Statement for the Six Months Ended September 30 ($ millions)
2010 2009REVENUE
Manitoba 541$ 532$ Extraprovincial 236 223
777$ 755$
EXPENSESOperating and administrative 200 191 Finance expense 204 211 Depreciation and amortization 187 179 Water rentals and assessments 56 58 Fuel and power purchased 58 43 Capital and other taxes 38 39
743$ 721$
NET INCOME 34$ 34$

9
Key Financial Results

10
Financial Targets
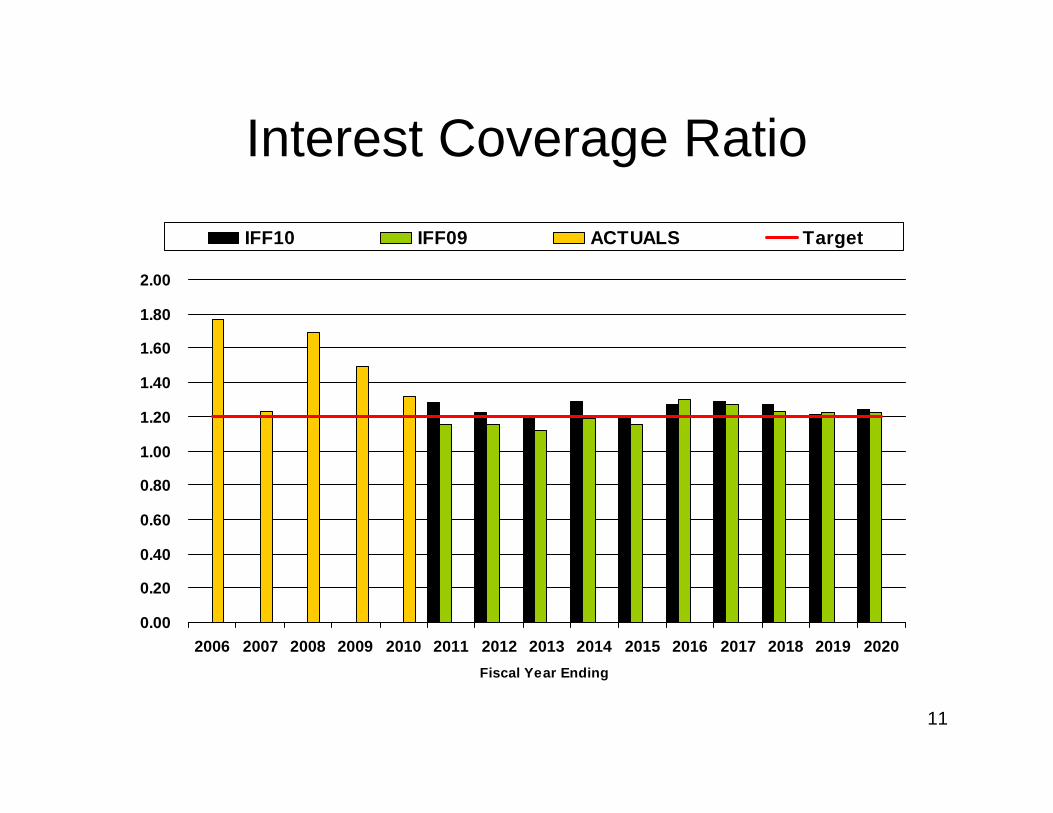
Interest Coverage: Maintain interest coverage ratio of > 1.20
Capital Coverage:Maintain capital coverage ratio of > 1.20
Debt/Equity:Maintain minimum debt/equity ratio of 75:25
Note: Financial targets may not be maintained during years of major investment in the generation and transmission system.
11
Interest Coverage Ratio
0.00
0.20
0.40
0.60
0.80
1.00
1.20
1.40
1.60
1.80
2.00
2006 2007 2008 2009 2010 2011 2012 2013 2014 2015 2016 2017 2018 2019 2020Fiscal Year Ending
IFF10 IFF09 ACTUALS Target

12
Capital Coverage Ratio
0.00
0.50
1.00
1.50
2.00
2.50
2006 2007 2008 2009 2010 2011 2012 2013 2014 2015 2016 2017 2018 2019 2020Fiscal Year Ending
IFF10 IFF09 ACTUALS Target

13
Equity Ratio
0%
5%
10%
15%
20%
25%
30%
2006 2007 2008 2009 2010 2011 2012 2013 2014 2015 2016 2017 2018 2019 2020Fiscal Year Ending
IFF10 IFF09 ACTUALS Target

14
Equity Ratio 20 Year Outlook
0%
5%
10%
15%
20%
25%
30%
35%
40%
2011
2012
2013
2014
2015
2016
2017
2018
2019
2020
2021
2022
2023
2024
2025
2026
2027
2028
2029
2030
Fiscal Year Ending

15
Capital Coverage
1.10
0.77
0.24
1.30
0.0
0.5
1.0
1.5
2.0
2.5
Equity
0.27
0.08
0.26
0.37
0.00
0.10
0.20
0.30
0.40
0.50
Interest Coverage
1.32
2.17
1.58
1.96
0.0
0.5
1.0
1.5
2.0
2.5
MB Hydro Mar 10
Hydro Quebec Dec 09
BC Hydro Mar 10NB Power Mar 08
Financial Ratios Comparison
16
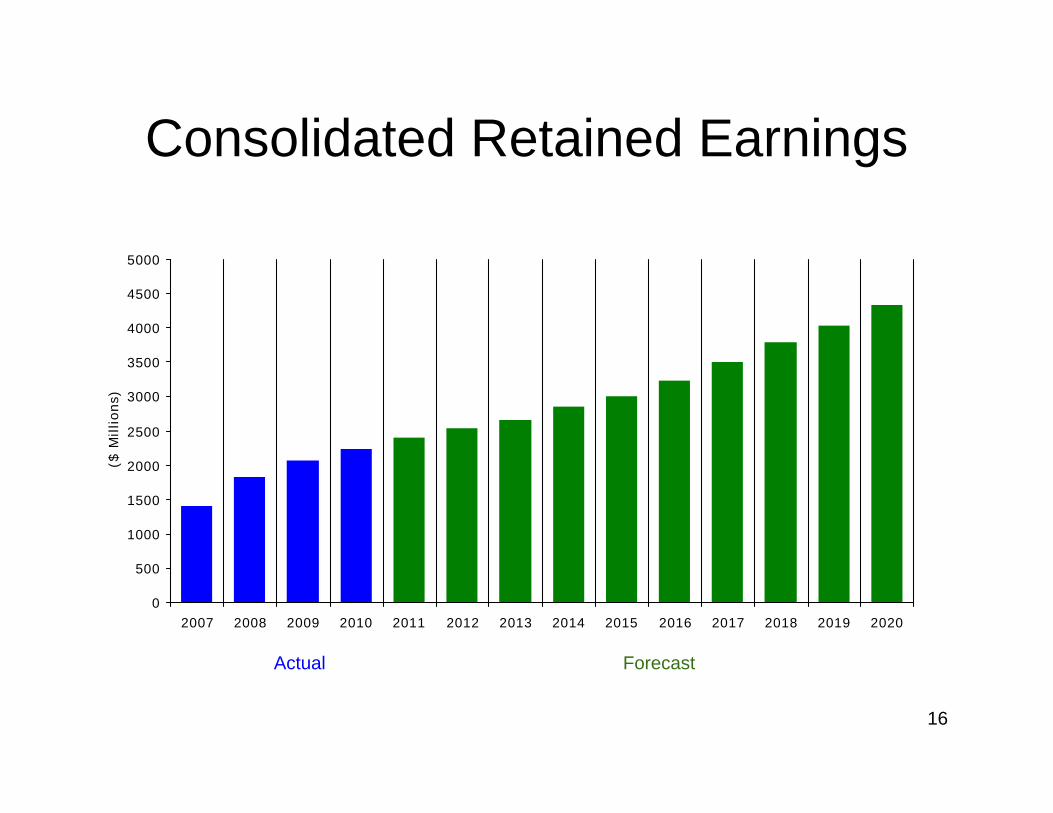
Consolidated Retained Earnings
0
500
1000
1500
2000
2500
3000
3500
4000
4500
5000
2007 2008 2009 2010 2011 2012 2013 2014 2015 2016 2017 2018 2019 2020
($ M
illions)
Actual Forecast

17
2010/11 Power Resource Plan
• 138 MW St. Joseph wind power 2010/11 to 2011/12• Wuskwatim (200 MW) first power 2011/12• Bipole III 2017/18• 695 MW Keeyask first power 2019/20 • New US interconnection 2019/20• 1 485 MW Conawapa first power 2023/24 • Pointe du Bois spillway replacement 2014/15

18
Operating & Administrative
$0
$100
$200
$300
$400
$500
$600
$700
2005 2006 2007 2008 2009 2010 2011 2012 2013 2014 2015 2016 2017 2018 2019 2020Fiscal Year Ending
Mill
ions
of D
olla
rs
IFF10 IFF09 ACTUALS

19
Operating, Maintenance & Administrative Costs
For the years ending March 31 ($ millions)
CompoundedAverage
2005/06 2006/07 200708 2008/09 2009/10 2010/11 2011/12 Annual Increase
Consolidated OM&A 375$ 386$ 391$ 442$ 456$ 476$ 482$ 4.3%Less:
Centra Gas (53) (54) (56) (60) (61) (63) (64) Subsidiaries (11) (9) (12) (18) (17) (15) (16)
Electric OM&A 311 323 323 364 378 398 402 4.4%
Less Accounting Changes:CICA Changes (10) (13) (13) (13) Reclassifications (3) 2 2 (3) Provision for Acct. Changes (18) (14)
Net Electric OM&A after Accounting Changes 311$ 323$ 323$ 351$ 367$ 369$ 372$ 3.0%
Year over Year % Increase Net of Acctg Changes 4.1% -0.2% 8.9% 4.3% 0.6% 0.9%CPI 2.3% 1.4% 1.2% 1.4% 2.0% 2.0% 1.7%
Actuals Forecast

20
2009/10 OM&AOffice and Building Services
5%
Other 1%
External Services 5%
Materials & Equip Maintenance 6%
Travel and Motor Vehicle 8%
Salaries, Overtime and Benefits 75%
Salaries, Overtime and benefits
Travel and Motor Vehicle
Materials & Equip Maintenance
External Services
Office and Building services
Other

21
Cost Constraint Measures
• Travel restrictions• Hiring freeze• Overtime reductions• Computer life extensions• Fleet reductions• New IT systems

22
Manitoba Hydro Workforce Demographics
Equity Demographics at November 30, 2000
Male ND, 68.8%
Aboriginal, 7.4%
Women, 20.8%
Disability, 2.9%
Vis Minority, 3.1%
Equity Demographics at November 30, 2010
Male ND, 57.3%
Aboriginal, 15.4%
Women, 24.4%
Disability, 4.8%
Vis. Minority, 5.6%

23
General Rate Application

24
General Rate Application
a) 2.8% increase effective April 1, 2010
b) 2.9% increase effective April 1, 2011
c) Final approval of SEP ex parte Orders
d) Final approval of CRP ex parte Order
e) Final approval of Billing Demand Concessions

25
Residential Rates
Interim Approved
April 1, 2010Proposed
April 1, 2011
Basic Charge 6.85$ 6.85$
Energy Charge:First 900 kWh 6.38 ¢ 6.52 ¢Balance kWh 6.57 ¢ 6.84 ¢
26
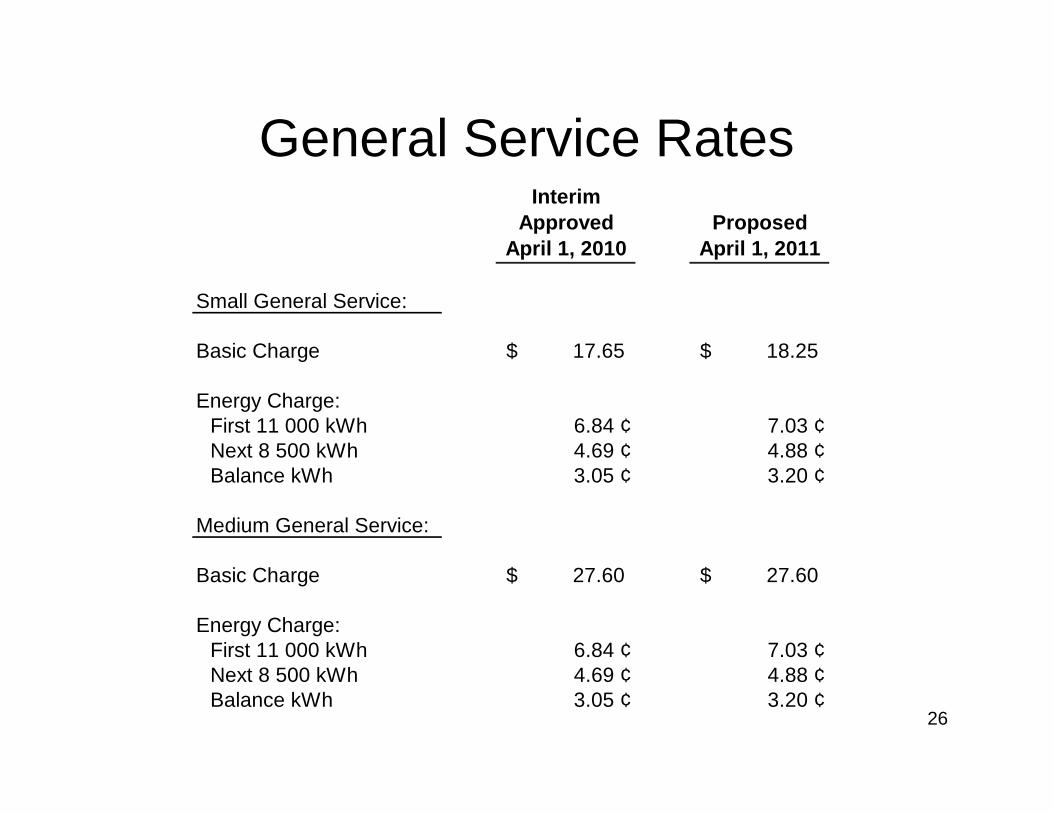
General Service RatesInterim
Approved April 1, 2010
Proposed April 1, 2011
Small General Service:
Basic Charge 17.65$ 18.25$
Energy Charge:First 11 000 kWh 6.84 ¢ 7.03 ¢Next 8 500 kWh 4.69 ¢ 4.88 ¢Balance kWh 3.05 ¢ 3.20 ¢
Medium General Service:
Basic Charge 27.60$ 27.60$
Energy Charge:First 11 000 kWh 6.84 ¢ 7.03 ¢Next 8 500 kWh 4.69 ¢ 4.88 ¢Balance kWh 3.05 ¢ 3.20 ¢
27
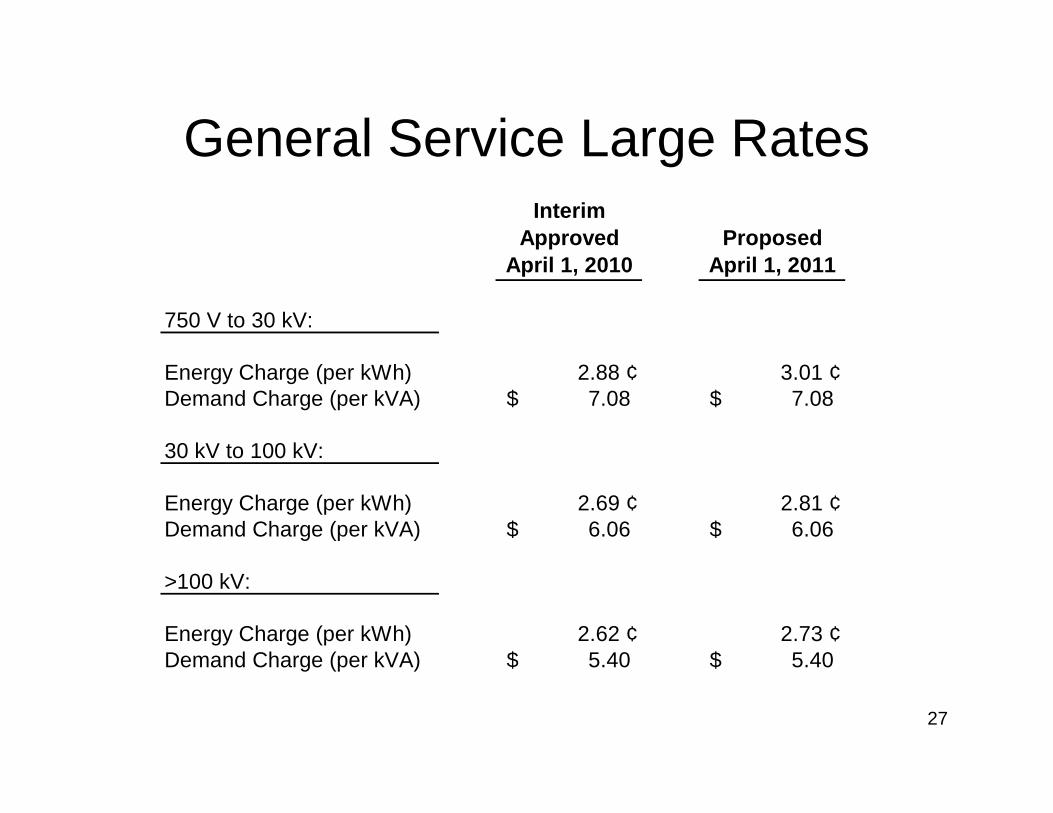
General Service Large RatesInterim
Approved April 1, 2010
Proposed April 1, 2011
750 V to 30 kV:
Energy Charge (per kWh) 2.88 ¢ 3.01 ¢Demand Charge (per kVA) 7.08$ 7.08$
30 kV to 100 kV:
Energy Charge (per kWh) 2.69 ¢ 2.81 ¢Demand Charge (per kVA) 6.06$ 6.06$
>100 kV:
Energy Charge (per kWh) 2.62 ¢ 2.73 ¢Demand Charge (per kVA) 5.40$ 5.40$
28
Rate Comparisons

29
5.445.72
6.306.51
6.67 6.68 6.72
7.297.41 7.43
4.55.05.56.06.57.07.58.0
Manito
ba
British
Colu
mbia
Wyo
ming
Quebec
Kentuck
y
Wash
ington
Idaho
Utah
North Dak
ota
West
VirginiaC
ents
/ kW
.h (C
anad
ian)
Average Retail Price of ElectricityTen Lowest Cost Provinces/ States in North America
Source: US Dept of Energy (May 2010) & Edison Electric Survey (January 2010)(Exchange rate = 1.0279)
30
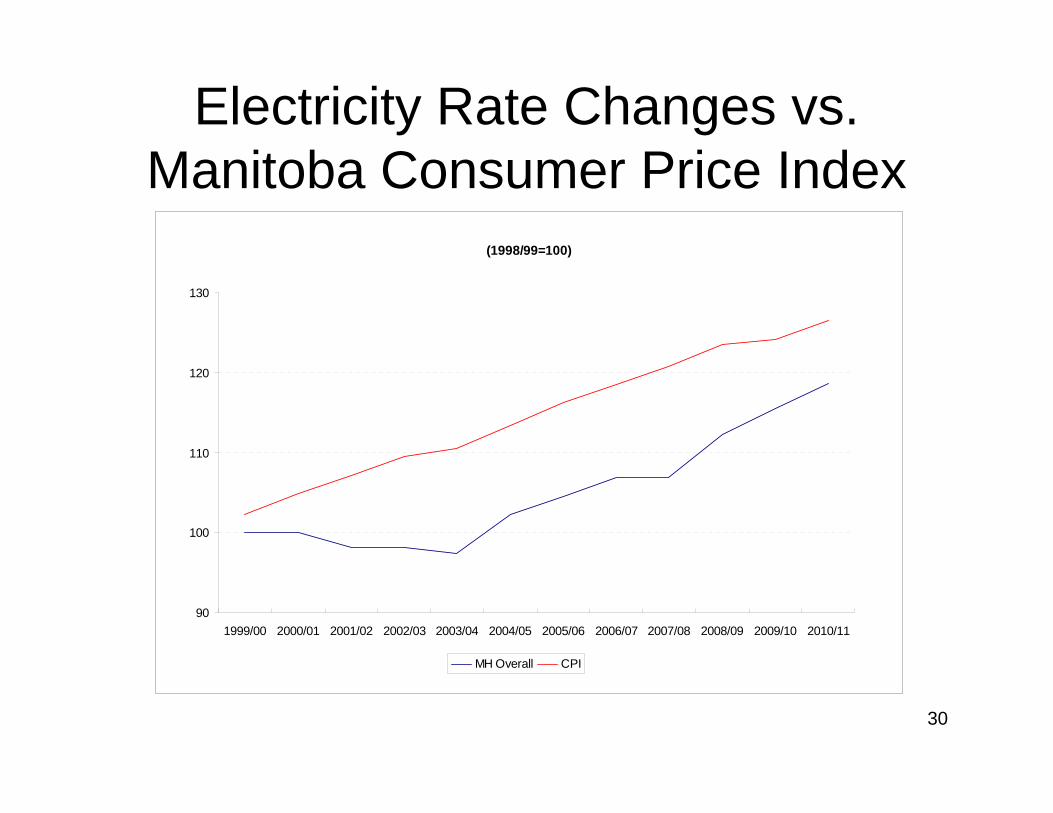
Electricity Rate Changes vs. Manitoba Consumer Price Index
(1998/99=100)
90
100
110
120
130
1999/00 2000/01 2001/02 2002/03 2003/04 2004/05 2005/06 2006/07 2007/08 2008/09 2009/10 2010/11
MH Overall CPI

31
24.0%
23.3%
23.7%
12.2%
25.4%
13.5%
CumulativeIncreases
4.9%
8.7%
6.9%
5.3%
1.5%
0.0%
2006
4.2%
3.8%
5.9%
1.9%
2.1%
2.2%
2007
0%
0%
3.0%
2.9%
2.8%
5.0%
2008
8.5%
9.3%
3.0%
1.2%
9.7%
2.9%
2009
4.5%
0%
3.0%
0.4%
7.3%
2.8%
2010
SaskPower
Nova Scotia Power
New Brunswick Power
Hydro Quebec
BC Hydro
Manitoba Hydro
155%
186%
174%
113%
119%
100%
Current Rates Index
Utility Rate Changes

32
Energy Conservation
Programs

33
Power Smart
• Manitoba Hydro recognizes that energy conservation is one of the most cost effective and environmentally friendly alternatives for meeting demand
• The Canadian Energy Efficiency Alliance (CEEA) recently provided Manitoba with an “A+” rating for its efforts to achieve Energy Efficiency– 4th consecutive report card that Manitoba has either led or
been tied for first place in the national rating

34
Power Smart – Future Action
• The 2010 Power Smart Plan involves a 15 year $572 million investment which targets an additional:– 2,133 GW.h of Conserved Electricity– 106 million cubic metres of Conserved Natural Gas
• Including savings to date, by 2024/25 over $950 million invested to achieve an aggregate:– 3,408 GW.h of Conserved Electricity– 149 million cubic metres of conserved natural gas
35
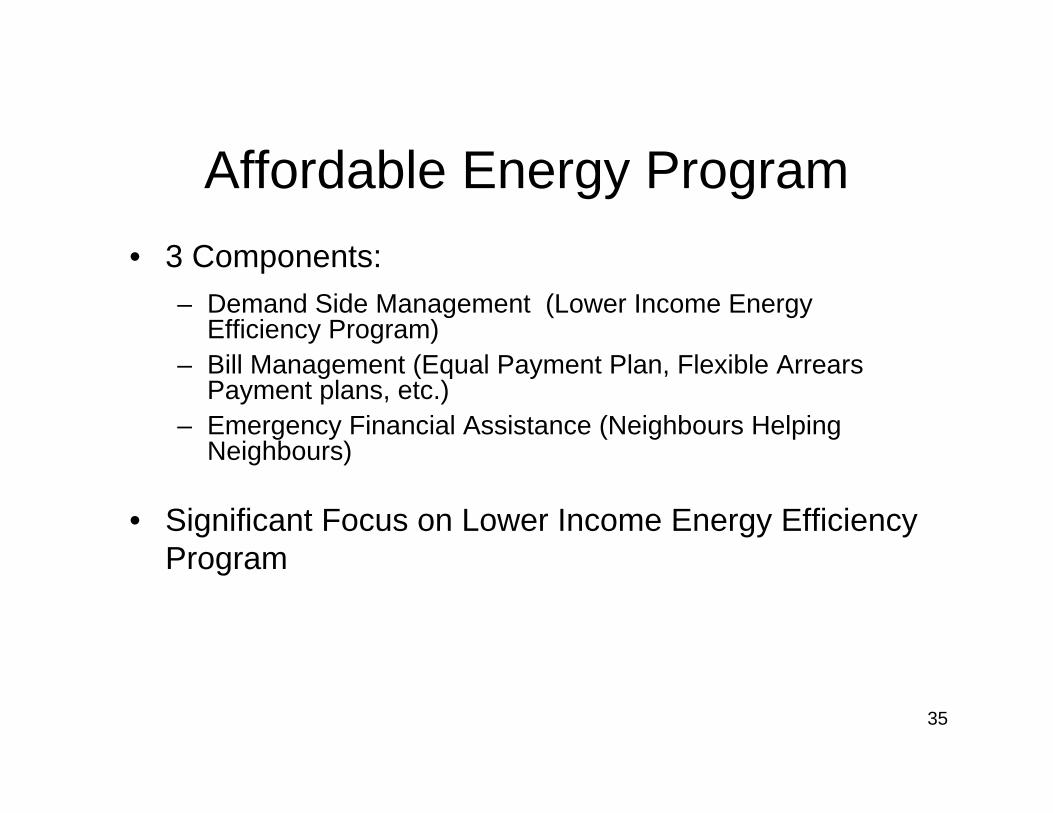
Affordable Energy Program• 3 Components:
– Demand Side Management (Lower Income Energy Efficiency Program)
– Bill Management (Equal Payment Plan, Flexible Arrears Payment plans, etc.)
– Emergency Financial Assistance (Neighbours Helping Neighbours)
• Significant Focus on Lower Income Energy Efficiency Program

36
Lower Income Energy Efficiency Program
• Launched December 2007
• Over 2600 Initial In-home reviews completed:– Approximately 1700 retrofitted with insulation and other
measures– Approximately 1100 high efficient furnaces installed
• Participation Lower Than Expected, however awareness is increasing and Manitoba Hydro continues to:– Work with partners and stakeholders to increase
participation– Aggressively promote the program

37
Risk Management

38
Immediate and Emerging Risks
• Economic Downturn• Major Capital Expansion Plan• Export Power Contracts• Whistleblower• Shale Gas• Regulatory Burden• Generation Development Sequence
39
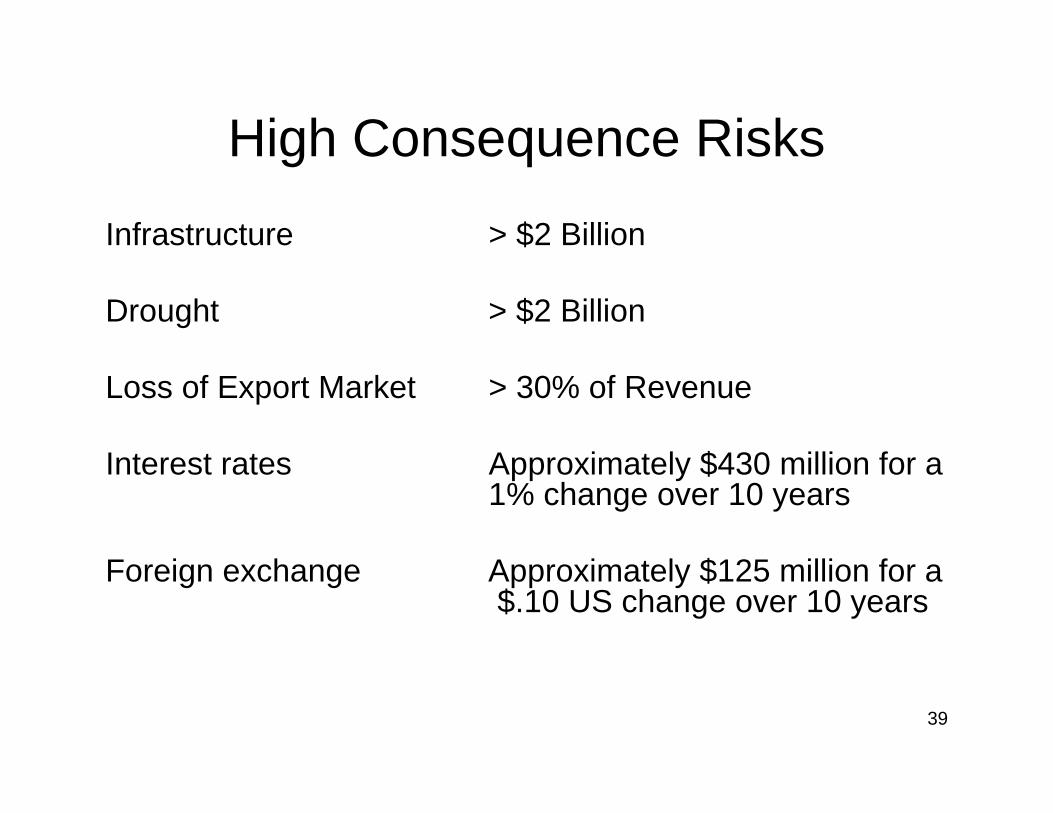
High Consequence Risks
Infrastructure > $2 Billion
Drought > $2 Billion
Loss of Export Market > 30% of Revenue
Interest rates Approximately $430 million for a 1% change over 10 years
Foreign exchange Approximately $125 million for a $.10 US change over 10 years
40
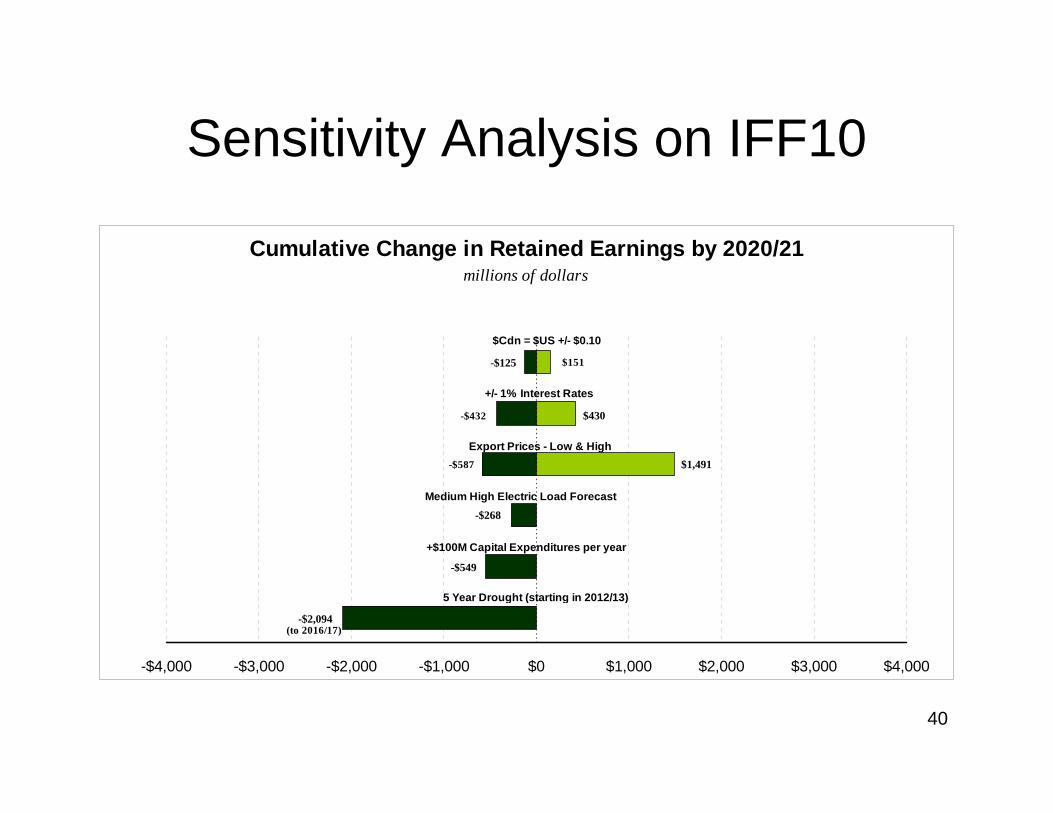
Sensitivity Analysis on IFF10
Cumulative Change in Retained Earnings by 2020/21millions of dollars
-$2,094
-$549
-$268
-$587 $1,491
-$432 $430
-$125 $151
-$4,000 -$3,000 -$2,000 -$1,000 $0 $1,000 $2,000 $3,000 $4,000
$Cdn = $US +/- $0.10
+/- 1% Interest Rates
Export Prices - Low & High
5 Year Drought (starting in 2012/13)
Medium High Electric Load Forecast
+$100M Capital Expenditures per year
(to 2016/17)

41
External Risk Reviews
• ICF• KPMG• PUB Independent Consultants

42
ICF Report Conclusions
• MH should be in the power export business based on the benefits provided to the ratepayers and the Province.
• Manitoba Hydro has developed sophisticated structures and capabilities to manage exports and hydro variability; these structures continue to develop and improve.
• MH has the lowest domestic electricity rates in Canada and North America in part because of exports. Export prices greatly exceed MH’s embedded generation costs, and the revenues are used to decrease domestic rates and/or to provide the financial wherewithal to withstand droughts without rate shocks.

43
ICF Report Conclusions (cont’d)
• Proposed new long-term contracts are expected to provide several types of benefits including lower MH rates than would otherwise be the case without the contracts.
• United States utilities are undertaking new transmission construction to facilitate MH exports. This export driven addition in new transmission can be used to support imports in the case of a drought worse than the worst-on-record.
• Hydroelectric development, combined with long-term firm contracts, is preferred for Manitoba as it avoids the risks involved in developing fossil power plants.

44
ICF Report Conclusions (cont’d)
• MH has a reasonable and adequate risk mitigation plan. Even in the event of a five-year drought, MH has plans to achieve an equity cushion sufficient to accommodate the reduced cash flow due to drought without having to raise rates.
• It is appropriate for MH to enter into long-term firm commitments for 20-30 years in the future in the manner in which MH is proposing.
• The prices proposed for long-term firm contracts appear reasonable and adequate, and MH pricing processes appear adequate.

45
ICF Report Conclusions (cont’d)
• The models used by MH (hydrological forecasting models) are similar to models used by other hydro-electric dependent companies.
• ICF considers MH’s quantification of risk exposure to drought to be reasonable.
• ICF concludes that MH’s risk mitigation strategy related to an extended drought is adequate, and helps meet a key goal of avoiding rate shocks.
46
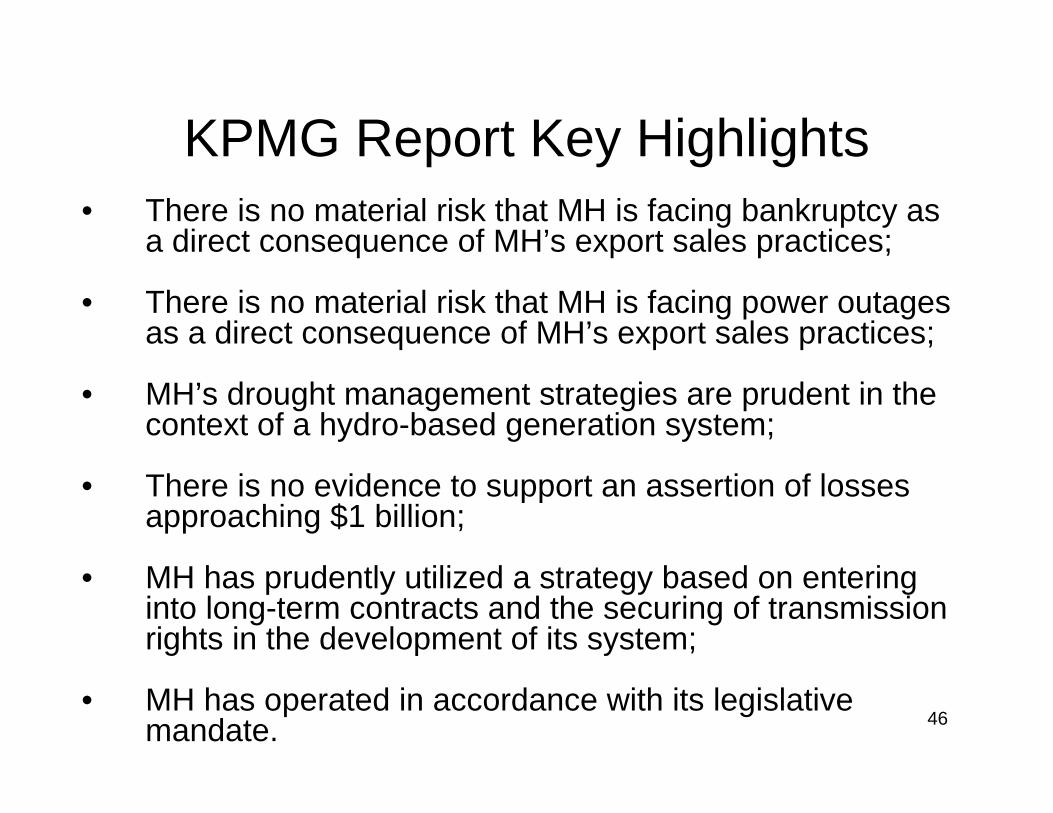
KPMG Report Key Highlights• There is no material risk that MH is facing bankruptcy as
a direct consequence of MH’s export sales practices;
• There is no material risk that MH is facing power outages as a direct consequence of MH’s export sales practices;
• MH’s drought management strategies are prudent in the context of a hydro-based generation system;
• There is no evidence to support an assertion of losses approaching $1 billion;
• MH has prudently utilized a strategy based on entering into long-term contracts and the securing of transmission rights in the development of its system;
• MH has operated in accordance with its legislative mandate.

47
IFRS
48
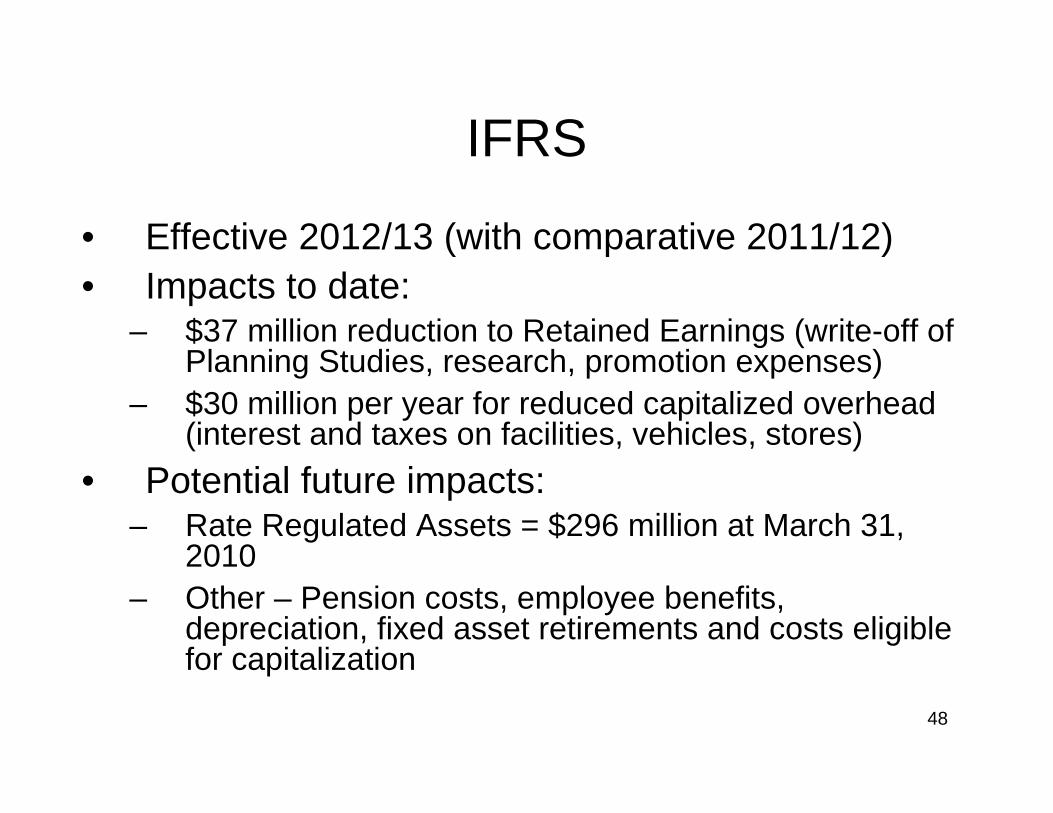
IFRS
• Effective 2012/13 (with comparative 2011/12)• Impacts to date:
– $37 million reduction to Retained Earnings (write-off of Planning Studies, research, promotion expenses)
– $30 million per year for reduced capitalized overhead (interest and taxes on facilities, vehicles, stores)
• Potential future impacts:– Rate Regulated Assets = $296 million at March 31,
2010– Other – Pension costs, employee benefits,
depreciation, fixed asset retirements and costs eligible for capitalization

49
Current Water Conditions

50
Historical Water Supply
0%
20%
40%
60%
80%
100%
120%
140%
160%
1920
1930
1940
1950
1960
1970
1980
1990
2000
2010
Fiscal Year Beginning
% o
f Ave
rage
2010/11

51
Daily Inflows

52
Total Energy in Reservoir StorageTotal Energy in Reservoir Storage
0
2
4
6
8
10
12
14
16
18
20
22
24
26
28
30
Jan Feb Mar Apr May Jun Jul Aug Sep Oct Nov Dec Jan
Month
Ener
gy (T
Wh)
1977-2008 2009 Average 2010
18.81 TWh - Actual12.51 TWh - Average6.31 TWh - Above Average

53
Total Hydraulic Generation
Total Hydraulic Generation
0.0
5.0
10.0
15.0
20.0
25.0
30.0
35.0
40.0
1992/9
3199
3/9419
94/95
1995/96
1996
/97199
7/98
1998
/99199
9/00
2000
/01200
1/02
2002
/03200
3/04
2004
/0520
05/06
2006/07
2007/0
8200
8/0920
09/10
2010/11
Fiscal Year
Gen
erat
ion
(100
0's
GW
h)
Actual Forecast