presentazione standard di powerpoint -...
TRANSCRIPT

21° Convegno della Sezione Componentistica ANIMP, 24
novembre 2015 1
Attachments

SEZIONE COMPONENTISTICA D’IMPIANTO ANIMP
2
Index:
LNG - Liquefaction Regasification Midstream Pipelines
Market trends : Oil & Gas Midstream

SEZIONE COMPONENTISTICA D’IMPIANTO ANIMP
3
Market Trends : LNG - Liquefaction
Outlook
• Global liquefaction capacity MTPA:
• Current: 289
• Expected in 2025 : 450 MTPA
• Huge list of proposed projects but high % of mortality due to:
• LNG demand increase over the next 10 years: less than 100 MTPA
• Risk of over-supply vs announced capacity increase - decrease of
LNG purchasing price in Far East
• Fall in oil & gas prices and overrun on recent megaprojects
• Stringent environment regulations/conflicts with local communities
• Financial weakness of some investors
• 2020 Asia Pacific (in particular Australia), Middle East and North
• Medium term capacity increase: mostly from Australia and US
• New large-scale plants in Canada and East Africa: between
2020-2025

SEZIONE COMPONENTISTICA D’IMPIANTO ANIMP
4
Market Trends : LNG - Liquefaction Overview by geographical area
Asia - Pacific • strongest CAPEX driver during the last few years • Australia:
• Project under construction: 50 MTPA increase by 2018
• High cost escalation – less attractiveness of future projects-no further capacity increase
North America • Largest worldwide Capex driver - expected growth (90
MTPA) between 2014 and 2025 • 5 major onshore liquefaction projects under
construction • More than 40 proposed projects (over 600 MTPA) but
only 15% expected in production by 2025 due to: • Reduced price differentials with oil – companies
announcing spending cuts • Market potentially over supplied • Construction cost/time for greenfield projects • Heavy environment regulations and conflicts with
local communities (Canada) • Significant pipeline infrastructure needed (Canada)
Africa • Significant gas resources in Mozambique/Tanzania • Large scale LNG expected between 2020-2025
(Mozambique) • Risks of executing large-scale projects:
• Undeveloped countries • Lack of infrastructure
Middle East • No more the largest liquefaction capacity area after
2020 • Expected 19% vs 33% of AsiaPacific and 20% of North
America
Russia • Significant gas resources close to Asian markets • LNG export liberalization in 2013 • Sanctions against Russia:
• Difficulties in finding partners/off takers/financing • Potential escalation: risk of sanctions on LNG
technology
• Gas pipelines development: often a better alternative • July 2015 statement: Vladivostok LNG no more a
priority
15%
20%
SEZIONE COMPONENTISTICA D’IMPIANTO ANIMP
5
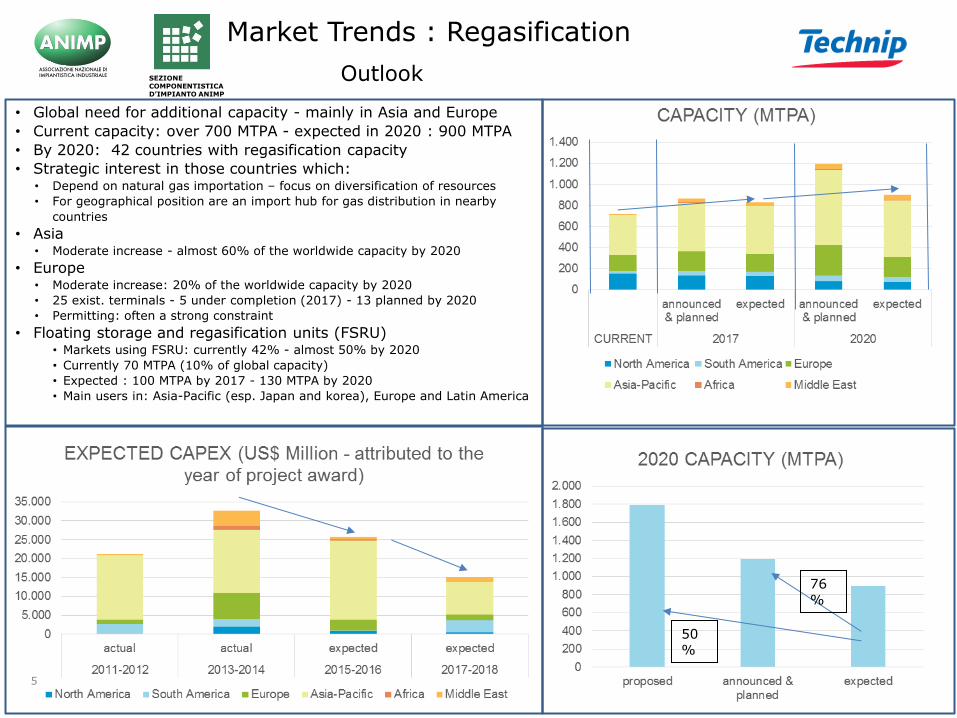
Market Trends : Regasification
Outlook
• Global need for additional capacity - mainly in Asia and Europe
• Current capacity: over 700 MTPA - expected in 2020 : 900 MTPA
• By 2020: 42 countries with regasification capacity
• Strategic interest in those countries which: • Depend on natural gas importation – focus on diversification of resources
• For geographical position are an import hub for gas distribution in nearby
countries
• Asia • Moderate increase - almost 60% of the worldwide capacity by 2020
• Europe • Moderate increase: 20% of the worldwide capacity by 2020
• 25 exist. terminals - 5 under completion (2017) - 13 planned by 2020
• Permitting: often a strong constraint
• Floating storage and regasification units (FSRU) • Markets using FSRU: currently 42% - almost 50% by 2020
• Currently 70 MTPA (10% of global capacity)
• Expected : 100 MTPA by 2017 - 130 MTPA by 2020
• Main users in: Asia-Pacific (esp. Japan and korea), Europe and Latin America
50%
76%

SEZIONE COMPONENTISTICA D’IMPIANTO ANIMP
6
Long terms: 2010-2040:
• global energy demand: expected 35% increase
• natural gas: 65% share of energy mix
• above trend driven by:
– non-OECD countries demand growth and technology advancements (e.g.in liquefied natural gas)
– investment in new infrastructure to support LNG and unconventional gas developments
Short terms: 2015 – 2018:
• limited growth due to:
– significant fall in oil prices
– lower-than-expected economic growth in Asia - unconventional production slowdown in North America
– progress of planned pipeline projects often affected by environmental and geopolitical issues
• onshore pipeline expenditure: US$170b between 2015 - 2018 vs $155b between 2011-2014 - increase limited to 10%
• 115,000 kilometers (km) of new oil and gas pipeline to be built between 2015-2018
• major investors: Gazprom, CNPC, TransCanada, Enbridge and Kinder Morgan
Market Trends : Midstreastream Pipelines
Outlook

SEZIONE COMPONENTISTICA D’IMPIANTO ANIMP
7
Market Trends : Midstreastream Pipelines
Overview by geographical Area
• EMEA: (Europe, Russia & former Soviet Union, except Turkmenistan, Kazakhstan and
Uzbekistan, Middle East and Africa):
• longest Oil and Gas Pipeline additions: 58,981 km of new pipelines (41% of the total
global planned) by 2018
• in Europe:
– new pipeline projects to provide access to natural gas from the Caspian and
Central Asia
– driving factor: diversification of gas sources to avoid over-dependence on Russian
gas supplies
– constraining factor: local communities negative attitude/permitting
• Americas (North America, South and Central America):
• 46,400 Km of new pipelines by 2018 ( 32% of the total global planned)
• In North America:
– driving factor: unconventional production growth
– constraining factor: local communities negative attitude/permitting
• Asia-Pacific:
• 39,321 km of new pipelines by 2018 (27% of the total global planned) - 87%
gas pipelines
• most of these, gas pipelines to be constructed in India, Georgia, China
(15.000km) and Australia.
• driving factor: need to secure energy for developing economies with rapidly
growing energy consumption
10%

21°Convegno Annuale Sezione
Componentistica d’Impianto ANIMP
STRATEGIE E PREVISIONI DI MERCATO
PER LA FILIERA DELL’IMPIANTISTICA INDUSTRIALE
“PACKAGES” PER L’IMPIANTISTICA:
UN COMPARTO AD ALTO POTENZIALE
SEZIONE COMPONENTISTICA D’IMPIANTO ANIMP
Grand Hotel Villa Torretta, Sesto
S.G. (Milano)
24 novembre 2015

MARKET TRENDS : PETROCHEMICALS
Dario Pirovano Senior Advisor Business Development
World Polymer Demand
Polyethylene (PE) - Global Demand
Polyethylene (PE) - Additional Production / Capacity
Polypropylene (PP) - Global Demand
Polypropylene (PP) - Additional Production / Capacity
Market Outlook
21° Convegno Sezione Componentistica ANIMP, 24 novembre 2015
21° Convegno Sezione
Componentistica ANIMP, 24
novembre 2015
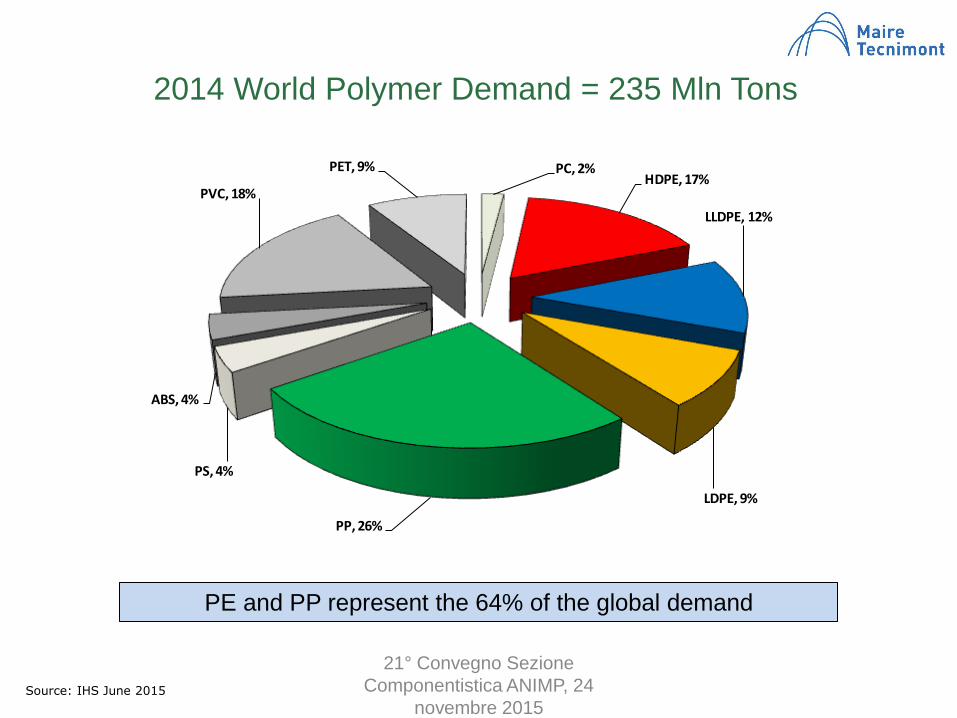
2014 World Polymer Demand = 235 Mln Tons
Source: IHS June 2015
PC, 2%HDPE, 17%
LLDPE, 12%
LDPE, 9%
PP, 26%
PS, 4%
ABS, 4%
PVC, 18%
PET, 9%
PE and PP represent the 64% of the global demand

21° Convegno Sezione
Componentistica ANIMP, 24
novembre 2015
Polyethylene (PE) – Global Demand
SOUTHEAST ASIA, 8%
AFRICA ME, 11%
INDIAN SUBCON, 5%
NAM, 18%
SAM, 6%EUR, 19%
NORTH EAST ASIA, 33%
2014 Global Demand : 84.7 mln tons
SOUTHEAST ASIA, 8%
AFRICA ME, 11%
INDIAN SUBCON, 6%
NAM, 17%
SAM, 6%EUR, 16%
NORTH EAST ASIA, 36%
2019 Global Demand: 105.7 mln tons
Source: IHS June 2015
Area CAGR
SOUTHEAST ASIA 4.5%
AFRICA ME 4.5%
INDIAN SUBCON 8.4%
NAM 3.3%
SAM 4.5%
EUR 1.0%
NORTH EAST ASIA 6.4%
Global Average 4.7%
21° Convegno Sezione
Componentistica ANIMP, 24
novembre 2015
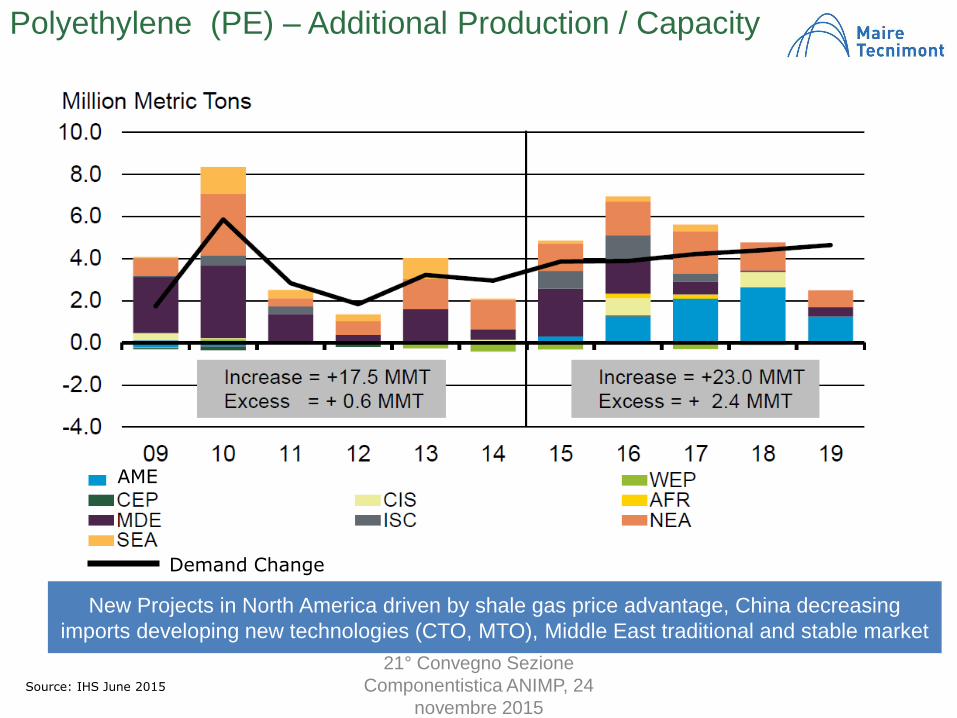
Polyethylene (PE) – Additional Production / Capacity
Source: IHS June 2015
Demand Change
AME
New Projects in North America driven by shale gas price advantage, China decreasing
imports developing new technologies (CTO, MTO), Middle East traditional and stable market

21° Convegno Sezione
Componentistica ANIMP, 24
novembre 2015
Polypropylene (PP) – Global Demand
Source: IHS June 2015
China, 33%
NE Asia, 7%
SE Asia, 8%NAM, 12%
SAM, 5%
EUR, 18%
MDE AFRICA, 10%
INDIAN SUBCON, 7%
China, 37%
NE Asia, 7%
SE Asia, 8%
NAM, 11%
SAM, 4%
EUR, 15%
MDE AFRICA, 10%
INDIAN SUBCON, 8%
2014 Global Demand : 58.8 mln tons 2019 Global Demand: 75.1 mln tons
Area CAGR
China 7.45%
NE Asia 5.02%
SE Asia 5.02%
NAM 3.20%
SAM 0.43%
EUR 1.25%
MDE AFRICA 5.02%
INDIAN SUBCON 7.86%
Global Average 4.40%

21° Convegno Sezione
Componentistica ANIMP, 24
novembre 2015
Polypropylene (PP) - Additional Production / Capacity
Source: IHS June 2015
New Projects mainly in China; CIS to growth in PP market; Middle East facing shortage of
ethane

PP AND PE DEMAND EXPECTED TO GROW 4.4% AND 4.7% PER YEAR RESPECTIVELY, MUCH
HIGHER THAN WORLD GDP GROWTH (3.6% IN 2016)
START UP IN 2015-2017 OF NEW PLANTS IN USA, CHINA, RUSSIA AND MIDDLE EAST WILL ADD
SIGNIFICANTLY INSTALLED CAPACITY ( SHALE GAS IN USA, COAL AND PDH IN CHINA,
TRADITIONAL FEEDSTOCK IN ME)
NEW INVESTMENTS UNCERTAIN DUE TO :
TEMPORARY OVER CAPACITY TILL 2017
SLOW DOWN OF ECONOMY GROWTH IN CHINA (MAJOR CONSUMER) AND OIL
PRODUCING COUNTRIES (CIS, BRAZIL, MIDDLE EAST) SUFFERING SHORTAGE OF CASH
FOR LOW OIL PRICE
POLITICAL INSTABILITY IN MENA
EFFECT OF SANCTIONS IN RUSSIA AND IRAN
IN THE SHORT/MEDIUM TERMS NEW PROJECTS IN COUNTRIES OF RELATIVELY NEW
PETROCHEMICAL INDUSTRIALIZATION SUCH AS OMAN, MALAYSIA, AZERBAIJAN,
KAZAKHSTAN, AND NEW EMERGING MARKETS IN SOUTH AMERICA AND AFRICA
SOME OPPORTUNITIES OF NEW PROJECTS IN EUROPE AS REPLACEMENT OR
MODERNIZATION OF OLD PLANTS
IN MEDIUM LONG TERM SECOND WAVE OF NEW PETROCHEMICAL PROJECTS IN USA, RUSSIA
AND CHINA
21° Convegno Sezione
Componentistica ANIMP, 24
novembre 2015
MARKET OUTLOOK

21°Convegno Annuale
Sezione Componentistica d’Impianto ANIMP
STRATEGIE E PREVISIONI DI MERCATO
PER LA FILIERA DELL’IMPIANTISTICA INDUSTRIALE
“PACKAGES” PER L’IMPIANTISTICA:
UN COMPARTO AD ALTO POTENZIALE
SEZIONE COMPONENTISTICA D’IMPIANTO ANIMP
Grand Hotel Villa Torretta, Sesto S.G. (Milano)
24 novembre 2015

Total Global Refining capacity is currently around 96 MMbpd
By end of decade, additional 5 – 6 MMbpd of new capacity
will begin operations, reaching around 102 MMbpd
This means over $550 B in Capex
IEA forecast are that oil demand will increase from 93
MMpbd in 2014 to around 99 MMbdp in 2020
Refining industry is growing, but toward overcapacity
21° Convegno Sezione Componentistica ANIMP, 24 novembre 2015
Refining Outlook – Stefano Donzelli Market Trends

23/11/2015 Le strategie di mercato e di procurement per la filiera dell’impiantistica italiana
18
Political stability and objectives still
drive investment plans
• Majority of this new capacity will go in non-OECD
nations, mostly in Asia followed by Middle-East;
• NOC’s will control many investments:
• Long term Client’s relationships
• Local presence and content
• Difficult business environment
• Political influence on project development
• Preference for LSTK contracts
• A huge amount of investment is still required as
clean fuels legislation sweeps across the globe.
Refining Outlook – Stefano Donzelli Market Trends
23/11/2015 Le strategie di mercato e di procurement per la filiera dell’impiantistica italiana
19
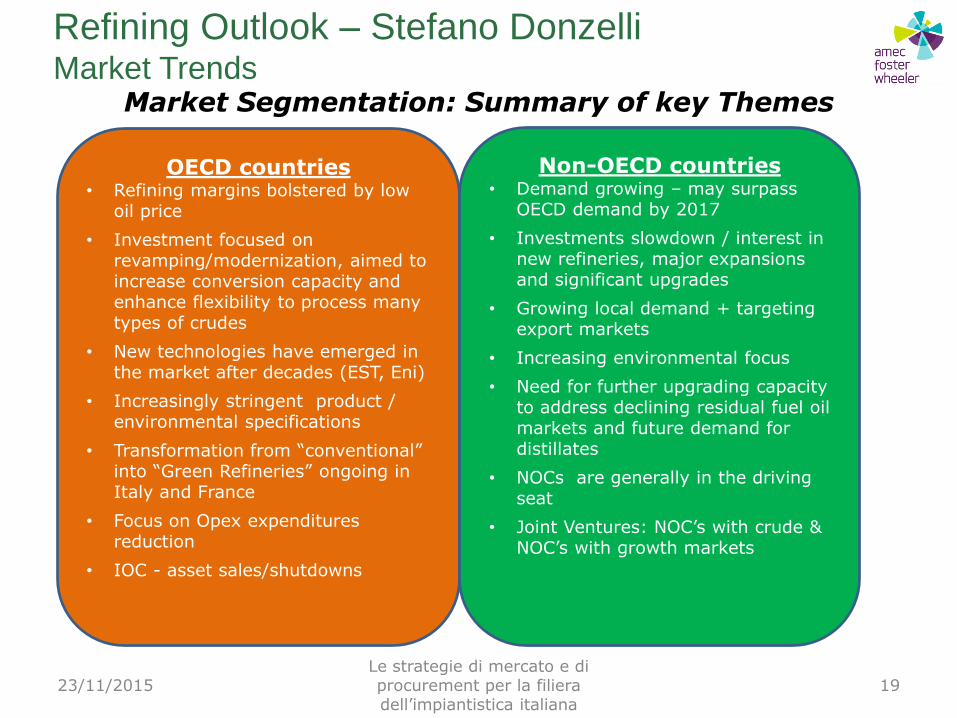
Market Segmentation: Summary of key Themes
OECD countries • Refining margins bolstered by low
oil price
• Investment focused on revamping/modernization, aimed to increase conversion capacity and enhance flexibility to process many types of crudes
• New technologies have emerged in the market after decades (EST, Eni)
• Increasingly stringent product / environmental specifications
• Transformation from “conventional” into “Green Refineries” ongoing in Italy and France
• Focus on Opex expenditures reduction
• IOC - asset sales/shutdowns
Non-OECD countries • Demand growing – may surpass
OECD demand by 2017
• Investments slowdown / interest in new refineries, major expansions and significant upgrades
• Growing local demand + targeting export markets
• Increasing environmental focus
• Need for further upgrading capacity to address declining residual fuel oil markets and future demand for distillates
• NOCs are generally in the driving seat
• Joint Ventures: NOC’s with crude & NOC’s with growth markets
Refining Outlook – Stefano Donzelli Market Trends

Residue Upgrading: Profitable Refining with Focused High Conversion
Residue upgrading
& conversion
Significant political pressure to address environmental issues
Declining markets for high sulfur fuel oil
Light / heavy crude spread
Increased demand for distillates and ‘clean fuels’
New crudes sources and extra heavy crude upgraders
Catalytic Non-catalytic Delayed Coking Flexicoking Visbreaking Solvent deasphalting
Residue FCC Residue Hydrocracking
20
23/11/2015 Le strategie di mercato e di procurement per la filiera dell’impiantistica italiana
Refining Outlook – Stefano Donzelli Market Trends

23/11/2015 Le strategie di mercato e di procurement per la filiera dell’impiantistica italiana
21
Gasoline
0 ppm 15-30 ppm 30-80 ppm
200-600 ppm Up to 2500 ppm
100-150 ppm
Source: IFQC
0 ppm 10 or 15 ppm 50 ppm 350 ppm
>2000 ppm 2000 ppm
500 ppm
Source: IFQC
Diesel
• All export refineries are built to the latest clean fuels specifications
• Existing domestic refineries react to domestic legislation
Environmental regulations will impact investment plans
Refining Outlook – Stefano Donzelli Market Trends

23/11/2015 Le strategie di mercato e di procurement per la filiera dell’impiantistica italiana
22
1. Availability of Cheap Gas
2. Marine Fuel Oil Specifications - A Major Challenge for Refiners?
• Still a key market for lower quality/higher sulphur refinery residual fuel oil
• Planned legislation for ships’ SOx emissions will require more stringent constraints
• This will imply investments to treat the «bottom of the barrel»
• Cheap gas will influence not only the level of investment, but also the optimal configuration for refineries
• Will boost investments in petrochemical sector
A couple of wildcards
Refining Outlook – Stefano Donzelli Market Trends

grazie per la cortese attenzione
21° Convegno Sezione Componentistica ANIMP
24 novembre 2015