presented by: laura kennedy, principal analyst doug hermanson, senior economist erin kennedy,...
TRANSCRIPT

Presented by:
Laura Kennedy, Principal AnalystDoug Hermanson, Senior EconomistErin Kennedy, Analyst
Home Improvement Webinar Series
May 9, 2014
Springing Forward Into Sustained Growth
© Copyright 2014 Kantar Retail
Agenda
• Macroeconomic Conditions–Shopper DNA: Have and Have Nots
• Ahead for Spring: Early Indicators of Shoppers’ Plans
• The Role of the Home Improvement Store–Home improvement in the context of spring merchandising trends
–The future of home improvement retail
2

© Copyright 2014 Kantar Retail
Macroeconomic Conditions
3
© Copyright 2014 Kantar Retail
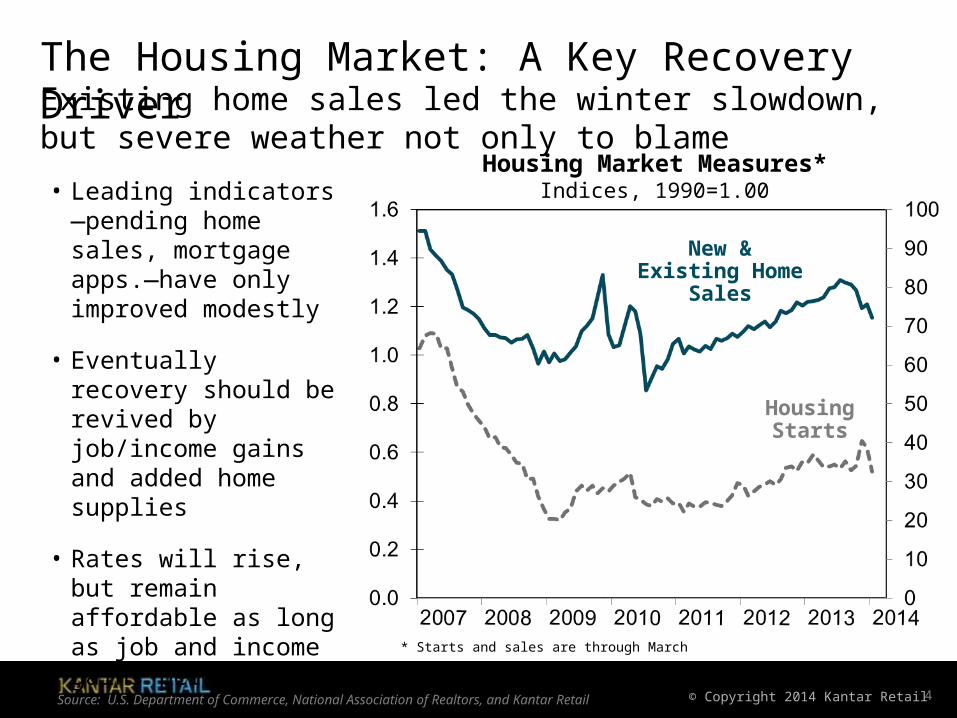
* Starts and sales are through March
The Housing Market: A Key Recovery Driver
4
• Leading indicators—pending home sales, mortgage apps.—have only improved modestly
• Eventually recovery should be revived by job/income gains and added home supplies
• Rates will rise, but remain affordable as long as job and income gains persist
Source: U.S. Department of Commerce, National Association of Realtors, and Kantar Retail
Housing Market Measures*Indices, 1990=1.00
Housing Starts
New & Existing Home Sales
Existing home sales led the winter slowdown, but severe weather not only to blame
© Copyright 2014 Kantar Retail
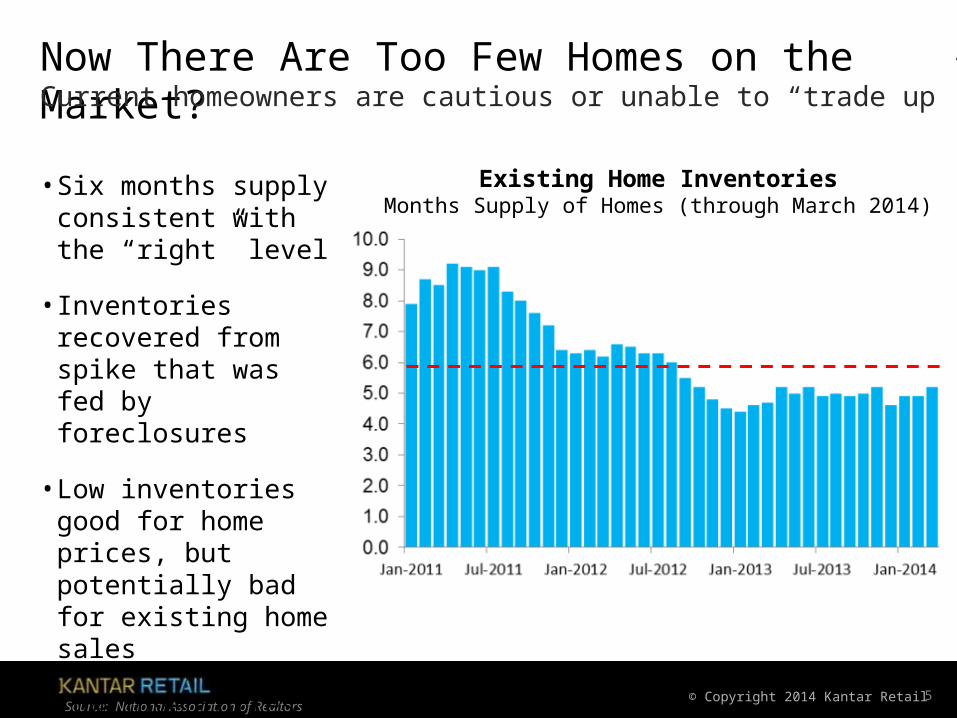
Now There Are Too Few Homes on the Market?
5
Current homeowners are cautious or unable to “trade up”
Source: National Association of Realtors
• Six months supply consistent with the “right” level
• Inventories recovered from spike that was fed by foreclosures
• Low inventories good for home prices, but potentially bad for existing home sales
• Low inventories will boost homebuilding
Existing Home InventoriesMonths Supply of Homes (through March 2014)

© Copyright 2014 Kantar RetailSource: U.S. Federal Reserve Board and Kantar Retail
• Higher rates will not extinguish recovery
• Will remain low enough to sustain investment and to drive persisting job, income gains
Interest Rates Key to Housing/Investment Outlook
6
Rates will remain relatively low even as they begin to rise
Risinghow
much more?
Risingwhen& howfast?
* Low point = June 2012 to May 2013
13.4
11.19.2
6.06.8
4.04.8
0.6
3.5
0.25
4.3
0.25
Fixed 30-Year Mortgage Rate Fed Funds Rate
Interest Rates Over Time Periods(Average Mortgage Rate and Fed Funds Rate)
Long-Term Rates Short-Term Rates
1986-19951978-1985 1996-2007
2008-2012
Low Point 2012-2013*From June 2013
© Copyright 2014 Kantar Retail
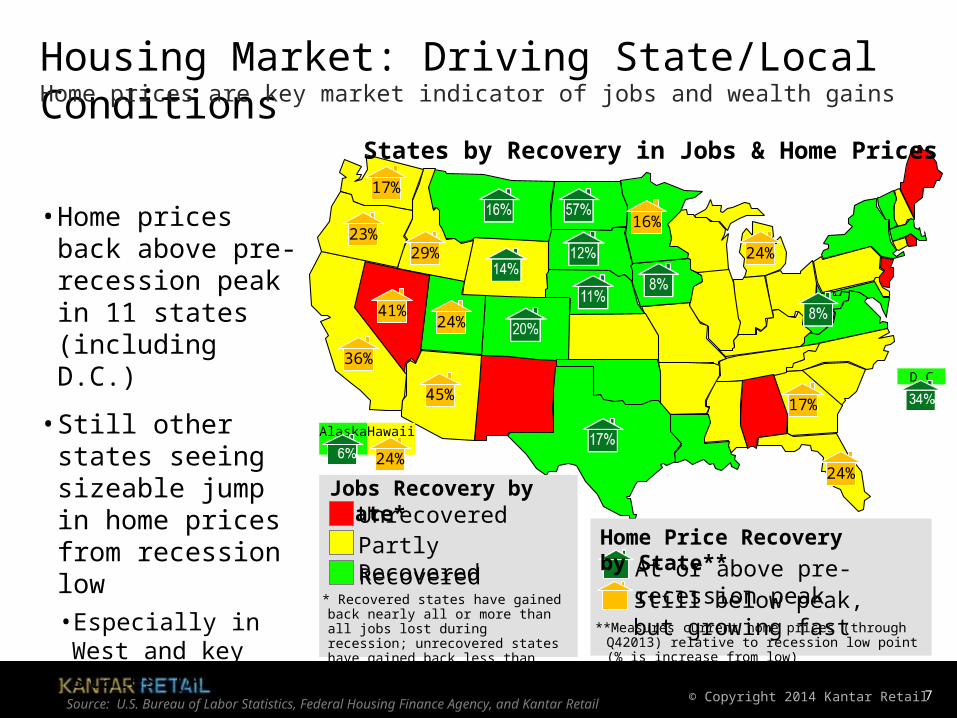
Housing Market: Driving State/Local Conditions
7
Home prices are key market indicator of jobs and wealth gains
• Home prices back above pre-recession peak in 11 states (including D.C.)
• Still other states seeing sizeable jump in home prices from recession low• Especially in West and key states (AZ, CA, FL, MI, NV)
Source: U.S. Bureau of Labor Statistics, Federal Housing Finance Agency, and Kantar Retail
29%
At or above pre-recession peakStill below peak, but growing fast
Home Price Recovery by State**
**Measures current home prices (through Q42013) relative to recession low point (% is increase from low)
Alaska
24%
23%
Hawaii
24%
17%
17%
16%
24%
24%
45%
36%
41%
States by Recovery in Jobs & Home Prices
* Recovered states have gained back nearly all or more than all jobs lost during recession; unrecovered states have gained back less than half of jobs lost
Jobs Recovery by State*
RecoveredPartly RecoveredUnrecovered
D.C

© Copyright 2014 Kantar Retail
“...we are looking at household formation.
Candidly, it was pretty weak, but…why was it so weak? It
goes back to credit availability. So we need to get those
millennials into a home…”
-Carol Tomé - The Home Depot - EVP, Corporate Services & CFO
“...we are looking at household formation.
Candidly, it was pretty weak, but…why was it so weak? It
goes back to credit availability. So we need to get those
millennials into a home…”
-Carol Tomé - The Home Depot - EVP, Corporate Services & CFO
Benefiting most from rebound in wealth—home prices and
stock market
More savings and home equity in previous home to make new
home purchase
Delaying household formation as job and income gains lag
First time home buyers squeezed more by recent
decrease in home affordability
Hurt more by tight lending standards
8
Gen YBoomers
and Seniors
Source: Kantar Retail research and analysis; Company reports
© Copyright 2014 Kantar Retail
Pre-Recession
Trend
9
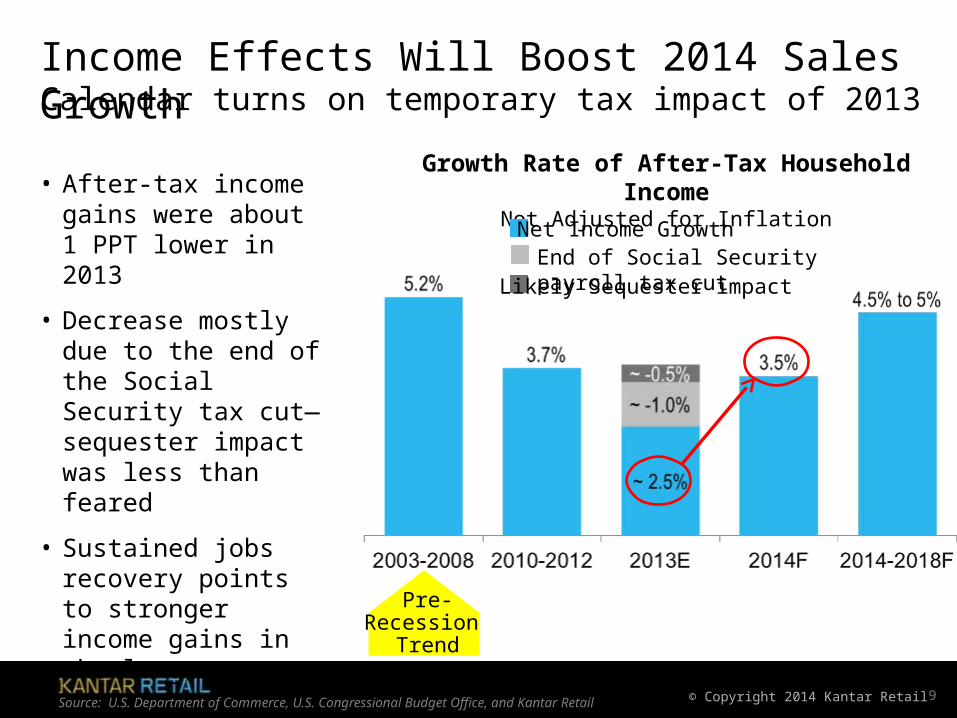
• After-tax income gains were about 1 PPT lower in 2013
• Decrease mostly due to the end of the Social Security tax cut—sequester impact was less than feared
• Sustained jobs recovery points to stronger income gains in the longer term
Growth Rate of After-Tax Household IncomeNot Adjusted for Inflation
Source: U.S. Department of Commerce, U.S. Congressional Budget Office, and Kantar Retail
Income Effects Will Boost 2014 Sales GrowthCalendar turns on temporary tax impact of 2013
Net Income Growth
Likely Sequester impactEnd of Social Security payroll tax cut
© Copyright 2014 Kantar Retail
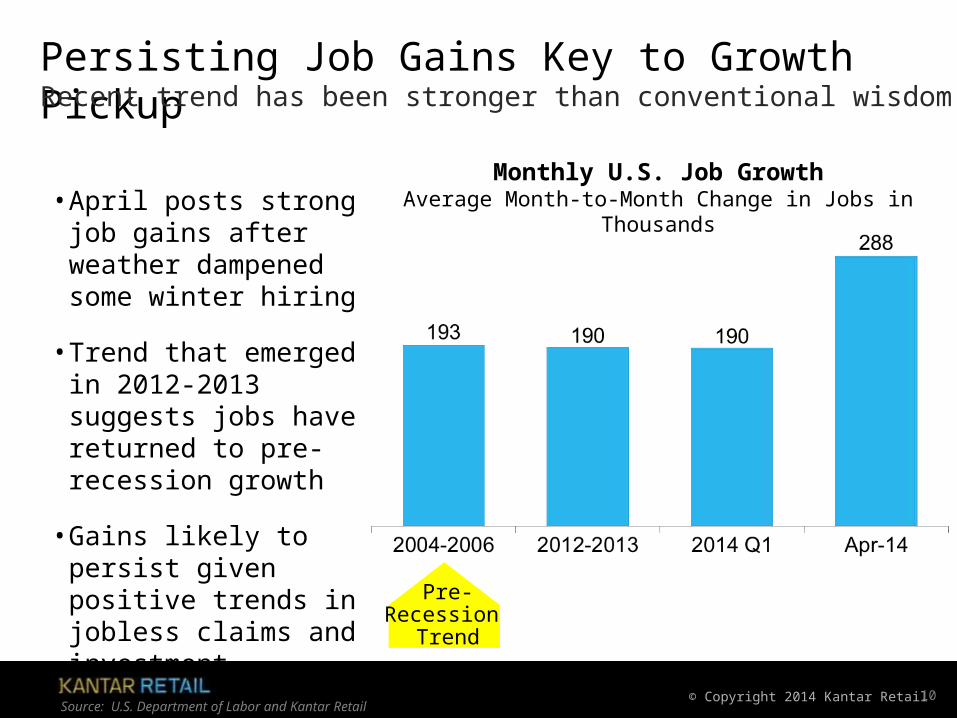
Persisting Job Gains Key to Growth Pickup
10
Recent trend has been stronger than conventional wisdom
Source: U.S. Department of Labor and Kantar Retail
Monthly U.S. Job GrowthAverage Month-to-Month Change in Jobs in Thousands• April posts strong job
gains after weather dampened some winter hiring
• Trend that emerged in 2012-2013 suggests jobs have returned to pre-recession growth
• Gains likely to persist given positive trends in jobless claims and investment Pre-
Recession Trend

© Copyright 2014 Kantar Retail
Confidence vs. Spending Intentions: Caution Metrics
11
For retail, spending intentions are a less volatile indicator
Source: Conference Board, and Kantar Retail ShopperScape®
• Confidence has rebounded from Oct.-Nov. lows, but dipped slightly in April
• Spending intentions for home improvement shoppers moved up in March
• Spending intentions for all shoppers that are available for April indicate further improvement
1 Confidence is through April 2014 as reported by the Conference Board2 Spending Intentions of home improvement shoppers from Kantar Retail ShopperScape® is through March 2014; represents sum of % of planning to spend about the same or more at all of retail in the coming month compared to a year ago
© Copyright 2014 Kantar Retail
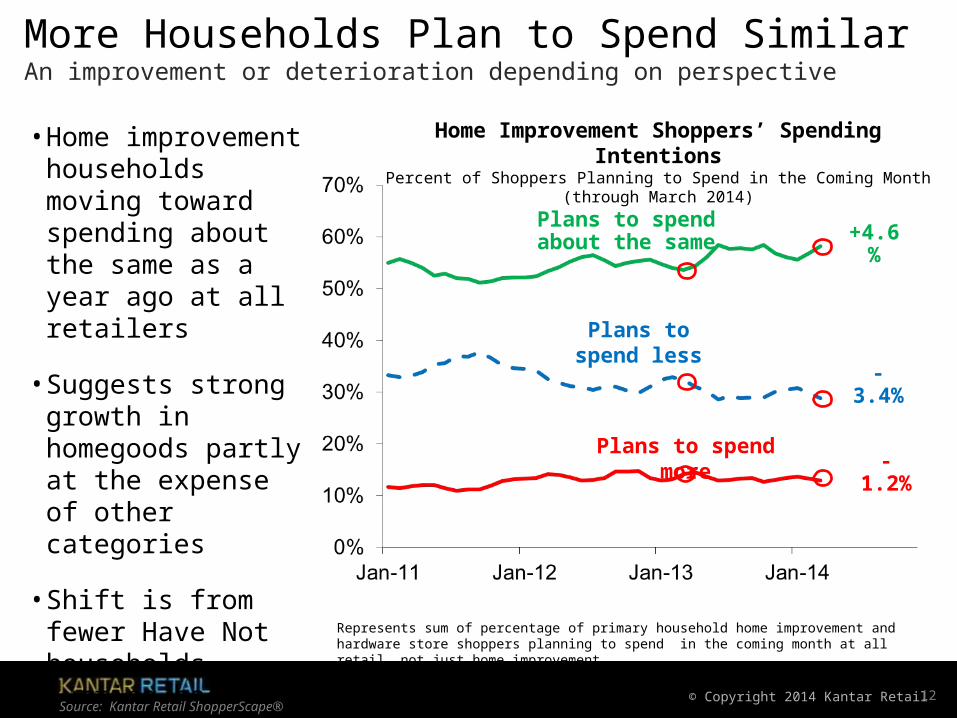
More Households Plan to Spend Similar
12
An improvement or deterioration depending on perspectiveHome Improvement Shoppers’ Spending Intentions
Percent of Shoppers Planning to Spend in the Coming Month(through March 2014)
• Home improvement households moving toward spending about the same as a year ago at all retailers
• Suggests strong growth in homegoods partly at the expense of other categories
• Shift is from fewer Have Not households cutting back and fewer Have households planning to spend more
Source: Kantar Retail ShopperScape®
Plans to spend about the same
Plans to spend less
Plans to spend more
Represents sum of percentage of primary household home improvement and hardware store shoppers planning to spend in the coming month at all retail, not just home improvement
+4.6%
-3.4%
-1.2%

© Copyright 2014 Kantar Retail
Shopper DNA: Have and Have Nots
13
© Copyright 2014 Kantar Retail
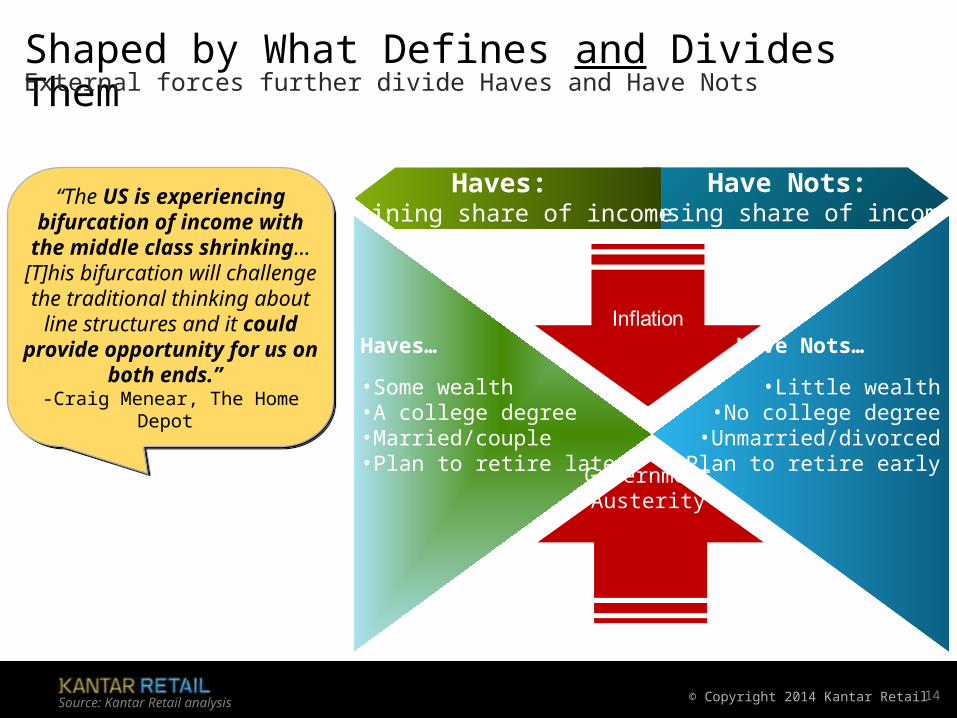
Shaped by What Defines and Divides ThemExternal forces further divide Haves and Have Nots
Source: Kantar Retail analysis 14
Haves…
•Part of large younger, working-age cohort•Some wealth•A college degree•Married/couple•An urban resident•Plan to
retire late
Have Nots…
•Part of large older cohort nearing
retirement•Little wealth
•No college degree•Unmarried/divorced
•A non-urban resident•Plan to
retire early
Have Nots: Losing share of income
Haves: Gaining share of income
GovernmentAusterity
Haves…
•Some wealth•A college degree•Married/couple•Plan to retire late
Have Nots…
•Little wealth•No college degree
•Unmarried/divorced•Plan to retire early
“The US is experiencing bifurcation of income with the
middle class shrinking... [T]his bifurcation will challenge the traditional thinking about line structures and it could
provide opportunity for us on both ends.”
-Craig Menear, The Home Depot
“The US is experiencing bifurcation of income with the
middle class shrinking... [T]his bifurcation will challenge the traditional thinking about line structures and it could
provide opportunity for us on both ends.”
-Craig Menear, The Home Depot

© Copyright 2014 Kantar Retail
66% 67% 69% 72% 72% 74%
1971 1981 1991 2001 2011 2020FC
34% 33% 31% 28% 28% 26%
1971 1981 1991 2001 2011 2020FC
Government Aid = About 1/3 of Have Not Income Grown significantly in 40 years, especially last few years
15
40% of households60% households
“Have Nots” “Haves”
~25% income < $62,000 Per Year
~75% of income> $62,000 Per Year Household IncomePay
chec
k
Paych
eck
$
Sources: U.S. Department of Commerce, and Kantar Retail analysis 3%97% 8%92%
Government Entitlement, Assistance Programs
20%
80%
35%
65%
Growing Reliance on Government
Falling Share of All Income Sources

© Copyright 2014 Kantar Retail
Where do Have & Have Nots Spend the Most?
Source: Kantar Retail ShopperScape®, January 2013–March 2014 16
Haves more likely to spend the most at Lowe’s and The Home Depot than Have Nots
Haves more likely to spend the most at Lowe’s and The Home Depot than Have Nots
Where Shoppers Spend the Most on Home Improvement Products
Where Shoppers Spend the Most on Home Improvement Products
Highlighting indicates significant difference between Haves and Have Nots
Have Nots more likely to spend the most at Hardware Stores
and Walmart than Have households
Have Nots more likely to spend the most at Hardware Stores
and Walmart than Have households
All Shoppers Have Nots Haves
Home Improvement Centers 66% 60% 73%
The Home Depot 33% 28% 37%
Low e's 28% 25% 30%
Menard's 6% 6% 5%
Other home improvement center 1% 1% 1%
Hardware Stores 5% 6% 4%
Ace Hardw are 3% 4% 3%
True Value 1% 1% 1%
Sears Hardw are 0% 0% 0%
Do it Best 0% 0% 0%
Other hardw are store (e.g. Do it Best) 1% 1% 1%
Mass Retailers 14% 19% 9%
Walmart/Walmart Supercenter 10% 14% 5%
Target/SuperTarget 3% 3% 3%
Kmart 1% 1% 1%
Other discount store/supercenter 0% 1% 0%
Amazon.com 1% 1% 1%
Sears 1% 1% 1%
Warehouse club retailer 1% 1% 1%
Value discounter/dollar store 1% 1% 0%
eBay.com 0% 0% 0%
Tractor Supply Company 0% 0% 0%
Other retailer not listed 9% 9% 8%

© Copyright 2014 Kantar Retail
What Appeals to Have & Have Nots
Source: Kantar Retail ShopperScape®, January 2013–March 2014 17
Have Nots most likely to be focused on price when
choosing a retailer
Have Nots most likely to be focused on price when
choosing a retailer
Why Shoppers Choose the Retailer Where They Spend the Most on Home Improvement ProductsWhy Shoppers Choose the Retailer Where They Spend the Most on Home Improvement Products
Highlighting indicates significant difference between Haves and Have Nots
Selection, quality, and shopping experience more
likely to influence where Haves spend the most
Selection, quality, and shopping experience more
likely to influence where Haves spend the most
All Shoppers Have Nots Haves
Convenient location 50% 47% 54%
Better price(s) for the item(s) I need 42% 44% 40%
Better selection of products 29% 27% 31%
More likely to have w hat I need in stock 20% 19% 20%
Faster/easier shopping experience 12% 12% 13%
Higher quality products 10% 10% 11%
More helpful/know ledgeable associates 10% 10% 10%
Item on sale/better sale prices 10% 11% 10%
Better able to one-stop shop for many categories 10% 10% 10%
Had specif ic item/brand I w anted or needed 9% 9% 9%
Better return policy 8% 8% 7%
Store credit card/rew ards program 5% 5% 5%Had gift card/gift certif icate redeemable at this retailer 3% 3% 4%
Better/more convenient delivery/installation services 3% 3% 4%
Had store coupon, rebate or other promotional offer 3% 3% 3%
Availability of how -to clinics 2% 3% 2%
More/better options to f inance my purchase 2% 3% 2%Recommended/purchased by contractor/builder/designer 2% 2% 2%
Other 4% 4% 5%
No real reason -- bought on impulse 4% 6% 2%
Convenience most important for both segments, but more
so for Haves
Convenience most important for both segments, but more
so for Haves

© Copyright 2014 Kantar Retail
Shopper DNA: Most Important Factors When Shopping
Source: Kantar Retail ShopperScape®, January and February 2014, and Kantar Retail analysis
How age-income segments differ from shared factors of importance
18
© Copyright 2014 Kantar Retail
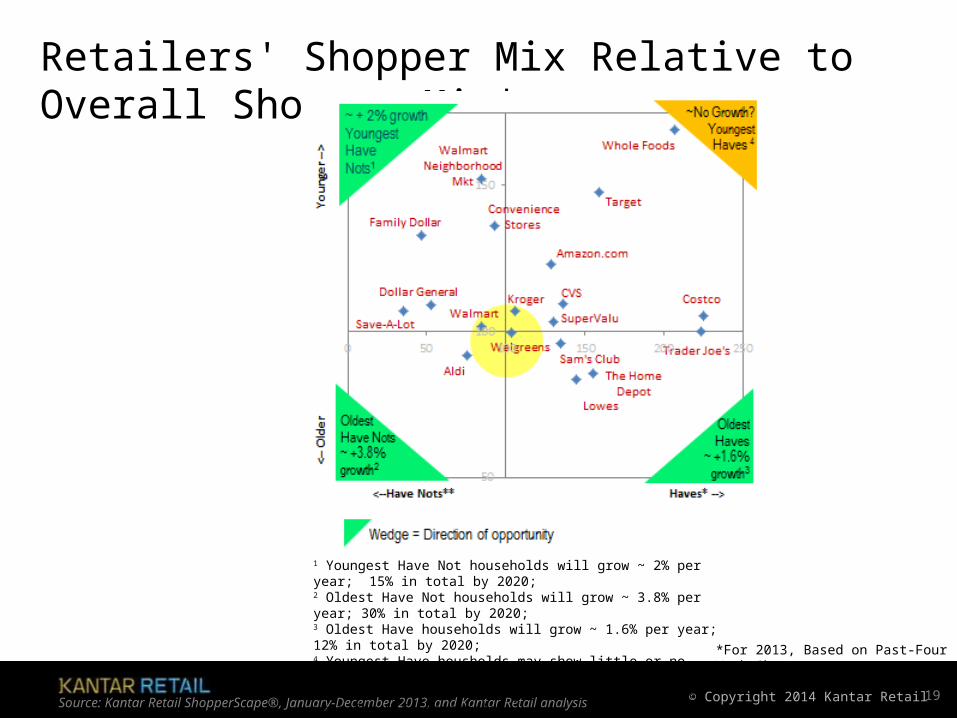
Retailers' Shopper Mix Relative to Overall Shopper Mix*
Source: Kantar Retail ShopperScape®, January-December 2013, and Kantar Retail analysis 19
*For 2013, Based on Past-Four Week Shoppers
1 Youngest Have Not households will grow ~ 2% per year; 15% in total by 2020;2 Oldest Have Not households will grow ~ 3.8% per year; 30% in total by 2020;3 Oldest Have households will grow ~ 1.6% per year; 12% in total by 2020;4 Youngest Have housholds may show little or no household growth;*Have households=income greater than $60,000 per year for U.S. households**Have Not households = income less than $60,000 per year for U.S. households
© Copyright 2014 Kantar Retail
Key Macroeconomic Takeaways
20
• Macroeconomic Conditions.
o Winter slowdown due to reduced home affordability and tight home inventories, as well as severe weather
o Job gains will alleviate or offset any softness in home sales in 2014, keeping home improvement spending growing at a solid pace
• Have and Have Nots.
o Understanding how younger and older shoppers shape Have and Have Not shopping trends will be key for the home improvement channel
o Older Haves that are currently the largest shopping base for home improvement are expected to grow in numbers, but will have different needs and wants
o The biggest growth in households will be among Have Nots. Appealing to the differentiating needs of young and old Have Nots will be needed to sustain solid-to-strong growth in the channel

© Copyright 2014 Kantar Retail
Ahead for Spring: Early Indicators of Shoppers’ Plans
21

© Copyright 2014 Kantar Retail
Home Improvement Shopper Penetration Picks UpBut still down from the same time last year
Source: Kantar Retail ShopperScape®, March 2012-March 2014 22
© Copyright 2014 Kantar Retail
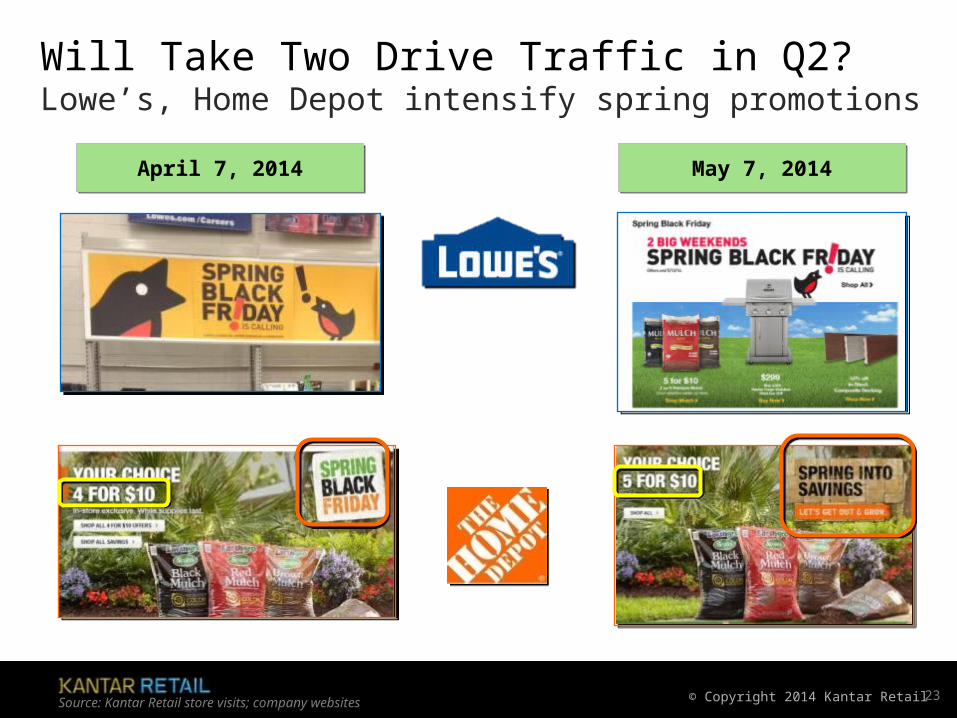
Will Take Two Drive Traffic in Q2?Lowe’s, Home Depot intensify spring promotions
Source: Kantar Retail store visits; company websites 23
April 7, 2014April 7, 2014 May 7, 2014May 7, 2014
© Copyright 2014 Kantar Retail
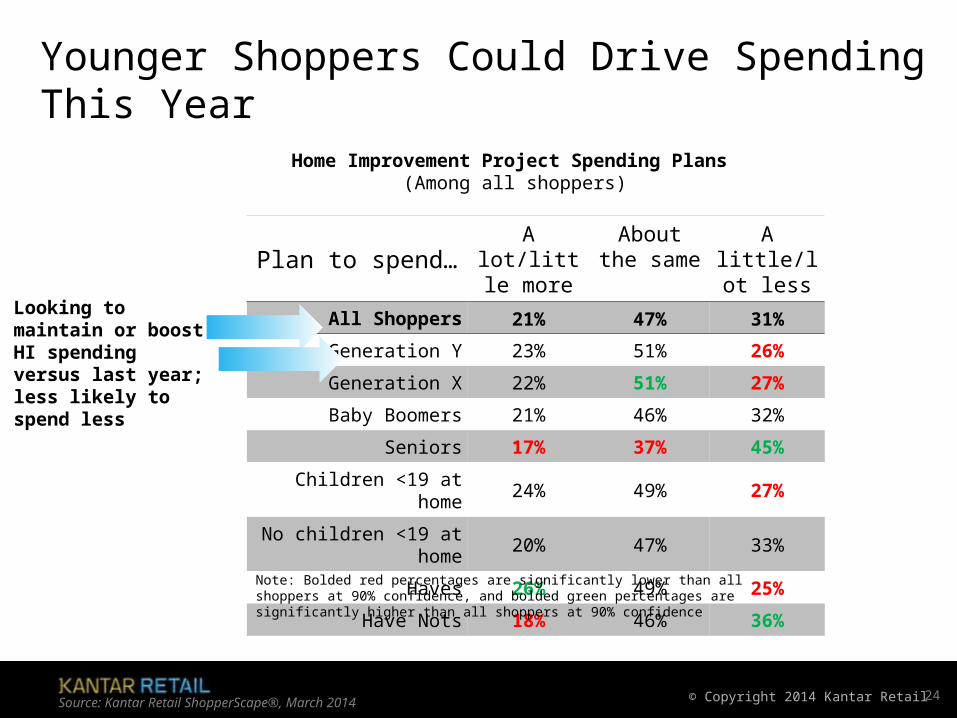
Younger Shoppers Could Drive Spending This Year
Source: Kantar Retail ShopperScape®, March 2014 24
Plan to spend…A lot/little
moreAbout the
sameA little/lot
less
All Shoppers 21% 47% 31%
Generation Y 23% 51% 26%
Generation X 22% 51% 27%
Baby Boomers 21% 46% 32%
Seniors 17% 37% 45%
Children <19 at home 24% 49% 27%
No children <19 at home 20% 47% 33%
Haves 26% 49% 25%
Have Nots 18% 46% 36%
Home Improvement Project Spending Plans (Among all shoppers)
Note: Bolded red percentages are significantly lower than all shoppers at 90% confidence, and bolded green percentages are significantly higher than all shoppers at 90% confidence
Looking to maintain or boost HI spending versus last year; less likely to spend less

© Copyright 2014 Kantar Retail
Households Plan Painting, Minor ProjectsFlooring tops bigger-ticket projects on shoppers’ lists
Source: Kantar Retail ShopperScape®, March 2014 25
Types of Home Improvement Projects That Shoppers Will Spend on This Spring(Among all shoppers)
© Copyright 2014 Kantar Retail
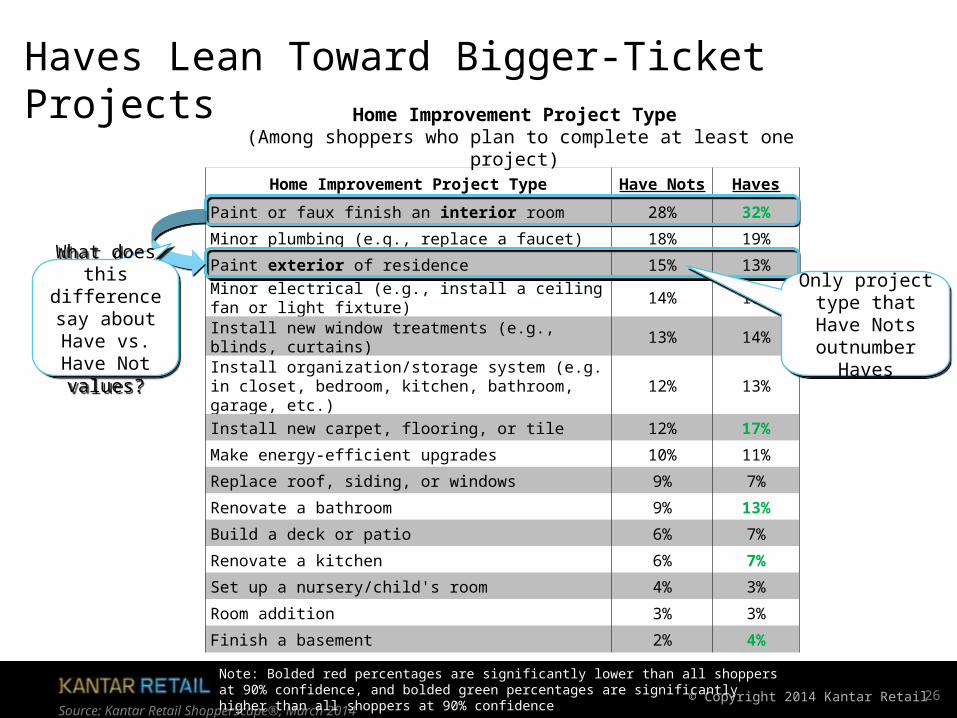
Haves Lean Toward Bigger-Ticket Projects
Source: Kantar Retail ShopperScape®, March 2014 26
Home Improvement Project Type Have Nots Haves
Paint or faux finish an interior room 28% 32%
Minor plumbing (e.g., replace a faucet) 18% 19%
Paint exterior of residence 15% 13%
Minor electrical (e.g., install a ceiling fan or light fixture) 14% 16%
Install new window treatments (e.g., blinds, curtains) 13% 14%
Install organization/storage system (e.g. in closet, bedroom, kitchen, bathroom, garage, etc.)
12% 13%
Install new carpet, flooring, or tile 12% 17%
Make energy-efficient upgrades 10% 11%
Replace roof, siding, or windows 9% 7%
Renovate a bathroom 9% 13%
Build a deck or patio 6% 7%
Renovate a kitchen 6% 7%
Set up a nursery/child's room 4% 3%
Room addition 3% 3%
Finish a basement 2% 4%
Home Improvement Project Type (Among shoppers who plan to complete at least one project)
Only project type that Have Nots
outnumber Haves
Only project type that Have Nots
outnumber Haves
What does this difference say about Have vs.
Have Not values?
What does this difference say about Have vs.
Have Not values?
Note: Bolded red percentages are significantly lower than all shoppers at 90% confidence, and bolded green percentages are significantly higher than all shoppers at 90% confidence
© Copyright 2014 Kantar Retail
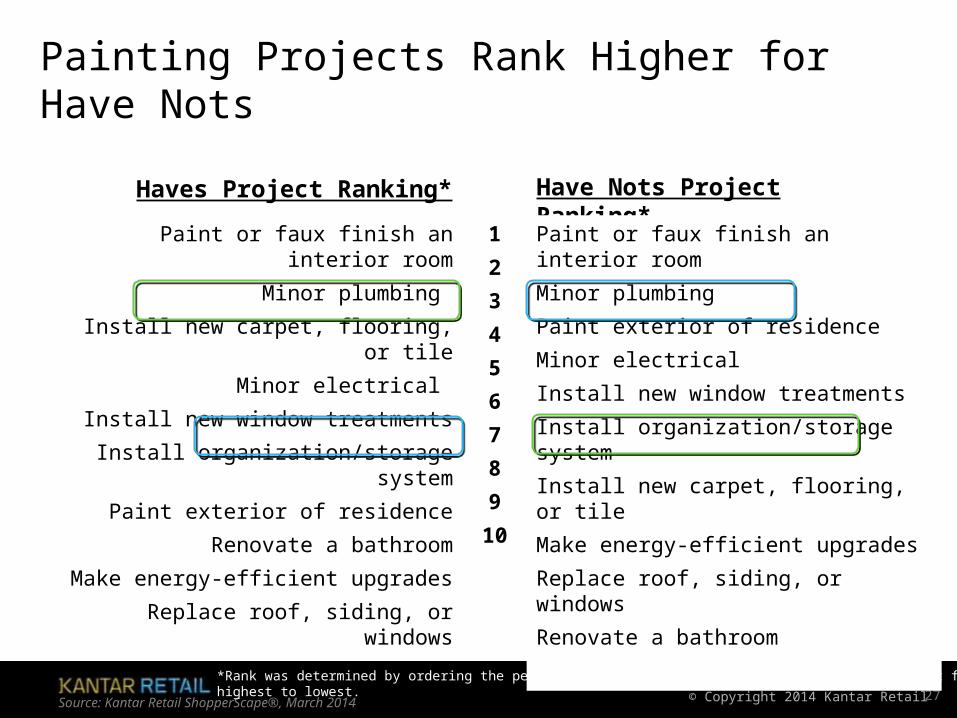
Painting Projects Rank Higher for Have Nots
Source: Kantar Retail ShopperScape®, March 2014 27
Haves Project Ranking* Have Nots Project Ranking*
Paint or faux finish an interior room
Minor plumbing
Install new carpet, flooring, or tile
Minor electrical
Install new window treatments
Install organization/storage system
Paint exterior of residence
Renovate a bathroom
Make energy-efficient upgrades
Replace roof, siding, or windows
Paint or faux finish an interior room
Minor plumbing
Paint exterior of residence
Minor electrical
Install new window treatments
Install organization/storage system
Install new carpet, flooring, or tile
Make energy-efficient upgrades
Replace roof, siding, or windows
Renovate a bathroom
1
2
3
4
5
6
7
8
9
10
*Rank was determined by ordering the percentage of people who plan to complete the project from highest to lowest.

© Copyright 2014 Kantar Retail
Difference in Rankings Among Generations Reflect Life Stage Priorities
Source: Kantar Retail ShopperScape®, March 2014 28
Gen Y’s Ranking Boomers’ Ranking
Paint or faux finish an interior room
Install organization/storage system
Install new window treatments
Minor electrical
Minor plumbing
Renovate a bathroom
Paint exterior of residence
Install new carpet, flooring, or tile
Make energy-efficient upgrades
Set up a nursery/child's room
1
2
3
4
5
6
7
8
9
10
Paint or faux finish an interior room
Minor plumbing
Paint exterior of residence
Minor electrical
Install new carpet, flooring, or tile
Install new window treatments
Renovate a bathroom
Make energy-efficient upgrades
Install organization/storage system
Replace roof, siding, or windows
Cheap, least invasive
Cheap, least invasive
*Rank was determined by ordering the percentage of people who plan to complete the project from highest to lowest.

© Copyright 2014 Kantar Retail
Households Focused Most on Lawn CareMore discretionary gardening projects also part of spring plans
Source: Kantar Retail ShopperScape®, March 2014 29
Types of Gardening and Landscaping Projects That Shoppers Will Spend on This Spring
(Among all shoppers)
© Copyright 2014 Kantar Retail
The Role of the Home Improvement Store:Spring Merchandising Trends
30
© Copyright 2014 Kantar Retail
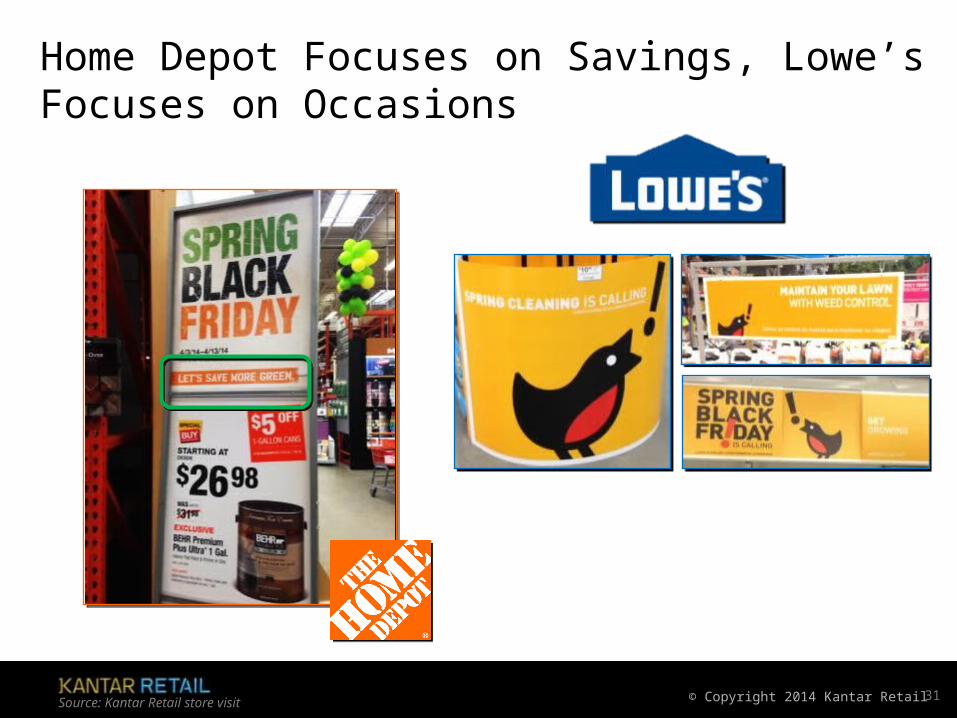
Home Depot Focuses on Savings, Lowe’s Focuses on Occasions
Source: Kantar Retail store visit 31
© Copyright 2014 Kantar Retail
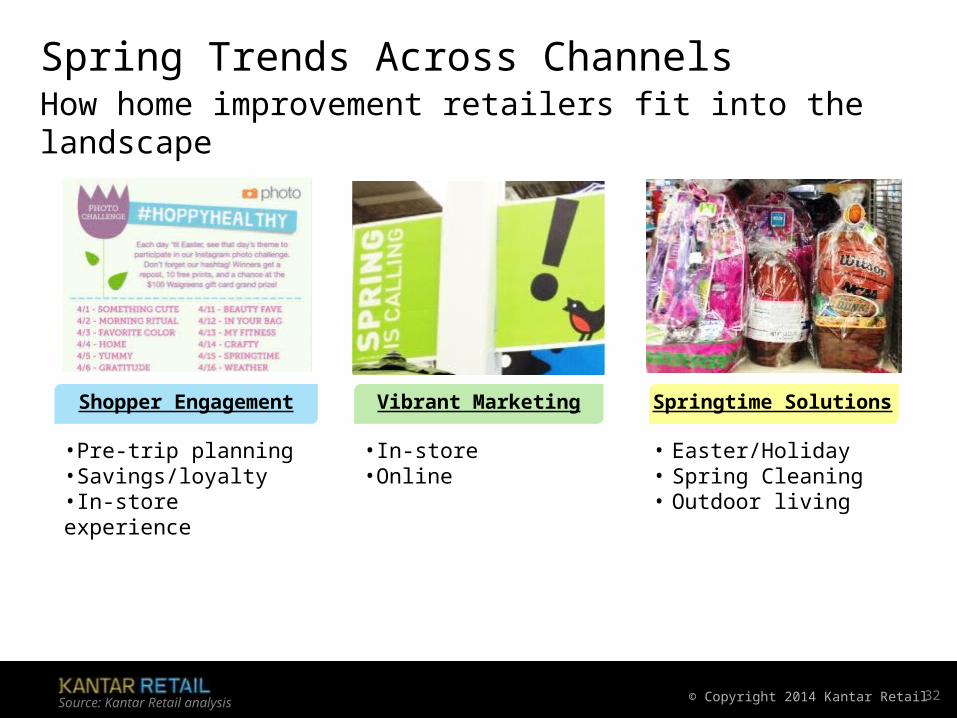
Spring Trends Across Channels
Source: Kantar Retail analysis 32
Vibrant Marketing
•In-store•Online
Shopper Engagement
•Pre-trip planning•Savings/loyalty•In-store experience
Springtime Solutions
• Easter/Holiday• Spring Cleaning• Outdoor living
How home improvement retailers fit into the landscape
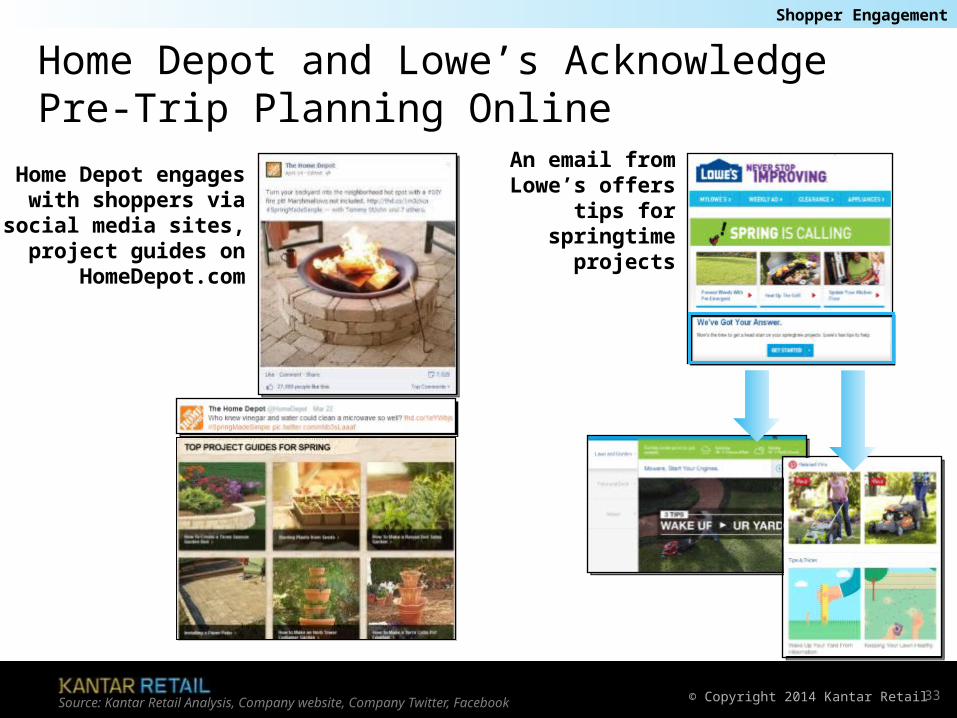
© Copyright 2014 Kantar RetailSource: Kantar Retail Analysis, Company website, Company Twitter, Facebook 33
An email from Lowe’s offers tips
for springtime projects
Home Depot engages with shoppers via social
media sites, project guides on
HomeDepot.com
Home Depot and Lowe’s Acknowledge Pre-Trip Planning Online
Shopper Engagement
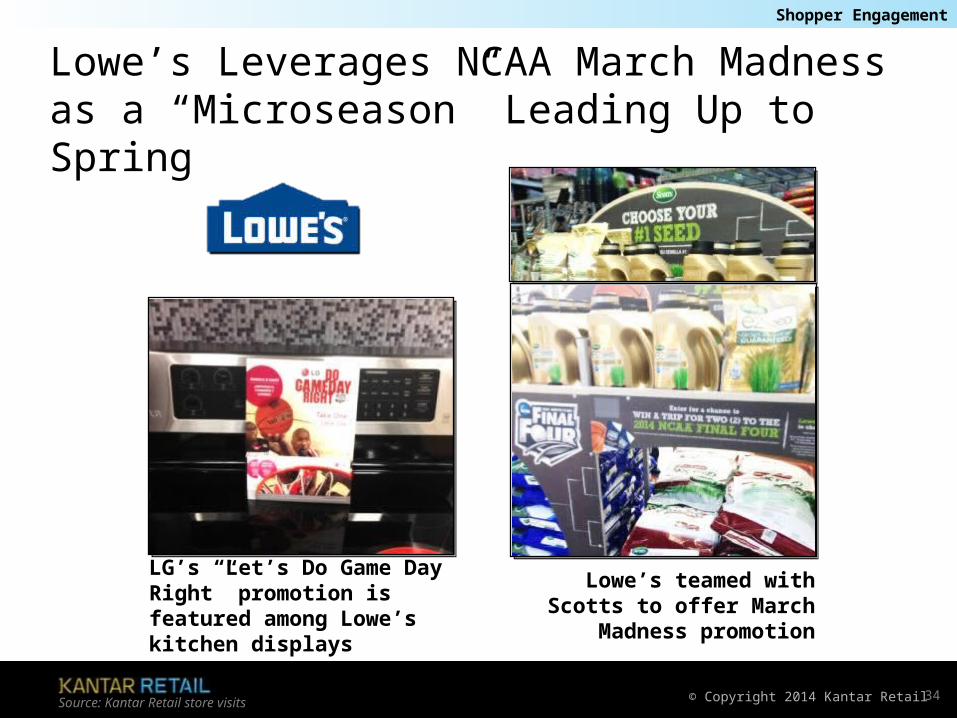
© Copyright 2014 Kantar RetailSource: Kantar Retail store visits 34
Lowe’s Leverages NCAA March Madness as a “Microseason” Leading Up to Spring
Lowe’s teamed with Scotts to offer March Madness
promotion
LG’s “Let’s Do Game Day Right” promotion is featured among Lowe’s kitchen displays
Shopper Engagement
© Copyright 2014 Kantar RetailSource: Kantar Retail store visits 35
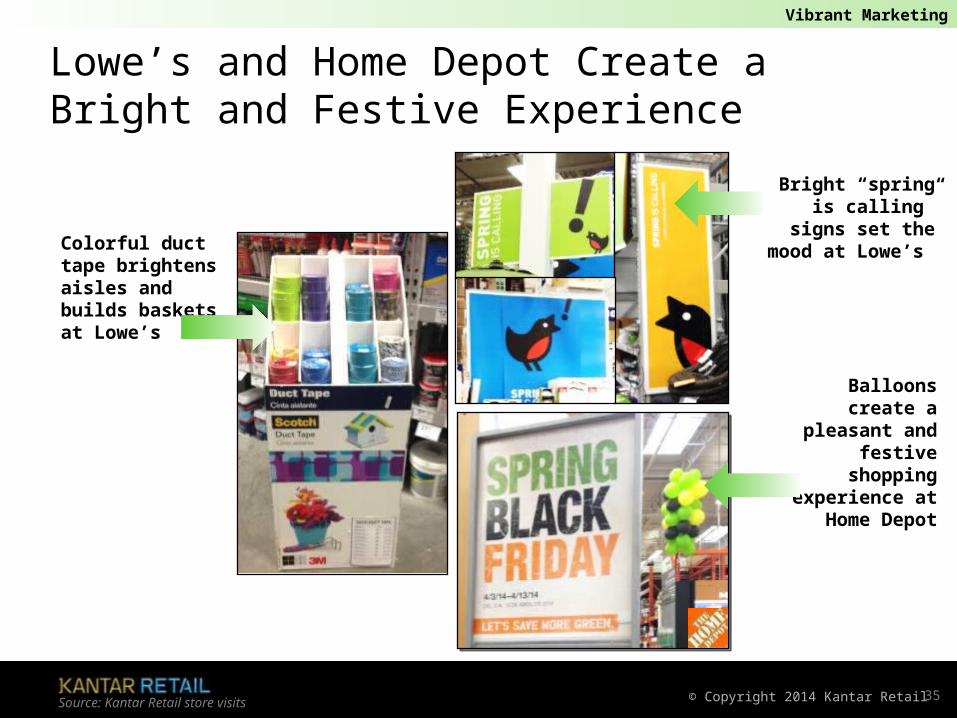
Lowe’s and Home Depot Create a Bright and Festive Experience
Colorful duct tape brightens aisles and builds baskets at Lowe’s
Vibrant Marketing
Balloons create a pleasant and
festive shopping experience at Home Depot
Bright “spring is calling” signs set
the mood at Lowe’s

© Copyright 2014 Kantar RetailSource: Kantar Retail analysis & store visits 36
Lowe’s Emphasizes Spring Cleaning and Home Refresh
Lowe’s uses colorful displays to promote spring cleaning and painting;Drop zones and end caps build baskets by providing shoppers with all of the necessary supplies to take on a cleaning or painting project
Springtime Solutions
© Copyright 2014 Kantar Retail
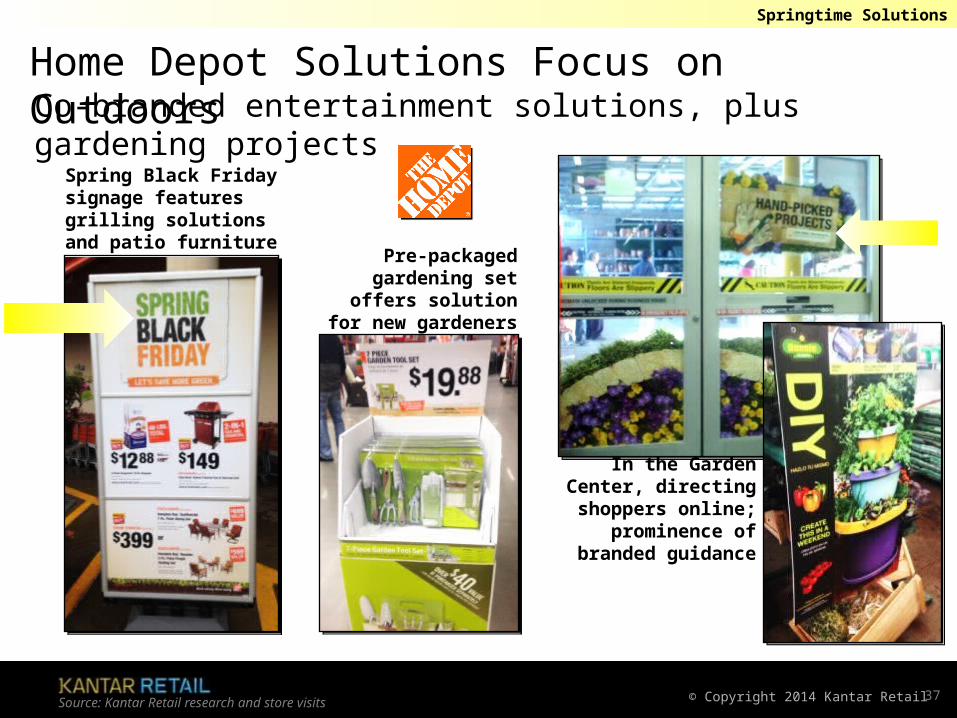
Spring Black Friday signage features grilling solutions and patio furniture
Pre-packaged gardening set offers
solution for new gardeners
Source: Kantar Retail research and store visits 37
Home Depot Solutions Focus on OutdoorsSpringtime Solutions
Co-branded entertainment solutions, plus gardening projects
In the Garden Center, directing shoppers
online; prominence of branded guidance

© Copyright 2014 Kantar RetailSource: Kantar Retail research and store visits 38
Healthy Lifestyles Gain Prominence in Garden Center
Springtime Solutions
Home Depot offers window sill gardens for urban
shoppers
Organic plant food sits in front of
Lowe’s “healthy life” displayLowe’s features
an entire display of fruit and vegetable seeds
© Copyright 2014 Kantar Retail
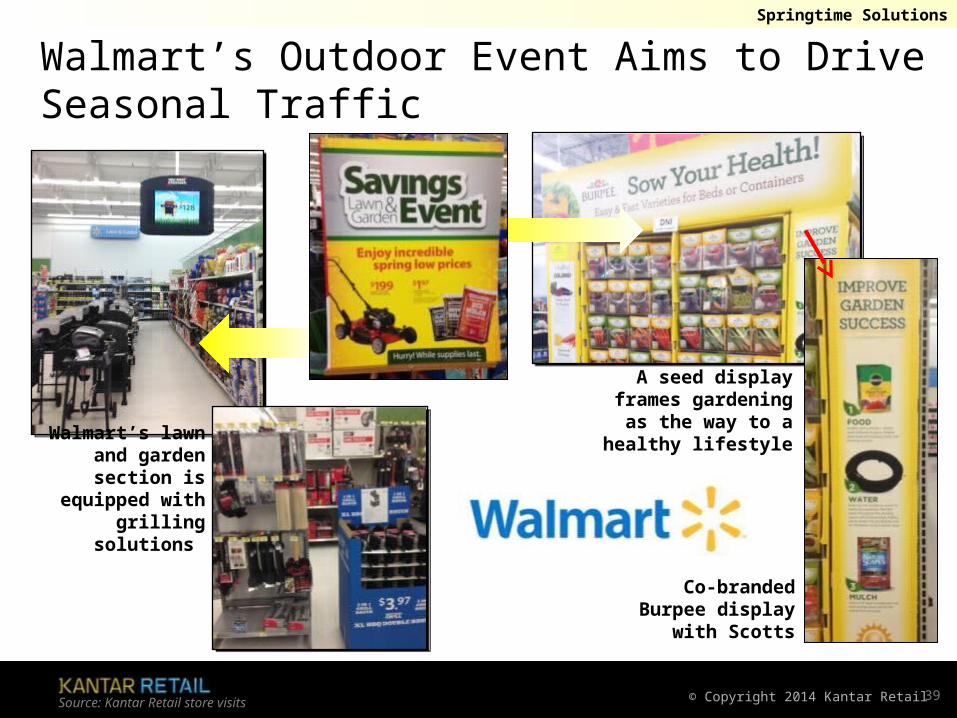
Walmart’s Outdoor Event Aims to Drive Seasonal Traffic
Source: Kantar Retail store visits 39
A seed display frames gardening as the way
to a healthy lifestyle
Springtime Solutions
Walmart’s lawn and garden section is
equipped with grilling solutions
Co-branded Burpee display
with Scotts

© Copyright 2014 Kantar Retail
The Role of the Home Improvement Store:Store of the Future
40
© Copyright 2014 Kantar Retail
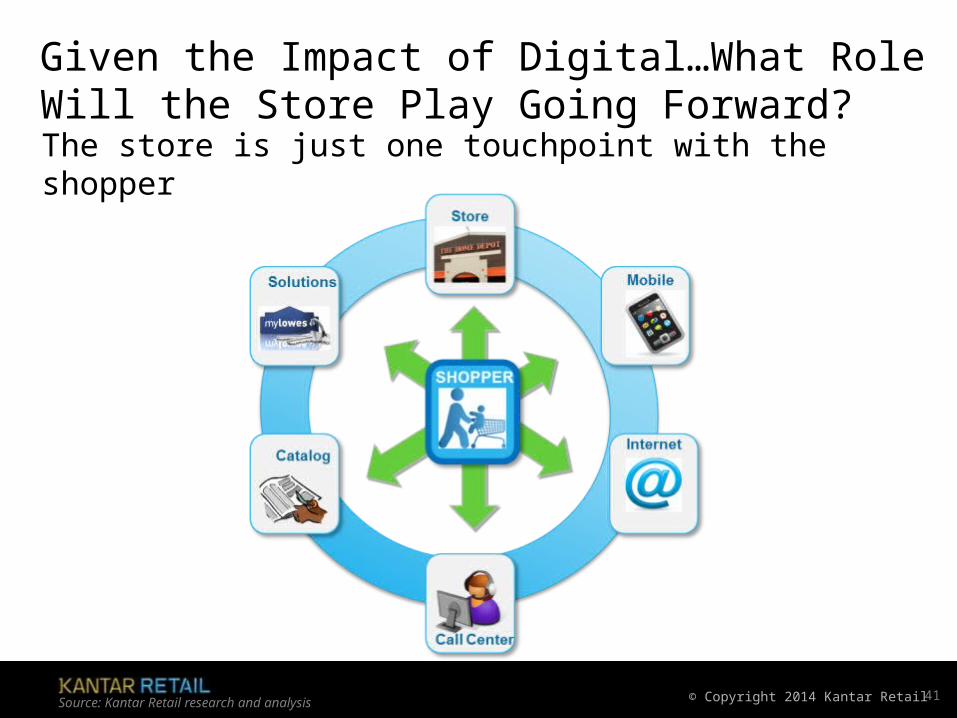
Given the Impact of Digital…What Role Will the Store Play Going Forward?
Source: Kantar Retail research and analysis 41
The store is just one touchpoint with the shopper

© Copyright 2014 Kantar Retail
Going Forward, the Store Must Seize Its Role
Source: Kantar Retail analysis 42
Where are we seeing glimmers
of this now?
Where are we seeing glimmers
of this now?
© Copyright 2014 Kantar Retail
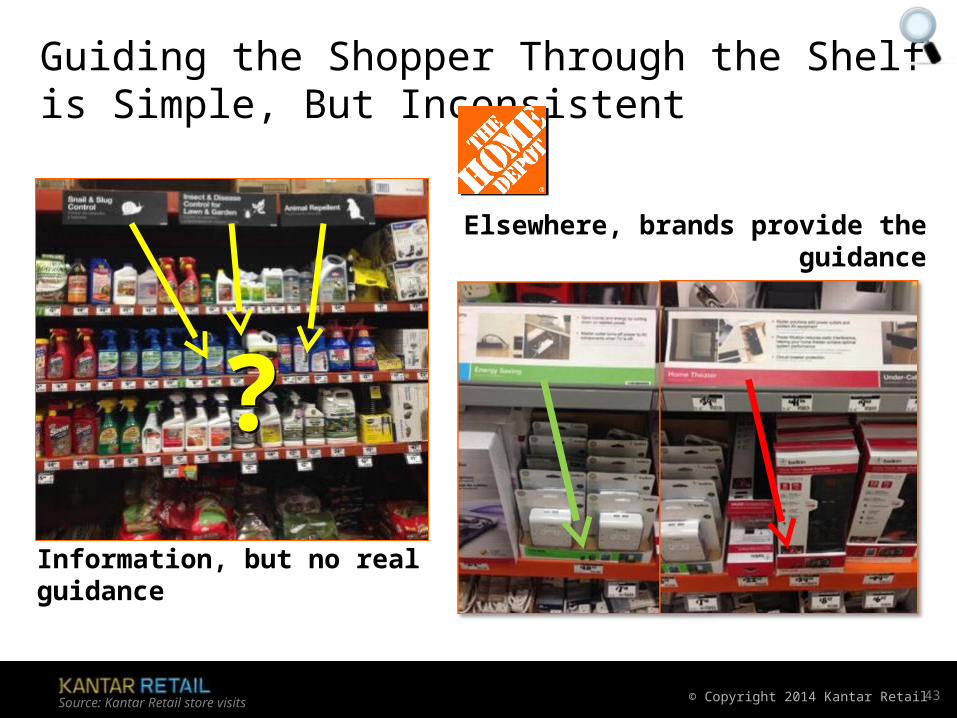
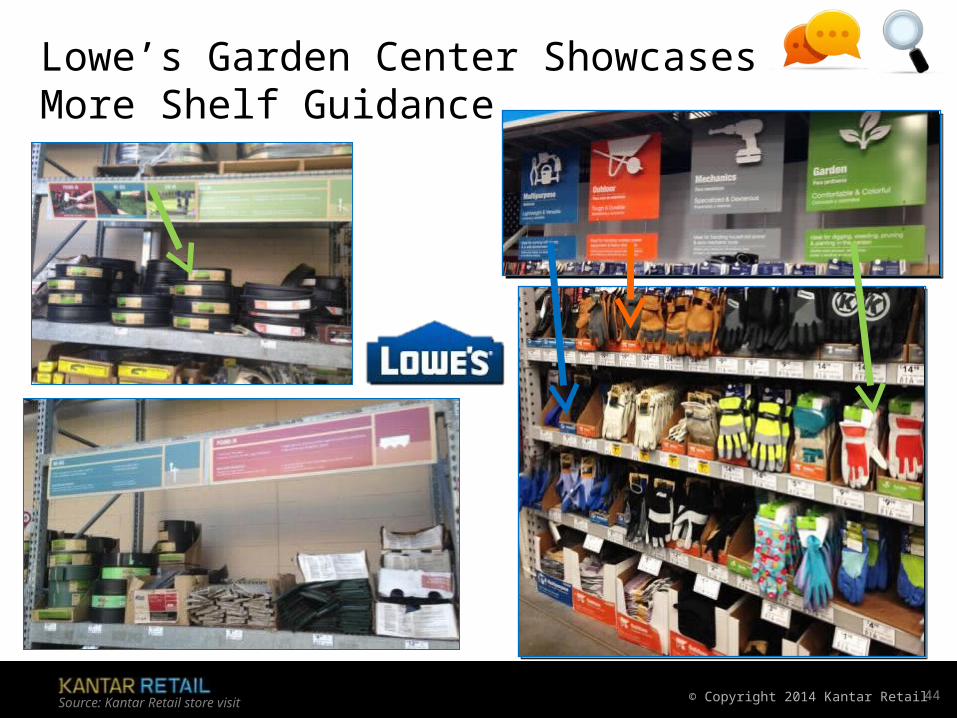
Guiding the Shopper Through the Shelf is Simple, But Inconsistent
Source: Kantar Retail store visits 43
??Information, but no real guidance
Elsewhere, brands provide the guidance
© Copyright 2014 Kantar Retail
Lowe’s Garden Center Showcases More Shelf Guidance
Source: Kantar Retail store visit 44
© Copyright 2014 Kantar Retail
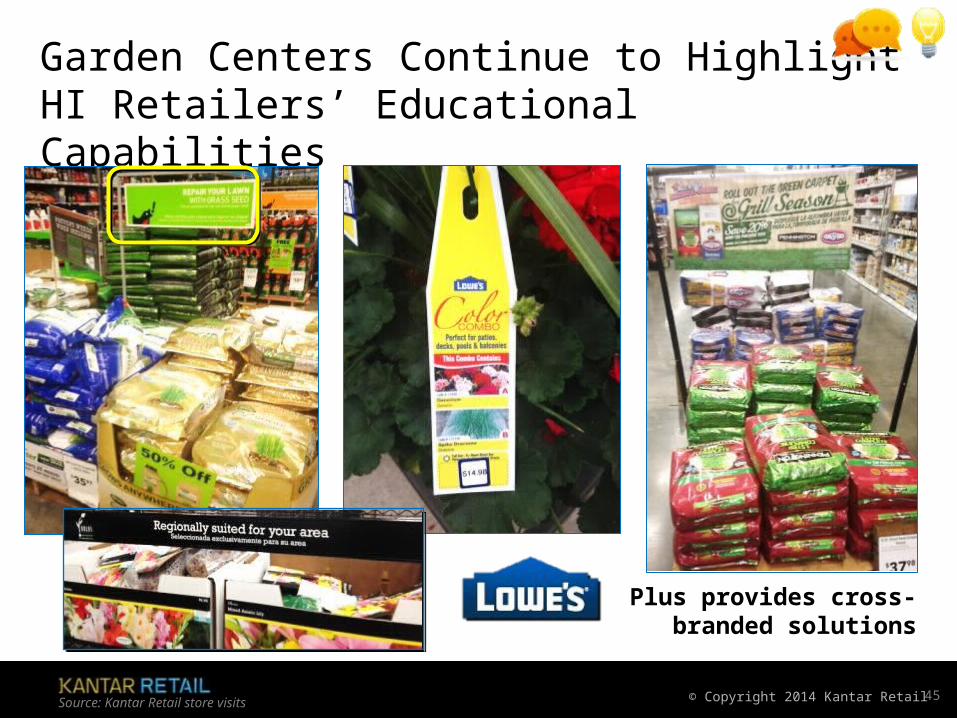
Garden Centers Continue to Highlight HI Retailers’ Educational Capabilities
Source: Kantar Retail store visits 45
Plus provides cross-branded solutions

© Copyright 2014 Kantar Retail
Home Depot Focuses on Branded Education in Garden
Source: Kantar Retail store visits 46
© Copyright 2014 Kantar Retail
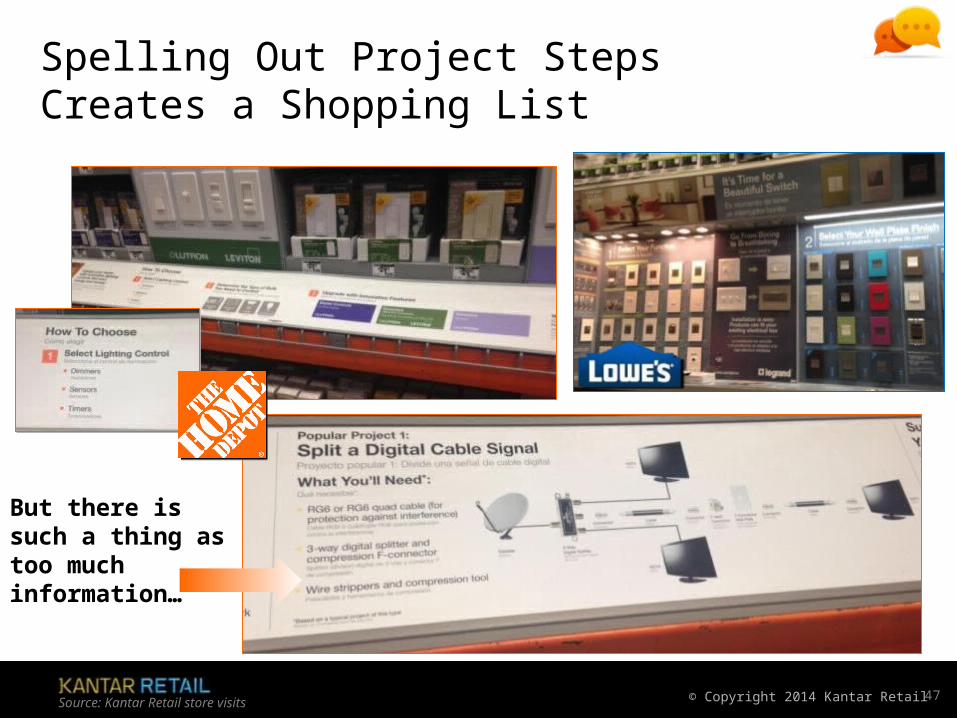
Spelling Out Project Steps Creates a Shopping List
Source: Kantar Retail store visits 47
But there is such a thing as too much information…
© Copyright 2014 Kantar Retail
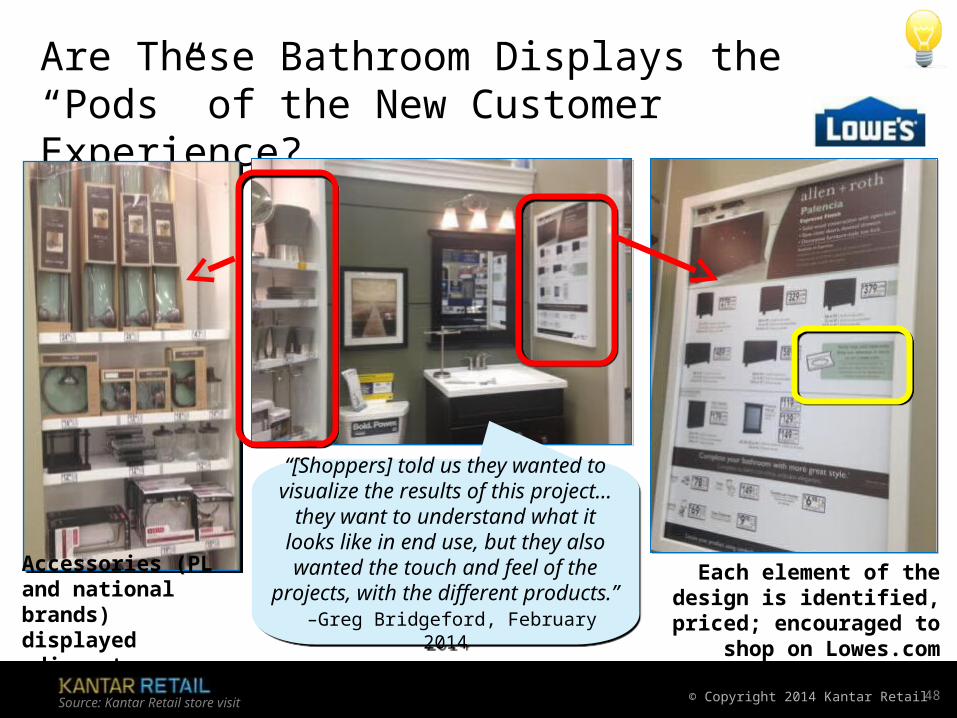
Are These Bathroom Displays the “Pods” of the New Customer Experience?
Source: Kantar Retail store visit 48
Each element of the design is identified, priced;
encouraged to shop on Lowes.com
Accessories (PL and national brands) displayed adjacent
“[Shoppers] told us they wanted to visualize the results of this project…
they want to understand what it looks like in end use, but they also wanted the touch and feel of the
projects, with the different products.” –Greg Bridgeford, February 2014
“[Shoppers] told us they wanted to visualize the results of this project…
they want to understand what it looks like in end use, but they also wanted the touch and feel of the
projects, with the different products.” –Greg Bridgeford, February 2014

© Copyright 2014 Kantar Retail
Home Depot Builds Online into Its Solutions
Source: Kantar Retail store visits 49

© Copyright 2014 Kantar Retail
From Other Channels, Future Store Takes Shape
Source: Kantar Retail analysis 50

© Copyright 2014 Kantar Retail
Kroger Recipe Stations Provide Instant SolutionsCould HI project ideas be digitized?
Source: Kantar Retail store visit 51
Present shoppers with a multitude of meal solutions based
off of season, type of meal, prep/cook time.
© Copyright 2014 Kantar Retail
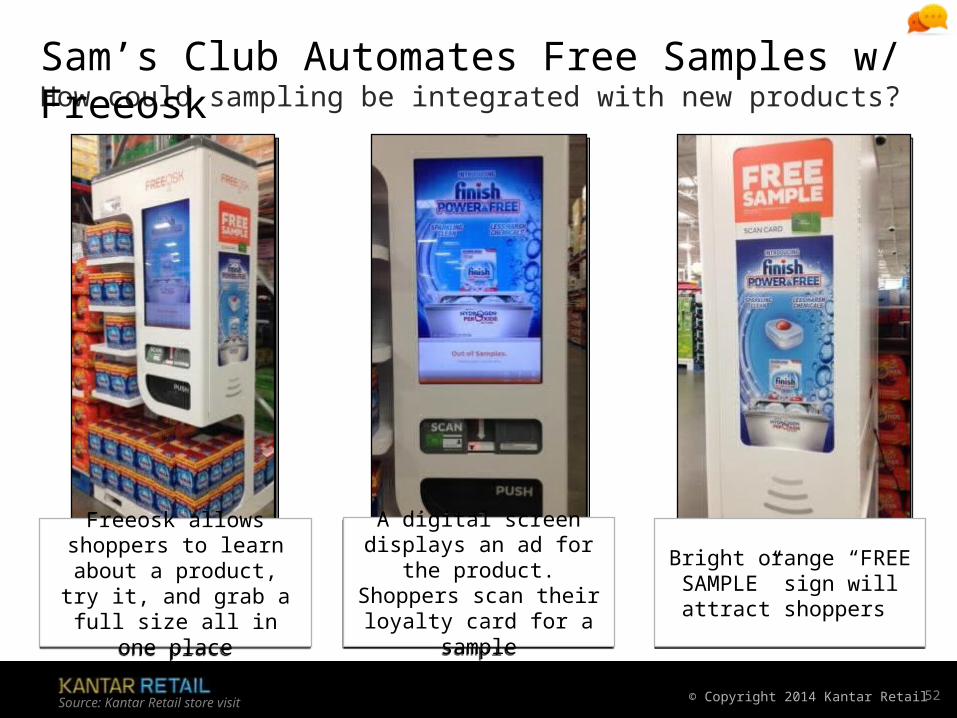
How could sampling be integrated with new products?Sam’s Club Automates Free Samples w/ Freeosk
Source: Kantar Retail store visit 52
Freeosk allows shoppers to learn about a product, try it, and grab a full size
all in one place
Freeosk allows shoppers to learn about a product, try it, and grab a full size
all in one place
Bright orange “FREE SAMPLE” sign will attract
shoppers
Bright orange “FREE SAMPLE” sign will attract
shoppers
A digital screen displays an ad for the product. Shoppers scan their
loyalty card for a sample
A digital screen displays an ad for the product. Shoppers scan their
loyalty card for a sample

© Copyright 2014 Kantar Retail
Drugstores Offer Pharmacy Services OnlineCould more on-demand services be on the way for DIY?
Source: 53
© Copyright 2014 Kantar Retail
Closing Considerations: Seize the Chance to Shape the New HI ExperienceFind opportunities to:
–Help shoppers navigate the store—including online. This will require working with retailers to create signage and other informational material. Identifying opportunities to co-merchandise and provide solutions will also be helpful.
–Educate shoppers, as well as associates and your retailer partners. At times, it will be necessary to build both the category and your brand. Emphasize the importance of the in-store associate to this mission. And remember that cost remains a concern for shoppers at all ends, so explaining the value of your product will be crucial.
–Inspire shoppers to build baskets—and retailers to create projects. Here is where data will be crucial. Determining shoppers’ paths to purchase and pinpointing where you can build loyalty for both your brand and the retailer’s will help keep shoppers from falling down “chutes” created by digital.
Source: Kantar Retail research and analysis 54

June 4–5 in Chicago, IL or June 18–19 in New York, NY
ForumForumMid YearMid Year
New Planning Coordinates: Navigating The Multichannel World
Join Kantar Retail thought leaders for our signature Mid Year Forum aimed at ensuring you formulate future plans that are strategically vital, predictively accurate, and closely aligned
against your most important customers. Please email [email protected] for more information.

© Copyright 2014 Kantar Retail
Contact:
Laura KennedyPrincipal [email protected]
617.912.2851www.kantarretailiQ.com
Erin [email protected]
617.912.2849www.kantarretailiQ.com
Doug HermansonSenior [email protected]
614.355.4044www.kantarretailiQ.com