presented by: lynda laff pat laff laff associates 2011 2011 annual meeting want to improve your...
TRANSCRIPT

Presented by:Lynda Laff
Pat Laff
Laff Associates 2011
2011 Annual Meeting
Want To Improve YourFinancial Outcomes – Manage Smarter!
1
Managing Smarter Efficient Home Care Means…
Less care?Fewer staff?Cut middle management? Eliminate PI programs?Hiring freeze?Eliminate all educational travel?No IT system upgrades???No “tools”?
REALLY?Laff Associates 2011 2

How Did We Get Here?
Escalating health care costs – all sectors of the delivery system
CMS identified home care “behavioral changes” to influence payment
Practice variation among providersContinued potentially avoidable eventsSlow outcomes improvementContinued re-hospitalization
Laff Associates 2011 3
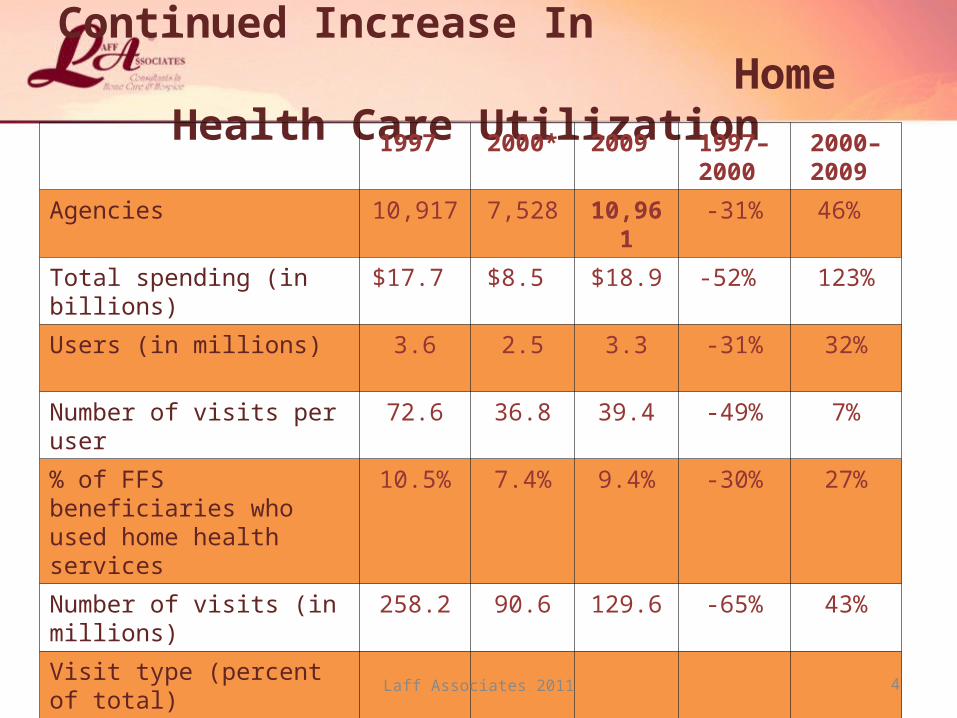
Continued Increase In Home Health Care Utilization
1997 2000* 2009 1997–2000
2000–2009
Agencies 10,917 7,528 10,961
-31% 46%
Total spending (in billions)
$17.7 $8.5 $18.9 -52% 123%
Users (in millions) 3.6 2.5 3.3 -31% 32%
Number of visits per user
72.6 36.8 39.4 -49% 7%
% of FFS beneficiaries who used home health services
10.5% 7.4% 9.4% -30% 27%
Number of visits (in millions)
258.2 90.6 129.6 -65% 43%
Visit type (percent of total)
Skilled Nursing 41% 49% 55%
Home Health Aide 48% 31% 16%
Therapy 10% 19% 28%
Medical Social Services 1% 1% 1%
Laff Associates 2011 4

Costs Increase But… Outcomes Do Not Improve
Costs continue to escalate with little improvement in outcomes
Major variations in the cost of care delivery vs. patient outcomes
No substantial improvement in re-hospitalization rates
High numbers of potentially avoidable events Inadequate communication and coordination of
patient care
Laff Associates 2011 5

Cost Savings
Cost of hospital readmissions $15 Billion Annually
Potentially avoidable hospital readmissions 13.3%
Savings if potentially avoidable hospital readmissions were prevented
$12 Billion Annually
6Laff Associates 2011

Statistics Don’t Lie
Medicare hospital patients in 2006 – 2007, readmitted for the same conditions that prompted their initial hospitalization” (AHRQ 2010)
25%
Medicare hospital patients were readmitted in 30 days in 2009 20%Medicare patients re-hospitalized within 90 days 34%Medicare patients experiencing multiple hospital admissions (AHRQ, 2010).
42%
Medicare patients experiencing multiple emergency department (ED) visits. (AHRQ, 2010).
38%
30-day Medicare readmission rates varied (2009)
http://medpac.gov/documents/Jan11_RegionalVariation_report.pdf
12.9% Oregon
22.7% D.C.
7Laff Associates 2011

MedPAC Findings
Volume of services continued to rise Beneficiaries without a prior hospitalization
account for a rising share of episodes * Changes in therapy distribution
“Providers target therapy visit thresholds used to adjust home health payments”.
“Volume changes since implementation of PPS provide evidence of providers targeting the ranges that appear most profitable”.
Conclusion: overutilization and inadequate careFYI- Check out your coding process and marketing strategies!
Laff Associates 2011 8

MedPAC Recommendations
1. Increased medical review in counties with aberrant home health utilization; suspend payment and limit provider enrollment.
2. Establish a per episode co-pay for home health episodes that are not preceded by hospitalization or post-acute care use.
3. Begin a two-year rebasing of home health rates in 2011 for implementation in 2014
4. Modify the home health payment system to protect beneficiaries from stinting or lower quality of care in response to rebasing..
Laff Associates 2011 9

CMS Proposed Rule 2012
1. Base rate reduction of to $2,112.37 from $2,192.07 ($79.70 or 3.64%)
2. Revise the case weight structure to decrease emphasis on therapy thresholds and misuse of HTN codes Eliminate HTN codes 401.1, 401.9 from case mix Redistribute dollars/weights for clinical and functional
levels Remove weighting of therapy thresholds Decelerate therapy resources with higher weights
Laff Associates 2011 10

Manage Smarter
To be profitable management must: Know what it costs to provide services — by
discipline
Monitor and manage ALL aspects of agency operations from intake to billing
Create appropriate efficiencies
Prevent redundancy and unnecessary hand-offs
Promote standardization for entire agency
Laff Associates 2011 11

Clinical Management Information Key Indicators Routine Reports
Education Clinical assessment OASIS Accuracy
Supervision & Oversight Documentation Timeliness Care Plan Development Clinical Quality - Accuracy
Continuity Case management Clinical model
Accountability/ Responsibility Reward / incentive Corrective Action
Manage Smarter
Laff Associates 2011 12
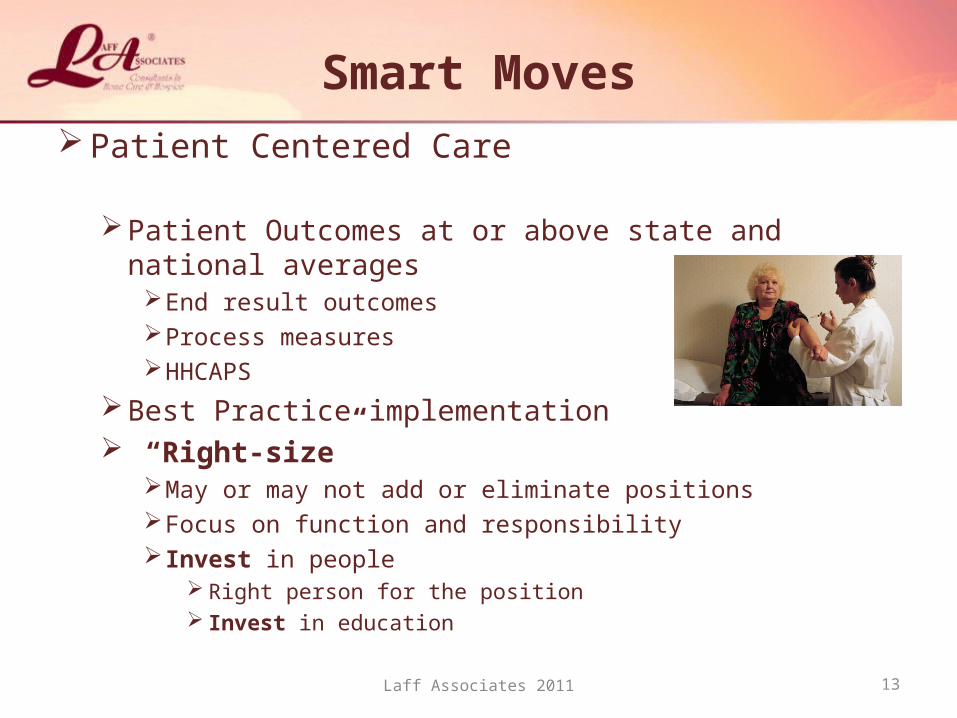
Smart Moves Patient Centered Care
Patient Outcomes at or above state and national averagesEnd result outcomesProcess measuresHHCAPS
Best Practice implementation “Right-size”
May or may not add or eliminate positionsFocus on function and responsibility Invest in people
Right person for the position Invest in education
Laff Associates 2011 13

Smart Moves
Eliminate “warm body syndrome” Stop “fixing”
Implement and integrate Telehealth Increase focus on preventing emergent care Increase focus on timely intervention and preventing
Potentially Avoidable Events Increase efficiency by increasing case capacity of case
managerDecrease unnecessary utilization
Laff Associates 2011 14
Case WeightCase weight variance – SOC to EOE less than 2%EOE case weight - (NOT SOC) is the case weight to “hang
your hat on” % of re-certifications and LOS
Worry if you have a LOS over 60 days! Visit Utilization Averages
Ratio nursing/therapy - shoot for 5-7 SN vs. 3-4 therapy Average visits per episode
Worry if average total visits per episode is over 17Be aware that it must be improved if average IS 17
Management Reports / Statistics
Laff Associates 2011 15
Management Reports / Statistics
Actual Revenue versus Anticipated RevenuesDowncodesActual revenue = EOE
Timeliness of RAP Submission Set a standard of 7-14 days
% of Therapy Visits per Threshold Look for therapy threshold “clusters” (will likely disappear
in 2012)
Laff Associates 2011 16

Management Reports / Statistics Productivity by discipline
Actual # of patients visited (not weighted)
Cases Managed per Clinician Goal of 20 – 25 (without telehealth)Goal of 25-30 (with telehealth)WHO IS REALLY MANAGING THE PATIENT?
OASIS Errors by ClinicianYou cannot afford repeated errors!
Laff Associates 2011 17

Smartest Moves
Productivity expectations SN -Minimum average of 5 actual visits per day – 6 – 6.25
weighted visitsPT – Minimum average of 5.5 actual visits per day – 6.5
weighted visits Supervisor/Manager – 1 per 5-7 FTEs (depends on function)
OASIS Reviewer – w/data manager - 75 - 85 patients Adequate OASIS review process
Data management tool to decrease review time and increase accuracy
Laff Associates 2011 18

Management Statistics
OASIS Corrections CompletedDo you ask for justification when errors not corrected?
Outcomes Improvement Patient Declines – actual or documentation?Potentially Avoidable Events 2011 Surveyor Guidelines
Tier I PAEsEmergent care for injury caused by a fall at homeEmergent care for wound infections, deteriorating
wound status.
Laff Associates 2011 19

Potentially Avoidable EventsTier 2 PAEs
Emergent Care for Improper Medication Administration, Medication Side Effects
Emergent Care for Hypo/Hyperglycemia Substantial Decline in ≥ Three Activities of Daily Living Discharged to the Community Needing Wound Care or Medication
Assistance Discharged to the Community Needing Toileting AssistanceDischarged to the Community with Behavioral Problems Have you audited each of them?Are your audits documented?What have you done to prevent them in the future?
Laff Associates 2011 20

You May Be At Risk If…. A review of operations and records indicates
presence of one or all of the following;Many OASIS item inconsistencies Large variance in SOC/EOE DX Coding errorsVery low average EOE case weight - 1.100High LUPA rate – over 12%Higher than average therapy utilization LOS average over 60 days / multiple re-certificationsMultiple recertifications per patient with “rotating primary
DX” Skilled service provided to large % of patients is
“Observation & Assessment”
Laff Associates 2011 21

Primary case management – Clinician – with patient contact May be RN or PTMust be accountable for patient and financial outcomesAccurate assessmentAppropriate care planConstant knowledge of;
Goals of care Projected visits vs. actualTeam performance – Therapists must be included in the team Patient response to careNeed for change in plan
Accountability
Laff Associates 2011 22

Smart Moves
OASIS AccuracyAccuracyWho is reviewing the OASIS?
Is that a primary function?Is that individual qualified? - RN COS-C
Manual review or Data Scrubber? Duplicative functionsCorrections versus consequence….Management oversight
Laff Associates 2011 23

Adequate education Validate and reinforce
How do you know?What checks are in place?How long does it take?Who is validating what?Were the suggested corrections actually made?What “tools” do you use?Are there repeated errors? If so – WHY?
Repeated errors cost money
Smart Moves
Laff Associates 2011 24

Do You EverHave Enough Staff?
How do you know???? It depends……..
Clinical ModelAgency Size and Scope
GeographyVolume
Paper or Point of CareClerical versus Clinical Function
Laff Associates 2011 25

When is Enough Enough?
The Clinical Director comes to you and says “I don’t have enough nurses to see all these new patients. What’s the first thing you do?
a. Call a temp agencyb. Put an add in the paperc. Review statistics
Laff Associates 2011 26

Need More Staff???
Review Statistics!!!Validate Need Before You Jump the Gun!Must ensure you are adequately staffed…
but not over staffed!!!ManagementField Staff
Laff Associates 2011 27
Staffing-Statistics to Review
Number of ACTIVE patients on your census list “Clean” census listAll discharges removed at least weekly Identify why “old” patients remain – someone is not
“managing” well… Expectations for staff productivity
Visits per day, per week Actual performance of staff – how many actual un-
weighted visits per day did they perform last week? Identify “weakest links” and investigate why….
Laff Associates 2011 28

Standardize Productivity Do you expect the same level performance from
each clinician? If not – why not?
Are your expectations per clinician met?Are they reasonable? Maybe too reasonable???
Do you use remote monitoring? Do you supervise, monitor and enforce the
expectations?Or are you using the “warm body approach?”
Is there a consequence for non-performance?
Laff Associates 2011 29

Set Realistic Expectations
Number of visits per day is dependent upon your clinical model;Do your field nurses case manage a census of patients” If so – is the number consistent among your staff?Do you have admission nurses?Do you use a point of care documentation system?How many miles does a clinician average per day/week?How are they compensated?How often are the patients’ care case conferenced?
Laff Associates 2011 30

Smartest Moves…It Depends…
Primary Care Case ManagementClinician manages – 20 – 25 patients…it depends….
Effective use of Telehealth will increase clinician case capacityResponsible for entire episode of careResponsible for patient and financial outcomesDon’t come into the office to get NRS
Adequate supervision Supervision – primary responsibilityAbility to enforce process and policy for productivity,
OASIS corrections, appropriate care delivery
Laff Associates 2011 31
Achieving Positive FinancialFinancial Outcomes
Let’s talk about controlling costs…. Direct Cost per Visit by Discipline
Compensation methodology and incentivesProductivity and efficiency of staffCase CapacityOutcome achievement
Consider a Weekender Program! Appropriate utilization of services and supplies
Frequencies and durationsProvision of supplies
Clinical oversightLaff Associates 2011 32

Achieving Positive FinancialFinancial Outcomes
Gross profit issues – Control the Direct Cost/Visit & NRS Direct Costs are the majority of agency’s total operating expenses The majority of the direct cost/visit is compensation and related
taxes (staff and direct supervision) The cost/visit of premium-based fringes is directly proportional to
visits made The cost of mileage/auto reimbursement is directly related to
geographically sequential patient scheduling, the size of the territory and a global vision of the entire week
An agency specific formulary and trunk supply protocol, electronic ordering with independent oversight and patient specific direct delivery reduces costs and increases productivity
Laff Associates 2011 33
Weekender Program
Begins Friday at noon..ends Monday at noon Friday admissions – patients with weekend follow-up visitsMonday morning conference call with weekday RNs
Converts Agency from 5 days/ week plus weekends to 7 days/week
Frequencies spread over 7 days, not just 5 days Do all weekend visits Takes weekend on-call Eliminates weekday staff weekend rotation and
compensatory timeLaff Associates 2011 34

Weekender Program
Shares case management responsibilities with weekday RN – patients with weekend frequencies
Weekend differentials apply Considered full-time for Fringe Benefits
Laff Associates 2011 35

Achieving Positive FinancialFinancial Outcomes
Who owns the patient? Using a combination of Admission and Visit RNs /LPNs
challenges both good clinical and financial outcomes Lacks care consistency and continuity Limited, if any, patient care oversightCause of patient dissatisfaction
Primary Care Case Management achieves all of the desired patient care outcome goals and is the best approach towards best financial outcomesCompletely integrates with incentive compensation for both
the field clinician and their immediate supervisor!
Laff Associates 2011 36
Achieving Positive FinancialFinancial Outcomes
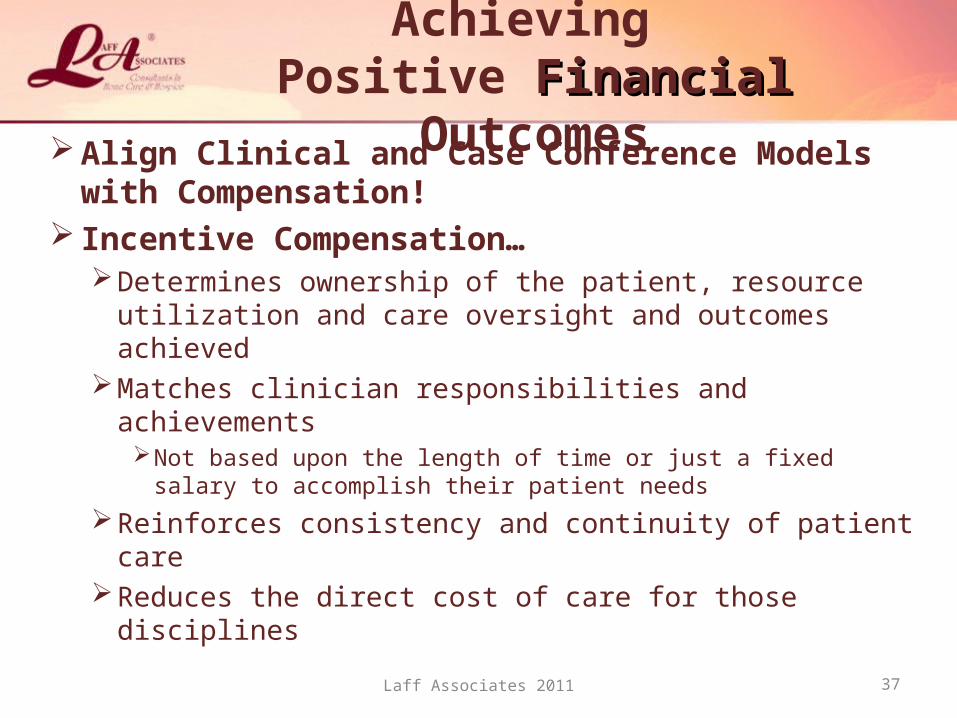
Align Clinical and Case Conference Modelswith Compensation!
Incentive Compensation…Determines ownership of the patient, resource utilization
and care oversight and outcomes achievedMatches clinician responsibilities and achievements
Not based upon the length of time or just a fixed salary to accomplish their patient needs
Reinforces consistency and continuity of patient careReduces the direct cost of care for those disciplines
Laff Associates 2011 37

Achieving Positive FinancialFinancial Outcomes
Key Ingredients! Effective Clinical Management (Supervisory) staff Primary Case Management Case Conference Model – Controls visit utilization
Every Patient…Every 14 days from SOC date!Reviews prior 14 days utilization and outcome achievementPlans next 14 days utilization and outcome goals
Tools for efficiency Laptops with power cords to car power source and air-cards Smart cell phonesPatient specific electronic ordering and delivery of NRS
Laff Associates 2011 38

Achieving Positive FinancialFinancial Outcomes
Primary Care Case Managers are responsible for the: Case Management of their patients Primary visits, including admission, resumptions and
recerts, most follow-ups and the discharge. Achieve the desired patient outcomes and HH-CAHPs
results Self scheduling!
Places responsibility where it belongsProvides for more autonomy and control of clinician’s
day…Eliminates the cost of schedulers
Laff Associates 2011 39

Incentive Based Compensation
Compensates the staff for what they do, not for how long it takes them to complete what they do!
Rewards efficiency, productivity, capacity and clinical (HH-CAHP) outcomes achievement
Improves team chemistry…Encourages under-performing staff to improve or seek a successful career elsewhere
Assures that clinicians meet and exceed individual productivity and case capacity goals
Applies to Weekender staffIT WORKS!
Laff Associates 2011 40
Incentive Based Compensation
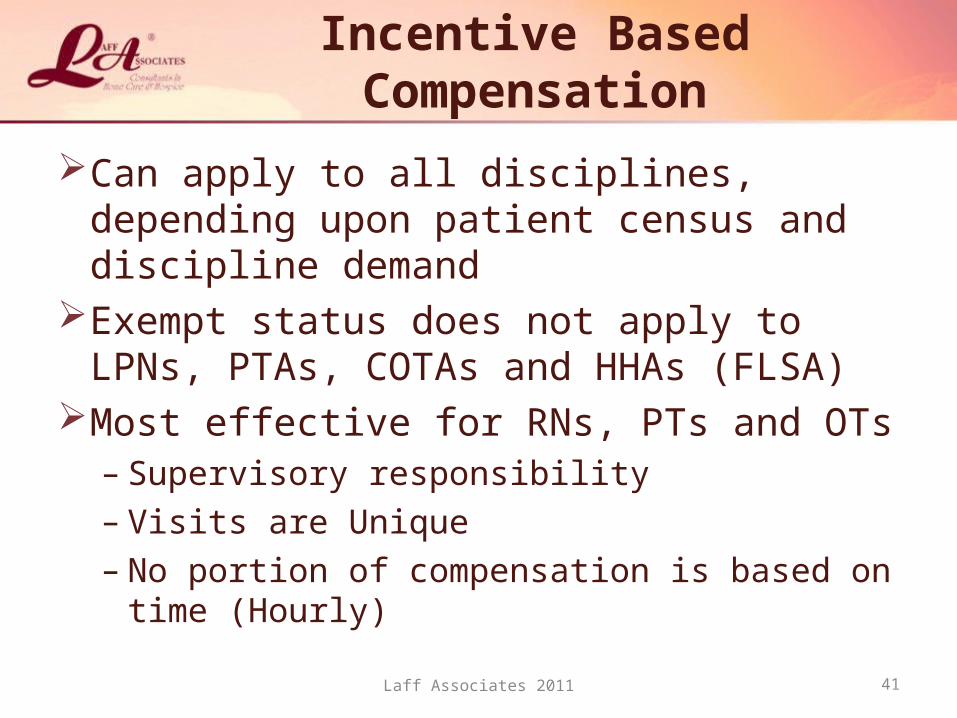
Can apply to all disciplines, depending upon patient census and discipline demand
Exempt status does not apply to LPNs, PTAs, COTAs and HHAs (FLSA)
Most effective for RNs, PTs and OTs– Supervisory responsibility– Visits are Unique– No portion of compensation is based on time
(Hourly)
Laff Associates 2011 41
Visit Weights
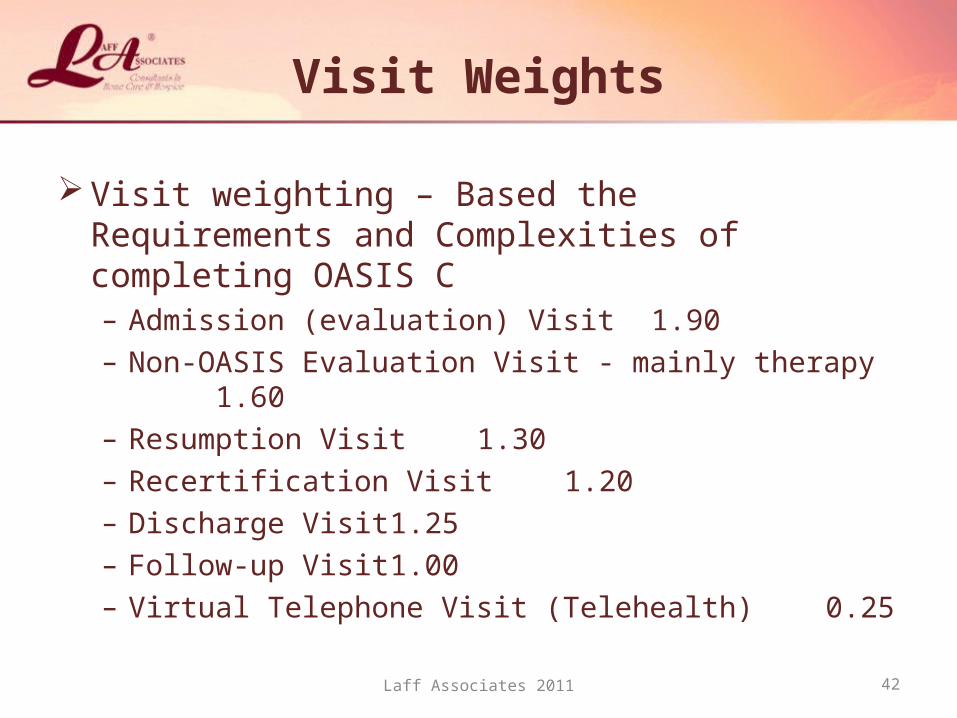
Visit weighting – Based the Requirements and Complexities of completing OASIS C– Admission (evaluation) Visit 1.90– Non-OASIS Evaluation Visit - mainly therapy 1.60– Resumption Visit 1.30– Recertification Visit 1.20– Discharge Visit 1.25– Follow-up Visit 1.00– Virtual Telephone Visit (Telehealth) 0.25
Laff Associates 2011 42

Questions Often Asked( Visit Weight – Time Equivalents Based upon OASIS C)
Visits /Day Follow-up Admission Resumption Recert. Discharge
Visit Value 1.00 1.90 1.30 1.20 1.25
5.00 96 minutes1hr 36min
182.4 minutes3 hrs 2min
124.8 minutes2 hrs 5min
115.2 minutes1 hr 55min
120.0 minutes2 hrs
5.25 91.4 minutes1hr 31 min
173.7 minutes2hrs 54min
118.9 minutes1hr 59min
109.7 minutes1hr 50min
114.3 minutes1hr 54min
5.50 87.3 minutes1hr 27min
165.8 minutes2hrs 46min
113.5 minutes1hr 53min
104.7 minutes1hr 45min
109.9 minutes1hr 49min
5.75 83.5 minutes1hr 23min
158.6 minutes2hrs 39min
108.5 minutes1hr 49min
100.2 minutes1hr 40min
104.4 minutes1hr 44min
6.00 80 minutes1hr 20min
152 minutes2hrs 32min
104 minutes1hr 44min
96 minutes1hr 36min
100 minutes1hr 40min
Includes hands-on, documentation, travel, conference and case management time
43Laff Associates 2011
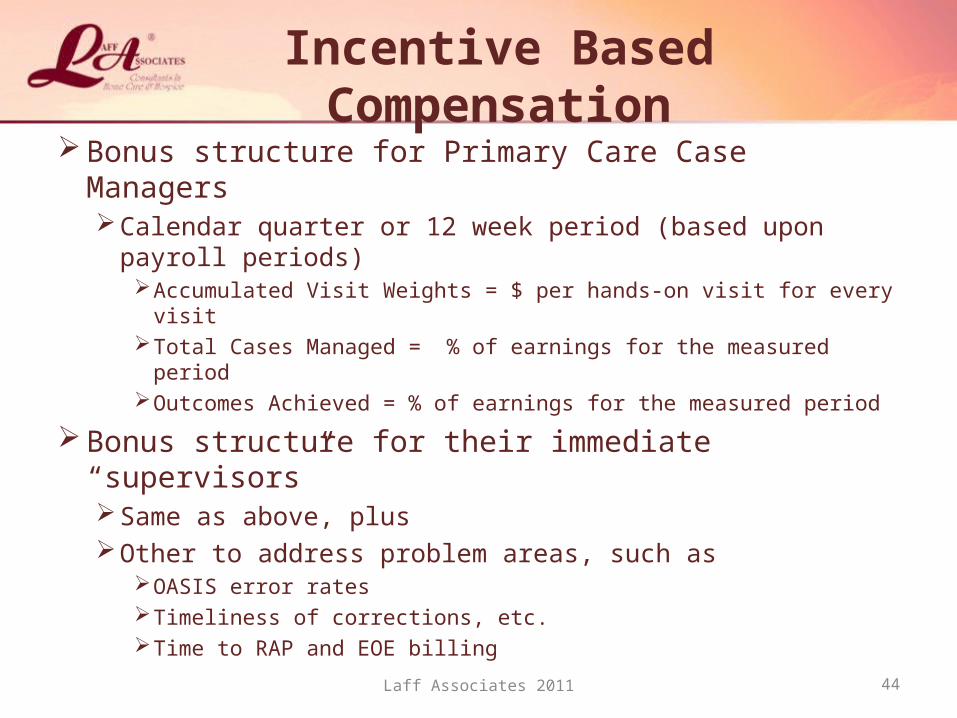
Incentive Based Compensation Bonus structure for Primary Care Case Managers
Calendar quarter or 12 week period (based upon payroll periods)Accumulated Visit Weights = $ per hands-on visit for every visitTotal Cases Managed = % of earnings for the measured periodOutcomes Achieved = % of earnings for the measured period
Bonus structure for their immediate “supervisors” Same as above, plusOther to address problem areas, such as
OASIS error ratesTimeliness of corrections, etc.Time to RAP and EOE billing
Laff Associates 2011 44
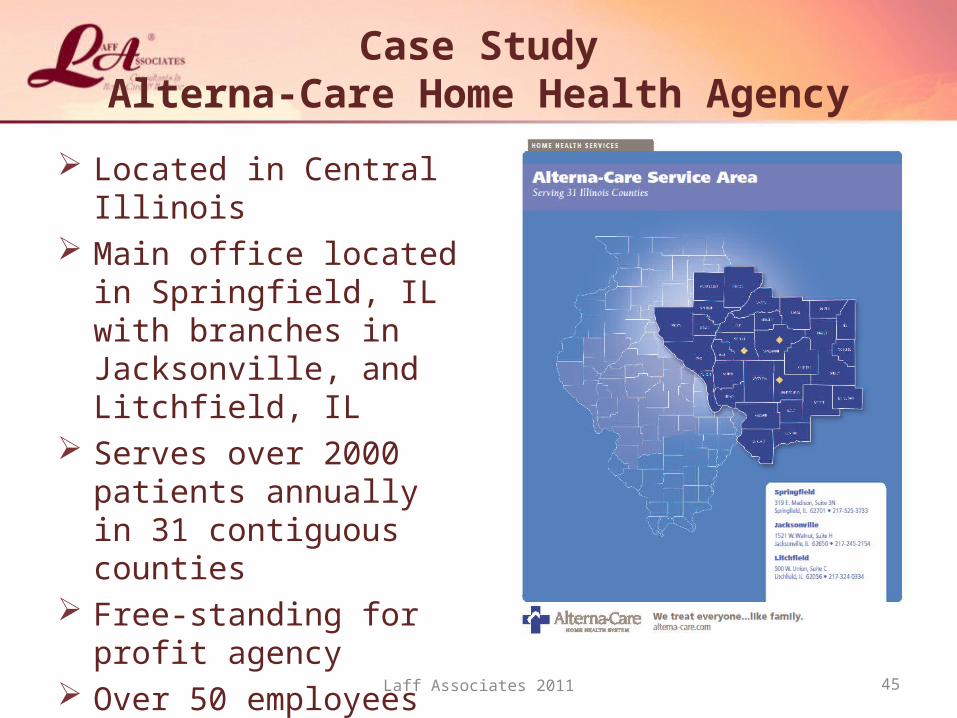
Case StudyAlterna-Care Home Health Agency
Located in Central Illinois Main office located in
Springfield, IL with branches in Jacksonville, and Litchfield, IL
Serves over 2000 patients annually in 31 contiguous counties
Free-standing for profit agency
Over 50 employees
45Laff Associates 2011

Benefits of Incentive Compensation
Lost a nurse and didn’t have to be replaced Improved communication with nurses and supervisor Documentation is timely and better quality Telehealth is being used more consistently and the
telephone follow up visits are visit weighted Incentive compensation has improved ER and
Hospital outcomes
46Laff Associates 2011

Incentive Compensation Results
Nursing productivity increased Timeliness of documentation improved. For the first time
anyone can remember, all nurses notes were completed within 24 hours.
MD verbal orders and recertifications were completed on time
Visit frequency orders were accurate Case loads increased per nurse Nurses made more visits per day and made more money Monitors were in patient homes and no longer on the
shelves47Laff Associates 2011

Average Patient Caseload 2009 vs. 2010
2009 -7.5 nurses with an average monthly case load of 36.3 (unduplicated patients)
2010 -6.5 nurses with an average monthly case load of 44.9 (unduplicated patients)
(excludes PT only patients)
48Laff Associates 2011

Visit ProductivityAverage Visits Per Nurse
2009 Jan Feb Ma Apr May Jun July Aug Sept Oct Nov Dec
Avg. cases/RN 22 21 22 24 28 23 20 21 20 24 23 24
Monthly Undup. Census
223 233 229 240 253 229 205 208 195 216 210 213
No. of Nurses 10 11 10 10 9 10 10 10 10 9 9 9
2010Avg. Cases/RN 24 31 30 27 30 35 32 27 31 29 29 37
Monthly Undup. Census
216 252 242 222 247 279 264 237 241 257 260 257
No. of Nurses 9 8 8 8 8 8 8 9 8 9 9 7
49Laff Associates 2011

HHCAHPS
HHCAPS HIGHER % ARE BETTER
% RANKING
Care of Patients 99% 92% (Top 8%)
Communications Between Providers and Patients 95% 90% (Top 10%)
Specific Care Issues 91% 82% (Top 18%)
% of Patients who Rated Agency 9 or 10 95% 83% (Top 17%)
% of Patients who would Recommend Agency 83% 56% (Top 44%)
50Laff Associates 2011

Average Nurse 11 Month Salary
2009 - Average 11 month comp. was $ 38,4122010 - Average 11 month comp. was $ 46,362
Increase of $ 7,950 = 20.69%2009 - Total Per Diem comp was $ 31,0222010 - Total Per Diem comp was $ 10,119
Reduction of $ 20,903 = 67.38%2009 - Direct Cost per Nursing Visit - $ 79.71
2010 - Direct Cost per Nursing Visit - $ 63.90
Reduction of $ 15.81 = 19.83%51Laff Associates 2011
Incentive Compensation Results
Nurses did not complain! Comments:
“I’m really working hard”“It’s difficult to get your paperwork done with this
many patients”“But, I’m not complaining”Supervisor states nurses are contentNo problem getting nurses to see patients on
weekends!!!No push back when given a new admission in their
territory!
52Laff Associates 2011

Incentive CompensationThe Results
The Direct and Total Cost per Visit were substantially reduced!
Visits per episode were effectively reduced Incentive compensation increased efficiency
throughout the entire organizationQuality of patient care was positively impactedAccounting department is able to bill timelyClinical staff are rewarded for their hard workCommunication with clinical managers improvedTelehealth being utilized to its fullest capabilities
53Laff Associates 2011

Effective Episode Management
Reduces episode cost, increases efficiency and communication, and improves clinical and financial outcomes
Integrates:Clinical Supervisory Management and OversightPrimary Care Case ManagementGoals and Performance
Can enhance compensation and reward excellent performance
Laff Associates 2011 54

Lynda Laff, RN, COS-C Pat Laff, CPA Laff AssociatesConsultants in Home Care & HospicePhone: (843) 671-4170Email: [email protected]: [email protected] Website: www.laffassociates.com
Contact Information
Laff Associates 2011 55