presented by nancy jones, managing director sarah meacham, consultant pfm asset management llc pam...
TRANSCRIPT

POOLSAFETYDo Not Dive In
Without
Reading theRules
CAMP CODE 110 Presented byNancy Jones, Managing Director
Sarah Meacham, ConsultantPFM Asset Management LLC
Pam Milliron, LAIF AdministratorCalifornia State Treasurer’s Office
PFM
Investment Advisors to the Public Sector© 2010 PFM Asset Management LLC 2
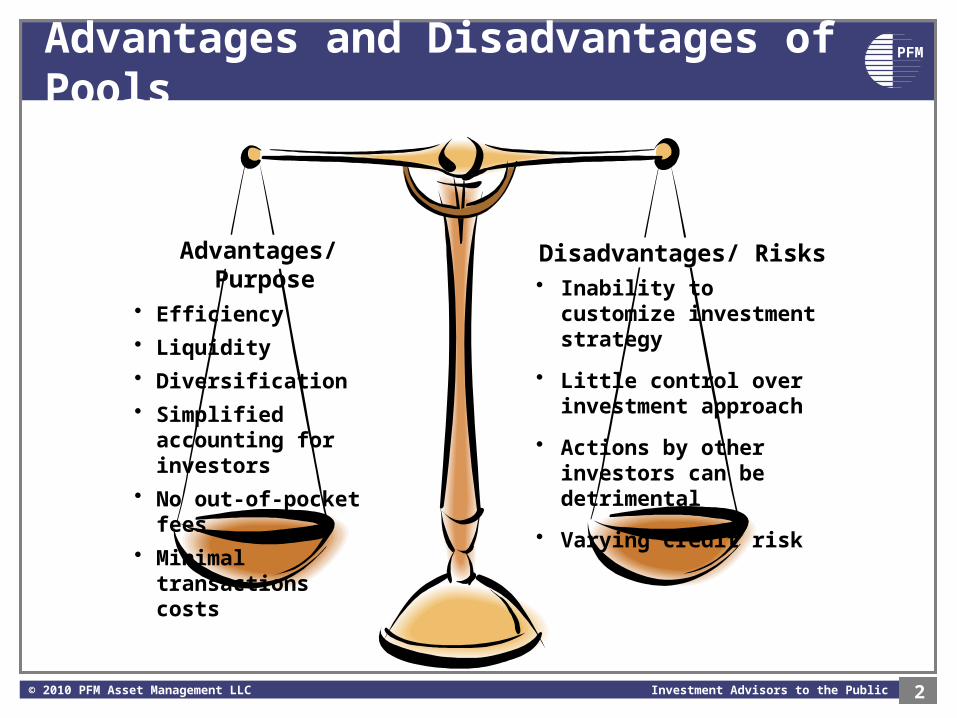
Advantages and Disadvantages of Pools
Advantages/Purpose• Efficiency
• Liquidity
• Diversification
• Simplified accounting for investors
• No out-of-pocket fees
• Minimal transactions costs
Disadvantages/ Risks• Inability to customize
investment strategy
• Little control over investment approach
• Actions by other investors can be detrimental
• Varying credit risk

PFM
Investment Advisors to the Public Sector© 2010 PFM Asset Management LLC 3
Why thinking about which
investment pool you are
going to invest in is
important?

PFM
Investment Advisors to the Public Sector© 2010 PFM Asset Management LLC 4
Swim At Your Own RiskState of Arizona LGIP
City of Bullhead
Town of Chino Valley
City of Douglas
City of El Mirage
City of Flagstaff
City of Florence
City of Glendale
City of Goodyear
City of Kingman
Lake Havasu City
City of Maricopa
City of Sedona
City of Sahuarita
City of Tempe
County of Mohave
County of Pima
County of Santa Cruz
Florida SBA Pool
City of Port St. Lucie
State of Minnesota Board of Investment
State of Oregon Investment Pool
Washington State Investment Board
Reserve Primary Fund
County of San Mateo, CACity of Daly CityCity of Redwood CityCity of San BrunoBay Area Air Quality Management DistrictPeninsula Corridor Joint Powers BoardSan Mateo County Transportation AuthoritySan Mateo CCCDSequoia Union High SD
County Alameda, CA
County of Madera, CA
County of Monterey, CA
County of Placer, CA
County of Plumas, CA
County of Sacramento, CA
County of Santa Clara, CA
County of San Diego, CA
County of Tehama, CA
County of Toulomne, CA
County of Mohave, AZ
County of Sarasota, FL
Sources:“Lehman Bros. bust hit San Mateo County hard,” SFGate.com, October 18, 2008Website of Congresswoman Jackie Speier (http://speier.house.gov/uploads/Lehman%20Work%20Group%20Loss%20Exposure%20listing1.doc)

PFM
Investment Advisors to the Public Sector 5© 2010 PFM Asset Management LLC
Do Your Own Due Diligence
• Investment policy
• Permitted investments
• Credit quality
• Liquidity
• Management
• Market price exposure
• Sensitivity analysis

PFM
Investment Advisors to the Public Sector© 2010 PFM Asset Management LLC 6
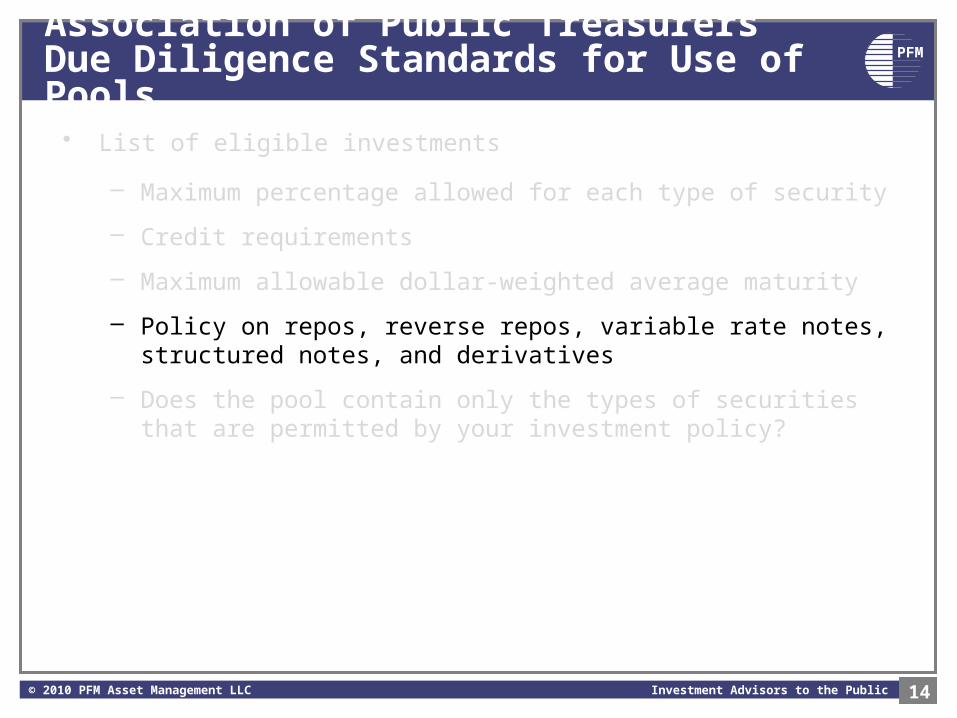
Association of Public TreasurersDue Diligence Standards for Use of Pools
• List of eligible investments
– Maximum percentage allowed for each type of security
– Credit requirements
– Maximum allowable dollar-weighted average maturity
– Policy on repos, reverse repos, variable rate notes, structured notes, and derivatives
– Does the pool contain only the types of securities that are permitted by your investment policy?

PFM
Investment Advisors to the Public Sector© 2010 PFM Asset Management LLC 7
Association of Public TreasurersDue Diligence Standards for Use of Pools
• List of eligible investments
– Treasuries?
– Federal Agencies?
– Commercial paper?
– CDs?
– Asset-backed securities?
– Corporate notes?

PFM
Investment Advisors to the Public Sector© 2010 PFM Asset Management LLC 8
Association of Public TreasurersDue Diligence Standards for Use of Pools
• List of eligible investments
– Maximum percentage allowed for each type of security
– Credit requirements
– Maximum allowable dollar-weighted average maturity
– Policy on repos, reverse repos, variable rate notes, structured notes, and derivatives
– Does the pool contain only the types of securities that are permitted by your investment policy?

PFM
Investment Advisors to the Public Sector© 2010 PFM Asset Management LLC 9
Association of Public TreasurersDue Diligence Standards for Use of Pools
• List of eligible investments
– Maximum percentage allowed for each type of security
• 2%
• 5%
• 10%

PFM
Investment Advisors to the Public Sector© 2010 PFM Asset Management LLC 10
Association of Public TreasurersDue Diligence Standards for Use of Pools
• List of eligible investments
– Maximum percentage allowed for each type of security
– Credit requirements
– Maximum allowable dollar-weighted average maturity
– Policy on repos, reverse repos, variable rate notes, structured notes, and derivatives
– Does the pool contain only the types of securities that are permitted by your investment policy?

PFM
Investment Advisors to the Public Sector© 2010 PFM Asset Management LLC 11
Association of Public TreasurersDue Diligence Standards for Use of Pools
• List of eligible investments
– Maximum percentage allowed for each type of security
– Credit requirements for securities in the pool
• A-1+
• A-1
• AAA
• AA
• A
• One rating agency or two

PFM
Investment Advisors to the Public Sector© 2010 PFM Asset Management LLC 12
Association of Public TreasurersDue Diligence Standards for Use of Pools
• List of eligible investments
– Maximum percentage allowed for each type of security
– Credit requirements
– Maximum allowable dollar-weighted average maturity
– Policy on repos, reverse repos, variable rate notes, structured notes, and derivatives
– Does the pool contain only the types of securities that are permitted by your investment policy?

PFM
Investment Advisors to the Public Sector© 2010 PFM Asset Management LLC 13
Association of Public TreasurersDue Diligence Standards for Use of Pools
• List of eligible investments
– Maximum percentage allowed for each type of security
– Credit requirements for securities in the pool
– Maximum allowable dollar-weighted average maturity (WAM)
• 60 days
• 90 days
• 180 days
• 1 year
• 2 years
PFM
Investment Advisors to the Public Sector© 2010 PFM Asset Management LLC 14
Association of Public TreasurersDue Diligence Standards for Use of Pools
• List of eligible investments
– Maximum percentage allowed for each type of security
– Credit requirements
– Maximum allowable dollar-weighted average maturity
– Policy on repos, reverse repos, variable rate notes, structured notes, and derivatives
– Does the pool contain only the types of securities that are permitted by your investment policy?

PFM
Investment Advisors to the Public Sector© 2010 PFM Asset Management LLC 15
Association of Public TreasurersDue Diligence Standards for Use of Pools
• Interest calculations
– Methodology used to calculate interest
– Frequency of interest payments
– Options for payment of interest
– How gains and losses are reported

PFM
Investment Advisors to the Public Sector© 2010 PFM Asset Management LLC 16
Association of Public TreasurersDue Diligence Standards for Use of Pools
• Interest calculations
– Methodology used to calculate interest
• Amortized cost vs. mark-to-market
• Daily interest factor vs. average monthly yield

PFM
Investment Advisors to the Public Sector© 2010 PFM Asset Management LLC 17
Association of Public TreasurersDue Diligence Standards for Use of Pools
• Interest calculations
– Methodology used to calculate interest
– Frequency of interest payments
• Monthly
• Quarterly

PFM
Investment Advisors to the Public Sector© 2010 PFM Asset Management LLC 18
Association of Public TreasurersDue Diligence Standards for Use of Pools
• Interest calculations
– Methodology used to calculate interest
– Frequency of interest payments
– Options for payment of interest
• Reinvest into shares
• Cash payment
• Transfer to another account

PFM
Investment Advisors to the Public Sector© 2010 PFM Asset Management LLC 19
Association of Public TreasurersDue Diligence Standards for Use of Pools
• Interest calculations
– Methodology used to calculate interest
– Frequency of interest payments
– Options for payment of interest
– How gains and losses are reported
• Day of trade
• At the discretion of pool manager

PFM
Investment Advisors to the Public Sector© 2010 PFM Asset Management LLC 20
Association of Public TreasurersDue Diligence Standards for Use of Pools
• Safeguarding securities
– How often are securities priced?
– Source of prices?
– Who monitors the treasurer or investment advisor?
– How often do they get together to review?
– Who conducts the audit?
– What are the safekeeping arrangements?

PFM
Investment Advisors to the Public Sector© 2010 PFM Asset Management LLC 21
Association of Public TreasurersDue Diligence Standards for Use of Pools
• Safeguarding securities
– How often are securities priced?• Daily• Weekly• Monthly• Before every deposit or withdrawal

PFM
Investment Advisors to the Public Sector© 2010 PFM Asset Management LLC 22
Association of Public TreasurersDue Diligence Standards for Use of Pools
• Safeguarding securities
– How often are securities priced?
– Source of prices?• Pricing service• Bank• Broker

PFM
Investment Advisors to the Public Sector© 2010 PFM Asset Management LLC 23
Association of Public TreasurersDue Diligence Standards for Use of Pools
• Safeguarding securities
– How often are securities priced?
– Source of prices?
– Who monitors the treasurer or investment advisor?• City Council• Treasury Oversight Committee• Finance Director• Auditor

PFM
Investment Advisors to the Public Sector© 2010 PFM Asset Management LLC 24
Association of Public TreasurersDue Diligence Standards for Use of Pools
• Safeguarding securities
– How often are securities priced?
– Source of prices?
– Who monitors the treasurer or investment advisor?
– How often do they get together to review?• Monthly• Quarterly• Annually• Ad hoc

PFM
Investment Advisors to the Public Sector© 2010 PFM Asset Management LLC 25
Association of Public TreasurersDue Diligence Standards for Use of Pools
• Safeguarding securities
– How often are securities priced?
– Source of prices?
– Who monitors the treasurer or investment advisor?
– How often do they get together to review?
– Who conducts the audit?• Internal auditor• Independent firm

PFM
Investment Advisors to the Public Sector© 2010 PFM Asset Management LLC 26
Association of Public TreasurersDue Diligence Standards for Use of Pools
• Safeguarding securities
– How often are securities priced?
– Source of prices?
– Who monitors the treasurer or investment advisor?
– How often do they get together to review?
– Who conducts the audit?
– What are the safekeeping arrangements?• Third party-custodial bank• Broker

PFM
Investment Advisors to the Public Sector© 2010 PFM Asset Management LLC 27
Association of Public TreasurersDue Diligence Standards for Use of Pools
• Deposits and withdrawals
– Is there a minimum or maximum account size?
– Does the pool limit the number of transactions each month?
– Is there a limit on transaction amounts for deposits and withdrawals?
– Are the funds 100% withdrawable at any time?
– Notice of withdrawal requirement?
– Are voluntary investors allowed?

PFM
Investment Advisors to the Public Sector© 2010 PFM Asset Management LLC 28
Association of Public TreasurersDue Diligence Standards for Use of Pools
• Statements
– Do statements show transactions and yields in addition to balances?
– Are month-end holdings reports available?

PFM
Investment Advisors to the Public Sector© 2010 PFM Asset Management LLC 29
Association of Public TreasurersDue Diligence Standards for Use of Pools
• Fees
– What are the fees?
– How often are they assessed?
– How are they paid?
– Are expenses deducted before quoting the yield?
– Are there additional expenses for wire transfers?
– Are fees paid to a sponsoring organization?

PFM
Investment Advisors to the Public Sector© 2010 PFM Asset Management LLC 30
Additional Due Diligence
• Experience of the pool manager
– Experience of the treasurer or investment advisor
– Track record• Preservation of principal• Performance

PFM
Investment Advisors to the Public Sector© 2010 PFM Asset Management LLC 31
Types of Investment Risks
• Interest rate risk
• Credit/default risk
• Liquidity risk
• Volatility risk
• Reinvestment risk
• Call/prepayment risk
• Inflation risk
• Exchange-rate risk

PFM
Investment Advisors to the Public Sector© 2010 PFM Asset Management LLC 32
Types of Investment Pools
• Local Government Investment Pools (LGIPs)
– State pool (LAIF)
– County pools
– JPAs (CAMP, CalTrust)
• Money market funds
• Mutual funds

PFM
Investment Advisors to the Public Sector
Money Market Funds and Mutual Funds
• Mutual Funds
– Value of shares fluctuates
– WAM: greater than 90 days
– 20% maximum portfolio allocation, 10% per fund maximum
– Loss of principal is acceptable
– NOT generally recommended for public entities
• Money Market Funds
– Seeks to maintain a constant NAV of $1.00
– WAM: 90 days or less
– 20% maximum portfolio allocation
© 2010 PFM Asset Management LLC 33

PFM
Investment Advisors to the Public Sector
Money Market Funds and Mutual Funds
• Variable NAV Funds
– Fidelity Government Bond Fund
– JP Morgan Government Bond Fund
– Wells Fargo Advantage Municipal Bond Fund
– Federated U.S. Government Bond Fund
– CalTRUST Short-Term Fund
– CalTRUST Medium-Term Fund
– CalTRUST Long-Term Fund
• Stable $1 NAV Funds*
– Dreyfus Institutional Reserves Treasury Money Market Fund
– Federated Government Obligations Money Market Fund
– Fidelity Institutional Treasury Money Market Fund
– HighMark U.S. Government Money Market Fund
– CAMP Pool
– Wells Fargo Advantage Heritage Money Market Fund (CalTRUST)
© 2010 PFM Asset Management LLC 34
*These funds strive to keep a constant net asset value of $1.

PFM
Investment Advisors to the Public Sector© 2010 PFM Asset Management LLC 35
Money Market Funds and Pools
2a-7 2a-7 like
Pool manager registered under Investment Advisers Act of 1940
Yes Yes
Registered under the Investment Company Act of 1940
Yes No
Follows SEC rule 2a-7 Yes Yes
Section of CGC 53601 (l)(2) 53601 (p)
Maximum portfolio allocation by CGC
20% 100%
ExampleDreyfus Institutional Reserves Treasury Money Market Fund
CAMP Pool

PFM
Investment Advisors to the Public Sector© 2010 PFM Asset Management LLC 36
Amendments to 2a-7 Rules Effective January 2010
• Rules are intended to increase a money market fund's ability to withstand economic stresses and reduce the risk of runs on a fund.
• Highlights of the new rules include– Maturity restrictions – Liquidity requirements– Credit quality– "Know your investor" procedures– Periodic stress tests – Rating agencies– Repurchase agreements– Disclosure enhancements– Processing of transactions– Suspensions of redemptions– Purchases by affiliates

PFM
Investment Advisors to the Public Sector
Importance of Weighted Average Maturity
© 2010 PFM Asset Management LLC 37
0.980
0.985
0.990
0.995
1.000
1.005
1.010
1.015
1.020
1 30 60 90 120 150 190 220 250 280 310 340 365Days
Net
Ass
et V
alu
e at
Mar
ket Change in Net Asset Value
+ 2.00%
- 2.00%
+ 1.00%
- 1.00%
+ .50%
- .50%
0.980
0.985
0.990
0.995
1.000
1.005
1.010
1.015
1.020
1 30 60 90 120 150 190 220 250 280 310 340 365Days
Net
Ass
et V
alu
e at
Mar
ket Change in Net Asset Value
+ 2.00%
- 2.00%
+ 1.00%
- 1.00%
+ .50%
- .50%
Money market fundshave maximumWAM of 90 days

PFM
Investment Advisors to the Public Sector© 2010 PFM Asset Management LLC 38
Breaking the Buck

PFM
Investment Advisors to the Public Sector
0.9950
Importance of Weighted Average Maturity (WAM)
Weighted Average Maturity
If Rates Rise 3%
If Rates Rise 2%
If Rates Rise 1%
If Rates Rise 0.5%
If Rates Unchanged
If Rates Fall 0.5%
If Rates Fall 1%
If Rates Fall 2%
If Rates Fall 3%
30 Days 60 Days 90 Days 180 Days 1 Year 1.5 Years
0.9975 0.9925 0.9850 0.9700 0.9550
0.9983 0.9967 0.9950 0.9900 0.9800 0.9700
0.9992 0.9983 0.9975 0.9950 0.9900 0.9850
0.9996 0.9992 0.9988 0.9975 0.9950 0.9925
1.0000 1.0000 1.0000 1.0000 1.0000 1.0000
1.0004 1.0008 1.0013 1.0025 1.0050 1.0075
1.0008 1.0017 1.0025 1.0050 1.0100 1.0150
1.0017 1.0033 1.0050 1.0100 1.0200 1.0300
1.0025 1.0050 1.0075 1.0150 1.0300 1.0450
Value of a $1.00 Investment
© 2010 PFM Asset Management LLC 39
Money Market Fund Mutual Fund

PFM
Investment Advisors to the Public Sector
Changing Market Conditions
October 1998 – December 1998 (+0.86%)
Oct-98 Nov-98 Dec-983.80%
4.00%
4.20%
4.40%
4.60%
4.80%
Jan-94 Feb-94 Mar-94 Apr-943.40%
3.80%
4.20%
4.60%
5.00%
5.40%January 1994 – May 1994 (+2.07%)
Sep-94 Sep-94 Oct-94 Oct-94 Nov-94 Nov-94 Dec-945.40%
5.80%
6.20%
6.60%
7.00%
7.40%September 1994 – December 1994 (+1.74%)
Feb-96 Mar-96 Apr-96 May-96 Jun-964.75%
5.00%
5.25%
5.50%
5.75%
6.00%February 1996 – July 1996 (+1.17%)
© 2010 PFM Asset Management LLC 40
1-Year United States Treasury Bill Yields

PFM
Investment Advisors to the Public Sector
Changing Market Conditions
1-Year United States Treasury Bill Yields
Jan-99 Feb-994.40%
4.50%
4.60%
4.70%
4.80%
4.90%January 1999 – March 1999 (+0.50%)
Jul-99 Aug-994.80%
4.95%
5.10%
5.25%
5.40%July 1999 – August 1999 (+0.40%)
Apr-99 May-99 Jun-994.60%
4.75%
4.90%
5.05%
5.20%April 1999 – June 1999 (+0.52%)
Sep-99 Oct-99 Nov-99 Dec-995.00%
5.25%
5.50%
5.75%
6.00%
6.25%September 1999 – January 2000 (+0.96%)
© 2010 PFM Asset Management LLC 41

PFM
Investment Advisors to the Public Sector© 2010 PFM Asset Management LLC 42
Standard & Poor’s Money Market Fund Ratings
Rating Definitions
AAAmExtremely strong capacity to maintain principal value and limit exposure to principal losses due to credit, market, and/or liquidity risks
AAmVery strong capacity to maintain principal value and limit exposure to principal losses due to credit, market, and/or liquidity risks.
AmStrong capacity to maintain principal value and limit exposure to principal losses due to credit, market and/or liquidity risks.
BBBmAdequate capacity to maintain principal value and limit exposure to principal losses due to credit, market, and/or liquidity risks.

PFM
Investment Advisors to the Public Sector
Proposed Changes to Standard & Poor’s Fund Rating Credit Criteria
43
*Investments rated A-1 maturing in 7 days or less can be counted toward the A-1+ percentage.
RatingMin*A-1+
MaxA-1
MaxA-2
Current Proposed Current Proposed Current Proposed
AAAm 50% 50% 50% 50% 0% 0%
AAm 20% 20% 80% 80% 5%overnight 0%
Am 0% 0% 100% 100% 10% overnight 0%
BBBm 0% 0% 100% 100% 25% overnight 0%

PFM
Investment Advisors to the Public Sector
Proposed Changes to Standard & Poor’s Fund Rating Maturity Criteria
44
1. Max WAM is now “WAM to reset” or “WAM (R)”2. May be adjusted upward by 30 days (e.g. AAAm 120 days) if a fund invests only in government floating rate notes.3. “Spread to final” or “WAM (F)” will be introduce
RatingMax WAM (R)1
(days)Max WAM (F) 2,3
(days)
Current Proposed Current Proposed
AAAm 60 60 N/A 90
AAm 75 70 N/A 100
Am 90 80 N/A 110
BBBm 90 90 N/A 120

PFM
Investment Advisors to the Public Sector© 2010 PFM Asset Management LLC 45
Pools in California
PoolType ofFund NAV Rating WAM
SponsorshipFees
WithdrawalRestrictions
LAIF Hybrid Hybrid: Withdrawals at $1, market value factor
Notrated
120 days to1.5 years
No 15 transactionsper month
CountyPools
Varies Varies Varies 47 days to2.9 years
No Varies
CAMP Money marketpool (2a-7 like)
Stable NAV of $1 AAAm 90 days No None
CalTRUSTShort TermMedium TermLong Term
Mutual fund structure
VariableVariableVariable
AafNot ratedNot rated
0 to 2 years1.5 to 3.5 yrs5 to 7 years
YesYesYes
1-day notice5-day notice,monthly
CalTRUSTMoneyMarketFund
Wells FargoAdvantageHeritageMoney MarketFund
Stable NAV of $1 AAAm/Aaa
90 days Yes None
Sources:“LAIF website, Standard & Poor’s 2009 County Pool Survey, CalTRUST website

PFM
Investment Advisors to the Public Sector© 2010 PFM Asset Management LLC 46
Tips for Staying Afloat• Diversify
• Read
• Understand
• Monitor
• Select funds that meet your investment objectives

2009
California Municipal Treasurer's AssociationApril 21, 2010
Sacramento, California
LAIF – An Alternative Investment Pool
Presented by
Pam MillironLAIF Administrator
California State Treasurer’s Office

54 Counties2%
474 Cities17%
1,797 Districts65%
291 Trustees10%
175 Bonds6%
LOCAL AGENCY INVESTMENT FUNDParticipation as of 03/31/10
2,791 Agencies

LAIF36.70
%
Gen-eral
Fund11.68
%
Other0.53%
*SMIF51.09
%
SOURCE OF FUNDSPooled Money Investment Account
Average Quarterly Balance03/31/10
$66.3 Billion

Treasuries44.23%
Mortgages1.19%
Agencies14.29%
Certificates of Deposit/
Bank Notes10.93%
Time Deposits5.86%
Commercial Paper6.98%
Corporate Bonds0.18%
Loans16.34%
Pooled Money Investment AccountPortfolio Composition
$69.1 billion03/31/10

Portfolio as of 03-31-10 Pooled Money Investment Account
PAR VALUES MATURING BY DATE AND TYPEMaturities in Millions of Dollars
1 day 31 days 61 days 91 days 121 days 151 days 181 days 211 days 271 days 1 year 2 years 3 years 4 years to to to to to to to to to to to to to
ITEM 30 days 60 days 90 days 120 days 150 days 180 days 210 days 270 days 1 year 2 years 3 years 4 years 5 year/out
TREASURY 200$ 4,800$ 2,445$ 3,000$ 1,850$ 950$ 4,600$ 7,050$ 2,500$ 3,250$
REPO
TDs 2,274$ 866$ 913$
AGENCY 1,531$ 2,050$ 3,381$ 1,700$ 700$ 185$ 375$ 264$ 1,125$ 633$ 0$
BAs
CP 2,747$ 2,075$
CDs + BNs 2,300$ 4,100$ 1,150$
CORP BND 25$ 100$
TOTAL
59,139$ 8,852$ 9,291$ 10,243$ 4,145$ 3,725$ 2,135$ 950$ 4,975$ 7,314$ 3,625$ 3,883$ 0$
PERCENT 15.0% 15.7% 17.3% 7.0% 6.3% 3.6% 1.6% 8.4% 12.4% 6.1% 6.6% 0.0% 0.0%
Notes: 1. SBA Floating Rate Securities are represented at coupon change date.2. Mortgages are represented at current book value.3. Figures are rounded to the nearest million.4. Does not include AB55 and General Fund loans.

6/0
58
/05
10
/05
12
/05
2/0
64
/06
6/0
68
/06
10
/06
12
/06
2/0
74
/07
6/0
78
/07
10
/07
12
/07
2/0
84
/08
6/0
88
/08
10
/08
12
/08
2/0
94
/09
6/0
98
/09
10
/09
12
/09
2/1
00.00%
0.50%
1.00%
1.50%
2.00%
2.50%
3.00%
3.50%
4.00%
4.50%
5.00%
5.50%
STATE OF CALIFORNIAPOOLED MONEY INVESTMENT ACCOUNT
03/31/10Average Monthly Yield Comparison - 06/05 through 03/10
PMIA
FED FUNDS
MARCH YIELDS
PMIA 0.547%Fed Funds 0.159%


Benefits of Using Pools and PortfoliosTogether

PFM
Investment Advisors to the Public Sector
Mar 00 Mar 01 Mar 02 Mar 03 Mar 04 Mar 05 Mar 06 Mar 07 Mar 08 Mar 09 Mar 100%
1%
2%
3%
4%
5%
6%
7%
LAIF2-Year Treasury
When Interest Rates Are Rising . . .
Monthly YieldsMarch 2000 – March 2010
Source: Bloomberg
© 2010 PFM Asset Management LLC 55

PFM
Investment Advisors to the Public Sector
. . . Pools Outperform
• December 31, 2004
– LAIF: 1.50%– 2-Year Treasury: 3.07% (1.57% more than LAIF)
• December 31, 2006
– LAIF yield had risen to 5.13%
• December 31, 2004 to December 31, 2006
– Average yield for LAIF: 3.83%– 2-Year Treasury yield: 3.07%
• Advantage: LAIF +0.76%
© 2010 PFM Asset Management LLC 56

PFM
Investment Advisors to the Public Sector
Mar 00 Mar 01 Mar 02 Mar 03 Mar 04 Mar 05 Mar 06 Mar 07 Mar 08 Mar 09 Mar 100%
1%
2%
3%
4%
5%
6%
7%
LAIF2-Year Treasury
When Interest Rates Are Falling . . .
Monthly YieldsMarch 2000 – March 2010
Source: Bloomberg
© 2010 PFM Asset Management LLC 57

PFM
Investment Advisors to the Public Sector
. . . Treasuries Outperform
• September 30, 2007
– LAIF: 5.23%– 2-Year Treasury: 3.29% (1.24% less than LAIF)
• September 30, 2009
– LAIF yield had fallen to 0.75%
• September 30, 2007 to September 30, 2009
– Average yield for LAIF: 2.73%– 2-Year Treasury: 3.29%
• Advantage: Treasury +1.26%
© 2010 PFM Asset Management LLC 58

PFM
Investment Advisors to the Public Sector
Mar 00 Mar 01 Mar 02 Mar 03 Mar 04 Mar 05 Mar 06 Mar 07 Mar 08 Mar 09 Mar 10-2%
-1%
0%
1%
2%
3%
4%
5%
6%
7%
Return Dif-ferenceLAIF2-Year Treasury
Understanding the Pool Performance Cycle
2-Year U.S. Treasury Yields and LAIF Monthly YieldsCompared to 24-Month of Difference in Returns
Source: Bloomberg*Difference in return calculated as purchase yield of 2-year U.S. Treasury less LAIF’s average yield over next 24 months.
© 2010 PFM Asset Management LLC 59

PFM
Investment Advisors to the Public Sector© 2010 PFM Asset Management LLC 60
Mar 00 Mar 01 Mar 02 Mar 03 Mar 04 Mar 05 Mar 06 Mar 07 Mar 08 Mar 09 Mar 10$25,000,000.0
$27,500,000.0
$30,000,000.0
$32,500,000.0
$35,000,000.0
$37,500,000.0
$40,000,000.0 2-Year TreasuryLAIF
$38.6 Million
Source: Bloomberg
$34.6 Million
Cumulative Value
Growth of $25 MillionOver Past 10 Years Ended March 31, 2010
Portfolios Perform Better than Pools Over an Interest Rate Cycle

PFM
Investment Advisors to the Public Sector© 2010 PFM Asset Management LLC 61
Portfolios Perform Better than Pools Over an Interest Rate Cycle
Difference in AnnualizedPast 10 Year Return 1.14%
Difference in Investment IncomePer Year(on $25 Million)
$402,000
Difference in Investment Income Over Past 10 Years(on $25 Million)
$4.02 million
PFM
Investment Advisors to the Public Sector© 2010 PFM Asset Management LLC 62
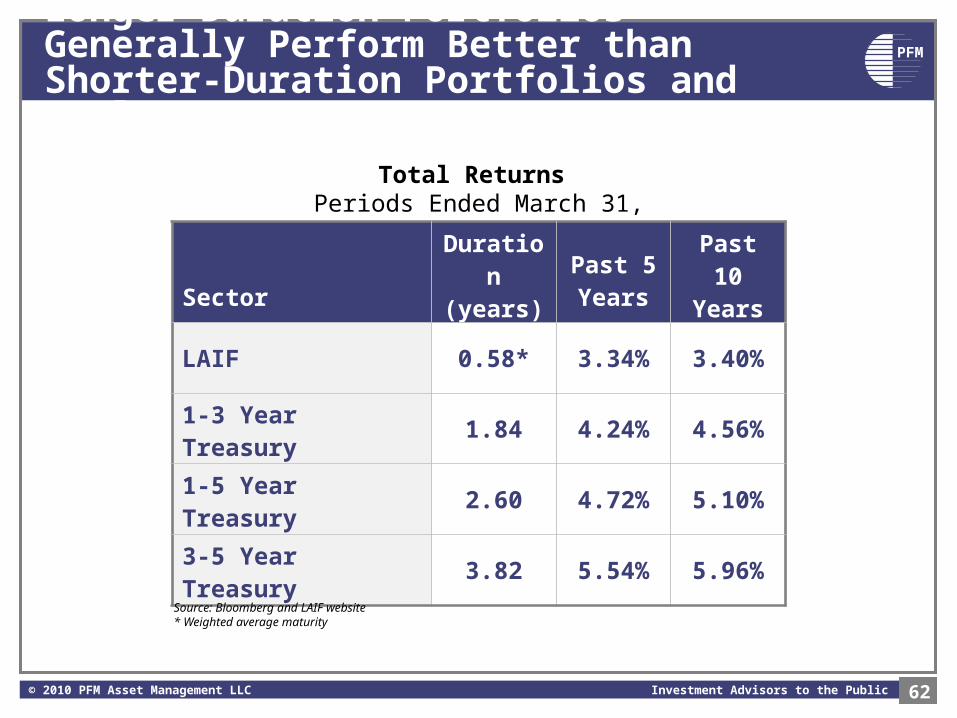
Longer-Duration Portfolios Generally Perform Better than Shorter-Duration Portfolios and Pools
Total Returns Periods Ended March 31, 2010
SectorDuration(years)
Past 5 Years
Past 10 Years
LAIF 0.58* 3.34% 3.40%
1-3 Year Treasury 1.84 4.24% 4.56%
1-5 Year Treasury 2.60 4.72% 5.10%
3-5 Year Treasury 3.82 5.54% 5.96%
Source: Bloomberg and LAIF website* Weighted average maturity

PFM
Investment Advisors to the Public Sector© 2010 PFM Asset Management LLC 63
Conclusion
• Not all pools are the same
• Know what you are investing in
• Diversify your investments
– Use more than one pool– Consider buying specific securities– Combine a pool, for liquidity, with a portfolio to stabilize earnings

PFM
Investment Advisors to the Public Sector© 2010 PFM Asset Management LLC 64
Online Resources
• LAIFwww.treasurer.ca.gov/pmia-laif/
• CAMPwww.camponline.com
• CalTRUSTwww.caltrust.org
• GFOAwww.gfoa.org/downloads/cashlgip.pdf
• APT US&Cwww.aptusc.org/includes/getpdf.php?f=Investment_Application.pdf
• Standard & PoorsCalifornia County Pools: www2.standardandpoors.com/portal/site/sp/en/eu/page.article/2,1,6,4,1204847189739.htmlLGIPs: www2.standardandpoors.com/portal/site/sp/en/eu/page.topic/ratings_fr_gip/2,1,6,4,0,0,0,0,0,0,0,0,0,0,0,0.html

PFM
Investment Advisors to the Public Sector© 2010 PFM Asset Management LLC 65
Thank you!