presented by: paul hughes authored by: paul hughes, dr. rimas pakalnis, dr. michael hitch, cristian...
TRANSCRIPT

Presented by: Paul Hughes
Authored by: Paul Hughes,Dr. Rimas Pakalnis, Dr. Michael Hitch,Cristian CaceresUniversity of British Columbia
Ray WilkinsGoldcorp Inc – Red Lake Mine
CIM AGM- Edmonton, AlbertaPERFORMANCE OF COMPOSITE PASTE FILL FENCES

Purpose of Research
• What are the loading mechanics of paste against barricades?
• What is the capacity of the composite paste fill fences?
• Based on the loading mechanics of the paste, do the fill fences pose a risk of failure?

Outline• Glossary of Terms• General Introduction• Research Methodology• Site Description• Instrumentation Program• Results• Analysis• Conclusions• Recommendation for
Future Work

Glossary of Terms:
Potvin, Thomas, Fourie (2005), define paste as follows:
• Contains at least 15% passing 20 microns
• When placed does not bleed water
• Does not settle or segregate in a pipeline
• Has a slump less than 230 mm
• Contains typically between 75% and 85% solid by weight
• Between 1% and 10% Binder
PASTE

Glossary of Terms:•A paste barricade, or paste fill fence, is a constructed barricade whose purpose is to retain backfill within a mined-out stope.
•Composite Fill Fence :– rebar skeleton – adequate thickness of
shotcrete
•Other examples:– Concrete bulkheads– Timber bulkheads– Cable sling bulkheads
COMPOSITE PASTE BARRICADE

Why is This Research Necessary?
• The majority of the applicable barricade research focuses on hydraulic fill barricades in open stope mining.
• Barricade pressures in these instances are much larger than those experienced in paste backfill barricades.
• Current paste loading theory is based on material with a different loading mechanism.
• Although some research is currently underway, the majority of the paste barricade research is based on brick barricades and not composite barricade types.

Contributions to Operations
• Economic benefits: » increases in fill pour rate» continuous paste pours» widening of stope dimensions dictated by
barricade loads.
• Safety benefits:» discontinuities between successive paste
pours would be minimized» the risk of designing a backfill stope that
would exceed a barricade’s capacity is largely eliminated.

SITE STUDY- Red Lake Mine•Located in Balmertown, Ontario
•Nearest towns: Kenora and Dryden
•Accessed via Highway 105 or local airport
•Nearest International Airport - Winnipeg, Manitoba
RED LAKE

Red Lake Mining MethodsMining Method
2002 2003 2004
Overhand Cut and Fill
100% 70% 60%
Underhand Cut and Fill
0% 25% 25%
Pillar Recovery
0% 5% 15%
Overhand Cut and Fill
Progression of mining
Underhand Cut and FillPillar Removal

Fill Fences at Red Lake
• Rebar anchored 0.6 m on walls and floor when • Holes in rock must be filled with resin and 2.1 m ,#6 rebar must be spun into hole• Fence to be constructed with #6 rebar on a 0.6 m by 0.6 m grid • Rebar connections must overlap a minimum of 45 cm Secure ‘bed springs’ with tie wraps inside of fence designed height • Apply minimum of 10 cm of shotcrete• Allow shotcrete to cure for twenty four hours prior to placement of paste• If necessary, 10 cm paste pipe to be installed through fence to provide an outlet
for the paste line flush
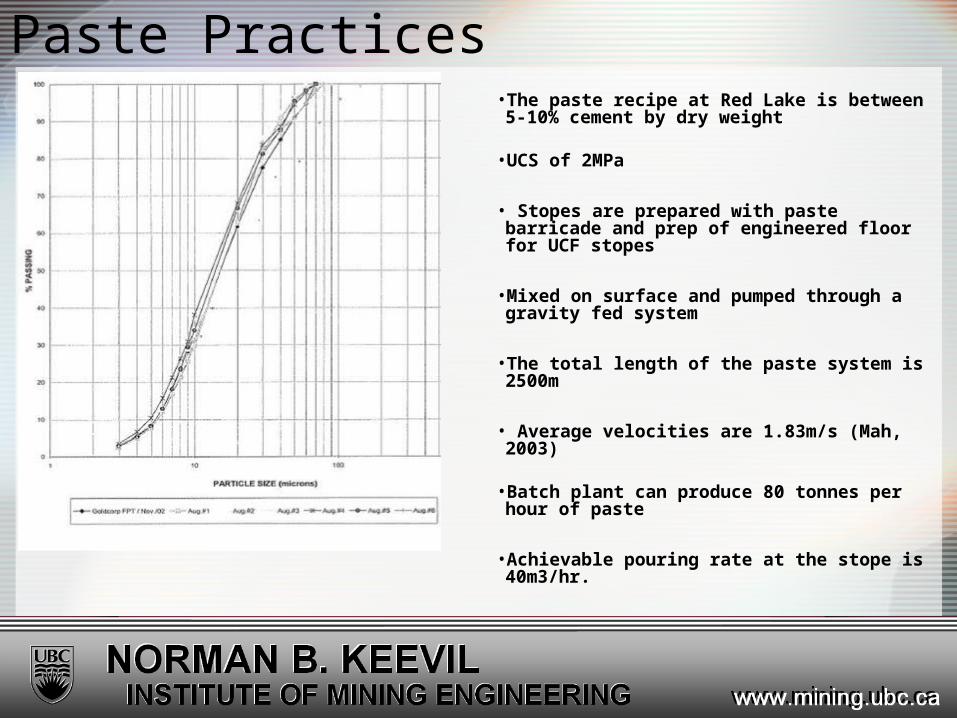
•The paste recipe at Red Lake is between 5-10% cement by dry weight
•UCS of 2MPa
• Stopes are prepared with paste barricade and prep of engineered floor for UCF stopes
•Mixed on surface and pumped through a gravity fed system
•The total length of the paste system is 2500m
• Average velocities are 1.83m/s (Mah, 2003)
•Batch plant can produce 80 tonnes per hour of paste
•Achievable pouring rate at the stope is 40m3/hr.
Paste Practices

Fill Fence Inventory
Fill Fence
Instruments
Measured Fill HeightEarth Pressure
CellsShotcrete
Strain Gauges
Rebar Strain
Gauges
32-826-8 5 0 0 No
37-746-2 1 1 0 No
34-806-4 2 2 0 No
31-806-3 1 1 0 Estimated
36-746-1 2 2 0 Estimated
34-806-1 1 1 0 Estimated
34-786-14a 2 3 3 Direct
34-786-14b 2 3 3 Direct
Destructive Test
2 3 3 N/A

Instruments Used in MonitoringRebar Strain Gauges
Concrete Strain Gauges
Earth Pressure Cell
Load Cell Tiltmeters

Typical Fence Layout3.5m
3.8
5m
Not to Scale1
.8 m
0.6
m
1.2
m
1.7 mEPC 2
SG3
Rebar SG2
SG2
EPC 1
Rebar SG1 SG1
Tilt meters

Destructive Fill Fence Test8m
2.6
m
Not to Scale
2 m
4 m
1.5
m 2.5
m
2.7
5 m
1
23
4
6
7
8
5 a,b,c
Vert. Rebar SG
Horiz. Top SG
Horiz. Top Rebar SG
EPC Top Left
Horiz. Bottom Rebar SG
EPC Bottom Right
1 m x 1m Loading Plate
1
2
3
4
(a) Vert Left SG (b) Load Cell (c) Vert Right SG5
6
7
8

Typical Pressure and Strain Plots
-75
-50
-25
0
25
50
75
100
125
9-Jul-04 9-Jul-04 10-Jul-04 10-Jul-04 11-Jul-04 11-Jul-04 12-Jul-04 12-Jul-04 13-Jul-04 13-Jul-04 14-Jul-04
Date
Str
ain
[u
E]
-1.5
-1
-0.5
0
0.5
1
1.5
2
2.5
Ap
pli
ed S
tres
s W
ith
in S
ho
tcre
te (
MP
a)
SG1 SG2 SG3
Strain Plot for 31-806-3• Strains correspond to paste height
• Maximum strain recorded 125 microstrain
-0.0025
0.0000
0.0025
0.0050
0.0075
0.0100
0.0125
0.0150
0.0175
0.0200
0.0225
0.0250
0.0275
0.0300
02-Aug-04 04-Aug-04 06-Aug-04 08-Aug-04 10-Aug-04 12-Aug-04
Date
Pre
ssu
re (
MP
a)
-0.5
0
0.5
1
1.5
2
2.5
3
3.5
4
Fil
l H
eig
ht
(m)
EPC 1 EPC 2 FILL HEIGHT
Pressure Plot for 36-746-1 • Spikes occur during paste line flush
• Maximum Pressure 0.025 MPa
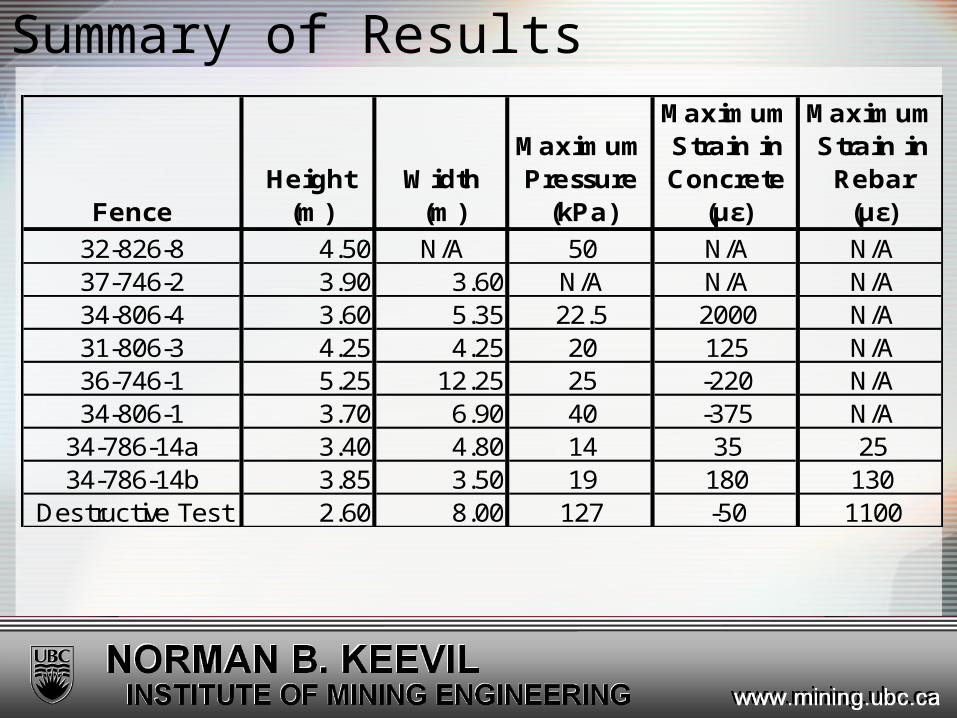
Summary of Results
FenceHeight
(m)Width
(m)
Maximum Pressure
(kPa)
Maximum Strain in Concrete
(με)
Maximum Strain in
Rebar (με)
32-826-8 4.50 N/A 50 N/A N/A37-746-2 3.90 3.60 N/A N/A N/A34-806-4 3.60 5.35 22.5 2000 N/A31-806-3 4.25 4.25 20 125 N/A36-746-1 5.25 12.25 25 -220 N/A34-806-1 3.70 6.90 40 -375 N/A
34-786-14a 3.40 4.80 14 35 2534-786-14b 3.85 3.50 19 180 130
Destructive Test 2.60 8.00 127 -50 1100

• The ratio of assumed vertical load vs. measured horizontal loads was investigated and the paste was considered a Rankine Soil during this loading .
• The Rankine Theory provides the following formula to estimate the active lateral earth Pressure:
σh= Ka σv
Where: σv=γ HKa = (1- sin Φ)/ (1+ sin Φ)γ= unit weigh of soil (18.63kN)H = height of soil (m)
• To determine the friction angle of the paste- needed an actual or inferred height paste and recorded earth pressure cells.
• Heights and pressures could be compared to determine if the expected Rankine linear relationship exists between these two measurements.
Paste Loading Mechanism

Paste Loading Mechanism
y = 9.3778x
R2 = 0.7999
0.00
5.00
10.00
15.00
20.00
25.00
30.00
35.00
40.00
0.00 0.50 1.00 1.50 2.00 2.50 3.00 3.50 4.00
Fill Height (m)
Lat
eral
Ear
th P
ress
ure
(kP
a)
36-746-1 (Elev 0.55m) 36-746-1 (Elev. 2.6m) 34-786-14a (Elev 0.6m) 34-806-1 (Elev 0.60m) 31-806-3 (Elev 0.8m)
General linear trend between lateral earth pressure and fill height
Slope of line relates to co-efficent of lateral earth pressures
High R-squared value, indicates relationship is not dependant on fill rate or cement content
Ka= 1

Fill Fence32-826-8
y = 0.5477x
R2 = 0.9167
0.0000
0.0100
0.0200
0.0300
0.0400
0.0500
0.0600
0.0700
0.0800
0 0.01 0.02 0.03 0.04 0.05 0.06 0.07 0.08 0.09 0.1
Vertical Load (MPa)
Ho
rizo
nta
l L
oad
(M
Pa)
General linear agreement between horziontal stress and horizontal stresses.
Slope of line represents co-efficent of lateral earth pressure
Fence had horizontal and vertical EPC installed together
Rankine Theory states that Ka = σh/ σv Ka = 1

Determine Coefficient of Lateral Earth Pressure• Using Rankine Theory :
– σh= Ka γ H
• Solve for Ka
Fill Fence
Instrument Height
(m) Ka ValueFriction Angle
0.55 0.46 21.92.6 0.69 10.4
34-806-1 0.6 0.63 13.034-786-14a 0.6 0.57 15.931-806-3 0.8 0.43 23.832-826-8 0.25 0.55 16.9Average 0.56 16.99
36-746-1
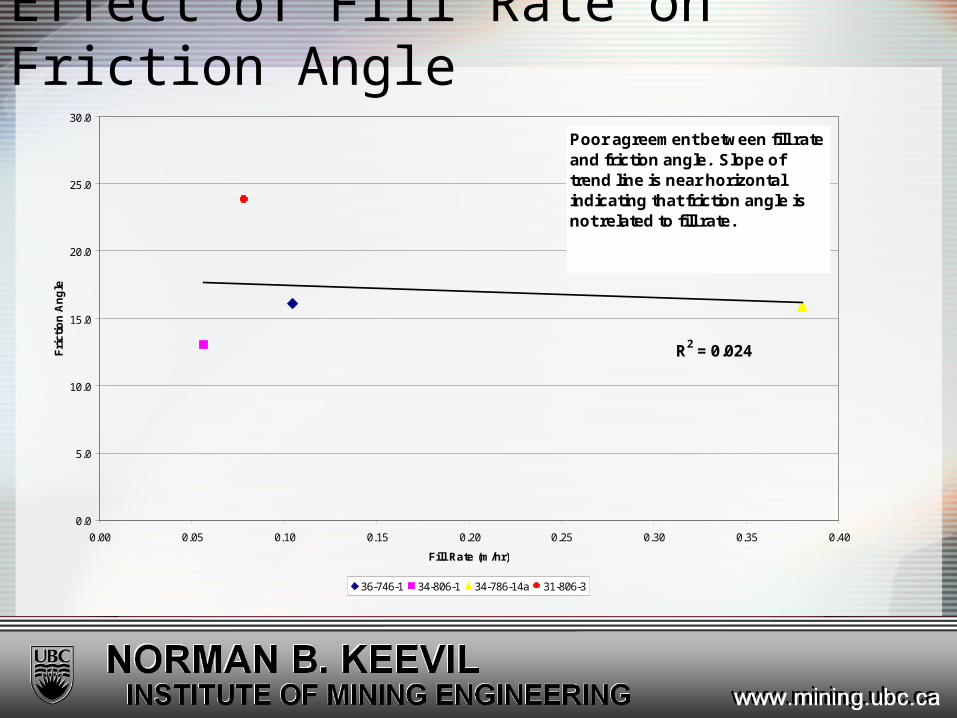
Effect of Fill Rate on Friction Angle
R2 = 0.024
0.0
5.0
10.0
15.0
20.0
25.0
30.0
0.00 0.05 0.10 0.15 0.20 0.25 0.30 0.35 0.40
Fill Rate (m/hr)
Fri
ctio
n A
ng
le
36-746-1 34-806-1 34-786-14a 31-806-3
Poor agreement between fill rate and friction angle. Slope of trend line is near horizontal indicating that friction angle is not related to fill rate.

Stress vs. Strain Relationship• The stress-strain behavior analysis of the fence determines if
the fence undergoes any plastic strain during imposed loads. • Fence can no longer take imposed loads and ultimately will fail.
• Following Fences with known fill height were used:– 31-806-3– 36-746-1– 34-806-1– 34-786-14a– Destructive Test
• Assumptions:– the strain in the strain gauge is directly related to the imposed load
of the fence – was poured at a constant rate and the fill rate is based on the total
height of the paste divided by the time taken to fill the stope.

Typical Stress vs. Strain Plot
0.000
5.000
10.000
15.000
20.000
25.000
-150.000 -100.000 -50.000 0.000 50.000 100.000 150.000
Strain (uE)
Str
ess
(kP
a)
SG1 SG2 SG3

Destructive Fill Fence Stress vs. Strain Plot
0.00
10.00
20.00
30.00
40.00
50.00
60.00
70.00
80.00
90.00
100.00
110.00
120.00
-25 25 75 125 175 225 275 325 375 425 475 525 575 625 675 725 775 825 875 925 975 1025 1075 1125 1175
Strain (Microstrain)
Lo
ad (
kPa)
Vertical Horizontal Top Horizontal Bottom Vertical Left
Vertical Right Horizontal Top Horizontal Bottom 'Converted Data'!$P$6
Yielding occurs in rebar at approximately 100 kPa
Shotcrete trends do not show yielding
Performance below 100kPa is linear indicating an elastic behavior
Failure deemed to occur at 100 kPa for fill fences
Note: High level of recorded strains not recorded on any other fence
100 kPa

All Stress vs. Strain Plots
0.00
10.00
20.00
30.00
40.00
50.00
60.00
70.00
80.00
90.00
100.00
110.00
120.00
-300
-200
-100
0 100
200
300
400
500
600
700
800
900
1000
1100
1200
Strain (Microstrain)
Lo
ad (
kPa)
Destructive Test Rebar SGs Destructive Test Shotcrete SGs 31-806-3 SGs 34-786-14a Shotcrete SGs
34-786-14a Rebar SGs 34-806-1 SGs 36-746-1 SGs
Below 40 kPa: recorded stress and strain within instrumented paste pour fences
100 kPa: yielding of fence

ConclusionsAt the outset of this thesis, three questionsneeded to be addressed:
• What are the loading mechanisms of paste against barricades?
• What is the capacity of the paste fill fences at Red Lake?
• Based on the loading mechanism of the paste, do the fill fences pose a risk of failure?
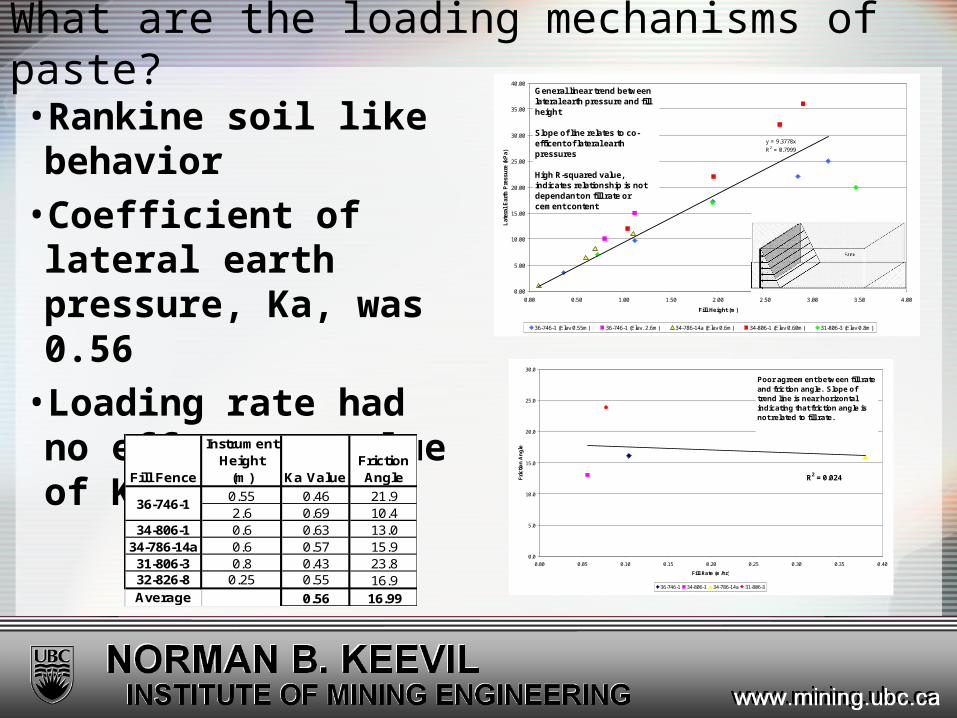
What are the loading mechanisms of paste?•Rankine soil like behavior
•Coefficient of lateral earth pressure, Ka, was 0.56
•Loading rate had no effect on value of Ka
y = 9.3778x
R2 = 0.7999
0.00
5.00
10.00
15.00
20.00
25.00
30.00
35.00
40.00
0.00 0.50 1.00 1.50 2.00 2.50 3.00 3.50 4.00
Fill Height (m)
Lat
eral
Ear
th P
ress
ure
(kP
a)
36-746-1 (Elev 0.55m) 36-746-1 (Elev. 2.6m) 34-786-14a (Elev 0.6m) 34-806-1 (Elev 0.60m) 31-806-3 (Elev 0.8m)
General linear trend between lateral earth pressure and fill height
Slope of line relates to co-efficent of lateral earth pressures
High R-squared value, indicates relationship is not dependant on fill rate or cement content
R2 = 0.024
0.0
5.0
10.0
15.0
20.0
25.0
30.0
0.00 0.05 0.10 0.15 0.20 0.25 0.30 0.35 0.40
Fill Rate (m/hr)
Fri
ctio
n A
ng
le
36-746-1 34-806-1 34-786-14a 31-806-3
Poor agreement between fill rate and friction angle. Slope of trend line is near horizontal indicating that friction angle is not related to fill rate.
Fill Fence
Instrument Height
(m) Ka ValueFriction Angle
0.55 0.46 21.92.6 0.69 10.4
34-806-1 0.6 0.63 13.034-786-14a 0.6 0.57 15.931-806-3 0.8 0.43 23.832-826-8 0.25 0.55 16.9Average 0.56 16.99
36-746-1

What is the capacity of the paste fill fences?
0.00
10.00
20.00
30.00
40.00
50.00
60.00
70.00
80.00
90.00
100.00
110.00
120.00
-25 25 75 125 175 225 275 325 375 425 475 525 575 625 675 725 775 825 875 925 975 1025 1075 1125 1175
Strain (Microstrain)
Lo
ad (
kPa)
Vertical Horizontal Top Horizontal Bottom Vertical Left
Vertical Right Horizontal Top Horizontal Bottom 'Converted Data'!$P$6
Yielding occurs in rebar at approximately 100 kPa
Shotcrete trends do not show yielding
Performance below 100kPa is linear indicating an elastic behavior
Failure deemed to occur at 100 kPa for fill fences
Note: High level of recorded strains not recorded on any other fence
100 kPa

Based on the loading mechanism of the paste, do the fill fences pose a risk of failure?
0.00
10.00
20.00
30.00
40.00
50.00
60.00
70.00
80.00
90.00
100.00
110.00
120.00
-300
-200
-100
0 100
200
300
400
500
600
700
800
900
1000
1100
1200
Strain (Microstrain)
Lo
ad (
kPa)
Destructive Test Rebar SGs Destructive Test Shotcrete SGs 31-806-3 SGs 34-786-14a Shotcrete SGs
34-786-14a Rebar SGs 34-806-1 SGs 36-746-1 SGs
Below 40 kPa: recorded stress and strain within instrumented paste pour fences
100 kPa: yielding of fence
FenceHeight
(m)Width
(m)
Maximum Pressure
(kPa)
Maximum Strain in Concrete
(με)
Maximum Strain in
Rebar (με)
32-826-8 4.50 N/A 50 N/A N/A37-746-2 3.90 3.60 N/A N/A N/A34-806-4 3.60 5.35 22.5 2000 N/A31-806-3 4.25 4.25 20 125 N/A36-746-1 5.25 12.25 25 -220 N/A34-806-1 3.70 6.90 40 -375 N/A
34-786-14a 3.40 4.80 14 35 2534-786-14b 3.85 3.50 19 180 130
Destructive Test 2.60 8.00 127 -50 1100

ConclusionsFrom this research, the following recommendations were made to Red Lake Mine:
– Fill pressures during backfill do not differ based on fill rate;– Fill fence construction is suitable to the applied loads
measured during the testing;– No alterations to fence construction are necessary;– Maximum pressures were recorded during paste line
flushes;– In order to reduce loads on fence, line flushes should be
done outside of the backfilled stopes;– Continuous pouring is advised for underhand cut and fill
stopes as it will eliminate hazards associated with ground fall due to cold joints.
Recommendations are currently being applied at Red Lake Mine.

Recommendation for Future Work• Testing of other types of barricades • Testing should be carried out to determine the
benefits of tying in the back and the floor to the fill fence with embedded rebar.
• In addition to fence construction, monitoring of paste pours should be carried out to determine the relation of the percentage of cement within the paste and the loading rate of placement to the coefficient of lateral earth pressure.
• A more complex numerical model is necessary to develop an understanding of the interaction between the rebar and shotcrete under the paste loads.

Acknowledgements• Goldcorp Ltd.’s Red Lake Mine • NSERC IPS Program• The trusts of the William Alexander Mackenzie
Scholarship and the Dr F J Nicholson Scholarship.• Rocscience for providing software that was
essential in my research.S • Josh Clelland, Ali Rana and Kathryn Dehn. • Workforce at Red Lake mine for their assistance
throughout. I would like specifically to thank Grant Corey, Boi Linh Van, Danielle Pelletier and Ray Wilkins
• Dr. Rimas Pakalnis• Yieldpoint for assistance and instrumentation