presented by: saurindra nath basu -...
TRANSCRIPT

Presented by:
Saurindra Nath Basu

Sanitary ware: Different Patterns
Manufacturing of Sanitary ware Products : Madurai Pan 450 and 500 ,580 Box Rim Pan, Foot rest , Traps S and P-trap, EWC P and S, Wall Hung Different type of Basins , Pedestals, Cisterns , Auto cisterns, Urinals : small and Big Sinks and accessories.

Quality control :Sanitary ware QUALITY CONTROL TOOLS
Vital Few and Trivial Many : Pareto Analysis
Path of Continuous Improvement : Cause & Effect Diagram
Discover Trouble : Stratification
Organizing Data Collection : Check sheet
Conformance Quality in its totality : Histogram
Visual Control : Graphs & Control Charts/Run Chart
Variables related to : Scatter Diagram Regression Analysis

Quality Control of Sanitary ware Products For the Customer Satisfaction, the important role is
the assured Quality of Products made and controlled in manufacturing , investigation of the level of quality being achieved called Quality assessment.
After assessments, action taken to eliminate unacceptable quality and by periodic inspection ,changes or adjustments whenever necessary called Quality Control.

Norms to control the Quality of Sanitary ware Standard Norms of Sanitary ware Products (Surface area wise ): A => Operating surface ( Bowl, Rim , Sump) B => Visible Non Operative Surface (Body, Sides ) C => Un Exposed Glazed surface after installation (Back , Underneath ) Shade variation: Not allowed where the differences is visible and noticeable
compared to standard. Spangling : Minor spangling where not glaringly visible is allowed. Blister ; Allowed in unglazed portion, not allowed in the glazed portion. Egg shell/Matt finish: Not allowed. Plucking : Not allowed. Dunting : Not
allowed. Cracks : Not allowed. Droppers :Not allowed. Bloating Chipping : Not allowed.
MAXIMUM 3 PERMISIBLE DEFECTS ALLOWED IN A POTTERY SQUARE => 50mm X 50mm.
Other Defects : Pin holes,Dirt,Pits.crawling,stain,glaze streak, thin glaze, specks(scatter),warpage,badfinish, waviness,repair spot, edging.
Control of Quality of Products Customer oriented Quality control.
Acceptance level : Facts and Data for Talking and Discussing.
Humanitism and Functionally managed Management.
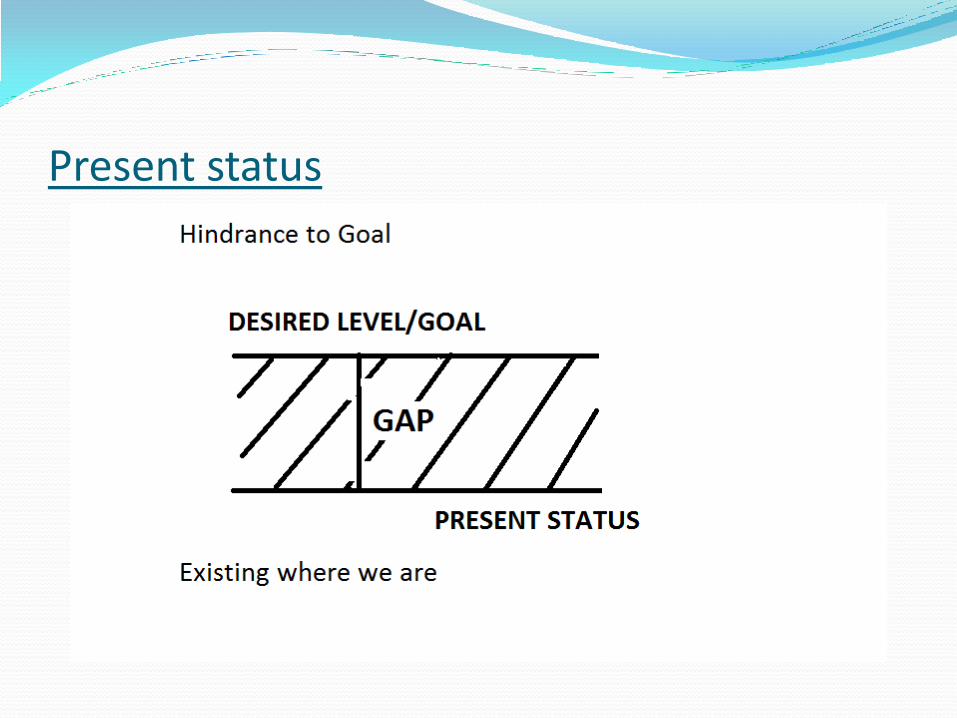
Present status
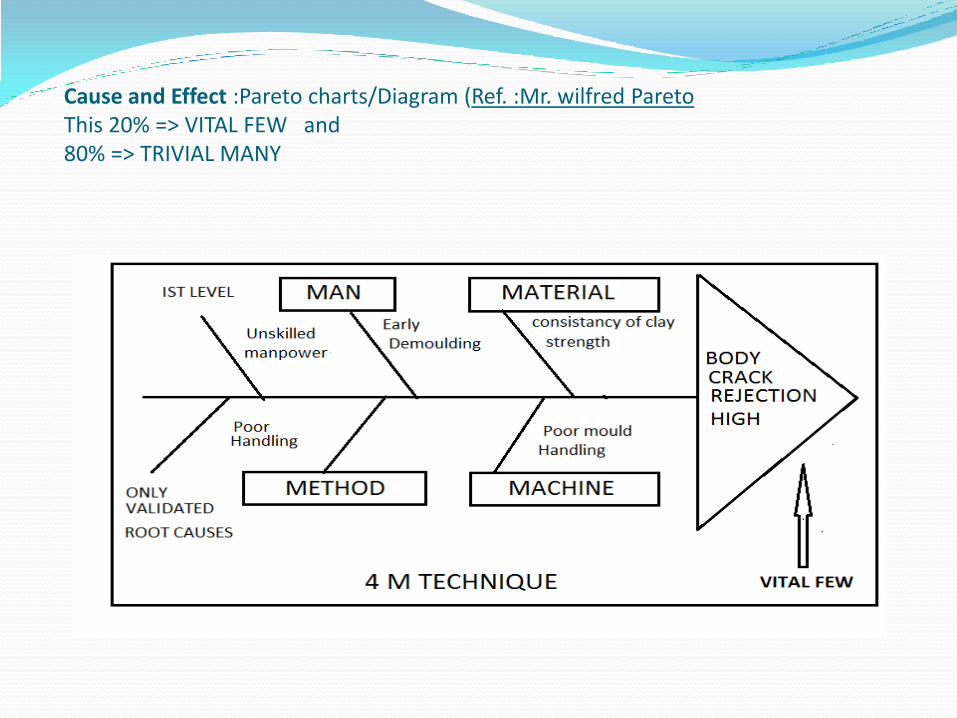
Cause and Effect :Pareto charts/Diagram (Ref. :Mr. wilfred Pareto This 20% => VITAL FEW and 80% => TRIVIAL MANY
Quality control Graphs are widely used in:
Explanation – Defect Ratio, Productivity, increase in ratio of Sales turnover.
Understanding – Past and Present analysis
Control - Production level, defect ratio, weight, temperature, measurements
Calculations – Control limits etc.

Control chart

Contd.

Quality assurance Control of the Design of Products, Processes and jobs
also to impart Training by the Personnel.
Preventive activity required to be systematically planned in advance. The activity includes identification and planning of the checks, inspection and control.It provides confidence internally the Management and externally to the Customer.
Total Quality Management Definition: An integrated effort designed to improve
quality performance at every level of the organization.
Key aspects of TQM:
COST
RELIABILITY
EFFICIENCY
BUSINESS
QUALITY
INNOVATION AND
EFFECTIVENESS

TQM THE CULTURE OF TQM:
OPENNESS
VALUE SYSTEM
TRUST
STRATEGY
FAIRNESS COMMUNICATION

TQM TOTAL EMPLOYEE INVOLVEMENT:
PARTICIPATION
REWARD
RAINING RESPECT
IMPROVEMENT
RECOGNITION
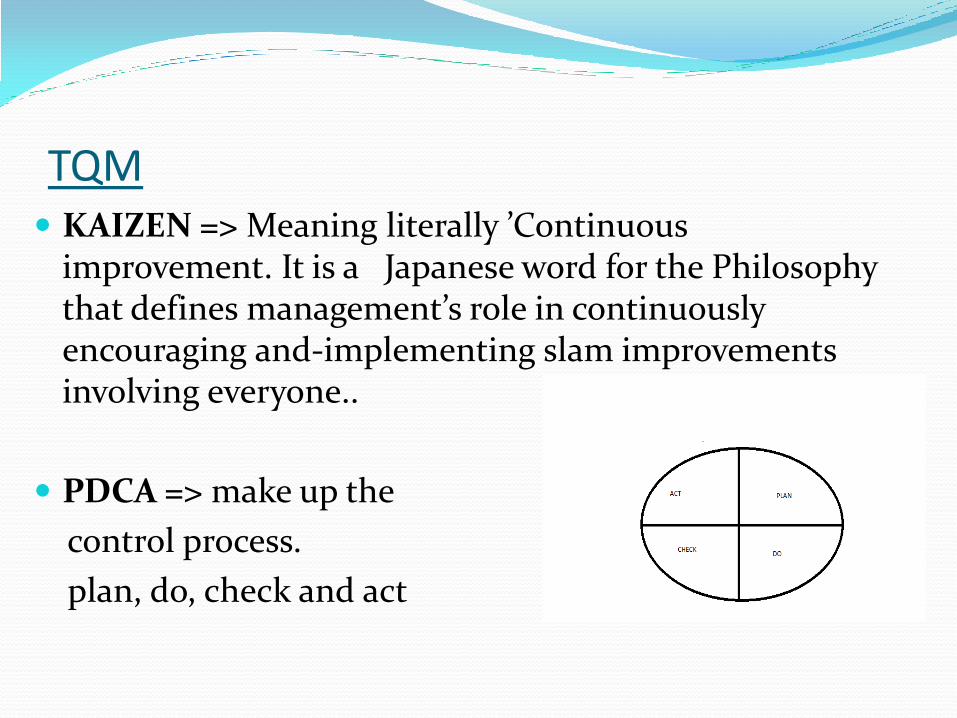
TQM KAIZEN => Meaning literally ’Continuous
improvement. It is a Japanese word for the Philosophy that defines management’s role in continuously encouraging and-implementing slam improvements involving everyone..
PDCA => make up the
control process.
plan, do, check and act
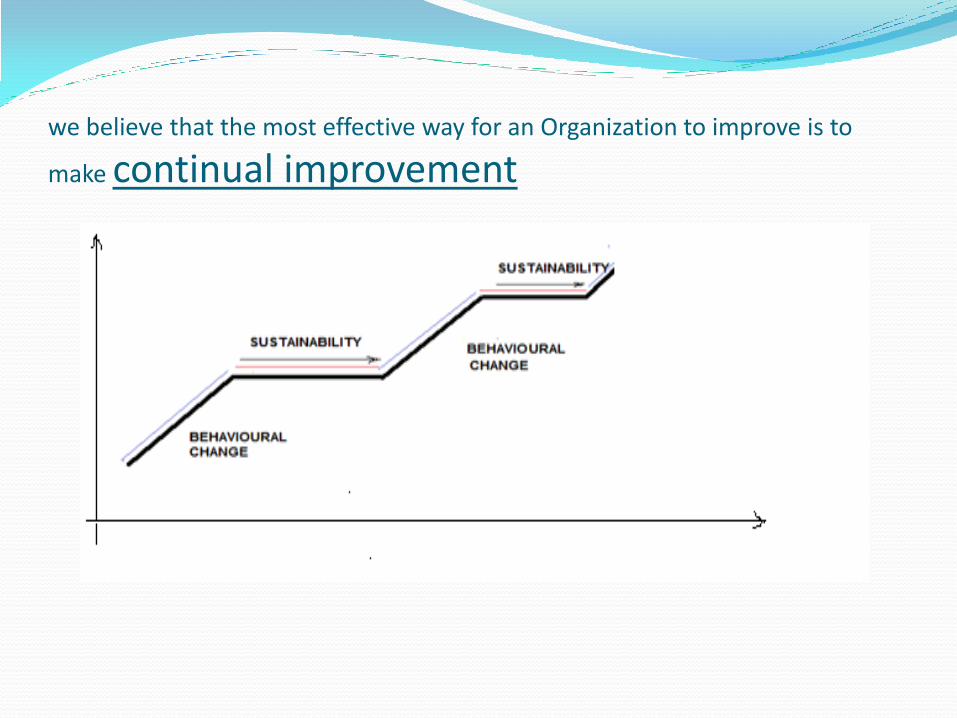
we believe that the most effective way for an Organization to improve is to
make continual improvement

TQM J I T => JUST IN TIME TIGHTENING THE PROCESS (FOR MAKING A PRODUCT) STREO LINING THE FLOW ALONG THE ‘PROCESS’ LINE(NOT IDLE
BUT ALSO NOT OVERWHELMED) OVERLAPPING THE OPERATIONS MINIMISING SET UP TIMES ACTIVELY INVOLVING THE EMPLOYEES. THE END RESULT: PIECE – FOR PIECE PROCESSING: NO STORAGE NO BUFFER STOCKS NO DAMAGES NO WASTE NO WORRIES

THANK YOU