presenters presentation - pdf
TRANSCRIPT

Measuring Engagement in an Inverted/Flipped
Class Format
Jeffery S. Thomas, PhD, PE
Assistant Teaching Professor
Civil, Architectural & Environmental Engineering

Outline 1. Resource usage
2. Satisfaction & pass rates
3. Exam performance
4. Misc. measurements
Learning analytics is the measurement, collection, analysis
and reporting of data about learners,
and their contexts, for purposes of
understanding and optimizing learning
and the environments in which it occurs.
- George Siemens

Resource Usage

Class Students/ Semester
Web Pages
Images Videos
Mechanics of Materials 300 1750 5000 230
accessed 36,000 times for 9070 hours during 2011 accessed 19,900 times for 5830 hours during 2010
Materials Testing 200 1300 5500 42
accessed 21,800 times for 1210 hours during 2011 accessed 6380 times for 600 hours during 2010
Structural Analysis 60 500 590 10
accessed 6500 times for 1770 hours in 2011

Mechanics of Materials Summer 2012 49 students 63 hours of measured engagement per student Does not include:
• LMS • textbook • MecMovies • homework done outside of class • etc
Activity Hours per Student
Problem solutions Problem solution videos Problem strategies Concept videos Lecture notes Demonstration videos
13.1 4.1 3.4 1.0 0.6 0.1
22.3
Working HW in class 24.5 24.5
Taking exams 9.4 9.4
Site navigation 3.3 3.3
Semester schedule Old exams Grades Policies FAQ
2.1 0.6 0.5 0.1 0.1
3.4
Total 62.9 62.9
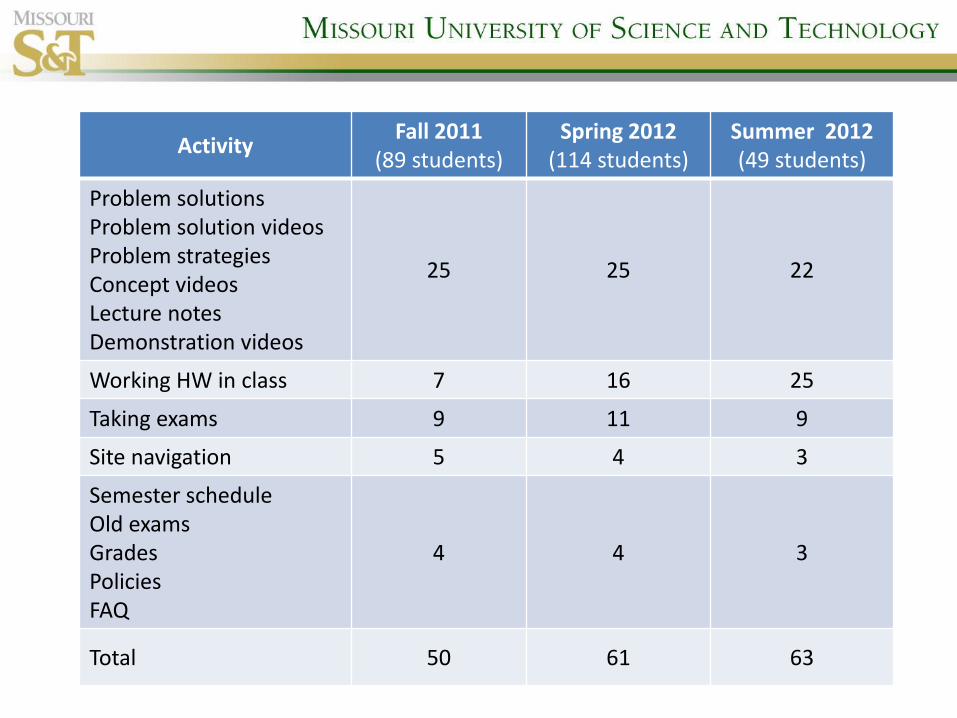
Activity Fall 2011
(89 students) Spring 2012
(114 students) Summer 2012 (49 students)
Problem solutions Problem solution videos Problem strategies Concept videos Lecture notes Demonstration videos
25 25 22
Working HW in class 7 16 25
Taking exams 9 11 9
Site navigation 5 4 3
Semester schedule Old exams Grades Policies FAQ
4 4 3
Total 50 61 63

Mechanics of Materials

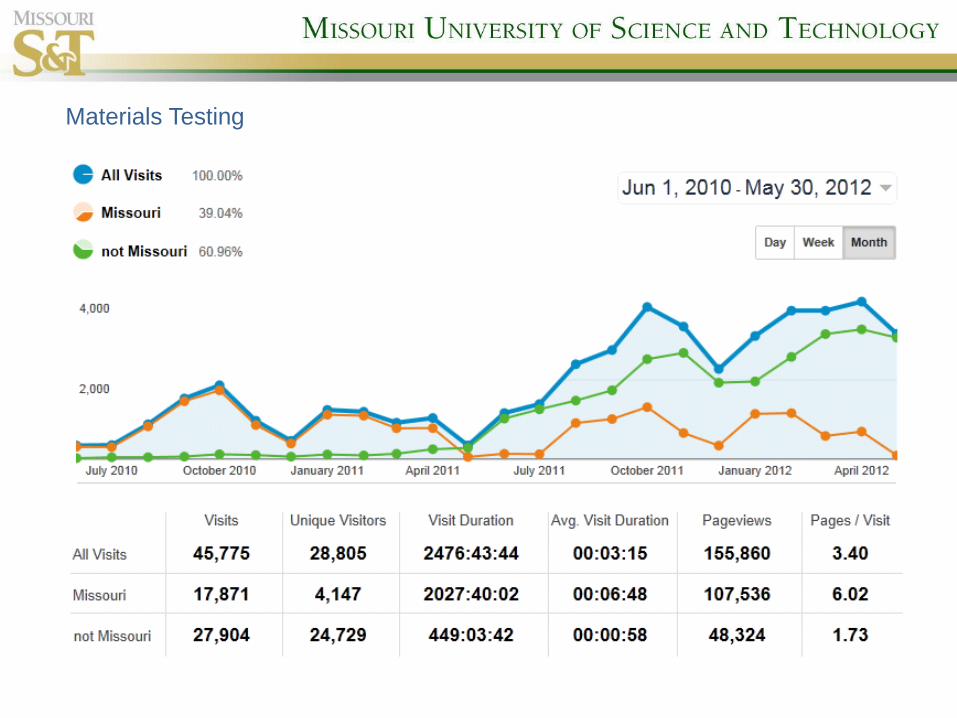
Materials Testing
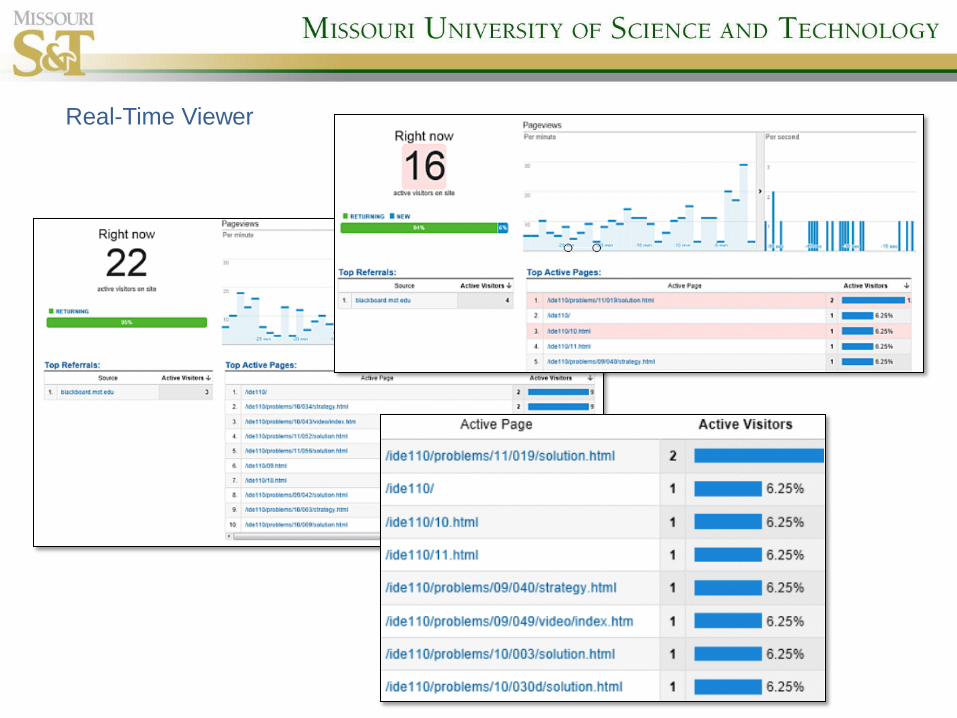
Real-Time Viewer
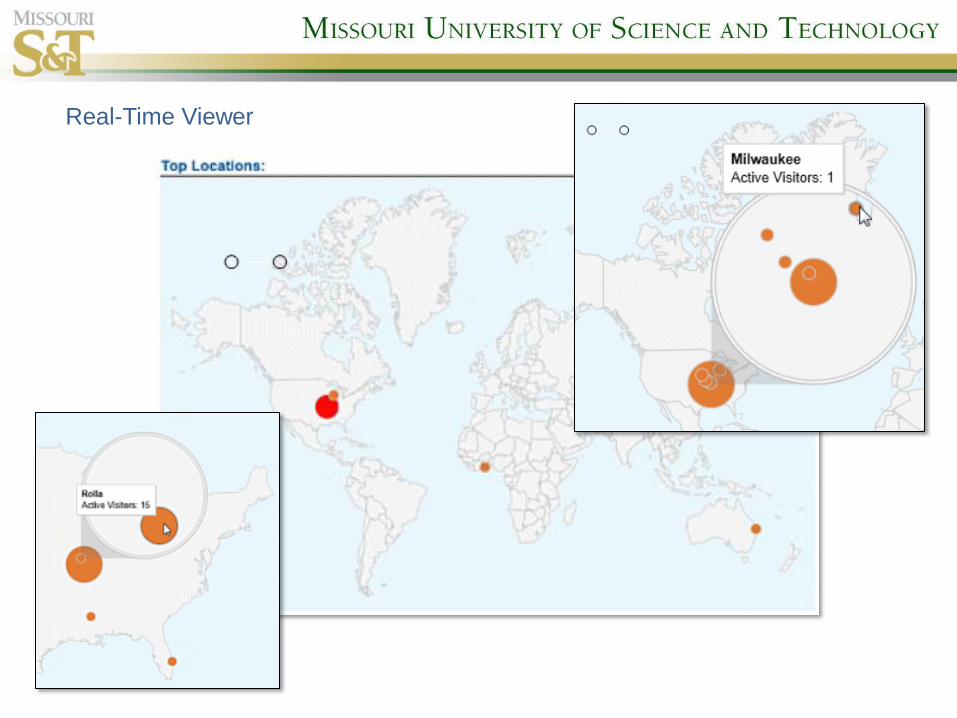
Real-Time Viewer

Materials Testing

Materials Testing
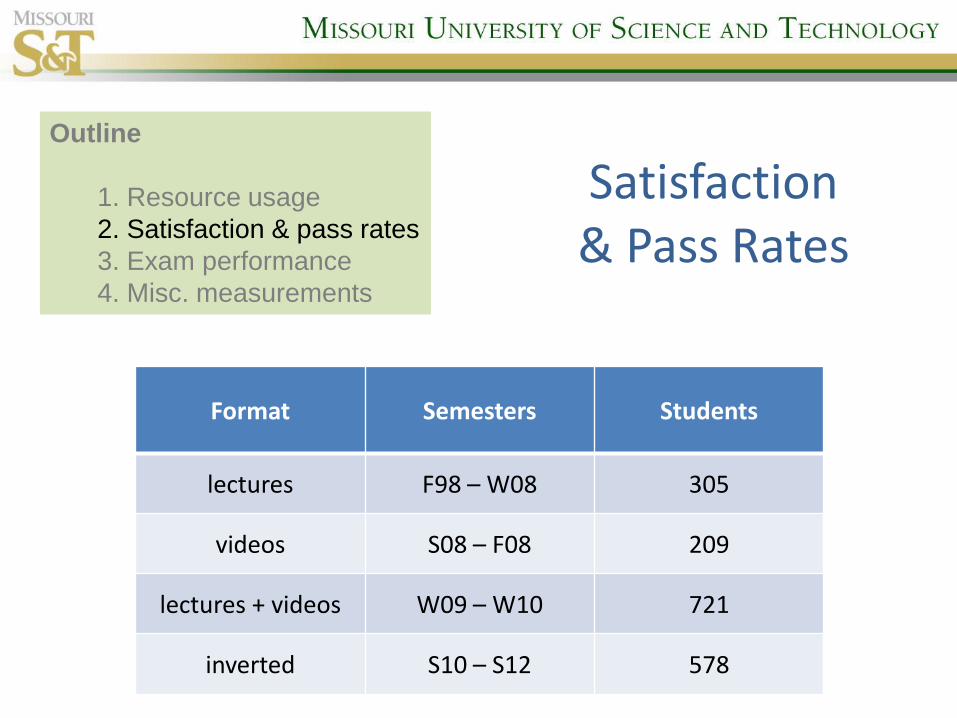
Satisfaction & Pass Rates
Format Semesters Students
lectures F98 – W08 305
videos S08 – F08 209
lectures + videos W09 – W10 721
inverted S10 – S12 578
Outline
1. Resource usage
2. Satisfaction & pass rates
3. Exam performance
4. Misc. measurements
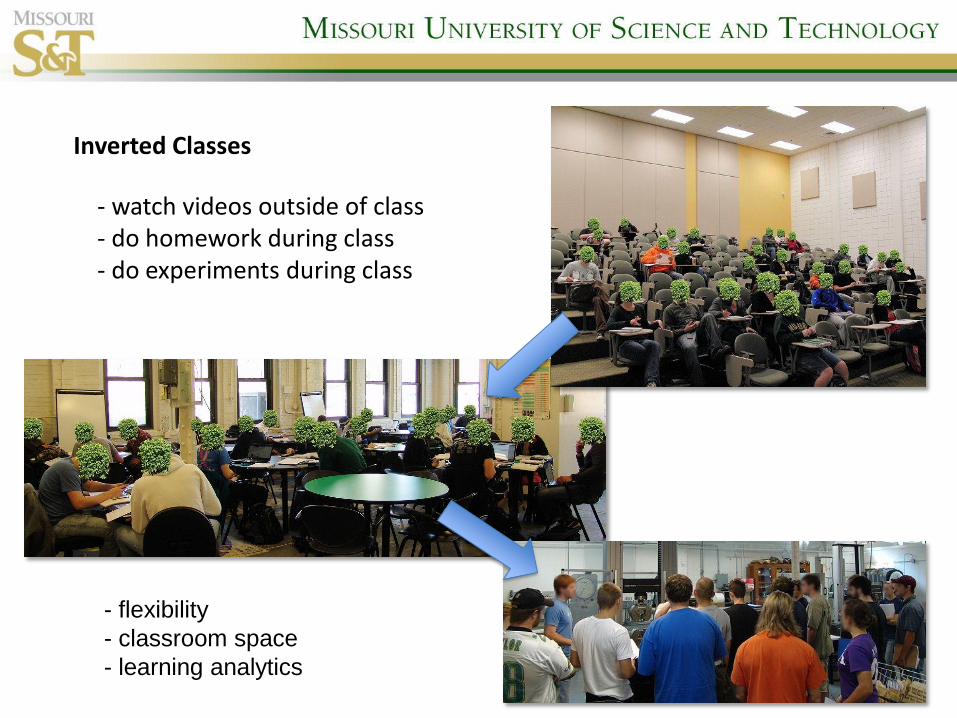
Inverted Classes
- watch videos outside of class - do homework during class - do experiments during class
- flexibility
- classroom space
- learning analytics
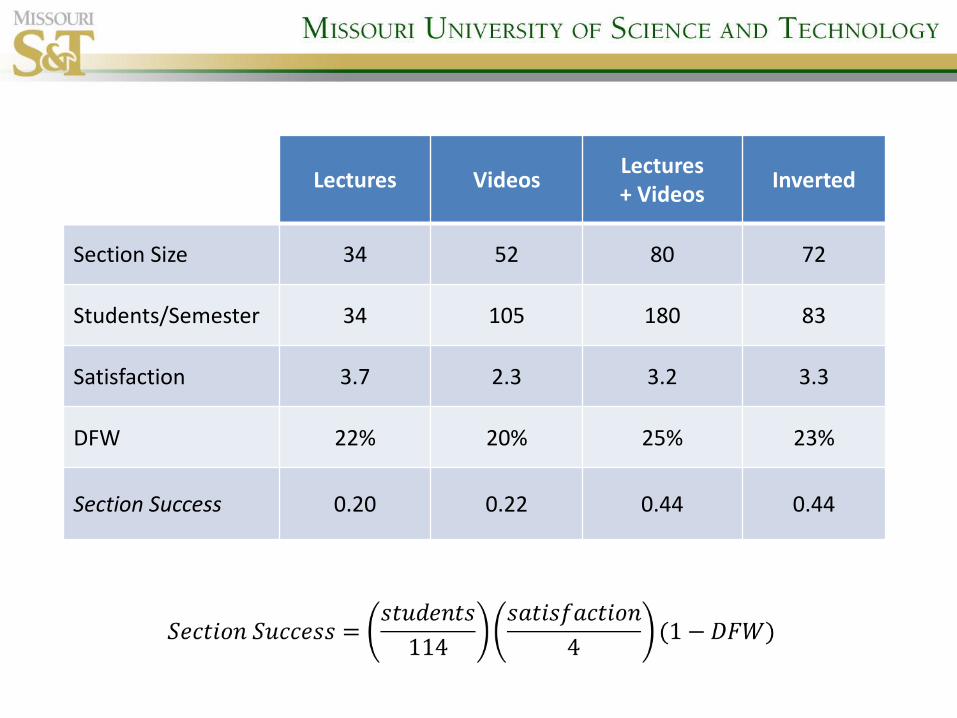
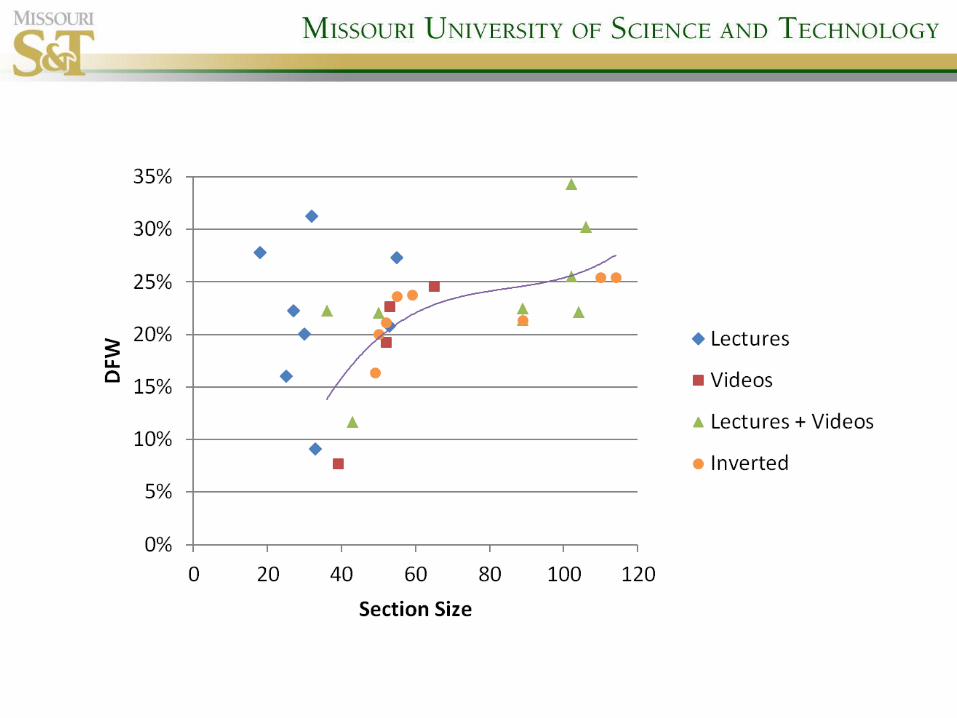
Lectures Videos Lectures + Videos
Inverted
Section Size 34 52 80 72
Students/Semester 34 105 180 83
Satisfaction 3.7 2.3 3.2 3.3
DFW 22% 20% 25% 23%
Section Success 0.20 0.22 0.44 0.44
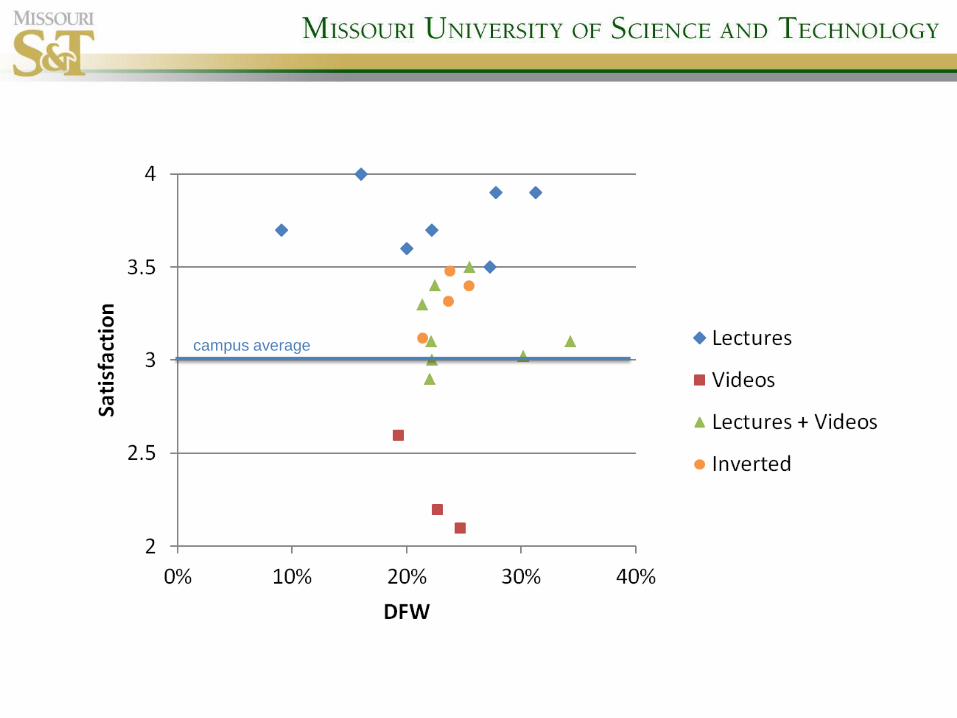
campus average
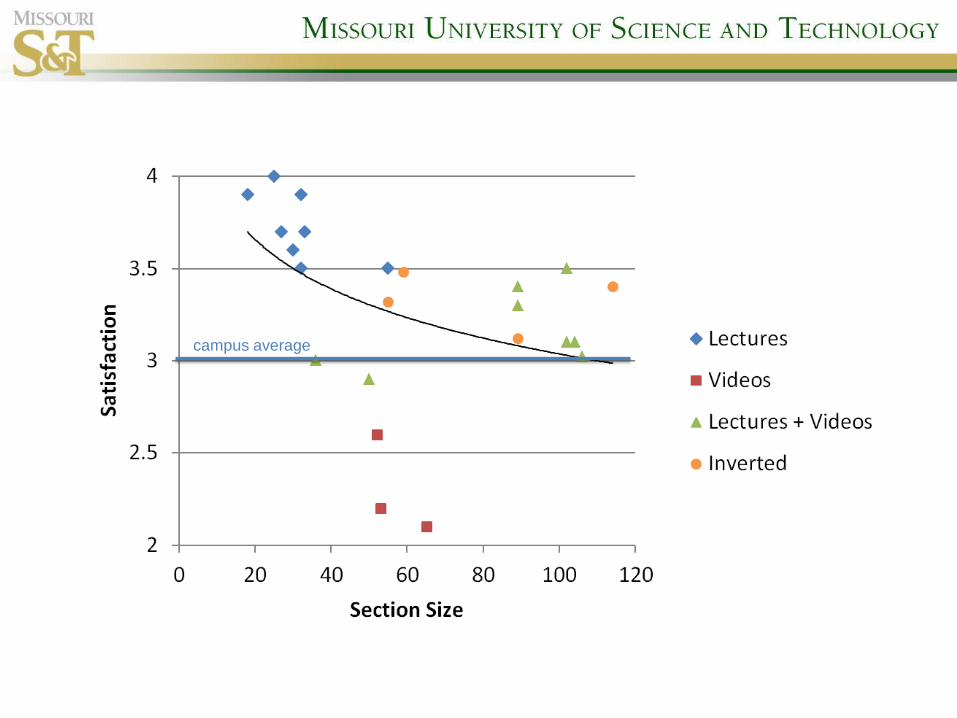
campus average


Exam Performance
Outline
1. Resource usage
2. Satisfaction & pass rates
3. Exam performance
4. Misc. measurements

Effect of Format
Students
Lectures
(n = 50)
Videos
(n = 195)
Lectures + Videos (n = 668)
Inverted
(n = 150)
Mean Final Exam Score
high GPA 76.7 81.6
all 71.7 73.9 75.9 73.1
low GPA 66.1 63.9
• same instructor, author and problem solutions
• no significant difference between mean final exam scores
• high GPA students do 5 pts better in inverted format
• low GPA students do 2 pts worse in inverted format
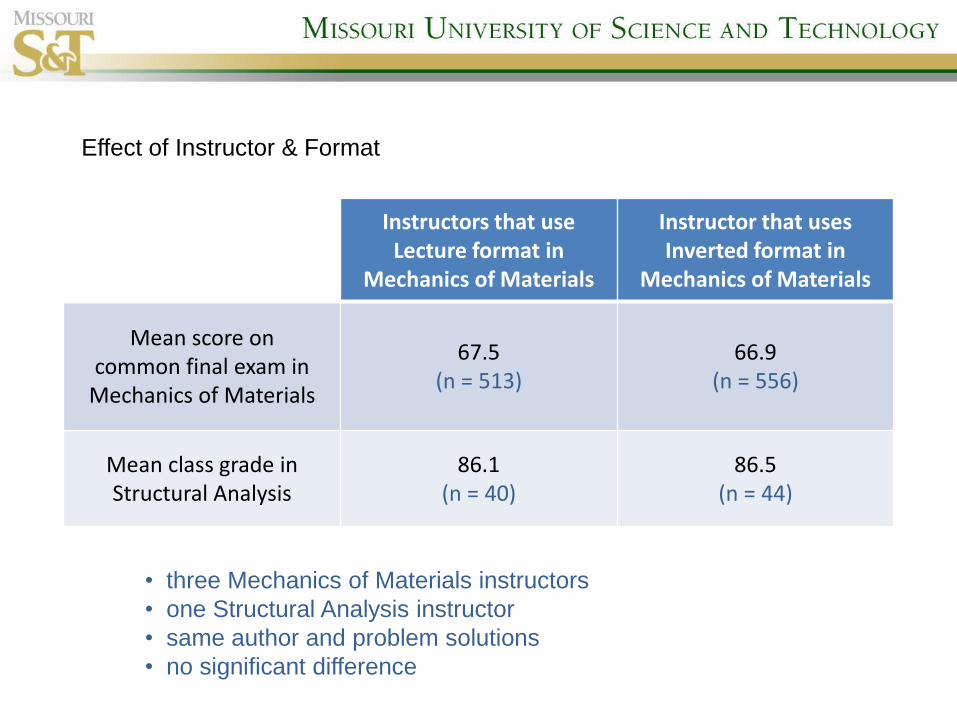
Instructors that use Lecture format in
Mechanics of Materials
Instructor that uses Inverted format in
Mechanics of Materials
Mean score on common final exam in
Mechanics of Materials
67.5 (n = 513)
66.9 (n = 556)
Mean class grade in Structural Analysis
86.1 (n = 40)
86.5 (n = 44)
Effect of Instructor & Format
• three Mechanics of Materials instructors
• one Structural Analysis instructor
• same author and problem solutions
• no significant difference
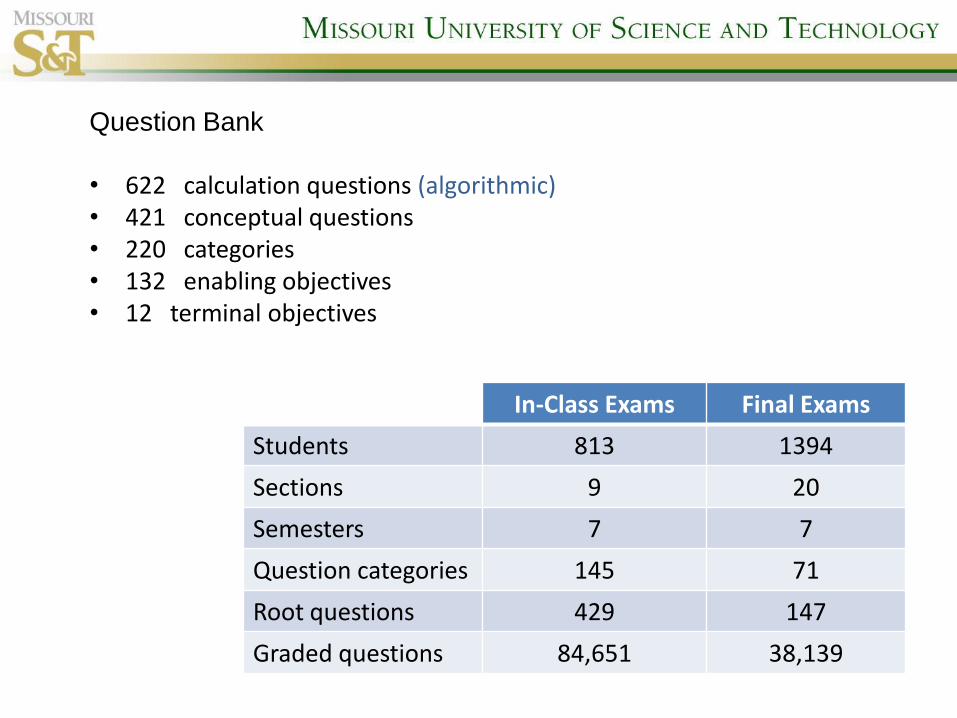
Question Bank • 622 calculation questions (algorithmic) • 421 conceptual questions • 220 categories • 132 enabling objectives • 12 terminal objectives
In-Class Exams Final Exams
Students 813 1394
Sections 9 20
Semesters 7 7
Question categories 145 71
Root questions 429 147
Graded questions 84,651 38,139
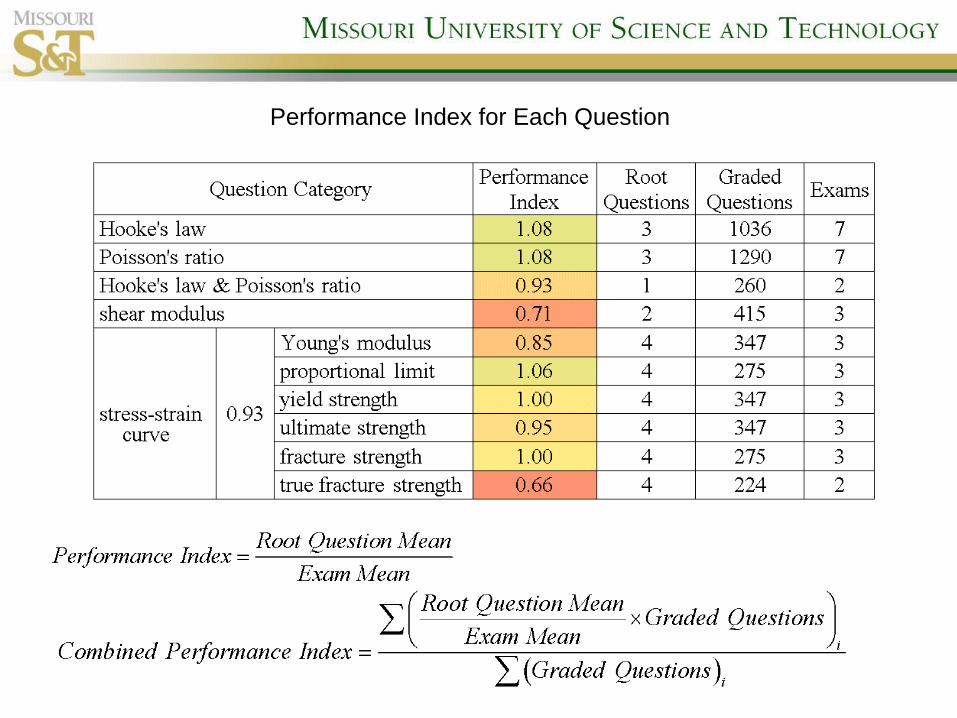
Performance Index for Each Question
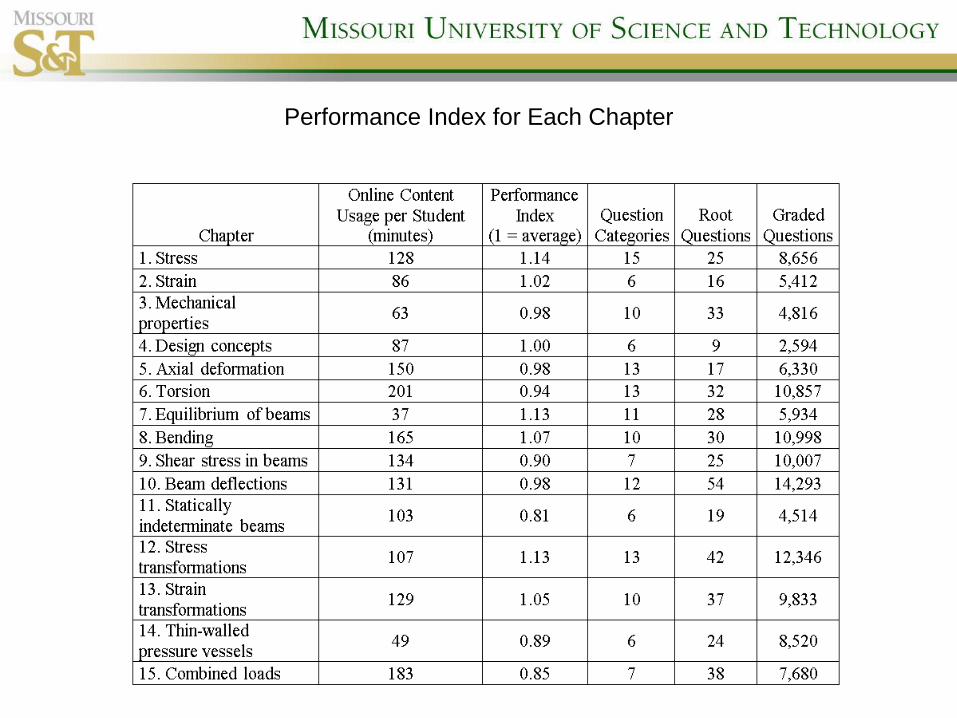
Performance Index for Each Chapter
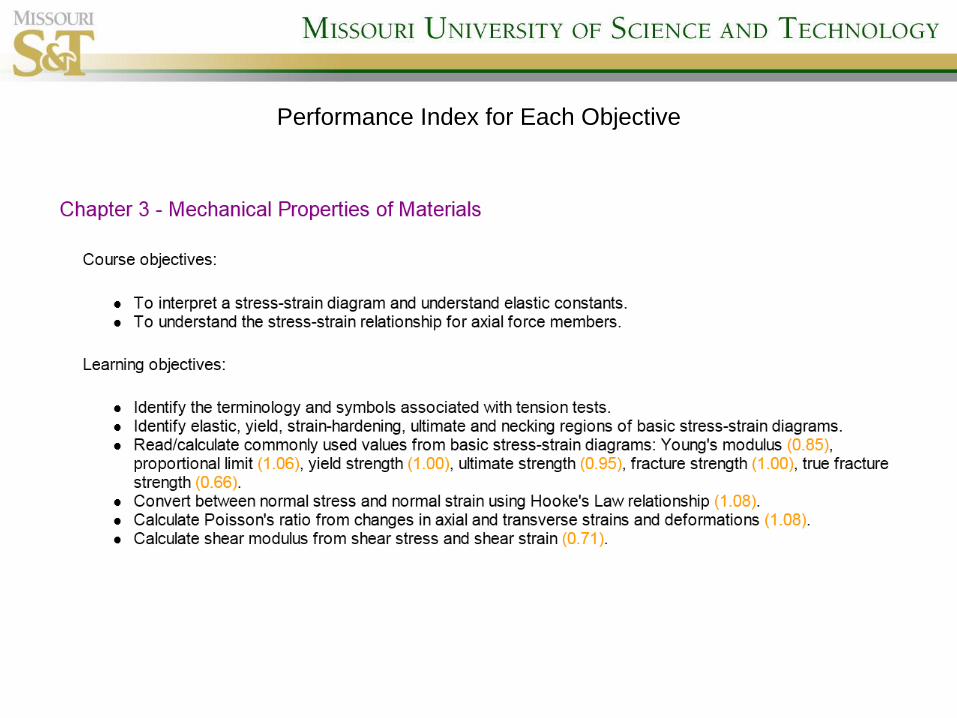
Performance Index for Each Objective

Ranked Categories
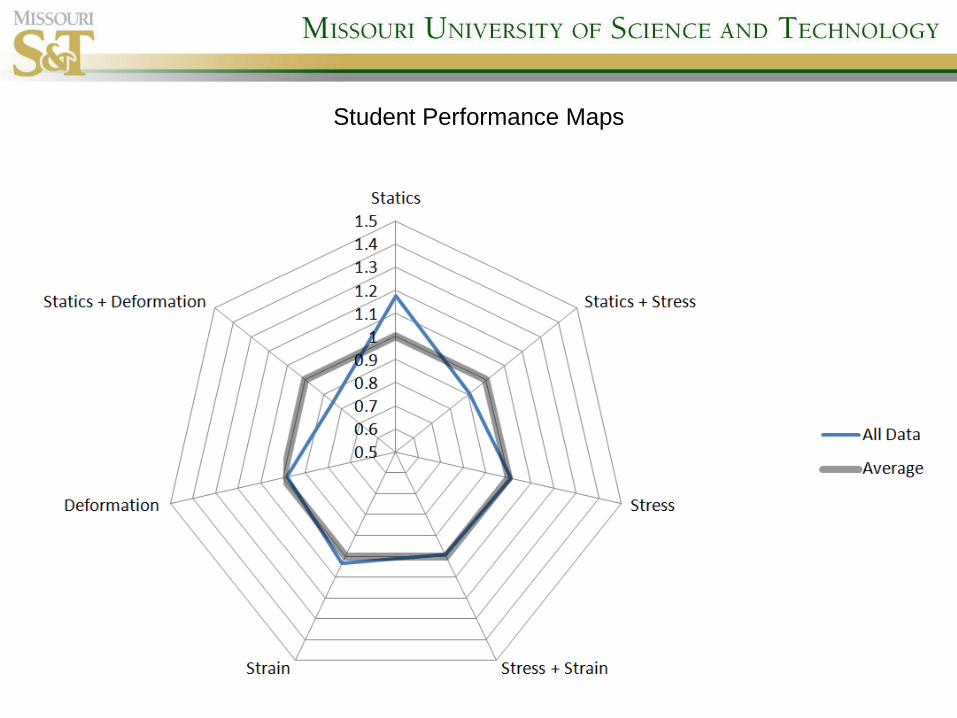
Student Performance Maps
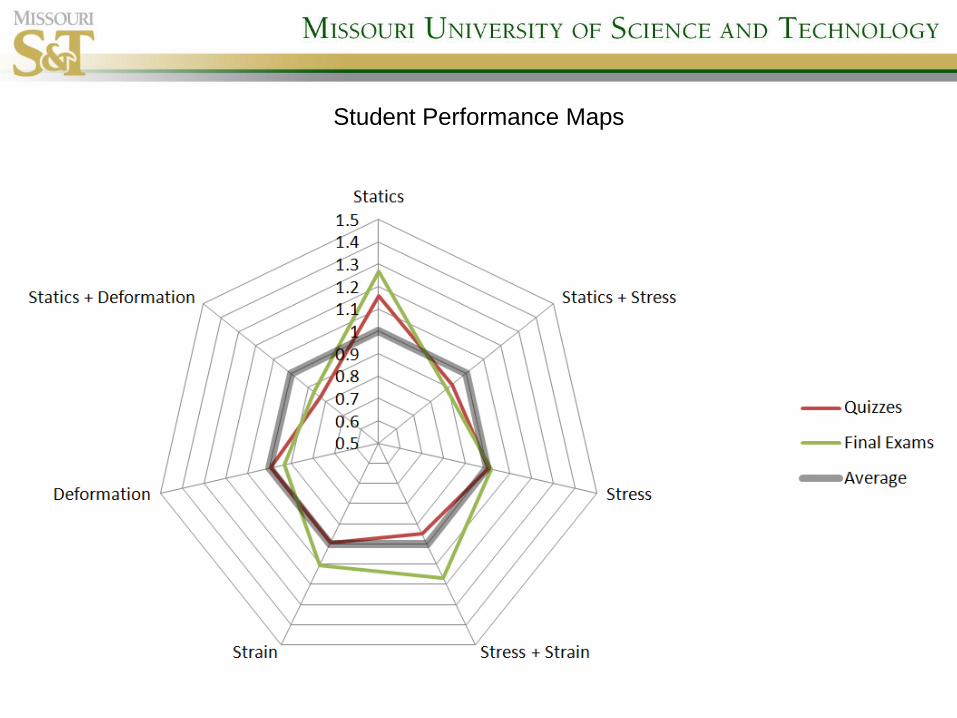
Student Performance Maps

Student Performance Maps
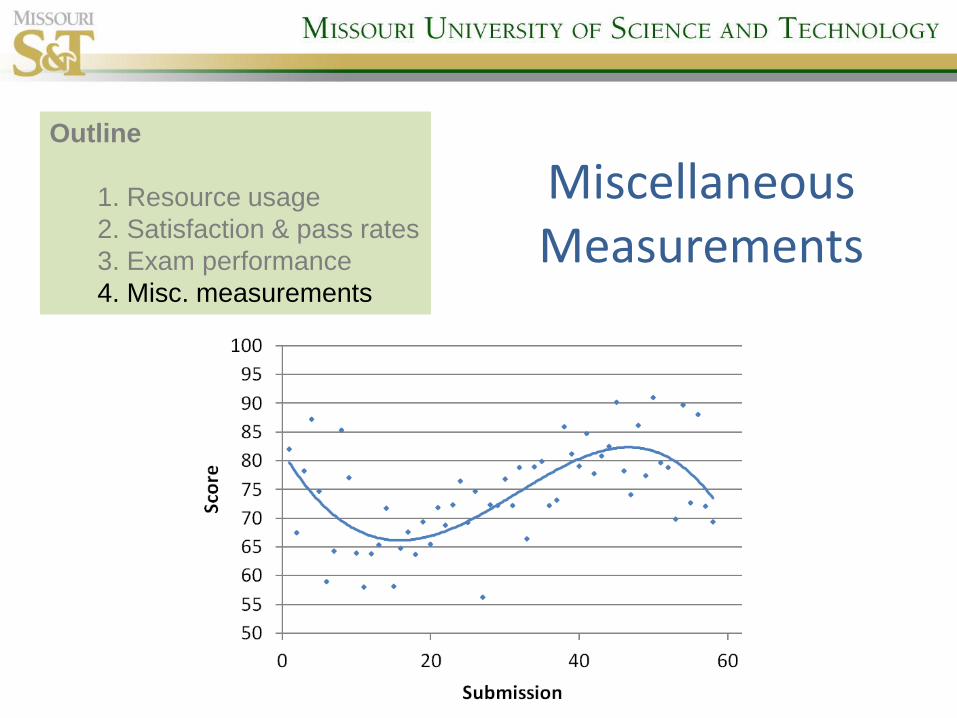
Miscellaneous Measurements
Outline
1. Resource usage
2. Satisfaction & pass rates
3. Exam performance
4. Misc. measurements

Does (optional) attendance matter?
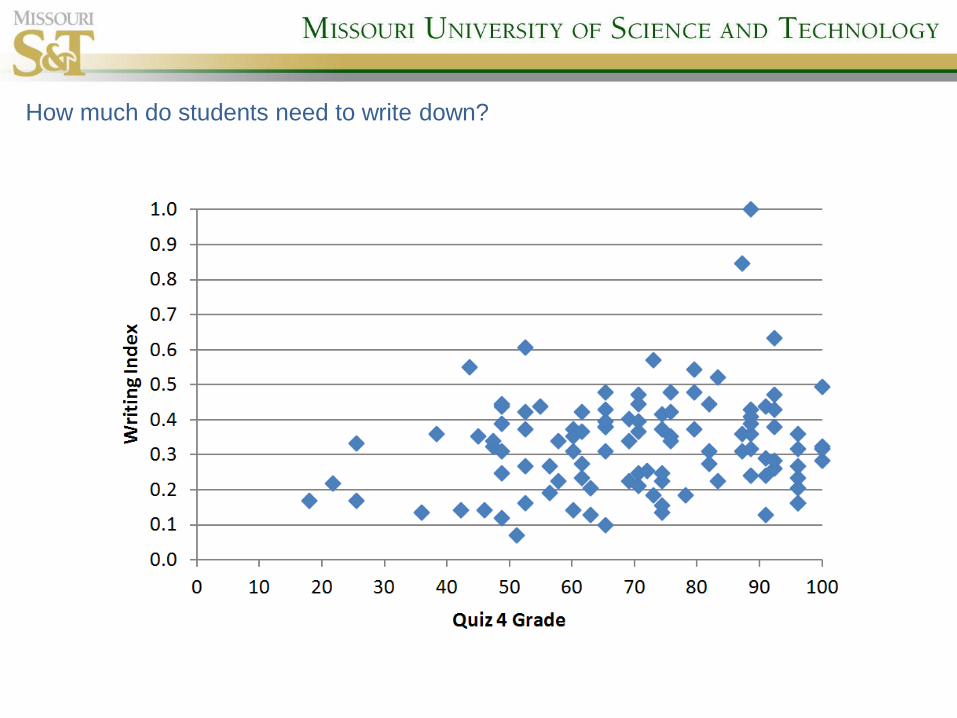
How much do students need to write down?

What about gender and major?
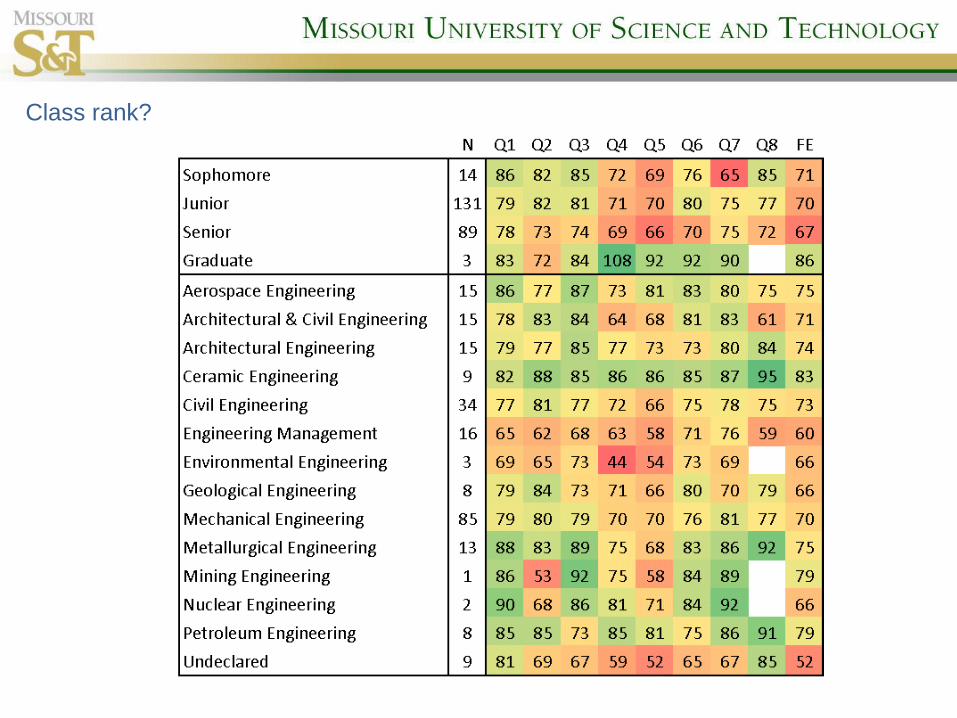
Class rank?

How have textbooks changed?

How have textbooks changed?

How have textbooks changed?
Conclusions
1. ability to evaluate study habits & learning aids
2. student/instructor flexibility and satisfaction
3. detailed learning estimates
Outline
1. Resource usage
2. Satisfaction & pass rates
3. Exam performance
4. Misc. measurements
Questions?
Acknowledgements
• Timothy Philpot, Douglas Carroll, Richard Hall, Malcolm Hays • Missouri S&T Educational Technology • Missouri S&T Educational Research Mini-Grants • Missouri S&T eFellows Program • Missouri S&T Office of the Vice Provost for Academic Affairs • NSF Grant 0837339 • many student assistants