presents justifying the cost of quality - scqaa-oc the cost of downtime and other lost revenue ......
TRANSCRIPT

Copyright of www.ScorpionComputerServices.com
Justifying the Cost of Quality
presents

Agenda� Overview
� History of Quality Evolution in an Organization
� Where Testing Typically Starts
� Next Stop: Automation
� Next Stop: Automation Regression Framework & Automated Scenario Generation
� Last Evolution Software Stack
� Steps to Justify the Cost
� Quality Calibration Meeting � Quality Calibration Meeting
� Determine the Organization’s Quality Risk Tolerance
� Understanding Downtime & Updating
� Determine How Much Quality is Enough
� Determine the Cost of Software Quality (CoSQ)
� Determine the Cost of Downtime and other Lost Revenue
� Determine the ROI for Manual & Automated Testing
� The 1-Page Testing Cost-Benefits Analysis
� Communicate Findings to Leadership
� Pulling It All Together
Copyright of www.ScorpionComputerServices.com

OverviewRecently, QA leaders have been asked to decrease costs, through
resource cuts, outsourcing, and other cost savings means; while taking on more scope. This is typically a loose-loose scenario.
There is definitely a better way!
Today we will look at empowering you with some tools to:
� Justify your existing costs by exploring the cost of quality, cost of downtime, and cost of lost revenue
� Ways to present requests for quality improvement efforts
� Ways to determine the right level of quality for the organization
� Ways to educate your stakeholders about the uninteresting but needed elements of quality; like compliance testing
� The Goal: Express Quality with a Business Focus so the Business will Embrace it.
Copyright of www.ScorpionComputerServices.com

Analyst
(BA)
BA or Manual
TesterDeveloperUser Production
Error!
Where Testing Typically Starts
100% 97% 94% 91% 88%
Increasing Risk
Human error for a working professional averages 3%
QC or Word
Copyright of www.ScorpionComputerServices.com

Limitations with Manual BA Testing� Generating Test Cases manually:
� Is time consuming � Generates less than 25% coverage
of system logic� Focuses on the happy or expected
paths� Is very error prone as it is not
intuitive for humans� No multiples, One Script = One Test
Case
� Executing manual testing:� Manual testers can cost up to $10
per test case, even offshore, as most people average 30 test cases a day
� Increased test cycle time� Unable to test individual defect
fixes, often required to run full regression test suite
� Resulting Risks:Case � Duplication of effort, multiple people
will come up with the same scenarios
� Causes second application syndrome (SAS) where you are practically rewriting the application within the test system
� Test case maintenance is timely; as systems directly impact test cases which now need to be manually updated; 1 system change : many test cases
� Resulting Risks:� Incomplete regression testing � Number of live production bugs and
downtime� No accurate measure of coverage,
quality or risk exposure to the business
� False positive scenarios lead to wasted dev diagnostic time
� Exorbitant costs for testing� Not easily scaled� Excessive lead times for testing
and maintaining quality systems
Copyright of www.ScorpionComputerServices.com

Analyst Initial Testing
AutomationDeveloperUser Production
Next Stop: Automation
Risk
QC & QTP
100% 97% 94% 91% 91%
Since QTP is a tool no additional error will be introduced, but it is subject to the risk of only
being as smart as it was programmed.
Copyright of www.ScorpionComputerServices.com

Log in Box Example• How many test cases do you see?
• A group of 8 expert testers given 10 mins came up with 6 test cases.
• But, in fact, there were 26 test cases!
• Scenario generation tools come in to close the gap between expected test scenarios and possible test scenarios. Enabling testers to choose which scenarios are important.
Copyright of www.ScorpionComputerServices.com

Log in Box Example – 26 Scenarios
000:[Click icon] [Correct Username] [Correct Password] [Cancel]
001:[Click icon] [Correct Username] [Correct Password] [OK] [Grant Access]
002:[Click icon] [Correct Username] [Wrong/No Password] [Cancel]
003:[Click icon] [Correct Username] [Wrong/No Password] [OK] [Deny Access]
004:[Click icon] [Correct Username] [Cancel]
005:[Click icon] [Correct Username] [OK] [Deny Access]
006:[Click icon] [Wrong/No Username] [Cancel]
007:[Click icon] [Wrong/No Username] [OK] [Deny Access]
008:[Click icon] [Wrong/No Username] [Correct Password] [Cancel]
009:[Click icon] [Wrong/No Username] [Correct Password] [OK] [Deny Access]
010:[Click icon] [Wrong/No Username] [Wrong/No Password] [Cancel]
011:[Click icon] [Wrong/No Username] [Wrong/No Password] [OK] [Deny Access] 011:[Click icon] [Wrong/No Username] [Wrong/No Password] [OK] [Deny Access]
012:[Click icon] [Correct Password] [Correct Username] [Cancel]
013:[Click icon] [Correct Password] [Correct Username] [OK] [Grant Access]
014:[Click icon] [Correct Password] [Wrong/No Username] [Cancel]
015:[Click icon] [Correct Password] [Wrong/No Username] [OK] [Deny Access]
016:[Click icon] [Correct Password] [Cancel]
017:[Click icon] [Correct Password] [OK] [Deny Access]
018:[Click icon] [Wrong/No Password] [Correct Username] [Cancel]
019:[Click icon] [Wrong/No Password] [Correct Username] [OK] [Deny Access]
020:[Click icon] [Wrong/No Password] [Wrong/No Username] [Cancel]
021:[Click icon] [Wrong/No Password] [Wrong/No Username] [OK] [Deny Access]
022:[Click icon] [Wrong/No Password] [Cancel]
023:[Click icon] [Wrong/No Password] [OK] [Deny Access]
024:[Click icon] [Cancel]
025:[Click icon] [OK] [Deny Access] STATELOOP of 3 gives 4,576 scenarios
Copyright of www.ScorpionComputerServices.com

Typical Automation Today
• A Test Analyst designs a test plan from system requirements & use cases
• The test plan is manually executed for each new build
• COTS Record and Playback (R&P) test tools may be used – Reduces human error & promoting reuse for subsequent builds
• However:
• Applications typically change • Applications typically change over repeated builds
• All affected tests and corresponding R&P scripts must be fixed (1:many)
• Over several build cycles, manual test case, script development time, and test case/script repair is multiplied by the number of builds
RESULT � higher QA costs ($$) and increased script maintenance time, which you have to explain
Copyright of www.ScorpionComputerServices.com

Analyst Full Test Suite
AutomationDeveloperUser Production
Next Stop: Automation Regression Framework & Automated Scenario Generation
97% 94% 91% 99.999%
Risk
QC & QTP
Copyright of www.ScorpionComputerServices.com

Automation Regression Framework & Scenario Generation
• Create an Application Constraint Model representing the possible user actions in the application
• Automatically create an Object Repository Model for all the GUI elements
• Automatically generate all possible scenarios of user actions using a scenario generation tool; like ScenGen
• Script test cases that leverage the Object Repository and are derived by • Script test cases that leverage the Object Repository and are derived by the scenario generation tool
• When GUIs change, this model-based approach reduces test script maintenance by up to 95% by automatically adapting to changes
Copyright of www.ScorpionComputerServices.com

Enable Verification &Validation Over Time
Versions v1 v2 v3 v4…30
• A test automation strategy robust enough to adapt to changes across versions for the lifetime of the software’s usage.
• Efficient enough to reduce the cost of maintenance due to these changes while optimizing reuse of existing scripts.
Initial engineering effort
to automate the test plan
Run automated test scripts for each
version with no/minimal changes
Copyright of www.ScorpionComputerServices.com

Benefits
• Defects reduced by up to 99.998%
• Test Coverage increased by over 100X
• Time to Release improved by an average of 20X because of increased test execution speed
• Total Cost Savings up to 5X as automation code/scripts become reusable across test scripts, plans, platforms and projects
• Tests are uncomplicated and readable
• Test Scripts for Manual
Testing only applies for 1 build; not reusable
• Test Scripts for Record and Playback oftenlast for only 6 builds before the extent of application changes renders existing test scripts obsolete
• Test Scripts from a scenario generation tool; such as ScenGen, have been used for up to 400 builds over 7 years
SustainabilityResults
• Tests are uncomplicated and readable
• Eliminates duplication of effort
• Automated test documentation
• Traceability back to requirements via tools; such as RequisitePro
• Functions are well documented and tested
• Easily integrates into software development life cycles & projects
up to 400 builds over 7 years
• Decreases delivery risk (Functional and Info Assurance)
• Less resources required during maintenance phase
• Increases consistency and repeatability
Compliance
Copyright of www.ScorpionComputerServices.com

Initial Challenges
• Difficult to justify the initial cost investment ($$$) because it is recovered over time
• Takes time to build
• Additional software and hardware resources are required, such as;
• Automation framework
• Segmented QA environment or lab• Segmented QA environment or lab
• Scenario generation tool
• Additional staff with specific quality area focuses are required, such as;
• Automation framework architect
• QPT scripter
• Automation testers
Copyright of www.ScorpionComputerServices.com
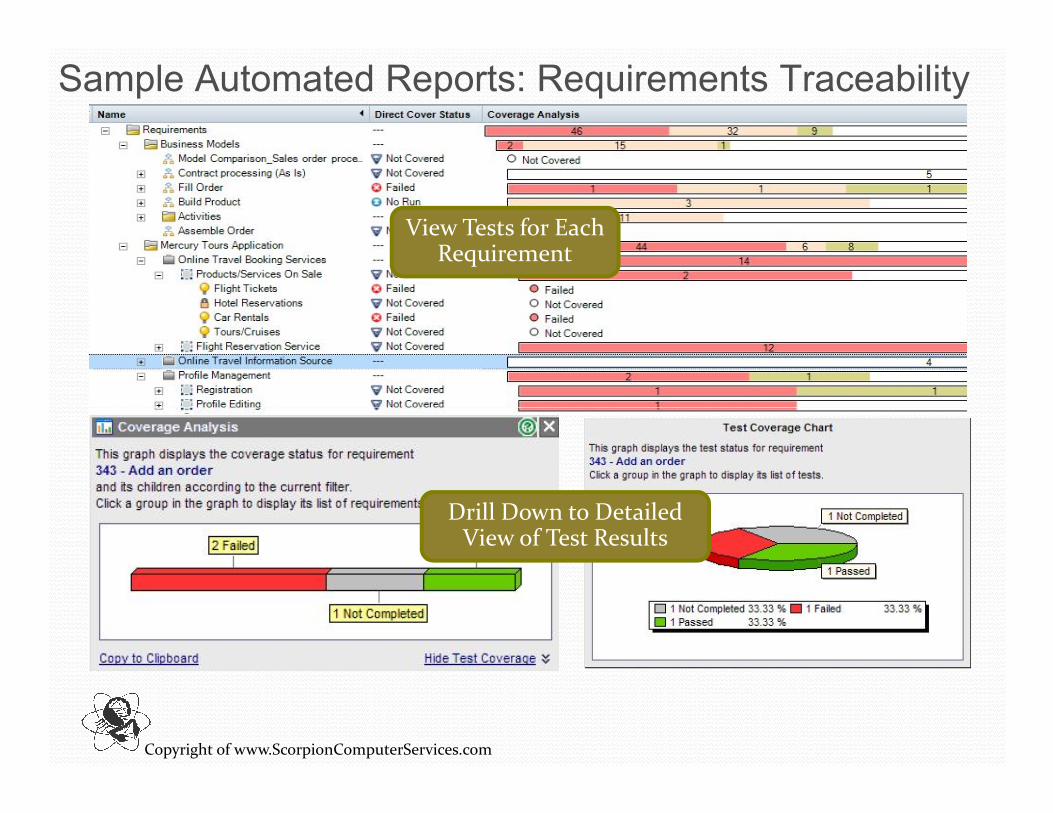
Sample Automated Reports: Requirements Traceability
View Tests for Each Requirement
Drill Down to Detailed View of Test Results
Copyright of www.ScorpionComputerServices.com

Last Evolution of Quality Call Stack
ScenGen
Regression Rules DB Test Engines
Test Designer
Test Plan AUTs Reports
Test Player
DataGen
Scenarios Playlist
Test Data DB
Test Script
APP Spec Func
Reusable Components
Utility Components
Language Components
Object Components
User-Related ItemsA = Test EngineB = Test Plan & Test ScriptC = Test Engine Framework
Components*D = ScenGen Components
AUT = Applications Under Test
* Test Engine Framework Components are maintained by the Test Engine Framework Architect
� Built by the Test Engine Framework Architect
Copyright of www.ScorpionComputerServices.com

No
Testing
Dev
Testing
2. Scenario/Data Hump
Concurrency Hump
1. Framework Hump
Record &
Playback
Common
Functions
Fully Indep
Script Library
TestGen
Data Driven
Framework
DeltaGen
Script/FR
Maint
DataGen
Player
Support
Testing Evolution Summarized
Start
State
Desired
End
StatePhase 1 Phase 2
17
Unit
Testing
Manual
Testing
2. Scenario/Data Hump
3. Concurrency Hump
1. Framework Hump
R&P Edited
Data Driven
Multi-layer
Programmable
Framework
Change Event
Resilient
Framework
TC DB
PlayList
Generation
Scenario
PlayList
Generation
Automated
Integration
Testing
Automated
Concurrency
Testing
Automated
Simulation
Testing
Mode 0 – Smoke
Mode 1 – Independent
Mode 2 – Scenario Generation
Mode 3 – Data Generation
Mode 4 – Concurrency/Slipknot
Mode 5 – Integration (Internal/External)
Mode 6 – Production Simulation
State
Copyright of www.ScorpionComputerServices.com

Steps to Justifying the Cost
No matter where you are in the quality evolution process, the steps to justifying the cost of quality are the same 7 steps:
1. Quality calibration meeting with key stakeholders
2. Determine the organization’s quality risk tolerance levels
3. Determine how much quality is enough3. Determine how much quality is enough
4. Determine the cost of quality
5. Determine the cost of downtime or other lost revenue
6. Determine the ROI/cost benefits analysis
7. Communicate findings to leadership
Copyright of www.ScorpionComputerServices.com

Quality Calibration Meeting
� A quality calibration meeting is a meeting where key individuals from the quality departments, management, and the user community representatives come together to confirm:
1. The organization’s quality risk tolerances
2. The organization’s acceptable downtime/lost revenue tolerance
3. Quality areas that are critical to them; such as performance or compliance testing or product longevity/sustainability testing
� The whole purpose of this meeting is to help set the direction of � The whole purpose of this meeting is to help set the direction of quality to ensure money is spent testing the items most important to IT, the infrastructure, and the business.
� Separate meetings are often held by product line or application; as each will have their own needs.
� The results are reviewed with executive leadership.
Copyright of www.ScorpionComputerServices.com

Quality Calibration Meeting continued…
� Benefits:
� Removes the gold plating from the quality organizations
� Ensures the service mentality of quality organizations by calibrating testing to the clients
� Helps educate the stakeholders on what quality is and its true scope beyond what they visually see
� Helps ensure ownership of the product’s end quality by the stakeholdersstakeholders
� Recommended Frequency is every year or 18 months or at the start of new projects or product launches
� Format: A guided brainstorming session that hits on core quality elements
Copyright of www.ScorpionComputerServices.com

Determine Organization’s Quality Risk Tolerance
Simplistically, an organization’s quality risk tolerance is defined as:
� Their accepted levels of defects in a system or product
� The accepted level of losses an organization is willing to incur due to known defects
� The accepted level of product grade the organization has defined
Product Grade is the category or level of characteristics a product or Product Grade is the category or level of characteristics a product or service will meet. Consider car companies.
Example: Scion, Toyota, and Lexus. These cars all meet the same basic quality requirements, and are manufactured by the same parent organization. However, each is manufactured with different grades of materials to allow for different market price points to be met. Thus, a Lexus car body may use more metal than a Scion; which uses more plastic.
Copyright of www.ScorpionComputerServices.com

Determine Organization’s Quality Risk Tolerance
There are many ways to determine an organization’s quality risk tolerance, the simplest is to ask the following during the quality calibration meeting:
� What are the acceptable hours of downtime per day?
� How much money is the company willing to loose or return if this product does not function 100%?
� How import is customer feedback on the quality of this product?
� What are the product quality grade specifications?
� What is the organization’s views on compliance, safety, or regulatory requirements?
Another way is to use either Project Management or ISO 31000 "Risk management -- Principles and guidelines on implementation"
Copyright of www.ScorpionComputerServices.com

Closer Look at Downtime & Uptime� Users typically think in system downtime; which is the amount of time
the system is unavailable.
� As testers, we focus on uptime which is the percent of the time a system is functioning out of it’s total service hours.
� Mission critical systems need 5 nines or 99.999% uptime; which is 1 hour downtime every 11-12 years. However, ensure that level of uptime requires additional testing costs.
Availability PercentDowntime per
Year
Downtime per
Month*
Downtime per
Week
90% ("one nine") 36.5 days 72 hours 16.8 hours
95% 18.25 days 36 hours 8.4 hours
98% 7.30 days 14.4 hours 3.36 hours
99% ("two nines") 3.65 days 7.20 hours 1.68 hours
99.50% 1.83 days 3.60 hours 50.4 minutes
99.80% 17.52 hours 86.23 minutes 20.16 minutes
99.9% ("three nines") 8.76 hours 43.2 minutes 10.1 minutes
99.95% 4.38 hours 21.56 minutes 5.04 minutes
99.99% ("four nines") 52.56 minutes 4.32 minutes 1.01 minutes
99.999% ("five nines") 5.26 minutes 25.9 seconds 6.05 seconds
* Calculation using a 30 day month.

How Much QA is Enough?
2. Scenario/Data Hump
3. Concur/Integ Hump
1. Framework Hump
Record &
Playback
Multi-layer
Programmable
Framework
Scenario
Generation
/DataGenConcurrency
Integration
4. Sim
ulation Hump
Production
Simulation
5. ??? Hump
99%Uptime 99.9% 99.99% 99.999% 99.9999%
100%
0%
20%
80%
50%
Bugs
Downtime
ROI
Enough QA:
CoSQ=ROI on QA
Cost+10% Design Cost
99%Uptime 99.9% 99.99% 99.999% 99.9999%

Determine How Much Quality is Needed cont…
Once you know your organization’s appetite for:� Quality risk (includes disaster recovery, compliance, functional and non-
functional requirements) � Down time tolerance� Brand risk tolerance� Financial loss tolerance
you are ready to determine how much quality is needed.
Steps to Determine How Much QualitySteps to Determine How Much Quality1. Review a comprehensive list of testing types against your company’s quality
risk tolerance. Some examples have been provided on the next two slides.2. Remove the types of testing which do not support the company’s objectives;
some examples are:� If there are no specific requirements for how long a product should last,
then an quality organization would remove product performance testing� If adherence to compliance objectives is extremely important to an
organization, then a quality organization would add compliance based testing such as penetration testing, PHI testing, etc.
3. Adjust your overall quality strategy/plan to reflect the refined scope
Next step determine cost of quality…
Copyright of www.ScorpionComputerServices.com

Sample Test Types/CoverageArchitecture Reviews
Code ReviewReuse ReviewScalability ReviewCompatibility Review/Impact analysisHigh Availability ReviewMaintainability Review Business Rule Integrity Review
Clear/White-Box/Unit Testing
Code CoverageStatic Testing (Parasoft) (Code Pattern/Style Engine compliance)Dynamic Testing(Parasoft)Purity Testing(Purify/Boundschecker)Performance Testing(Junit)Functional Unit TestingNumerical Unit TestingString Manipulation Unit TestingInstructional Unit TestingBranch Unit TestingConditional Branch Unit Testing
Functional\Black Box Testing
Manual TestingError Trap Execution, NEG: TestingGUI Enablement Matrix, DIS: Testing
Randomized Testing
Random TestingGremlin/BulletProof Testing
Performance Testing
Load Testing Stress Testing Benchmark Testing Scalability Testing Protocol Record and playback Simulation, Agent, Stub & Harness Testing.NOC Compliant/Diagnostic Threshold TestingConditional Branch Unit Testing
Exhaustive Unit TestingDB Schema (Data Types and Bounds) Unit TestingAPI level Unit TestingProtocol Layer (RV & CORBA) Unit TestingParser Syntax compliance(Intermediate File Format(IFF)) Unit Testing
GUI Enablement Matrix, DIS: TestingGraphical User Interface(GUI) TestingThird Party TestingSecurity, Intrusion TestingLog testingConcurrency TestingAutomated TestingSanity/Smoke/Build/Code Acceptance TestRegression Testing Scenario Testing Data/Scenario TestingIntegrity Scan TestReliability Testing
Platform Testing
Smoke Test on target environmentsMigration Environment Testing Mobility Testing
Setup and Recovery/Installation
Testing
Setup/Installation Testing Upgrade TestingDocumentation Testing
Threshold Testing
Copyright of www.ScorpionComputerServices.com
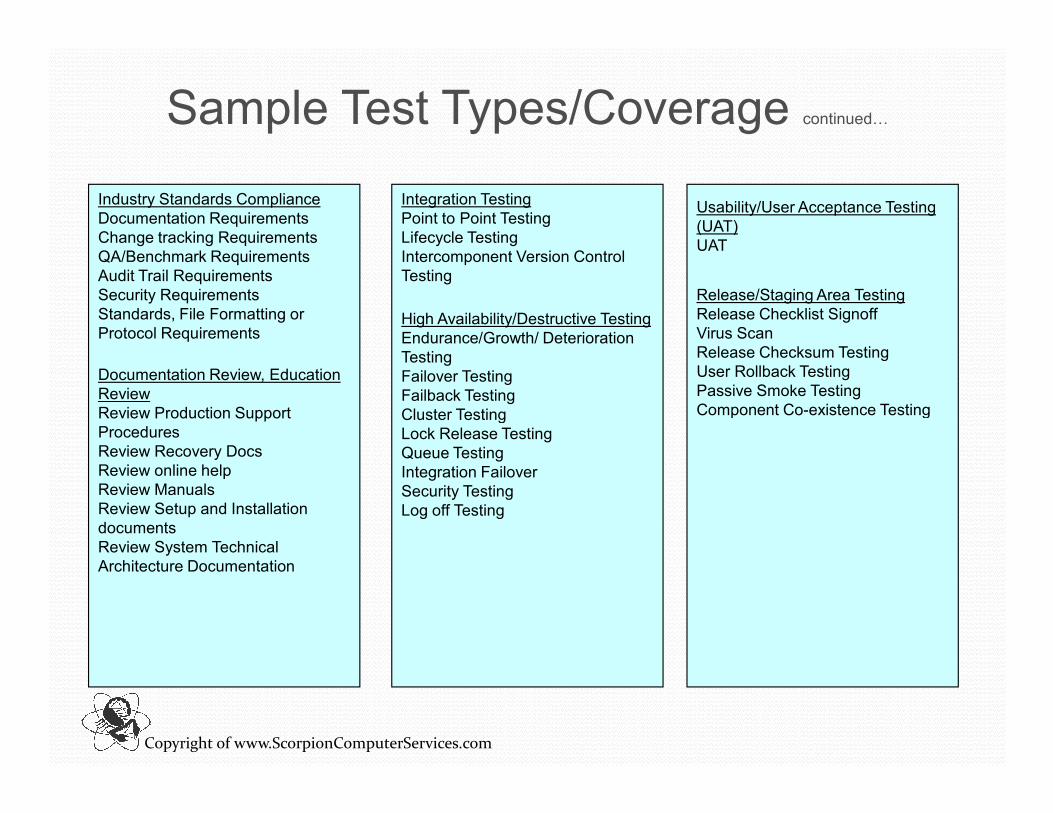
Sample Test Types/Coverage continued…
Industry Standards ComplianceDocumentation RequirementsChange tracking RequirementsQA/Benchmark RequirementsAudit Trail RequirementsSecurity RequirementsStandards, File Formatting or Protocol Requirements
Integration TestingPoint to Point TestingLifecycle TestingIntercomponent Version Control Testing
Documentation Review, Education ReviewReview Production Support
Usability/User Acceptance Testing (UAT)UAT
Release/Staging Area TestingRelease Checklist SignoffVirus Scan Release Checksum TestingUser Rollback TestingPassive Smoke Testing Component Co-existence Testing
High Availability/Destructive TestingEndurance/Growth/ Deterioration TestingFailover TestingFailback TestingCluster TestingReview Production Support
ProceduresReview Recovery DocsReview online helpReview ManualsReview Setup and Installation documentsReview System Technical Architecture Documentation
Component Co-existence TestingCluster TestingLock Release TestingQueue TestingIntegration FailoverSecurity TestingLog off Testing
Copyright of www.ScorpionComputerServices.com

Defining Cost of Quality (CoQ)
Cost of Quality is defined as any cost that would not be incurred if the quality were perfect. The costs are categorized into: internal failure costs (scrap, rework, re-inspection redesign, process changes etc.), external failure costs (returns, warranty, penalties, revenue loss etc.), appraisal (inspection, audits, test equipment etc.) and prevention (quality planning, process control, quality audits, programmatic error handling etc.).
The concept of CoQ was originated by Joseph Juran in 1951 and expanded on by Phillip Crosby in 1979 to take on the view of “the cost of non-conformance.”
In the early 1990’s, articles started popping up for Cost of Software Quality (CoSQ) which provided examples of how the traditional manufacture based costing of quality applied to a software world.
Copyright of www.ScorpionComputerServices.com

Determine Cost of Software Quality (CoSQ)� Apply the CoQ Model, in which every activity is classified as
Internal or External Failure, Appraisal or Prevention.
CoQ Amended for Software (CoSQ Activities)
Activity Definition Example
Internal Failure Internal failure costs are costs that are caused by products, or applications, or services not conforming to requirements and are found BEFORE delivery of products, applications, and services to external customers.
• Scrap• Rework• Re-inspection• Re-testing
External Failure External failure costs are costs that are caused by • DowntimeExternal Failure External failure costs are costs that are caused by products , or applications, or services not conforming to requirements and are found AFTER delivery of products , applications, and services to external customers.
• Downtime• Prod Break – Fix Scenario Support• Warranty• Returns/ Refunds• Credit/Charge Backs• Penalty Fees
Appraisal Appraisal costs are costs that occur to check if work conforms to the requirements.
• Inspection cost• QC executed activities (quality audits)• Field tests• Quality tools
Prevention Cost of all activities carried out to prevent poor quality from arising in products or services.
• Process improvement• Root cause analysis• Quality planning• Programmatic error handling scripts• Unit testing
Copyright of www.ScorpionComputerServices.com

Determine the Cost of Software Quality (CoSQ) cont…
1. Brainstorm all tasks completed in support of each CoSQ activity, in discriminate of who performs them.
2. Identify either from historical records or best estimation how much is spent on each task. Include human, software, hardware, and time costs.
3. Sum each task by CoSQ activity.
4. CoSQ = sum of each activity. You now have the total cost of 4. CoSQ = sum of each activity. You now have the total cost of quality for your organization.
5. To derive the cost of quality for your Quality group or department, only sum those tasks performed by your group.
Note: From here on, the cost of quality for one specific quality group as identified in step 5 will be referenced as the “cost of quality by team.”
Copyright of www.ScorpionComputerServices.com

Steps to Determine the Cost of Lost Revenue1. During the quality calibration meeting; brainstorm all sources of
lost revenue your organization can have with the business users. Some common examples are:
� Warranty exchanges and returns
� Customer refunds or credits
2. Identify where you can get data on the money spent per issue
3. Gather the previous full year’s financials* related to each area of lost revenue. Yes, you need to go hunting, but it is worth it.of lost revenue. Yes, you need to go hunting, but it is worth it.
� For example: In 2008, a major telcom spent $79,220.28 replacing handsets + another $7,246.00 on customer credits/refunds at these locations. For a total of $86,466.28 in one year on this issue.
� After performing root cause analysis it was determined that network jitter was causing the issue and not the handsets. By having the cost spent on the issue, the quality team was able to justify a purchase of Orion Network Performance Monitor ($20,975) and an additional quality resource focused on network quality, all for $50K.
� Net issue savings one issue = $36,466.28
Copyright of www.ScorpionComputerServices.com

Steps to Determine the Cost of Downtime1. Gather the previous full year’s financials* related to net revenue
by product or application or service. You will typically find this in finance or accounting. For example:
� A telecom's revenue was reported at $70,353,742.00 for one year
2. Determine the total year’s hours of service
� For the telcom, yearly hours of service was 12,200
� 12,200 = number of days per year service provided (365) * hours service offered per day (18)service offered per day (18)
3. Determine the average cost of downtime for one product
� For the telcom, their average hourly cost of downtime was $10,708.33 (= revenue reported for a year/ yearly hours of service)
� To calculate cost of downtime by phones, simply take the average hourly cost of downtime/total number of phones (= $0.88)
* Using historical revenue data allows for average based downtime costing and should be used if the actual impact of downtime or actual costs of lost revenue scenarios are unavailable or unknown to you

Determine the ROI on Quality� Now that you have the CoSQ, the cost of downtime and lost revenue
costs, you are able to pull it all together by determining the return on investment (ROI) and cost-benefit analysis of quality.
Steps to Determine ROI for Manual Testing
1. List out all the non-financial benefits of the testing; e.g. increased customer satisfaction.
2. Then calculate the cost of manual testing
� Cost of manual testing = time and resource cost to develop test cases + (time � Cost of manual testing = time and resource cost to develop test cases + (time and resource cost to maintain test cases * number of times tests are executed) + (time and resource cost to execute test cases * number of times)
3. Calculate the return on investment; ROI =$Savings +$Earnings - $Cost
� What is the initial investment and on-going costs ($Cost)?
� How much is it going to save in the first year and every year after that ($Savings)? This is your the cost downtime prevented + any money saved from lost revenue sources discussed earlier.
� How much will be earned by improving the quality ($Earnings)? This could be increased sales.
� NOTE: When in doubt, only use a small percent increase against average total earnings or saving for estimations. I like to use 10% at most.

Determine the ROI on QualitySteps to Determine ROI for Automated Testing
1. List out all the non-financial benefits of the testing
2. Then calculate the break-even point for automated testing to manual testing. This is the number of automated test cycles in which the cost = that of manual testing. Each cycle over this is testing dollars saved. * Historically we have found this to be the 4th
test cycle.
3. Calculate the return on investment for automated testing
4. Create a 1-page executive testing cost-benefit analysis
5. Communicate the following quality findings to leadership:
� The organization’s quality risk tolerance levels
� How much quality is enough for the organization & its cost (CoSQ)
� The cost of downtime and cost of any other lost revenue
� The executive testing cost-benefits analysis with ROI metric
ROI*ROI*ROI*ROI* #tests(#releases -
3)cost of a
manual test
cost of mitigated
downtime + lost revenue
saved
Copyright of www.ScorpionComputerServices.com

Communicate Findings to Leadership� It is great that we have all this data related to cost of downtime, cost of
quality, and the return is on the quality investment. However, data is just data if not used.
� Communication is the last step to justify the cost of quality. It is how you use and share this data that makes and breaks your team.
Communication Techniques� Create a 1-pg executive testing cost-benefit analysis when justifying
existing quality costs or the cost of quality improvement initiatives
� Summarize and present to leadership the below quality finds in a 5-pg � Summarize and present to leadership the below quality finds in a 5-pg power-point. Topics to cover are:
� The organization’s quality risk tolerance levels
� How much quality is enough for the organization & the cost (CoSQ)
� The cost of downtime and cost of any other lost revenue
� The executive testing cost-benefits analysis with ROI metrics
� Summary of key testing metrics; test cases executed, defects captured, RCA completed, $ saved, test coverage metrics, etc.
� Include the CoSQ itemized break-down in the appendix
� List cost of downtime, ROI, and other math/data calculations in the appendixCopyright of www.ScorpionComputerServices.com

1-Page Executive Testing Cost-Benefits Analysis
Copyright of www.ScorpionComputerServices.com

Example Regression Framework ROI Elements• Rapidly reduced test and delivery time (up to 20X)
• Eliminated repetitive manual testing and associated human error
• Increased fault tolerance/Reduced downtime
• Reduced diagnostics time/Increased development productivity• Agile Test & QA: when test and QA is essentially free, defects can be caught within each Agile cycle• Ability to reproduce defects immediately, reliably and repeatedly
• Increased compliance• Automated documentation to support potential documentation audits• Requirements Coverage: auto-generated requirements traceability matrix• C4ISR: 5 “nines” of uptime; proven exhaustive testing; eliminates SPOFs (Single Points of Failure) • C4ISR: 5 “nines” of uptime; proven exhaustive testing; eliminates SPOFs (Single Points of Failure)
* It costs the same amount to test a system manually 3 times as it takes to set-up the ScenGen Regression Framework once; i.e.,
we have found that ScenGen Automated Regression Frameworks with QTP automation, typically pays for itself on the 4th test
cycle. Typically, large systems have up to 30 test cycles.
ROI*ROI*ROI*ROI* #tests(#releases
-3)
cost of a manual
test
cost of mitigated downtime
$2.16M** 5,000(30
releases -3) = 27
$16/testcost of
mitigated downtime
E.g.
** Excludes the cost of mitigated downtime.
Copyright of www.ScorpionComputerServices.com

Examples of Serious Defects Found & Mitigated by the Regression Framework
� System won’t deploy: Installation defect
� Security was disabled
� Data integrity defect/calculation change
� Screen crash on opening
� Memory leak, response time slowdown
� Images/icons missing/swapped
� Logging stopped
� Warning/Alert system disabled
� Time stamps based on client location rather than server
� Data replication function failed
� Action could not be cancelled or reversed
� Data column missing; old DB schema � Logging stopped
� User preferences and search filters overwritten
� Data record locking to prevent overwrites for concurrent users not working
� Log off/shutdown not completing
� System data update messages intermittent
� Data column missing; old DB schema update
� Data rows off by 1; count from zero
� Dropdown menu blank
� Configuration error
� Bad code merge
� Bad build environment
Copyright of www.ScorpionComputerServices.com

Pulling It All Together
� As you already know, justifying, explaining, and educating others on the cost of quality is not an easy task. However, through tonight’s 7-step process, we examined a way to push back when testing scope increases without the right resources.
� How? By looking at the business side of testing, which includes:
� The importance of calibrating quality efforts with key � The importance of calibrating quality efforts with key stakeholders needs/desires.
� Removing the gold plating and educate stakeholders on the un-exciting, easy to forget parts of testing they actually need; like performance, via the quality calibration meeting.
Copyright of www.ScorpionComputerServices.com

Pulling It All Together continued…
� Looking at the business side of testing also includes:
� Determining the organization’s quality risk tolerance levels
� Which allows quality level adjustments to be made to match those risk tolerance levels and derive the organization’s new metric for how much quality is enough.
� Learning how to calculate the cost of software quality (CoSQ), the cost of downtime, any other lost revenue opportunities, and the ROI of qualitythe ROI of quality
� We closed with communicating all this information back to leadership and the stakeholders to ensure
The end game is for
Quality to be Embraced as a Core, Critical, Value-Added Part of the Organization. Quality is more than a Luxury, it is a Necessity.
Copyright of www.ScorpionComputerServices.com

Contact InformationContact Information
Shelly Kang Wright
SVP of Operations & Business Development
Scorpion Computer Services, Inc.
www.ScorpionComputerServices.comwww.ScorpionComputerServices.com
Direct: 818-237-9085 x3
Cell: 424-247-3181
Email: [email protected]
41Copyright of www.ScorpionComputerServices.com


References
� Reynolds, M. (2010). How to Calculate Cost of Quality. eHow. [Retrieved] 2011, [from] http://www.ehow.com/how_6086288_calculate-cost-quality.html
� Rice, R. The Cost of Software Quality - A Powerful Tool to Show the Value of Software Quality. [Retrieved] 2011, [from] http://www.riceconsulting.com/articles/software-cost-of-quality-metric.html
� ASQ Quality Costs Committee. (1999). Cost of Quality. ASQ., [Retrieved] 2011, [from] http://asq.org/learn-about-quality/cost-of-quality/overview/overview.html
� Buthmann, A. Cost of Quality: Not Only Failure Costs. [Retrieved] 2011, [from] http://www.isixsigma.com/index.php?option=com_k2&view=item&id=937:cost-of-quality-not-only-failure-costs&Itemid=187
Copyright of www.ScorpionComputerServices.com
� Sullivan, K. & Ravi, J.(2010) Assessing Risk in the Organization: The Next Step in the ERM Process. [Retrieved] 2011, [from] http://www.amper.com/publications/review/W10-Risk-Assessment.asp
� Smith, K. (2010). The Software Industry's Bug Problem. [Retrieved] 2011, [from] http://www.qualitydigest.com/april03/articles/03_article.shtml