press release - 1t19 · press release auditors' report complete financial statements...
TRANSCRIPT

Realized
Expanded Loan Portfolio 9% to 13%9%
a
Net Interest Income 4% to 8% 6% a
Fee and Commission Income 3% to 7% 2% r
Operating Expenses
(Administrative and Personnel Expenses)0% to 4% 6% r
Income from Insurance, Pension Plans and Capitalization
Bonds (1)5% to 9% 17% a
Expanded ALL - R$ billion R$ 11.5 to R$ 14.5R$ 7,1
a
(9% sem variação cambial)
(Realizado 1S19)

4
Press Release Independent
Auditors'
Report
Complete
Financial
Statements Additional
Information Economic-
Financial
Analysis
“R$285.9 billion”
+ 5.7% in the quarter
+ 66.6% in 12 months
“R$6.5 billion”
+ 3.6% in the quarter
+ 25.2% in 12 months
Main Information
(1) According to the non-recurring events described on page 5 of this Economic and Financial Analysis Report;
(2) It includes provision for sureties, guarantees, income from loan recoveries, discounts granted, result with BNDU (assets not for own use) and impairment of financial assets;
(3) Income from Insurance, Pension Plans and Capitalization Bonds = Retained Premiums from Insurance, Pension Plans and Capitalization Bonds - Variation in technical reserves for Insurance, Pension
Plans and Capitalization Bonds - Retained Claims - Capitalization Bond Draws and Redemptions - Insurance Plan, Pension Plan and Capitalization Bond Selling Expenses + Financial Income of the Operation;
(4) For more information, please see note 4 – Balance Sheet and Managerial Statement of Income, in chapter “Complete Financial Statements” of this report;
(5) Besides the Loan portfolio – Central Bank of Brazil (Bacen) concept includes sureties, guarantees, letters of credit, advances on credit card receivables, debentures, promissory notes, co-obligations in
real estate receivable certificates and rural credit;
(6) It excludes the asset evaluation adjustments recorded under the Shareholders’ Equity;
(7) For 1H19 / 1H18 considers the cumulative index in 12 months;
(8) For comparison purposes, shares were adjusted in accordance with bonuses and stock splits occurred in the periods;
(9) Number of shares (excluding treasury shares) multiplied by the closing price for common and preferred shares on the period’s last trading day; and
(10) Overdue loans.
Result
Recurring Net Income (1) 6,462 6,238 5,161 12,700 10,263 3.6 25.2 23.7
Net Interest Income 14,468 14,087 13,507 28,555 27,029 2.7 7.1 5.6
Expanded ALL (2) (3,487) (3,604) (3,491) (7,091) (7,426) (3.2) (0.1) (4.5)
Fee and Commission Income 8,280 8,074 8,171 16,354 16,057 2.6 1.3 1.8
Income from Insurance, Pension Plans and Capitalization Bonds (3) 3,594 3,826 3,221 7,420 6,348 (6.1) 11.6 16.9
Statement of Financial Position
Total Assets (4) 1,412,294 1,388,429 1,306,209 1,412,294 1,306,209 1.7 8.1 8.1
Loans - Expanded Loan Portfolio (5) 560,538 548,294 515,635 560,538 515,635 2.2 8.7 8.7
- Individuals 209,867 200,164 182,817 209,867 182,817 4.8 14.8 14.8
- Companies 350,671 348,130 332,818 350,671 332,818 0.7 5.4 5.4
Shareholders' Equity 133,636 126,674 113,039 133,636 113,039 5.5 18.2 18.2
Assets under Management 2,231,331 2,205,050 2,050,956 2,231,331 2,050,956 1.2 8.8 8.8
Highlights
Annualized Return on Average Equity (ROAE) - % (6) 20.6 20.5 18.4 20.6 18.5 0.1 p.p. 2.2 p.p. 2.1 p.p.
Efficiency Ratio (ER) - % (7) 49.2 48.6 49.7 49.4 49.4 0.6 p.p. (0.5) p.p. -
Recurring Net Income per Share (in the last 12 months) - R$ (8) 2.99 2.83 2.48 2.99 2.48 5.7 20.4 20.4
Market Capitalization (9) 285,870 270,349 171,604 285,870 171,604 5.7 66.6 66.6
Dividends / Interest on Shareholders’ Equity - Net 1,797 1,752 1,511 3,549 3,030 2.6 18.9 17.1
Delinquency Ratio (> 90 days (10) / Loan Portfolio) - % 3.2 3.3 3.9 3.2 3.9 (0.1) p.p. (0.7) p.p. (0.7) p.p.
Tier I Capital - % 15.0 14.4 11.4 15.0 11.4 0.6 p.p. 3.6 p.p. 3.6 p.p.
R$ million (unless otherwise stated) 2Q192Q19 x
1Q19
Variation%
(unless otherwise stated)
1H19 x
1H181Q19 2Q18
2Q19 x
2Q181H19 1H18
“Return on Average Equity
20.6%”
Recurring Net Income
Profitability
Operational (lEO)
Market Capitalization
2Q
19

5
Press Release Independent
Auditors'
Report
Complete
Financial
Statements Additional
Information Economic-
Financial
Analysis
Recurring Net Income vs. Book Net Income
Below is a comparison between the main non-recurring events that affected the net income in the period:
(1) Essentially composed of contingent liabilities.
Summarized Analysis of Recurring Income
For more information about the summarized analysis of recurring income presented as follows, see chapter “Economic and
Financial Analysis” of this report.
(1) In the 1Q19/1H19, the expense lines with ALL (Gross) is impacted in R$1,836 million, due to the entry of the judicial recovery plan of clients written off for losses, taking effects in the lines of Income from
Credit Recovery and Impairment of Financial Assets, without effects in the total ALL expense as well as in the income for the period;
(2) Includes the result with BNDU, provision for sureties and guarantees and others; and
(3) Income from Insurance, Pension Plans and Capitalization Bonds = Retained Premiums from Insurance, Pension Plans and Capitalization Bonds (-) Variation in technical reserves for Insurance, Pension
Plans and Capitalization Bonds (-) Retained Claims (-) Capitalization Bond Draws and Redemptions (-) Insurance Plan, Pension Plan and Capitalization Bond Selling Expenses + Financial Income of the Operation.
R$ million 2Q19 1Q19 2Q18 1H19 1H18
Recurring Net Income 6,462 6,238 5,161 12,700 10,263
Non-Recurring Events (420) (418) (633) (838) (1,268)
- Goodw ill amortization (Gross) (374) (373) (613) (747) (1,220)
- Other (1) (46) (45) (20) (91) (48)
Book Net Income 6,042 5,820 4,528 11,862 8,995
(R$ million)
Net Interest Income 14,468 14,087 13,507 28,555 27,029 2.7 7.1 5.6
- Client Portion 12,185 11,960 11,694 24,145 22,958 1.9 4.2 5.2
- Market Portion 2,283 2,127 1,813 4,410 4,071 7.3 25.9 8.3
Expanded ALL (3,487) (3,604) (3,491) (7,091) (7,426) (3.2) (0.1) (4.5)
ALL Expenses (1) (4,349) (6,292) (4,369) (10,641) (8,968) (30.9) (0.5) 18.7
Income from Credit Recovery (1) 1,609 3,008 1,652 4,617 3,099 (46.5) (2.6) 49.0
Granted Discounts / Other (2) (612) (364) (561) (976) (1,089) 68.1 9.1 (10.4)
Impairment of Financial Assets (1) (135) 44 (213) (91) (468) - (36.6) (80.6)
Gross Income from Financial Intermediation 10,981 10,483 10,016 21,464 19,603 4.8 9.6 9.5
Income from Insurance, Pension Plans and Capitalization Bonds (3) 3,594 3,826 3,221 7,420 6,348 (6.1) 11.6 16.9
Fee and Commission Income 8,280 8,074 8,171 16,354 16,057 2.6 1.3 1.8
Personnel Expenses (5,488) (5,158) (4,927) (10,646) (9,756) 6.4 11.4 9.1
Other Administrative Expenses (5,103) (5,026) (4,993) (10,129) (9,803) 1.5 2.2 3.3
Tax Expenses (1,767) (1,752) (1,831) (3,519) (3,652) 0.9 (3.5) (3.6)
Equity in the earnings (losses) of unconsolidated and jointly controlled
subsidiaries81 48 48 129 75 68.8 68.8 72.0
Other Operating Income / (Expenses) (1,532) (1,625) (1,561) (3,157) (3,058) (5.7) (1.9) 3.2
Operating Income 9,046 8,870 8,144 17,916 15,814 2.0 11.1 13.3
Non-Operating Income 11 24 (17) 35 (26) (54.2) - -
Income Tax / Social Contribution (2,535) (2,602) (2,909) (5,137) (5,392) (2.6) (12.9) (4.7)
Non-controlling interests in subsidiaries (60) (54) (57) (114) (133) 11.1 5.3 (14.3)
Recurring Net Income 6,462 6,238 5,161 12,700 10,263 3.6 25.2 23.7
Recurring Income Statement
1Q19 1H182Q192Q19 x
2Q18
2Q19 x
1Q192Q18 1H19
1H19 x
1H18
Variation %
6
Press Release Independent
Auditors'
Report
Complete
Financial
Statements Additional
Information Economic-
Financial
Analysis
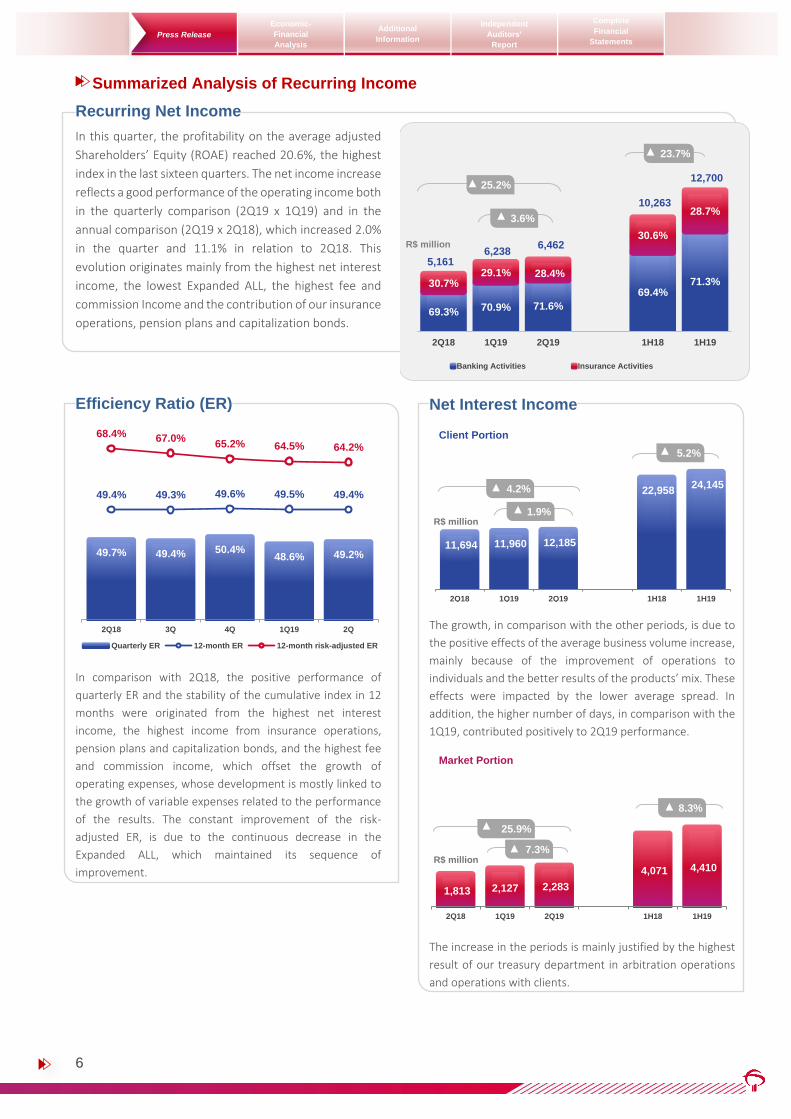
Summarized Analysis of Recurring Income
Recurring Net Income
In this quarter, the profitability on the average adjusted
Shareholders’ Equity (ROAE) reached 20.6%, the highest
index in the last sixteen quarters. The net income increase
reflects a good performance of the operating income both
in the quarterly comparison (2Q19 x 1Q19) and in the
annual comparison (2Q19 x 2Q18), which increased 2.0%
in the quarter and 11.1% in relation to 2Q18. This
evolution originates mainly from the highest net interest
income, the lowest Expanded ALL, the highest fee and
commission Income and the contribution of our insurance
operations, pension plans and capitalization bonds.
Efficiency Ratio (ER)
In comparison with 2Q18, the positive performance of
quarterly ER and the stability of the cumulative index in 12
months were originated from the highest net interest
income, the highest income from insurance operations,
pension plans and capitalization bonds, and the highest fee
and commission income, which offset the growth of
operating expenses, whose development is mostly linked to
the growth of variable expenses related to the performance
of the results. The constant improvement of the risk-
adjusted ER, is due to the continuous decrease in the
Expanded ALL, which maintained its sequence of
improvement.
Net Interest Income
The growth, in comparison with the other periods, is due to
the positive effects of the average business volume increase,
mainly because of the improvement of operations to
individuals and the better results of the products’ mix. These
effects were impacted by the lower average spread. In
addition, the higher number of days, in comparison with the
1Q19, contributed positively to 2Q19 performance.
The increase in the periods is mainly justified by the highest
result of our treasury department in arbitration operations
and operations with clients.
69.3% 70.9% 71.6%
69.4%71.3%30.7%
29.1% 28.4%
30.6%
28.7%
5,161 6,238
6,462
10,263
12,700
2Q18 1Q19 2Q19 1H18 1H19
R$ million
Banking Activities Insurance Activities
23.7%
25.2%
3.6%
49.7% 49.4% 50.4%48.6% 49.2%
49.4% 49.3% 49.6% 49.5% 49.4%
68.4% 67.0%65.2% 64.5% 64.2%
2Q18 3Q 4Q 1Q19 2Q
Quarterly ER 12-month ER 12-month risk-adjusted ER
11,694 11,960 12,185
22,958 24,145
2Q18 1Q19 2Q19 1H18 1H19
R$ million
5.2%
4.2%
Client Portion
1.9%
1,813 2,127 2,283
4,071 4,410
2Q18 1Q19 2Q19 1H18 1H19
R$ million
8.3%
7.3%
Market Portion
25.9%

7
Press Release Independent
Auditors'
Report
Complete
Financial
Statements Additional
Information Economic-
Financial
Analysis
Summarized Analysis of Recurring Income
Expanded ALL (Expenses)
Reduction of the expenses with Expanded ALL, in the
comparison with the 1Q19, is related to the quality of our
portfolio, which can be justified by the improvement in the
delinquency rates. In relation to 2Q18, even with an
evolution of 9% in loan operations, these expenses showed a
reduction. In addition, we have incurred lower expenses with
Impairment of Financial Assets with a reduction of 37% for
the period. We also highlight the lower levels of losses in the
periods, as well as the correlation between ALL Expenses and
expanded loan portfolio, which registered 2.5% in this
quarter, the lowest level since the 4Q17.
Fee and Commission Income
The positive performance of this quarter in relation to the
1Q19 was due the higher income from the checking
accounts, a reflection of enlargement of checking account
holders’ base and the management of the products portfolio
according to the client segmentation; higher loan operations
income, due to the increase of volume of businesses and the
activity of the capital, increasing our performance of
underwriting / financial advisory services. In the comparison
with 2Q18, the increase is related to: the good performance
of the income from the checking accounts, driven by the
growth of 1.1 million of new checking account holders; the
growth of the income with underwriting / financial advisory
services; the growth of income from custody and brokerage
services, with a highlight to the high performance of the
income from consortium management. In the period,
adjustments were made with respect to asset management
fees and lower revenues from the activities of the credit card
operator.
213
(44)
135 468 91
3,278 3,648 3,352
6,958 7,000
2.7% 2.6%2.5%
2Q18 1Q19 2Q19 1H18 1H19
R$ million
ALL, Loan Recovery and Granted Discounts
Impairment of Financial Assets
Expanded ALL (Expense) / Expanded Loan Portfolio (Annualized)
-0.1%
-4.5%
3,491 3,604
3,487
7,426
7,091
-3.2%
8,171 8,074 8,280
16,057 16,354
28.1 28.8 29.2
63 61 62
124 123
2Q18 1Q19 2Q19 1H18 1H19
R$ million
Fee and Commission Income
Checking Account Holders - million
Business Days
1.3%
1.8%
2.6%

8
Press Release Independent
Auditors'
Report
Complete
Financial
Statements Additional
Information Economic-
Financial
Analysis
Summarized Analysis of Recurring Income
Income from Insurance Operations,
Pension Plans and Capitalization Bonds
In the comparison with the 1Q19, we highlight the 4.2%
evolution in revenues, influenced by the improvement in
“Capitalization Bonds” and premiums of “Auto/P&C” and
“Health” segments. The behavior of the operating income in
the quarter reflects the seasonal effect of the claims, mainly
in the segments of “Health”.
In the comparison with the 2Q18, the good performance of
the operating income was driven mainly by the 3.2% growth
in revenues, the improvement of the claims and expense
ratios, compensated by the effect of the evaluation of long-
term provisions, which occurs frequently, in June and
December from each year, and resulted in a reversing entry
for the provision, in the amount of R$324 million in 2Q18 and
a constitution of provision, in the amount of R$90 million in
2Q19. The growth in the financial income can be justified by
the best performance of the financial investments,
highlighting the variable income and multimarket.
Operating Expenses (Personnel and Administrative)
Personnel Expenses – In the “structural part” the increase of
expenses in the quarter reflects the higher spending with
payroll and social charges, due to a lower concentration of
holidays in the 2Q19 and, in comparison with 2Q18, the
growth is related to the effects of the collective bargaining
agreement of 2018 / 2019 (readjustment of 5%) and to the
evolution of the personnel, in their majority allocated in the
business area. In the “non-structural part”, these variations
are largely justified by higher and variable expenses
(participation in the results), in all periods, highlighting that
as per this year we implemented a program of variable
compensation directed to the employees of the branch
network, and by the increase in the expenses with provision
for labor claims in the quarterly comparisons.
Administrative Expenses – The increase of the expenses in the
periods is concentrated in variable expenses and other
expenses related to business growth, in addition to
contractual readjustments and rate adjustments of
concessionaires of public services occurring in the period,
and higher expenses with advertising and marketing, related
to conquest of new clients, institutional positioning, Next
promotion and offer of our products and services. It should
be noted that, in the annual comparison, these expenses
grew below the inflation rate (IPCA, Extended Consumer
Price Index was 3.4%, and IGP-M, General Market Price
Index, was 6.5%).
2,205 2,491 2,065
3,720 4,556
1,016 1,335
1,529
2,628
2,864
3,221 3,826 3,594
6,348
7,420
2Q18 1Q19 2Q19 1H18 1H19
R$ million
Operating Income Financial Result
16.9%
-6.1%
11.6%
4,993 5,026 5,103
9,803 10,129
4,927 5,158 5,488
9,756 10,646
9,920 10,184 10,591
19,559 20,775
2Q18 1Q19 2Q19 1H18 1H19
R$ million
Administrative Expenses Personnel Expenses
6.8%
6.2%
4.0%

9
Press Release Independent
Auditors'
Report
Complete
Financial
Statements Additional
Information Economic-
Financial
Analysis
Summarized Analysis of Recurring Income
Expanded Loan Portfolio
(1) In the 1Q19, there were reallocations in the portfolio from Micro, Small and Medium-sized Enterprises to Large Corporates, in the amount of R$6.7 billion. These reallocations are related to the enhanced segmentation of our Companies clients.
Delinquency Ratio over 90 days
For the ninth consecutive quarter, the delinquency ratio
showed an improvement, reflecting the quality of the new
captures and adjustments in the loan granting and credit
recovery processes. Since the peak of delinquency in March
2017, the total index experienced a decrease of 2.4 p.p.. We
highlight that all the segments showed an improvement in
index since the beginning of 2018, and in June 2019, the
segments of large corporates registered the lowest historical
level of the last eleven quarters.
Coverage Ratio over 90 days
Our net losses in June 2018 reached 2.9%, and keep the
downward trend shown in the E-H Non-Performing
operations, we estimate an improvement of 40 basis points,
making a net loss of 2.5% in June 2019. Our level of
provisioning concerning the loan portfolio reflects the quality
improvement of our operations and the models of
provisioning improvement, which are based on statistical
models that capture historical, actuarial and prospective
data.
NPL Creation – 90 days vs. Write-offs
The total NPL Creation in relation to the loan
portfolio reached 1.1% in the 2Q19, showing a
an increase over the previous quarter, mainly
due to the atypical behavior of large
corporates segment presented in 1Q19.
June19 x
M ar19
June19 x
June18
Companies (1) 350,671 348,130 332,818 0.7 5.4 62.6
Large Corporates 249,532 248,374 237,868 0.5 4.9 44.5
Micro, Small and Medium-Sized Enterprises 101,139 99,756 94,950 1.4 6.5 18.0
Individuals 209,867 200,164 182,817 4.8 14.8 37.4
Payroll-deductible Loans 57,318 53,505 46,593 7.1 23.0 10.2
Real Estate Financing 41,282 39,759 35,618 3.8 15.9 7.4
Credit Card 34,803 34,319 33,606 1.4 3.6 6.2
CDC / Vehicle Leasing 26,032 24,628 22,167 5.7 17.4 4.6
Personal Loans 23,898 21,688 18,490 10.2 29.2 4.3
Other 26,534 26,265 26,343 1.0 0.7 4.7
Expanded Loan Portfolio 560,538 548,294 515,635 2.2 8.7 100.0
2.3 8.8
A s o f %
June19
Without exchange variation
Variat io n %
R$ million June19 Mar19 June18
5.8 5.5
5.1
4.8
4.7 4.4 4.33 4.26
6.8 6.6 6.1
5.2
4.5 4.2 4.19 4.14 4.8 4.7
4.4 3.9
3.6 3.5 3.27 3.23 1.8 1.9 2.0
1.7 1.5 1.5 0.97
0.80
Sept17 Dec Mar18 June Sept Dec Mar19 June
%
IndividualsMicro, Small and Medium-Sized EnterprisesTotalLarge Corporates
3.7 3.5 3.2 2.9 2.6 2.6 2.5 2.5
5.6 5.5 5.4 4.7 4.5 4.2 4.0 3.9
9.9 9.9 9.6 9.0 8.8 8.6 8.8 8.6
207.7 211.4 219.3 230.0
243.4 245.3
269.2 267.2
Sept17 Dec Mar18 June Sept Dec Mar19 June
%
Net losses in 12 months
E-H Non-Performing Loans
Total Provision
Coverage Ratio over 90 Days
4,997 5,118 4,396 3,904 4,011
4,478 3,826
4,532
5,934 5,443 5,363 4,892 4,859 4,650 4,389 4,476
1.4% 1.4%
1.2%
1.0% 1.0%1.1%
0.9%
1.1%
3Q17 4Q 1Q18 2Q 3Q 4Q 1Q19 2Q
R$ million
NPL Creation - 90 days Write-offs NPL Creation - 90 days / Loan Portfolio (Bacen)

10
Press Release Independent
Auditors'
Report
Complete
Financial
Statements
Additional
Information
Economic-
Financial
Analysis
Digital in Figures
Digital Channels
In the Digital Channels, we highlight the growth in volume of the loans authorized in 1H19, mainly observing the evolutions
of the mobile channel, in which authorized loans grew 149% for companies and 87% for individuals. These evolutions relate
to the implantation of new features of this channel. These evolutions relate to the implantation of new features of this
channel, such as the discount in the anticipation of receivables product, which contributed to the growth of 89% in the
channel for companies, and the implantation of the Giro Fácil product in November 2018.
100
238
445
1H17 1H18 1H19
40%
53%
65%
77%85% 86%
60%
47% 35%23%
15% 14%
2010 2012 2014 2016 2018 1H19
Mobile and Internet Other Channels
Companies
Highlights
* Mobile Companies was launched in Sept17.
New Implantations Mobile | Individuals
Real Estate Financing
Clients(1) can now simulate and contract Real Estate Financing through the App
(1) Gradual implementation
$
Consortium Management Real Estate and Auto
In 90 days, + 3.3 Thousand quotas and R$189 Million Invoiced
Main Financial Transactions Mobile e Internet
Channel Participation
in Total Transactions
16.4 MM digital clients
Accounts were opened via
Mobile App – Individuals In thousand
Digital Account Holders
Mobile and Internet | In millions
Loans Authorized by
Mobile Channel Individuals
Loans Authorized by Product 1H19 x 1H18
Loans Authorized by Product 1H19 x 1H18
Base 100 Evolution
Personal Loans +54%
(origination of R$9.4 bi)
Discount +34%
(origination of R$9.9 bi)
1927
18
38
66
2Q18 3Q18 4Q18 1Q19 2Q19
Loans authorized in the Digital Channels - R$ billion
8.3 9.7
14.0
1H17 1H18 1H19
44.3%
16.9%
5.5
7.7
11.8
1H17 1H18 1H19
40.0%
53.2%
Payroll-deductible loans +50%
(origination of R$2.3 bi)
100
249
1H18 1H19
Advance Payment to Suppliers +73%
(origination of R$3.0 bi)
Loans Authorized by
Mobile Channel* Base 100 Evolution
Individuals C o mpanies Individuals C o mpanies Individuals C o mpanies
Transfers 81% 98% 74% 98% 66% 98%
DOC/TED( t ypes o f bank
t ransf er)
89% 98% 84% 97% 82% 97%
Payments 71% 99% 63% 99% 42% 98%
1H19 1H18 1H17Services
12.0 13.4
15.1
1.0 1.1 1.3
June17 June18 June19
Individuals Companies

11
Press Release Independent
Auditors'
Report
Complete
Financial
Statements
Additional
Information
Economic-
Financial
Analysis
Digital in Figures
Developed as a 100% stand-alone digital bank platform, whose main objective is to complement the Bradesco
Organization’s ecosystem of solutions and address a new target audience, the hyperconnected generation. Launched at the
end of 2017, within a gradual process to open the market, the growth has been quite consistent, as shown in the details
below.
Amount of Transactions
Customers Profile
Opening of New Accounts
In June 2019, next surpassed 1.1 million
active accounts on the platform and
already has clients in more than 92% of
Brazilian municipalities.
In the 2Q19, clients executed 83.5 million
transactions, a volume 36% higher than
the one performed in the previous
quarter, which shows that, in addition to
opening accounts, clients are becoming more and more engaged with next.
We launched new features to further expand the completeness of the
solutons on the platform: 2 new investment products, new functions of the
next keyboard, payment solutions by means of the QRCode and enquiries by
means of voice command using SIRI. We also have the next Mimos
(Gratuities), currently with more than 300 partners and hundreds of
exclusive offers.
BIA – Bradesco Artificial
Intelligence
83119
218
300 316
2Q18 3Q18 4Q18 1Q19 2Q19
1622
45
61
83
2Q18 3Q18 4Q18 1Q19 2Q19
Customers and Employees Service
IBM-Watson's Largest Bank implementation in the World
Leading Artificial Intelligence Bank
Multi-platform Bradesco App, Next App, WhatsApp and Google Assistant
We have reached the 144 Million mark of interactions
Operating with 87 products and services and 90% accuracy in responses
Total interactions in the quarter (in million)
+1.4 million customers have
already interacted with BIA
on WhatsApp
Total interactions on WhatsApp (in million)
158 thousand
500 thousand
800 thousand
1.1 million
+1.5 million
June18 Dec18 Mar19 June19 Dec19
Active Accounts and Projections 2019
In million
Average growth
51%
In thousand
Average growth
40%
12.2
30.8
39.0
2Q18 1Q19 2Q19
0.1
23.2
1H18 1H19

12
Press Release Independent
Auditors'
Report
Complete
Financial
Statements Additional
Information
Economic-
Financial
Analysis
This Economic and Financial Analysis Report contains forward-looking statements related to our business. Such statements are based on Management’s current expectations,
estimates and projections concerning future events and financial trends that may affect our business. However, the forward-looking statements are not guarantees of future
performance and involve risks and uncertainties that may be beyond our control. In addition, certain forward-looking statements, such as the guidance, for example, are
based on assumptions, which depending on future events, may not prove accurate. Thus, the actual results may differ significantly from the plans, objectives, expectations,
forecasts and intentions expressed or implied in such forward-looking statements. The factors that can modify the actual results include changes in business and economic
conditions, changes in interest rates, inflation, loss of the ability to capture deposits, and loss of clients or of income, among others.
Main Economic Indicators
Bradesco's Projections up to 2021
Guidance
Perspectives for 2019
(1) It includes the financial income of the operation.
Main Indicators (%) 2Q19 1Q19 2Q18 * 1H19 1H18
Interbank Deposit Certificate (CDI) 1.54 1.51 1.56 3.07 3.17
Ibovespa 5.82 8.56 (14.76) 14.88 (4.76)
USD – Commercial Rate (1.66) 0.57 16.01 (1.10) 16.56
General Market Price Index (IGP-M) 2.18 2.16 3.87 4.39 5.40
Extended Consumer Price Index (IPCA) 0.71 1.51 1.89 2.23 2.60
Business Days (#) 62 61 63 123 124
Calendar Days (#) 91 90 91 181 181
Indicators (Closing Rate)
USD – Commercial Rate (R$) 3.8322 3.8967 3.8558 3.8322 3.8558
CDS 5 years (Points) 150 180 270 150 270
Selic - Base Interest Rate (% p.a.) 6.50 6.50 6.50 6.50 6.50
BM&F Fixed Rate (% p.a.) 5.80 6.58 7.58 5.80 7.58
% 2019 2020 2021
USD - Commercial Rate (year-end) - R$ 3.80 3.80 3.87
Extended Consumer Price Index (IPCA) 3.80 3.80 3.75
General Market Price Index (IGP-M) 5.66 4.19 4.17
Selic (year-end) 5.50 5.50 7.00
Gross Domestic Product (PIB) 0.80 2.20 3.00
Realized
1H19 x 1H18
Expanded Loan Portfolio 9% to 13%9%
Net Interest Income 4% to 8% 6%
Fee and Commission Income 3% to 7% 2%
Operating Expenses
(Administrative and Personnel Expenses)0% to 4% 6%
Income from Insurance, Pension Plans and Capitalization
Bonds (1) 5% to 9% 17%
Expanded ALL - R$ billion R$ 11.5 to R$ 14.5R$ 7.1
(9% without exchange variation)
(Realized 1H19)