press release de resultado 3t18 - ri.light.com.brri.light.com.br/ptb/7491/651291.docx.pdf · 1-...
TRANSCRIPT

BM&FBOVESPA: LIGT3 Teleconferência: Fernanda Crespo (Superintendente de RI): +55 (21) 2211-4940 OTC: LGSXY Data: 13/11/2018 Marcio Loures Penna (Coordenador de RI): +55 (21) 2211-2828 Total de ações: 203.934.060 ações Horário: 14:30hs Brasil / 11:30hs US ET Camilla Gonzaga (Analista de RI): +55 (21) 2211-2728 Free Float Total: 97.629.475 ações (47,87%) Telefones: +55 (11) 2188 0155 / +1 (646) 843 6054 Regiane Abreu (Especialista de Sustentabilidade): +55 (21) 2211-2732 Valor de Mercado (30/09/18): R$ 2,6 bilhões Webcast: ri.light.com.br
Press Release de Resultado 3T18
Rio de Janeiro, 12 de novembro de 2018.
Light registra EBITDA ajustado consolidado de R$ 335 milhões no 3T18, o volume de REN registra redução de 43,2% ante o 2T18, em linha com estratégia de reequilíbrio no
combate a perdas, e DEC/FEC seguem consistente trajetória de melhoria
Destaques Financeiros e Operacionais
O EBITDA ajustado consolidado atingiu R$ 335 milhões no 3T18, registrando uma queda de 33,4% contra o mesmo período do ano anterior, tendo sido impactado principalmente pelo aumento de perdas e provisões da Distribuidora no período.
A Companhia reduziu o volume de REN para o menor patamar dos últimos 2 anos de forma a aprimorar o resultado do programa de combate a perdas. No 3T18, o volume de REN foi de 155 GWh, representando uma queda de 43,2% em comparação ao volume do 2T18.
A evolução da estratégia citada acima somada ao acordo realizado neste trimestre com a Prefeitura do Rio de Janeiro (vide seção 2.1.4), resultou na constituição de PECLD no 3T18 de R$ 89 milhões, abaixo dos valores do 1T18, de R$ 152 milhões, e do 2T18, de R$ 125 milhões. Na visão 12 meses, o indicador PECLD/ROB foi de 2,3%, 0,5 p.p. inferior ao indicador do 3T17.
O Mercado Total Faturado registrou um aumento de 2,7% em relação ao 3T17. Expurgando o efeito da REN, o mercado total no 3T18 foi de 6.300 GWh, um aumento de 4,1% contra o 3T17. Nos 9M18, mesmo com um primeiro trimestre desfavorável em razão da temperatura abaixo da média histórica para o período, o consumo total atingiu 21.072 GWh, ficando apenas 0,5% abaixo do acumulado de 2017.
O DEC (12 meses) foi de 7,67 horas no 3T18, representando uma melhora de 2,0% em relação ao 2T18 e já se encontrando 21,7% abaixo do nível pactuado com a ANEEL no contrato de concessão para final de 2018 (9,80 horas). O FEC (12 meses) também melhorou, atingindo 4,60 vezes no 3T18, queda de 2,3% em relação ao 2T18 e 23,5% abaixo do nível pactuado com a ANEEL para 2018 (6,01 vezes).
O índice de perdas totais sobre a carga fio (12 meses) em setembro de 2018 foi de 23,15%, representando um ligeiro aumento em relação ao período encerrado no 2T18 (22,98%). Com isso, a diferença para o nível regulatório incluído na tarifa (20,62%) ficou em 2,53 p.p.
A Companhia segue com sua estratégia de melhoria do perfil da dívida e, em outubro de 2018, realizou a 15ª emissão de debêntures da Light SESA, dividida em duas séries, a 1ª série no valor de R$ 540 milhões com custo IPCA + 6,83% a.a., com prazo de sete anos, e a 2ª série no valor de R$ 160 milhões com custo CDI + 2,2% a.a., com prazo de quatro anos.
O indicador de covenants Dívida Líquida/EBITDA encerrou o 3T18 em 3,57x, abaixo do limite máximo de 3,75x estabelecido contratualmente para as dívidas com covenants de manutenção. Os Bonds possuem cláusulas restritivas por incorrência de dívida, e no 3T18 a Companhia ultrapassou o limite de 3,50x, sendo obrigada a respeitar os limites de franquia para novas dívidas até reenquadrar o indicador. A dívida líquida no final do 3T18 ficou em R$ 8.139 milhões. Já o indicador de covenants EBITDA/Juros, encerrou o 3T18 em 3,62x, acima do limite mínimo de 2,00x.
1- EBITDA não é uma medida reconhecida pelo BRGAAP ou pelo IFRS e é utilizado como medida adicional de desempenho de suas operações, e não deve ser considerado isoladamente ou como uma alternativa ao Lucro Líquido ou Lucro Operacional, como indicador de desempenho operacional ou como indicador de liquidez. De acordo com a Instrução da CVM 527/2012, o EBITDA CVM apresentado é calculado a partir do lucro líquido antes do imposto de renda e contribuição social, despesas financeiras líquidas, depreciação e amortização, conforme conciliação do Anexo VII. 2- EBITDA para covenants representa o EBITDA CVM menos equivalência patrimonial, provisões e outras receitas/despesas operacionais. 3- EBITDA Ajustado representa o EBITDA CVM menos equivalência patrimonial e outras receitas/despesas operacionais. A Companhia adotou o EBITDA Ajustado para realizar as análises descritas ao decorrer deste documento.

2
Press Release de Resultado 3T18
Índice 1. Light S.A. - Consolidado .............................................................................................................................. 3
1.1. Desempenho Financeiro Consolidado ......................................................................................... 3
1.2. EBITDA Ajustado Consolidado ..................................................................................................... 4
1.3. Resultado Consolidado ................................................................................................................ 5
2. Light SESA – Distribuição ............................................................................................................................ 6
2.1. Desempenho Operacional ........................................................................................................... 6
2.1.1. Mercado ....................................................................................................................... 6
2.1.2. Balanço Energético ...................................................................................................... 9
2.1.3. Perdas de Energia Elétrica ........................................................................................... 10
2.1.4. Arrecadação ................................................................................................................. 13
2.1.5. Qualidade Operacional ................................................................................................ 15
2.2. Desempenho Financeiro .............................................................................................................. 16
2.2.1. Receita Líquida ............................................................................................................. 16
2.2.2. Custos e Despesas ........................................................................................................ 17
2.2.2.1. Custo e Despesas Não Gerenciáveis ............................................................ 17
2.2.2.2. Custos e Despesas Gerenciáveis .................................................................. 18
2.2.3. Conta de Compensação de Variação de Itens da Parcela A – CVA .............................. 19
2.2.4. Resultado Financeiro ................................................................................................... 19
3. Light Energia – Geração .............................................................................................................................. 20
3.1. Desempenho Operacional ........................................................................................................... 20
3.1.1. Compra e Venda de Energia ........................................................................................ 20
3.2 Desempenho Financeiro ............................................................................................................... 22
3.2.1. Receita Líquida ............................................................................................................. 22
3.2.2. Custos e Despesas ........................................................................................................ 22
3.2.3. Resultado Financeiro ................................................................................................... 23
3.2.4. Resultado Líquido ........................................................................................................ 23
4. Light Com – Comercialização ...................................................................................................................... 24
4.1. Desempenho Operacional ........................................................................................................... 24
4.2. Desempenho Financeiro .............................................................................................................. 24
5. Serviços ....................................................................................................................................................... 25
5.1. Desempenho Financeiro .............................................................................................................. 25
6. Endividamento Consolidado ....................................................................................................................... 26
6.1. Light S.A. ...................................................................................................................................... 26
6.2. Abertura de Endividamento ........................................................................................................ 30
7. Investimento Consolidado .......................................................................................................................... 31
8. Estrutura Acionária, Societária, e Mercado de Capitais ............................................................................ 32
9. Eventos Subsequentes ................................................................................................................................ 33
10. Programa de Divulgação ........................................................................................................................... 34
ANEXO I. Projetos de Geração ........................................................................................................................ 35
ANEXO II. Conciliação EBITDA CVM ............................................................................................................... 36
ANEXO III. DRE ................................................................................................................................................ 37
ANEXO IV. Resultado Financeiro - Light S.A. .................................................................................................. 39
ANEXO V. Balanço Patrimonial ....................................................................................................................... 40
ANEXO VI. Fluxo de Caixa ............................................................................................................................... 43

3
Press Release de Resultado 3T18
1. Light S.A - Consolidado
1.1. Desempenho Financeiro Consolidado
Para facilitar a compreensão, os percentuais de variação positivos nos quadros de resultado operacional e
financeiro indicam melhoria (i.e., aumento de receita ou queda de custos e despesas), enquanto que os
percentuais negativos indicam piora (i.e., queda de receita ou aumento de custos e despesas).

4
Press Release de Resultado 3T18
1.2. EBITDA Ajustado Consolidado4
No 3T18, o EBITDA da Distribuidora foi negativamente impactado principalmente pelo maior gap de perdas
no 3T18 quando comparado ao do 3T17 (vide seção 2.1.3) e pelo aumento de R$ 80 milhões nas provisões
em relação ao mesmo período do ano anterior (vide seção 2.2.2). O EBITDA da Geradora, apesar do nível
mais desafiador do GSF no 3T18, apresentou um aumento de R$ 11 milhões em comparação ao 3T17 em
consequência da estratégia de recomposição do hedge hidrológico por meio de compra de energia no 3T18
(vide Seções 3.1.1 e 3.2.1).
EBITDA Ajustado Consolidado
3T17 / 3T18 - R$ Milhões
EBITDA Ajustado Consolidado
9M17 / 9M18 - R$ Milhões
4 EBITDA Ajustado é calculado a partir do lucro líquido antes do imposto de renda e contribuição social, equivalência patrimonial, outras receitas/despesas operacionais,
despesas financeiras líquidas, depreciação e amortização.

5
Press Release de Resultado 3T18
1.3. Resultado Consolidado
No 3T18, o resultado consolidado da Companhia foi majoritariamente impactado pela piora do EBITDA da
Distribuidora, apesar de ter sido parcialmente compensado pela melhora no resultado financeiro no período,
de R$ 94 milhões (vide seção 2.2.4). Apesar da melhora do EBITDA da Geração no 3T18, a Geradora registrou
prejuízo líquido de R$ 47 milhões devido, principalmente ao resultado negativo de equivalência patrimonial
(vide seção 3.2.4).
Resultado Líquido Consolidado
3T17 / 3T18 - R$ Milhões
Resultado Líquido Consolidado
9M17 / 9M18 - R$ Milhões

6
Press Release de Resultado 3T18
2. Light SESA - Distribuição
2.1. Desempenho Operacional
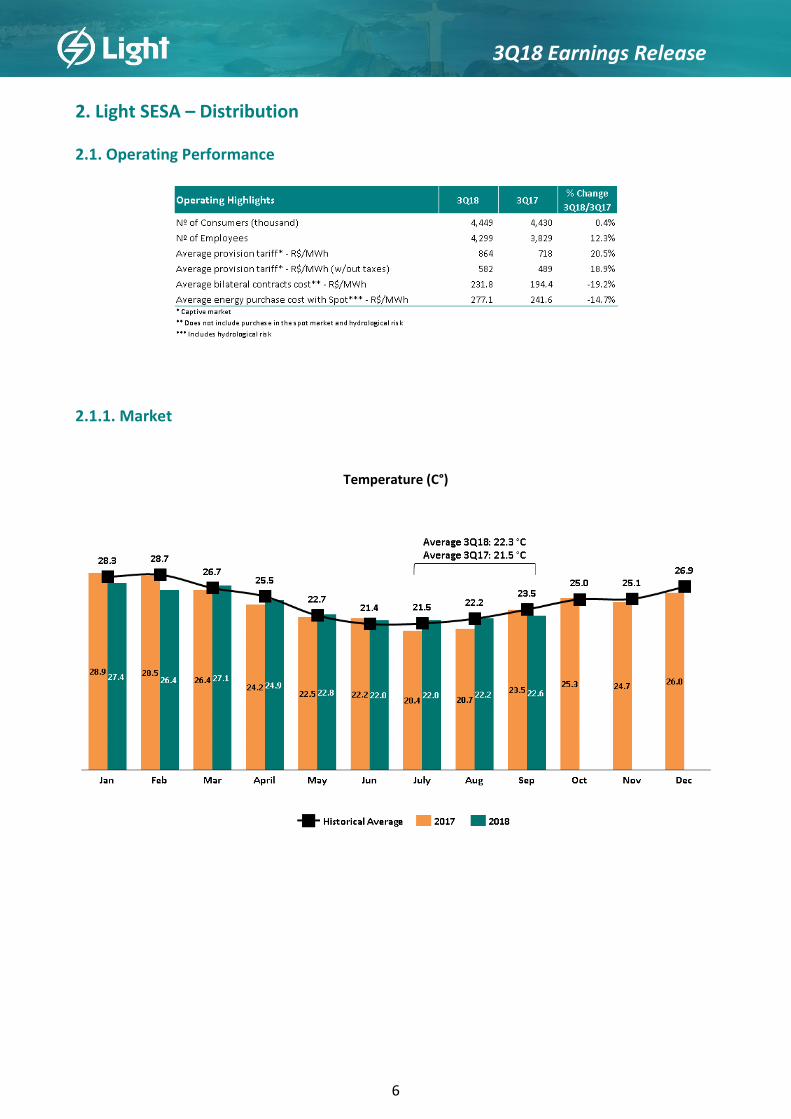
2.1.1. Mercado
Temperatura (C°)

7
Press Release de Resultado 3T18
Mercado Faturado Total (GWh)
3T18
Mercado Faturado Total (GWh)
9M18

8
Press Release de Resultado 3T18
Mercado de Energia Elétrica Mercado de Energia Elétrica
3T18 9M18
A partir do 1T18, o volume referente ao consumo das Concessionárias foi incluído na apresentação do
mercado de energia elétrica com objetivo de torná-lo similar ao que é regularmente reportado à Agência
Nacional de Energia Elétrica (ANEEL). Para efeito de análise, a base do volume retroativo (3T17) também foi
alterada.
O mercado total de energia no 3T18 foi de 6.454 GWh, representando um aumento de 2,7% em relação ao
3T17. Expurgando o efeito da REN, o mercado total de energia no 3T18 foi de 6.300 GWh, representando um
aumento de 4,1% contra os 6.055 GWh do 3T17. No acumulado de 2018, mesmo com um primeiro trimestre
negativamente atípico em razão da temperatura abaixo da média histórica para o período, o mercado total
atingiu 21.072 GWh, ficando apenas 0,5% abaixo do acumulado de 2017.
Ainda que de forma mais modesta, o mercado livre continuou seguindo sua trajetória de alta representando
26% do mercado total no 3T18 contra 25% no 3T17. Tal aumento está relacionado principalmente ao
movimento de migração de clientes cativos da classe comercial e industrial. Cabe lembrar que o movimento
migratório dos clientes do ambiente regulado para o livre não afeta a margem da Distribuidora, uma vez que
a energia continua sendo transportada pela Companhia e tais clientes pagam a TUSD à Companhia.
Já o mercado cativo, que representou 63% do mercado total no 3T18, apresentou uma redução de 68 GWh
em comparação ao mesmo período do ano anterior devido fundamentalmente à estratégia da Companhia
de reduzir o volume de REN a partir deste trimestre. Apesar da temperatura média no 3T18 ter sido 0,8 °C
superior em comparação ao mesmo período do ano anterior, a classe residencial apresentou uma redução
de 2,3% no mercado faturado entre o 3T17 e o 3T18, no entanto, desconsiderando o efeito da REN a classe
registrou crescimento de consumo de 2,5%.
O mercado da classe Comercial apresentou uma ligeira retração de 1,2% em relação ao mesmo período do
ano anterior, porém já demonstrando recuperação em relação à performance dos dois primeiros trimestres
de 2018, que haviam registrado quedas mais expressivas na comparação com os respectivos períodos de
2017.
O mercado da classe Industrial continua seguindo sua tendência de alta com a expectativa de recuperação
econômica do Rio de Janeiro: observamos um aumento de 3,4% no 3T18 em relação ao 3T17, principalmente
impulsionado pelo setor siderúrgico, que representou 64% do consumo do mercado livre nessa classe.
No 3T18 foram recuperados (REN) 155 GWh em todas as classes, contra 232 GWh no 3T17.

9
Press Release de Resultado 3T18
2.1.2. Balanço Energético
Balanço Energético de Distribuição (GWh)
Acumulado 2018

10
Press Release de Resultado 3T18
2.1.3. Perdas de Energia Elétrica
Evolução das Perdas Totais
12 Meses
Evolução do Gap entre
Perda Real e Perda Regulatória
(p.p.)

11
Press Release de Resultado 3T18
O programa de combate a perdas, além de ser medido efetivamente pelo nível de redução de perdas, é um
processo que envolve também a melhora da taxa de arrecadação e do gerenciamento da provisão esperada
para créditos de liquidação duvidosa (PECLD). Em continuidade a estratégia de combate a perdas, a
Companhia reduziu o volume de REN para o menor patamar dos últimos 2 anos e, por consequência, o
indicador de perdas sobre carga fio dos últimos 12 meses encerrados em setembro de 2018 sofreu um ligeiro
aumento para 23,15%. É importante lembrar que enquanto o volume de REN continuar sua tendência de
queda o indicador de perdas sobre carga fio deve permanecer estável.
Atualmente, a Companhia encontra-se 2,53 p.p. acima do percentual de repasse regulatório na tarifa, de
20,62%5, conforme parâmetros definidos pela Aneel na Revisão Tarifária (RTP) de março de 2017, já ajustados
pelo mercado de referência para os próximos 12 meses homologado pela ANEEL quando do reajuste tarifário
(IRT) de março de 2018.
No 3T18, o programa de perdas combateu 287 GWh - sendo 155 GWh referentes à recuperação de energia,
94 GWh à incorporação de energia (IEN) e 38 GWh à redução de carga, representando uma redução de 2%
quando comparado com os 293 GWh combatidos no 3T17 (sendo 232 GWh de REN, 41 GWh de IEN e 20
GWh de redução de carga).
Nas áreas possíveis6, as perdas não-técnicas fecharam o 3T18 em 3.331 GWh (53,1% das perdas não técnicas
da Light) e as perdas totais atingiram 16,1% da carga fio (vs 16,0% no 2T18). Já nas áreas de risco, as perdas
totais fecharam o 3T18 em 80,3% da carga fio (vs. 80,0% no 2T18).
A Companhia atualmente conta com um parque de 898 mil medidores eletrônicos instalados. Com isso, já é
possível controlar remotamente cerca de 67% do faturamento da distribuidora através do centro de controle
de medição. Este monitoramento é de fundamental importância para identificar dos alvos para inspeções,
disciplinar o mercado e evitar reincidências no furto de energia.
5 Calculado com base nos patamares de repasse de perdas fixados pela ANEEL na 4ª Revisão Tarifária Periódica (4ª RTP), homologada em 15 de março de 2017 para o
período 2017-2022, quais sejam: 6,34% de perdas técnicas sobre a carga fio e 36,06% de perdas não técnicas sobre o mercado de baixa tensão. Esse percentual pode variar ao longo do ciclo em função do desempenho do mercado de baixa tensão e da carga fio. 6 Áreas da concessão da Light onde existem condições mínimas de segurança para a operação da distribuidora.

12
Press Release de Resultado 3T18
Evolução de Perdas Não Técnicas/Mercado BT
12 Meses

13
Press Release de Resultado 3T18
2.1.4. Arrecadação
Taxa de Arrecadação por Segmento
(Considerando parcelas vencidas de REN)
Histórico da Taxa de Arrecadação Total
(Considerando parcelas vencidas de REN)
A Companhia vem apresentando melhorias contínuas no nível de arrecadação no ano de 2018. Nesse sentido,
a arrecadação total aumentou de 98,2% no 9M17 para 99,8% nos 9M18, com ganho em todos os segmentos.
No segundo gráfico também podemos visualizar essa melhora: a taxa de arrecadação de 99,1% no 3T18 foi
0,8 p.p. superior à observada no 3T17, de 98,3%. Devido à sazonalidade característica do mercado, a taxa de
arrecadação no 2T18 foi superior ao 3T18.
Cabe lembrar que o índice de arrecadação é diretamente impactado pela atual estratégia de combate a
perdas, que possui como pilar o faturamento do consumo retroativo não faturado no segmento de varejo
(residencial e comercial). Desde o trimestre anterior, a Companhia passou a reportar a taxa de arrecadação
considerando apenas as parcelas vencidas de REN, ou seja, não cabendo incluir no denominador do cálculo
parcelas de REN que ainda estavam a vencer. Nesse conceito, a taxa fica coerente com a real capacidade de
arrecadação da Companhia.

14
Press Release de Resultado 3T18
A constituição do PECLD no 3T18 foi de R$ 89 milhões (vs R$ 23 milhões no 3T17). Na visão 12 meses, o
indicador PECLD/ROB foi de 2,3%, um ligeiro aumento quando comparado ao valor registrado no 2T18 (2,0%),
mas com uma redução de 0,5 p.p. quando comparado com o 3T17.
A evolução da estratégia de combate a perdas - com a redução do volume de REN - somada ao acordo
realizado neste trimestre com a Prefeitura do Rio de Janeiro, permitiram que a PECLD do 3T18 (de R$ 89
milhões) ficasse abaixo dos valores do 1T18, de R$ 152 milhões, e do 2T18, de R$ 125 milhões.
Evolução da REN Trimestral e Últimos 12 Meses
Considerando que o faturamento de REN dentro da atual estratégia de perdas também implica em aumento
na PECLD, nas contingências judiciais (associadas à contestação de clientes) e no opex das equipes de campo,
o EBITDA marginal associado ao volume faturado de REN de R$ 857 milhões nos últimos 12 meses foi de
aproximadamente R$ 99 milhões, ou seja, cerca de 6,4% do EBITDA ajustado da Light SESA nos últimos 12
meses.
PECLD/ROB7
(Fornecimento - 12 Meses)
7 Receita Bruta do Mercado Cativo + TUSD.

15
Press Release de Resultado 3T18
2.1.5. Qualidade Operacional
DEC (horas)
12 meses
FEC (vezes)
12 meses
Os índices de qualidade continuam mantendo trajetória consistente de bons resultados em função das
melhorias operacionais e investimentos realizados ao longo dos últimos períodos. O DEC (12 meses) em
setembro de 2018 foi de 7,67 horas, representando uma melhora de 2,0% em relação a junho de 2018 e de
25,4% em relação a setembro de 2017, bem como 21,7% abaixo do limite estabelecido pela ANEEL no
Contrato de Concessão da Light para o final do ano de 2018, de 9,80 horas. O FEC (12 meses) em setembro
de 2018 foi de 4,60 vezes, o que representou uma melhora de 2,3% em relação ao resultado de junho de
2018 e de 17,0% em relação a setembro de 2017, e também 23,5% abaixo do limite estabelecido no Contrato
de Concessão para 2018, de 6,01 vezes.

16
Press Release de Resultado 3T18
2.2. Desempenho Financeiro
2.2.1. Receita Líquida8
A receita líquida, desconsiderando a receita de construção, apresentou um aumento de 9,2% (R$ 207
milhões) no 3T18 contra o 3T17, com os seguintes destaques:
Aumento de R$ 215 milhões em Energia Vendida principalmente devido ao reajuste tarifário realizado
em março de 2018.
Aumento de R$ 55 milhões no Uso da Rede (TUSD) em função da migração de clientes cativos para o
mercado livre com destaque para a forte demanda do setor siderúrgico, que permaneceu impulsionando
o consumo do segmento industrial.
Redução de R$ 44 milhões no repasse da Light SESA para a Conta CCRBT em função do novo critério de
rateio definido pela Resolução Normativa nº 826 de 13 de agosto de 2018, quando a receita faturada
com as Bandeiras Tarifárias passou a ser alocada prioritariamente na própria área de concessão.
8 Em 10 de dezembro de 2014, foi assinado o quarto termo aditivo ao contrato de concessão para distribuição pela Companhia, que assegurou o direito e o dever de que
os saldos remanescentes de eventual insuficiência ou ressarcimento pela tarifa ao término de concessão serão acrescentados ou abatidos do valor da indenização, o que permitiu o reconhecimento dos saldos de tais ativos e passivos regulatórios.

17
Press Release de Resultado 3T18
Os aumentos acima descritos foram parcialmente impactados pelo menor valor de CVA no período, de R$ 367 milhões contra R$ 453 milhões no 3T17.
2.2.2. Custos e Despesas
2.2.2.1. Custos e Despesas Não Gerenciáveis
Os custos e despesas não gerenciáveis no 3T18 aumentaram em 18,6% na comparação com o mesmo período
do ano passado. Dentre os principais desvios, é possível destacar o aumento de R$ 287 milhões entre o 3T18
e o 3T17 na rubrica de leilão de energia, que foi ocasionado principalmente pelos novos leilões com início de
suprimento em 2018, elevação da tarifa das Cotas de Garantia Física das usinas com concessão prorrogada e
correção anual dos valores da CCEARs pelo IPCA. Além disso, os custos de compra de energia derivados de
Itaipu apresentaram um aumento de R$ 44 milhões no 3T18 devido à apreciação do dólar neste período.

18
Press Release de Resultado 3T18
2.2.2.2. Custos e Despesas Gerenciáveis
Neste trimestre, os Custos e Despesas Gerenciáveis - representados por PMSO (Pessoal, Material, Serviços
de Terceiros e Outros), Provisões, Depreciação e Outras Receitas/Despesas Operacionais - totalizaram R$ 520
milhões, representando um aumento de R$ 116 milhões em relação ao 3T17.
O PMSO registrou um aumento de R$ 23 milhões em comparação ao 3T17, muito em função de um volume
mais expressivo de capitalização de mão-de-obra própria e serviços de terceiros ocorrido no 3T17, mas
também devido a maiores gastos com custas judiciais e com cobrança no 3T18.
No 3T18, houve um reconhecimento de PECLD no valor de R$ 89 milhões, abaixo da média de R$ 139 milhões
dos dois primeiros trimestres de 2018, devido principalmente à diminuição do volume de REN realizado a
partir deste período, conforme explicado no capítulo referente a arrecadação (“2.1.4. Arrecadação”), e ao
acordo com a Prefeitura do Rio de Janeiro. No entanto, a PECLD ficou R$ 66 milhões acima do 3T17, quando
o valor foi atipicamente baixo quando comparado a média histórica, principalmente em função de
renegociações de saldos vencidos ocorridas naquele período.
Vale lembrar que desde o 1T18 a Companhia adota nova metodologia para a rubrica provisões - PECLD que,
desde 1º de janeiro de 2018 substitui o modelo de “perdas incorridas” por um modelo prospectivo de “perdas
de crédito esperadas”, em linha com o IFRS 9. Essa alteração do modelo tem como objetivo reconhecer
perdas de crédito esperadas para todos os instrumentos financeiros para os quais houve aumentos
significativos no risco de crédito desde o reconhecimento inicial, avaliados de forma individual ou coletiva,
considerando todas as informações razoáveis e sustentáveis, incluindo informações prospectivas.

19
Press Release de Resultado 3T18
2.2.3. Conta de Compensação de Variação de Itens da Parcela A - CVA
;
2.2.4. Resultado Financeiro
O resultado financeiro foi negativo em R$ 124 milhões no 3T18, ante R$ 218 milhões negativos no 3T17. A
melhoria no resultado financeiro ocorreu principalmente pelo (i) ganho no resultado do swap em função da
marcação a mercado do hedge dos Bonds, decorrente do fechamento na curva futura do CDI no período; (ii)
aumento da receita com juros sobre conta de energia e parcelamento de débitos no valor de R$ 34 milhões e
(iii) aumento de receita referente a atualização de ativos e passivos financeiros do setor (CVA), no valor de
R$ 14 milhões.

20
Press Release de Resultado 3T18
3. Light Energia - Geração
3.1. Desempenho Operacional
3.1.1. Compra e Venda de Energia
No 3T18, o volume de venda de energia no ACL ficou ligeiramente inferior ao mesmo período do ano anterior.
Ao longo do 3T18 foram realizadas aquisições de energia na ordem de 162 MWm, com o objetivo de
recompor o hedge hidrológico da Light Energia que, no trimestre, ficou em aproximadamente 30%.
A Light Energia encontra-se amparada por uma decisão que a desobriga de realizar os pagamentos relativos
a eventuais exposições nas liquidações mensais da CCEE que evita o pagamento da energia no mercado spot,
protegendo seu fluxo de caixa, embora este custo seja regularmente integralmente reconhecido no
resultado. O saldo bruto do passivo provisionado em 30 de setembro de 2018, referente ao período de maio
de 2015 a junho de 2018, era de aproximadamente R$ 887 milhões (ou R$ 481 milhões, já líquidos dos valores
a receber).

21
Press Release de Resultado 3T18
GSF - Generation Scaling Factor
PLD Médio Mensal SE/CO
(R$/MWh)

22
Press Release de Resultado 3T18
3.2. Desempenho Financeiro
3.2.1. Receita Líquida
Neste trimestre houve um aumento de R$ 129 milhões na receita líquida em comparação ao mesmo período
no ano anterior, devido ao aumento da venda de energia no ACL (R$ 9 milhões) e, principalmente, ao
aumento da venda no mercado spot (R$ 119 milhões)9, associado à estratégia de aquisição de energia para
constituição de hedge.
3.2.2. Custos e Despesas
O aumento de R$ 114 milhões no total de custos e despesas no 3T18 em relação ao 3T17 ocorreu
principalmente em função de um aumento na despesa com compra de energia de R$ 119 milhões, decorrente
da estratégia de assegurar maior proteção ao longo do ano contra patamares de GSF mais desafiadores.
O preço médio de compra de energia no 3T18 foi de R$ 276/MWh contra um PLD médio de R$ 494/MWh no
período.
9 Para fins de contabilização na CCEE, no fechamento mensal utiliza-se como referência o GSF=1. No mês subsequente, a CCEE informa o ajuste necessário no
faturamento, de acordo com o GSF real apurado.

23
Press Release de Resultado 3T18
3.2.3. Resultado Financeiro
O resultado financeiro foi negativo em R$ 28 milhões no 3T18, permanecendo em linha com os R$ 27 milhões
negativos registrados no 3T17.
3.2.4. Resultado Líquido
A Light Energia, excluindo Participações, obteve um prejuízo líquido de R$ 4 milhões no 3T18, registrando
uma melhora de R$ 14 milhões em comparação ao 3T17. Incluindo o efeito da equivalência patrimonial de
Renova e Guanhães, apurou-se um prejuízo líquido de R$ 47 milhões no 3T18, ante R$ 57 milhões no mesmo
período do ano anterior.

24
Press Release de Resultado 3T18
4. Light Com - Comercialização
4.1. Desempenho Operacional
No 3T18, o volume de comercialização permaneceu em linha se comparado ao mesmo período do ano
anterior. O aumento no preço médio de venda foi causado pelo repasse da energia adquirida para
recomposição do hedge da Light Energia assim como pelo reajuste anual de preços dos contratos existentes.
4.2. Desempenho Financeiro
A redução da Margem EBITDA da Light COM ao longo do ano tem sido fundamentalmente proporcionada
pelo repasse da energia adquirida para recomposição do hedge da Light Energia. O aumento em R$ 3 milhões
no lucro líquido da Light Com entre o 3T18 e o 3T17 se deveu principalmente pelo ganho do resultado
financeiro no período.

25
Press Release de Resultado 3T18
5. Serviços10
5.1. Desempenho Financeiro
Conforme divulgado em fato relevante pela Companhia, a operação de venda da Light Esco para a Ecogen foi
concluída no dia 4 de outubro de 2018 (vide seção 9.1).
10 Contabiliza projetos em operação que não foram parte da referida venda da Light Esco para a Ecogen.

26
Press Release de Resultado 3T18
6. Endividamento
6.1. Light S.A.

27
Press Release de Resultado 3T18
A dívida líquida da Companhia no final do 3T18 foi de R$ 8.139 milhões, representando um aumento de 2,6%
em relação ao fechamento do 2T18. Esse aumento é decorrente principalmente pela saída de caixa na
formação de CVA (Ativos financeiros do setor), que no 3T18 foi de R$ 370 milhões. A Companhia continua
sua estratégia de melhora do perfil da dívida que tem como objetivos principais: (i) estender o vencimento
de empréstimos e financiamentos; (ii) reforçar a liquidez e (iii) reduzir o custo da dívida. Nesse contexto, em
outubro de 2018, a Companhia realizou a 15ª emissão de debêntures da Light SESA dividida em duas séries,
a 1ª série no valor de R$ 540 milhões com custo IPCA + 6,83% a.a., com prazo de sete anos, e a 2ª série no
valor de R$ 160 milhões com custo CDI + 2,2% a.a, com prazo de quatro anos.
Desde que iniciou o processo de refinanciamento da dívida, as seguintes operações foram concluídas:
Julho de 2017: Captação de debêntures no montante de R$ 400 milhões na Light SESA, sendo R$ 200
milhões com prazo de 18 meses e R$ 200 milhões com prazo de 3 anos;
Novembro de 2017: Captação de debêntures de infraestrutura no valor de R$ 459 milhões na Light
SESA e prazo de 5 anos;
Dezembro de 2017: Captação de Notas Promissórias no montante de R$ 400 milhões na Light SESA,
com vencimento de 13 meses;
Fevereiro de 2018: Rolagem de R$ 727 milhões junto ao Citibank, sendo R$ 632 milhões na Light SESA
e R$ 92 milhões na Light Energia, ambas com prazo de 3 anos;
Março de 2018: Rolagem de R$ 425 milhões na Light SESA junto ao Banco do Brasil, com prazo de 3
anos, sendo R$ 325 milhões desembolsados em março de 2018 e R$ 100 milhões em maio de 2018;
Maio de 2018: Emissão de US$ 600 milhões de bonds no mercado externo, sendo US$ 400 milhões
na Light SESA e US$ 200 milhões na Light Energia, já internalizados e com hedge integral para CDI
(tanto o montante do principal quanto os juros), ao custo de 142,8% do CDI;
Junho de 2018: Captação de FIDC no valor de R$ 1,4 bilhão em 2 séries (i) R$ 1,0 bilhão com custo
CDI + 1,20% a.a. e (ii) R$ 400 milhões com custo IPCA + 5,75% a.a.
Amortização dos Empréstimos, Financiamentos e Debêntures (R$ MM)
Prazo Médio: 3,2 anos
O indicador de covenants Dívida Líquida/EBITDA encerrou o 3T18 em 3,57x, devido principalmente ao
desembolso referente a CVA - que será repassado ao cliente final no reajuste tarifário de março de 2019 -,
permanecendo abaixo do limite máximo de 3,75x estabelecido contratualmente. Os bonds possuem
cláusulas restritivas por incorrência de dívida, no 3T18, a Companhia ultrapassou o limite de 3,50x do

28
Press Release de Resultado 3T18
indicador dívida líquida/EBITDA, sendo obrigada a respeitar os limites de franquia para novas dívidas até
reenquadrar o indicador.
O indicador EBITDA/Juros foi de 3,62x no 3T18, acima do limite mínimo de 2,0x estabelecido
contratualmente.
Dívida Bruta e Líquida Consolidada (R$ MM)
Indexadores da Dívida Custo da Dívida

29
Press Release de Resultado 3T18

30
Press Release de Resultado 3T18
6.2. Abertura do Endividamento
Light SESA
Amortização¹ (R$ MM) Indexadores de Dívida
Prazo Médio: 3,2 anos
Light Energia
Amortização¹ (R$ MM) Indexadores da Dívida
Prazo Médio: 3,6 anos
1- Principal de empréstimos e financiamentos e debêntures.

31
Press Release de Resultado 3T18
7. Investimento Consolidado
Abertura do Investimento da Light SESA (Distribuição e Administração)
(R$ MM)
O investimento consolidado da Companhia, excluindo os aportes, registrou um ligeiro aumento de 3,6% (R$
7 milhões) no 3T18 contra o 3T17. Os aportes ficaram em linha na comparação trimestral, mas continuam
apresentando uma forte queda no acumulado (redução de 40,1%).

32
Press Release de Resultado 3T18
8. Estrutura Acionária, Societária, e Mercado de Capitais
As ações da Light S.A. (LIGT3) estavam cotadas a R$ 12,77 ao final de setembro de 2018. O valor de mercado
da Companhia encerrou o trimestre em R$ 2,6 bilhões.

33
Press Release de Resultado 3T18
9. Eventos Subsequentes
9.1. Light Esco: Alienação da Totalidade das Ações
Em 4 de outubro de 2018, a Companhia concluiu a operação de alienação da totalidade das ações detidas no
capital social da Light Esco - Prestação de Serviços S.A., sua subsidiária integral, à Ecogen Brasil Soluções
Energéticas S.A. (“Ecogen”).
A operação foi concluída com o pagamento pela Ecogen de R$ 43 milhões à Companhia, já descontados os
saldos da dívida, após o cumprimento de todas as condições suspensivas previstas no Contrato de Compra e
Venda de Ações, incluindo a aprovação do Conselho Administrativo de Defesa Econômica – CADE, sendo
certo que em até 60 dias será preparado balanço final, oportunidade na qual eventual diferença de preço
poderá ser apurada e ajustada entre as partes.
9.2. Emissão da 15ª Debênture da Light SESA
Em 24 de outubro de 2018, foi liquidada a 15ª emissão de debêntures incentivadas, ICVM nº 400, não
conversíveis em ações, da espécie quirografária, com garantia fidejussória adicional, da controlada Light
SESA, no montante de R$ 700 milhões. A debênture foi dividida em duas séries, a 1ª série no valor de R$ 540
milhões com custo IPCA + 6,83% a.a., com prazo de sete anos, e a 2ª série no valor de R$ 160 milhões com
custo CDI + 2,2% a.a, com prazo de quatro anos.

34
Press Release de Resultado 3T18
10. Programa de Divulgação
Aviso
As informações operacionais e as referentes expectativas da Administração quanto a desempenho futuro da Companhia
não foram revisadas pelos auditores independentes. As declarações sobre eventos futuros estão sujeitas a riscos e
incertezas. Tais declarações têm como base crenças e suposições de nossa Administração e informações a que a
Companhia atualmente tem acesso. Declarações sobre eventos futuros incluem informações sobre nossas intenções,
crenças ou expectativas atuais, assim como aquelas dos membros do Conselho de Administração e Diretores da
Companhia. As ressalvas com relação às declarações e informações acerca do futuro também incluem informações sobre
resultados operacionais possíveis ou presumidos, bem como declarações que são precedidas, seguidas ou que incluem
as palavras “acredita”, “poderá”, “irá”, “continua”, “espera”, “prevê”, “pretende”, “estima” ou expressões semelhantes.
As declarações e informações sobre o futuro não são garantias de desempenho. Elas envolvem riscos, incertezas e
suposições porque se referem a eventos futuros, dependendo, portanto, de circunstâncias que poderão ocorrer ou não.
Os resultados futuros e a criação de valor para os acionistas poderão diferir de maneira significativa daqueles expressos
ou sugeridos pelas declarações com relação ao futuro. Muitos dos fatores que irão determinar estes resultados e valores
estão além da capacidade de controle ou previsão da LIGHT SA.

35
Press Release de Resultado 3T18
ANEXO I
Projetos de Geração

36
Press Release de Resultado 3T18
ANEXO II
Conciliação EBITDA CVM

37
Press Release de Resultado 3T18
ANEXO III
DRE - Light SESA

38
Press Release de Resultado 3T18
DRE - Light Energia

39
Press Release de Resultado 3T18
ANEXO IV
Resultado Financeiro - Light S.A.

40
Press Release de Resultado 3T18
ANEXO V
Balanço Patrimonial - Light S.A. (R$ milhões)

41
Press Release de Resultado 3T18
Balanço Patrimonial - Light SESA (R$ milhões)

42
Press Release de Resultado 3T18
Balanço Patrimonial - Light Energia (R$ milhões)

43
Press Release de Resultado 3T18
ANEXO VI
Fluxo de Caixa - Light S.A.

44
Press Release de Resultado 3T18
Fluxo de Caixa - Light SESA

45
Press Release de Resultado 3T18
Fluxo de Caixa - Light Energia

46
Press Release de Resultado 3T18
Lista de Abreviaturas e Siglas
ACL - Ambiente de Contratação Livre
ANEEL - Agência Nacional de Energia Elétrica
APZ - Área de Perda Zero
BNDES - Banco Nacional de Desenvolvimento Econômico e Social
CCEE - Câmara de Comercialização de Energia Elétrica
CCRBT - Conta Centralizadora de Recursos da Bandeira Tarifária
CDE - Conta de Desenvolvimento Energético
Conta-ACR - Conta no Ambiente de Contratação Regulada
CUSD - Contrato de Uso do Sistema de Distribuição
CUST - Contrato de Uso do Sistema de Transmissão
CVA - Conta de Compensação de Variação de Valores de Itens da “Parcela A”
CVM - Comissão de Valores Mobiliários
DDSD – Delegacia de Defesa dos Serviços Delegados
DEC - Duração Equivalente de Interrupção
DIC - Duração de Interrupção Individual por unidade Consumidora
DIT – Demais Instalações de Distribuição
ESS - Encargo de Serviço do Sistema
FEC - Frequência Equivalente de Interrupção
FIC - Frequência de Interrupção Individual por unidade Consumidora
GSF - Generation Scaling Factor ou Fator de ajuste da Garantia Física
O&M - Operação e Manutenção
PCH - Pequena Central Hidrelétrica
PECLD - Provisões Estimada para Crédito de Liquidação Duvidosa
PLD - Preço de Liquidação das Diferenças
PMSO - Pessoal, Material, Serviços e Outros
REN - Recuperação de Energia
TOI - Termo de Ocorrência e Inspeção
TUSD - Tarifa de Uso do Sistema de Distribuição
TUST - Tarifas de Uso do Sistema de Transmissão
UHE - Usina Hidrelétrica
UTE - Usina Térmica
VNR - Valor Novo de Reposição

BM&FBOVESPA: LIGT3 Conference Call: Fernanda Crespo (IR Superintendent): +55 (21) 2211-4940 OTC: LGSXY Date: 11/13/2018 Marcio Loures Penna (IR Coordinator): +55 (21) 2211-2828 Total shares: 203,934,060 shares Time: 2:30 pm Brazil / 11:30 am US ET Camilla Gonzaga (IR Analyst): +55 (21) 2211-2728 Total free float: 97,629,475 shares (47.87%) Phone: +55 (11) 2188 0155 / +1 (646) 843 6054 Regiane Abreu (Sustainability Specialist): +55 (21) 2211-2732 Market Cap (9/30/18): R$2.6 billion Webcast: ri.light.com.br
3Q18 Earnings Release
Rio de Janeiro, November 12, 2018.
Light records consolidated adjusted EBITDA of R$335 million in 3Q18. The volume of decreased by 43.2% compared to 2Q18, in line with the rebalancing strategy to combat
losses, and DEC/FEC continue to improve
Operating and Financial Highlights
Consolidated adjusted EBITDA totaled R$335 million in 3Q18, representing a 33.4% decrease compared to 3Q17, primarily due to the increase in losses and provisions of the Distribution company in the period.
The Company decreased the volume of REN to the lowest level in the last two years, improving the result of the program to combat losses. In 3Q18, the volume of REN totaled 155 GWh, representing a 43.2% decrease compared to 2Q18.
The evolution of the strategy mentioned above, together with the agreement entered into with the City Government of Rio de Janeiro (see section 2.1.4) in 3Q18, resulted in the establishment of PECLD of R$89 million in 3Q18, representing a decrease compared to R$152 million in 1Q18 and R$125 million in 2Q18. In the 12-month period, the PECLD/Gross Revenue ratio was 2.3%, representing a 0.5 p.p. decrease compared to 3Q17.
Total Billed Market increased by 2.7% compared to 3Q17. Excluding the effect of REN, total billed market in 3Q18 amounted to 6,300 GWh, representing a 4.1% increase compared to 3Q17. In 9M18, notwithstanding an unfavorable quarter due to temperatures below historical averages for the period, total consumption reached 21,072 GWh, representing a decrease of only 0.5% compared to 9M17.
DEC (12 months) totaled 7.67 hours in 3Q18, representing a 2.0% increase compared to 2Q18, 21.7% below the level agreed with ANEEL in the concession agreement for the end of 2018 (9.80 hours). FEC (12 months) also improved, reaching 4.60 times in 3Q18, representing a 2.3% decrease compared to 2Q18, 23.5% below the level agreed with ANEEL for 2018 (6.01 times).
In September 2018, total losses on grid load (12 months) was 23.15%, representing a slight increase compared to the period ended 2Q18 (22.98%). Accordingly, the difference from the regulatory level included in the tariff (20.62%) was 2.53 p.p.
The Company continues to implement its strategy to improve its debt profile and, in October 2018, it completed the 15th issuance of debentures of Light SESA, in two series, as follows: the 1st series in the amount of R$540 million, accruing interest at IPCA + 6.83% p.a., maturing in seven years; and the 2nd series in the amount of R$160 million, accruing interest at the CDI rate + 2.2% p.a., maturing in four years.
At the end of 3Q18, the Net Debt/EBITDA ratio was 3.57x, below the contractual maximum covenant limit of 3.75x established for debts providing for maintenance covenants. The Bonds set forth restrictions on additional debt and, in 3Q18, the Company exceeded the limit of 3.50x and was required to follow the franchise limits for additional debt until it adjusts to this ratio limit again. At the end of 3Q18, net debt totaled R$8,139 million and the EBITDA/Interest ratio was 3.62x, above the minimum limit of 2.00x.
1- EBITDA is a non-GAAP and non-IFRS financial measure used by the Company as an additional measure of operating performance. It should not be considered in isolation or as an alternative to net income or operating income or as a measure of operating performance or liquidity. CVM EBITDA is calculated in accordance with CVM Instruction 527/2012 and represents net income before income and social contribution tax, net financial expense, depreciation and amortization. A reconciliation is provided in Appendix VII. 2 – EBITDA for covenant purposes is CVM EBITDA less equity income, provisions and other operating income (expenses). 3 – Adjusted EBITDA is CVM EBITDA less equity income and other operating income (expenses). Adjusted EBITDA has been used for the analyses included in this release.

2
3Q18 Earnings Release
Table of Contents 1. Light S.A. – Consolidated ............................................................................................................................ 3
1.1. Consolidated Financial Performance ........................................................................................... 3
1.2. Consolidated Adjusted EBITDA .................................................................................................... 4
1.3. Consolidated Net Income (Loss) .................................................................................................. 5
2. Light SESA – Distribution ............................................................................................................................ 6
2.1. Operating Performance ............................................................................................................... 6
2.1.1. Market.......................................................................................................................... 6
2.1.2. Energy Balance ............................................................................................................. 9
2.1.3. Energy Losses ............................................................................................................... 10
2.1.4. Collection ..................................................................................................................... 13
2.1.5. Quality Indicators ......................................................................................................... 15
2.2. Financial Performance ................................................................................................................. 16
2.2.1. Net Revenue ................................................................................................................ 16
2.2.2. Costs and Expenses ...................................................................................................... 17
2.2.2.1. Non-Manageable Costs and Expenses ......................................................... 17
2.2.2.2. Manageable Costs and Expenses ................................................................. 18
2.2.3. “A Component” Variation Offset Account – CVA ........................................................ 19
2.2.4. Financial Result ............................................................................................................ 19
3. Light Energia – Generation ......................................................................................................................... 20
3.1. Operating Performance ............................................................................................................... 20
3.1.1. Energy Sales ................................................................................................................. 20
3.2 Financial Performance .................................................................................................................. 22
3.2.1. Net Revenue ................................................................................................................ 22
3.2.2. Costs and Expenses ...................................................................................................... 22
3.2.3. Financial Result ............................................................................................................ 23
3.2.4. Net Income (Loss) ........................................................................................................ 23
4. Light Com – Trading .................................................................................................................................... 24
4.1. Operating Performance ............................................................................................................... 24
4.2. Financial Performance ................................................................................................................. 24
5. Services ........................................................................................................................................................ 25
5.1. Financial Performance ................................................................................................................. 25
6. Consolidated Indebtedness ........................................................................................................................ 26
6.1. Light S.A. ...................................................................................................................................... 26
6.2. Debt Breakdown .......................................................................................................................... 30
7. Consolidated Capital Expenditure .............................................................................................................. 31
8. Ownership and Corporate Structure and Capital Market ......................................................................... 32
9. Subsequent Events ...................................................................................................................................... 33
10. Reporting Schedule ................................................................................................................................... 34
APPENDIX I. Generation Projects ................................................................................................................... 35
APPENDIX II. CVM EBITDA Reconciliation ...................................................................................................... 36
APPENDIX III. Income Statement ................................................................................................................... 37
APPENDIX IV. Statement of Financial Result – Light S.A. .............................................................................. 39
APPENDIX V. Statement of Financial Position ............................................................................................... 40
APPENDIX VI. Statement of Cash Flows ......................................................................................................... 43

3
3Q18 Earnings Release
1. Light S.A – Consolidated
1.1. Consolidated Financial Performance
For ease of understanding, positive percentage variations in the tables setting forth operating and financial
results indicate an improvement (i.e., an increase in income or decrease in costs and expenses), while negative
percentage variations indicate a deterioration (i.e., a decrease in income or increase in costs and expenses).

4
3Q18 Earnings Release
1.2. Consolidated Adjusted EBITDA4
In 3Q18, EBITDA of the Distribution company was negatively affected primarily due to a larger gap of losses
(see section 2.1.3) and the R$80 million increase in provisions compared to 3Q17 (see section 2.2.2). EBITDA
of the Generation company, notwithstanding a more challenging GSF level in 3Q18, increased by R$11 million
compared to 3Q17, due to the strategy to rebalance the hydrological hedge by purchasing energy in 3Q18
(see sections 3.1.1 and 3.2.1).
Consolidated Adjusted EBITDA
3Q17 / 3Q18 – R$ Million
Consolidated Adjusted EBITDA
9M17 / 9M18 – R$ Million
4 Adjusted EBITDA is calculated as net income (loss) before income tax and social contribution, equity income, other operating income (expenses), net financial result,
depreciation and amortization.

5
3Q18 Earnings Release
1.3. Consolidated Net Income (Loss)
In 3Q18, the Company’s consolidated result was primarily affected by the decrease in EBITDA of the
Distribution company, although it was partially offset by the R$94 million increase in financial result in the
period (see section 2.2.4). Notwithstanding the improvement in its EBITDA in 3Q18, the Generation segment
had net loss of R$47 million, primarily due to the negative result in equity income (see section 3.2.4).
Consolidated Net Income (Loss)
3Q17 / 3Q18 – R$ Million
Consolidated Net Income (Loss)
9M17 / 9M18 – R$ Million
6
3Q18 Earnings Release
2. Light SESA – Distribution
2.1. Operating Performance
2.1.1. Market
Temperature (C°)

7
3Q18 Earnings Release
Total Billed Market (GWh)
3Q18
Total Billed Market (GWh)
9M18

8
3Q18 Earnings Release
Energy Market Energy Market
3Q18 9M18
As of 1Q18, we started to include in the presentation of the energy market the consumption of energy of the
Concessionaires to align this volume of consumption with the volume that is regularly reported to ANEEL. For
purposes of analysis, we also adjusted the retroactive volume basis (3Q17).
In 3Q18, the total energy market amounted to 6,454 GWh, representing a 2.7% increase compared to 3Q17.
Excluding the effect of REN, the total energy market amounted to 6,300 GWh in 3Q18, representing a 4.1%
increase compared to 6,055 GWh in 3Q17. In 9M18, notwithstanding a first quarter that was negatively
atypical due to temperatures below the historical average for the period, the total energy market amounted
to 21,072 GWh, representing a decrease of only 0.5% compared to 9M17.
Although in a more modest way, the free market continued with its upward trend, accounting for 26% of the
total market in 3Q18, compared to 25% in 3Q17. This increase is primarily due to the migration of captive
customers from the commercial and industrial segments. It is worth noting that the migration of customers
from the regulated market to the free market does not affect the margin of the Distribution company, as
energy continues to be transported by the Company and these customers pay TUSD to the Company.
In 3Q18, the captive market accounted for 63% of the total market, representing a 68 GWh decrease
compared to 3Q17, primarily due to the strategy of the Company of reducing the volume of REN as of 3Q18.
Although the average temperature in 3Q18 was 0.8°C higher compared to 3Q17, the Residential segment
recorded a decrease in consumption of 2.3% in the billed market in 3Q18 compared to 3Q17. Excluding the
effect of REN, the Residential segment recorded an increase in consumption of 2.5%.
In 3Q18, the market of the Commercial segment decreased slightly by 1.2% compared to 3Q17; however, it
has already shown a recovery in performance compared to the first two quarters of 2018, when more
significant decreases were recorded compared to the same periods in 2017.
In 3Q18, the market of the Industrial segment continued with its upward trend, expecting the economic
recovery of Rio de Janeiro. In 3Q18, the Industrial segment recorded an increase in consumption of 3.4%
compared to 3Q17, primarily driven by the steel sector, which accounted for 64% of the consumption in the
Industrial segment in the free market.
In 3Q18, energy recovery (REN) totaled 155 GWh in all segments, compared to 232 GWh in 3Q17.

9
3Q18 Earnings Release
2.1.2. Energy Balance
Energy Distribution Balance (GWh)
Accumulated in 2018

10
3Q18 Earnings Release
2.1.3. Energy Losses
Changes in Total Losses
12 Months
Changes in Gap between
Actual Losses and Regulatory Losses
(p.p.)

11
3Q18 Earnings Release
2.1.3. Energy Losses
The program to combat losses is effectively assessed by the level of loss reduction. Moreover, it is a process
that also involves the improvement in collection rate and management of estimated allowance for doubtful
accounts (PECLD). In continuation of its strategy to combat losses, the Company reduced the volume of REN
to the lowest level in the last two years. Consequently, in the last 12 months ended September 2018, the
indicator of losses on grid load increased slightly to 23.15%. It is important to remember that as long as the
volume of REN continues with its downward trend, the indicator of losses on grid load should remain stable.
Currently, the Company is 2.53 p.p. above the percentage of regulatory transfer to tariffs of 20.62%5,
pursuant to the parameters established by ANEEL in the Periodic Tariff Adjustment (RTP) of March 2017,
already adjusted by the reference market for the next 12 months and ratified by ANEEL at the time of the
tariff adjustment (IRT) in March 2018.
In 3Q18, the program to combat losses avoided the loss of 287 GWh (of which 155 GWh refers to energy
recovery, 94 GWh refers to energy incorporation (IEN) and 38 GWh refers to load reduction), representing a
2% decrease compared to 293 GWh of losses avoided in 3Q17 (of which 232 GWh refers to REN, 41 GWh
refers to IEN and 20 GWh refers to load reduction).
In 3Q18, in possible areas6, non-technical losses totaled 3,331 GWh (53.1% of Light’s non-technical losses)
and total losses reached 16.1% of the grid load (compared to 16.0% in 2Q18). In 3Q18, in risk areas, total
losses reached 80.3% of the grid load (compared to 80.0% in 2Q18).
The Company currently has 898,000 installed electronic meters. Accordingly, the Company remotely controls
approximately 67% of the bills of the distribution company through the metering control center. This
monitoring is key to identify targets for inspections, discipline the market and avoid recurrent energy theft.
5 Calculated based on loss pass-through levels established by ANEEL in the 4th Periodic Tariff Revision (4th RTP), ratified on March 15, 2017 for the 2017-2022 period, as
follows: 6.34% for technical losses on the grid load and 36.06% for non-technical losses on the low voltage market. These percentages may vary during the cycle due to the performance of the low voltage market and the grid load. 6 Light’s concession areas where minimum safety conditions for the operation of the distribution company exist.

12
3Q18 Earnings Release
Changes in Non-Technical Losses/Low Voltage Market
12 Months

13
3Q18 Earnings Release
2.1.4. Collection
Collection Rate by Segment
(Considering REN overdue bills)
Historical Total Collection Rate
(Considering REN overdue bills)
The Company has been presenting continuous improvements in collection rates in 2018. Accordingly, total
collection increased from 98.2% in 9M17 to 99.8% in 9M18, including increases in all segments. The second
chart also shows this improvement: the collection rate increased by 0.8 p.p., from 98.3% in 3Q17 to 99.1% in
3Q18. Due to the seasonality that is characteristic of the market, the collection rate was higher in 2Q18
compared to 3Q18.
It is worth noting that the collection rate is directly affected by the Company’s current strategy to combat
losses, fundamentally based on the retroactive billing of unbilled consumption in the retail segment
(residential and commercial segments). Since 2Q18, the Company started to report its collection rate taking
into account only REN overdue bills, i.e., excluding from the calculation REN bills that are not yet due.
Accordingly, the collection rate is consistent with the Company’s actual collection capacity.

14
3Q18 Earnings Release
In 3Q18, PECLD totaled R$89 million (compared to R$23 million in 3Q17). In the 12-month period, the
PECLD/Gross Revenue ratio was 2.3%, representing a slight increase compared to 2.0% in 2Q18 and a 0.5 p.p.
decrease compared to 3Q17.
The evolution of the strategy to combat losses, reducing the volume of REN, together with the agreement
entered into in 3Q18 with the City Government of Rio de Janeiro, allowed a decrease in PECLD in 3Q18 (R$89
million) compared to R$152 million in 1Q18 and R$125 million in 2Q18.
Changes in REN in the Quarter and in the Last 12 Months
Considering that the billing of REN under the Company’s current strategy to combat losses also resulted in
increases in (i) PECLD, (ii) judicial contingencies (associated with customers’ questionings) and (iii) operating
expenses of field teams, marginal EBITDA, associated with a billed REN volume of R$857 million in the last 12
months, totaled approximately R$99 million, i.e., approximately 6.4% of Light SESA’s adjusted EBITDA for the
last 12 months.
PECLD/Gross Revenue7
(Supply – 12 Months)
7 Gross Revenue from the Captive Market + TUSD.

15
3Q18 Earnings Release
2.1.5. Quality Indicators
DEC (hours)
12 months
FEC (times)
12 months
Quality indicators remain consistently at good levels due to the operating improvements and investments
made in the last periods. In September 2018, DEC (12 months) was 7.67 hours, representing an improvement
of 2.0% compared to June 2018 and 25.4% compared to September 2017. In September 2018, DEC (12
months) was 21.7% below the limit of 9.80 hours established by ANEEL in Light’s Concession Agreement for
the end of 2018. In September 2018, FEC (12 months) was 4.60 times, representing an improvement of 2.3%
compared to June 2018 and 17.0% compared to September 2017. In September 2018, FEC (12 months) was
23.5% below the limit of 6.01 times established in the Concession Agreement for 2018.

16
3Q18 Earnings Release
2.2. Financial Performance
2.2.1. Net Revenue8
In 3Q18, net revenue, excluding construction revenue, increased by 9.2% (R$207 million) compared to 3Q17,
including the following highlights:
an increase of R$215 million in Energy Sold, primarily due to the tariff adjustment that occurred in March
2018;
an increase of R$55 million in Network Usage (TUSD), due to the migration of captive customers to the
free market and the especially strong demand from the steel industry, which continued to drive
consumption in the industrial segment; and
8 On December 10, 2014, the Company entered into the fourth amendment to its distribution concession agreement, pursuant to which the remaining balances of any
tariff under-collected amounts or reimbursements at the end of the concession will be added or deducted from the indemnification amount, allowing the recognition of the balances of these regulatory assets and liabilities.

17
3Q18 Earnings Release
a decrease of R$44 million in Light SESA’s transfers to the CCRBT Account, due to the new apportionment
criteria set forth by Normative Resolution No. 826, dated August 13, 2018, pursuant to which billed
revenue under Tariff Flags started to be primarily allocated in the concession area itself.
The increases described above were partially offset by a lower CVA amount in 3Q18, which totaled R$367 million, compared to R$453 million in 3Q17.
2.2.2. Costs and Expenses
2.2.2.1. Non-Manageable Costs and Expenses
In 3Q18, non-manageable costs and expenses increased by 18.6% compared to 3Q17, primarily due to: (i) the
R$287 million increase in the energy auctions line item in 3Q18, mainly as a result of new auctions, whose

18
3Q18 Earnings Release
supply began in 2018; (ii) increase in tariffs related to Physical Guarantee Quotas of power plants under
extended concession terms; and (iii) annual adjustment of CCEAR amounts based on IPCA. Moreover, the
cost of energy purchased from Itaipu increased by R$44 million in 3Q18 due to the appreciation of the U.S.
dollar in the period.
2.2.2.2. Manageable Costs and Expenses
In 3Q18, Manageable Costs and Expenses, which include PMSO (Personnel, Materials, Outsourced Services
and Others), Provisions, Depreciation and Other Operating Revenue (Expenses), totaled R$520 million,
representing an increase of R$116 million compared to 3Q17.
PMSO increased by R$23 million compared to 3Q17, primarily due to a more significant amount of
capitalization of own labor and outsourced services in 3Q17 and higher expenses with judicial costs and
collection in 3Q18.
In 3Q18, PECLD totaled R$89 million, below the R$139 million average of the first two quarters of 2018,
primarily due to the decrease in the volume of REN realized as of 3Q18, as explained in the section describing
collection (“2.1.4. Collection”), and the agreement entered into with the City Government of Rio de Janeiro.
However, PECLD increased by R$66 million in 3Q18 compared to 3Q17, when PECLD was atypically low
compared to the historical average, primarily due to renegotiations of overdue balances in that period.
It is worth noting that since 1Q18, the Company has been adopting a new method for PECLD, which, since
January 1, 2018, replaced the “incurred losses” model by an “expected credit losses” forward-looking model,
in line with IFRS 9. The purpose of this change is to recognize expected credit losses from all financial
instruments whose credit risk increased significantly since their initial recognition, assessed individually or
collectively, taking into account all reasonable and sustainable information, including forward-looking
information.

19
3Q18 Earnings Release
2.2.3. “A Component” Variation Offset Account – CVA
;
2.2.4. Financial Result
In 3Q18, net financial expenses totaled R$124 million compared to net financial expenses of R$218 million in
3Q17. This improvement is primarily due to: (i) a gain from the mark-to-market of the swap agreement that
hedged the Bonds, as a result of the closing of the CDI rate future curve in the period; (ii) the increase in
interest revenue on energy bills and installment payments of debits in the amount of R$34 million; and
(iii) the increase in revenue from the adjustment of sector assets and liabilities (CVA) in the amount of R$14
million.

20
3Q18 Earnings Release
3. Light Energia – Generation
3.1. Operating Performance
3.1.1. Energy Sales
In 3Q18, energy sales in the ACL decreased slightly compared to 3Q17.
During 3Q18, approximately 162 MWm of energy was purchased to restore Light Energia’s reserves. In 3Q18,
Light Energia’s hydrological hedge totaled approximately 30%.
Pursuant to a court decision, Light Energia does not have to make payments relating to any exposure in
monthly CCEE settlements, exempting it from making payments in the spot market and protecting its cash
flows, even though this cost is regularly fully recognized in its result. As of September 30, 2018, the gross
balance of the provision for liabilities for the period between May 2015 and June 2018 totaled approximately
R$887 million (or R$481 million, net of amounts receivable).

21
3Q18 Earnings Release
GSF – Generation Scaling Factor
Average Monthly PLD Southeast/Midwest
(R$/MWh)

22
3Q18 Earnings Release
3.2. Financial Performance
3.2.1. Net Revenue
In 3Q18, net revenue increased by R$129 million compared to 3Q17, due to the increase in the sale of energy
in the ACL (R$9 million) and primarily in the spot market (R$119 million)9, together with the strategy to
purchase energy to establish a reserve.
3.2.2. Costs and Expenses
In 3Q18, costs and expenses increased by R$114 million compared to 3Q17, primarily due to a R$119 million
increase in energy purchase expenses, as a result of the strategy to ensure higher protection during the year
against more challenging GSF levels
In 3Q18, the average price of energy purchases was R$276/MWh compared to an average PLD of
R$494/MWh in the period.
9 For purposes of CCEE accounting, GSF=1 at the closing of each month. In the subsequent month, CCEE indicates the billing adjustment required to reflect the actually
assessed GSF.

23
3Q18 Earnings Release
3.2.3. Financial Result
In 3Q18, net financial expenses totaled R$28 million, remaining in line with net financial expenses of R$27
million in 3Q17.
3.2.4. Net Income (Loss)
In 3Q18, Light Energia’s net loss, excluding equity income, totaled R$4 million, representing a R$14 million
improvement compared to 3Q17. Light Energia’s net loss, including the effect of Renova and Guanhães equity
income, totaled R$47 million in 3Q18, compared to R$57 million in 3Q17.

24
3Q18 Earnings Release
4. Light Com – Trading
4.1. Operating Performance
In 3Q18, sales volume remained stable compared to 3Q17. The increase in the average sales price was due
to the transfer of energy purchased to restore Light Energia’s reserves and the annual price adjustment under
existing contracts.
4.2. Financial Performance
The decrease in Light COM’s EBITDA Margin during the year is primarily due to the transfer of energy
purchased to restore Light Energia’s reserves. The R$3 million increase in Light Com’s net income in 3Q18
compared to 3Q17 is primarily due to the increase in financial result in the period.

25
3Q18 Earnings Release
5. Services10
5.1. Financial Performance
As disclosed by the Company in a material fact, the sale of Light Esco to Ecogen was completed on October
4, 2018 (see section 9.1).
10 Projects in operation that were not part of the mentioned sale of Light Esco to Ecogen.

26
3Q18 Earnings Release
6. Indebtedness
6.1. Light S.A.

27
3Q18 Earnings Release
At the end of 3Q18, the Company’s net debt totaled R$8,139 million, representing a 2.6% increase compared
to the Company’s net debt at the end of 2Q18. This increase is primarily due to the outflow of cash to form
CVA (sector financial assets), which totaled R$370 million in 3Q18. The Company continues to implement its
strategy to improve its indebtedness profile, primarily to: (i) extend the maturity term of loans and financing;
(ii) reinforce liquidity; and (iii) reduce the cost of debt. Accordingly, in October 2018, the Company completed
the 15th issuance of debentures of Light SESA, in two series: the 1st series, in the amount of R$540 million,
accruing interest at IPCA + 6.83% p.a., maturing in seven years; and the 2nd series, in the amount of R$160
million, accruing interest at the CDI rate + 2.2% p.a., maturing in four years.
Since the beginning of the debt refinancing process, the following transactions were completed:
July 2017: issuance of debentures in the amount of R$400 million by Light SESA, of which R$200 million matures within 18 months and R$200 million matures within three years;
November 2017: issuance of infrastructure debentures in the amount of R$459 million by Light SESA,
maturing within five years;
December 2017: issuance of Promissory Notes in the amount of R$400 million by Light SESA,
maturing within 13 months;
February 2018: debt rollover in the amount of R$727 million with Citibank, of which R$632 million corresponds to Light SESA and R$92 million corresponds to Light Energia, both maturing within three years;
March 2018: debt rollover in the amount of R$425 million by Light SESA with Banco do Brasil,
maturing within three years, of which R$325 million was disbursed in March 2018 and R$100 million
was disbursed in May 2018
May 2018: issuance of bonds in the amount of US$600 million in the foreign market, of which US$400
million was issued by Light SESA and US$200 million was issued by Light Energia. These amounts have
already been received and were fully hedged, indexed to the CDI rate (both principal and interest),
accruing interest at 142.8% of the CDI rate; and
June 2018: issuance of FIDC quotas in the amount of R$1.4 billion in two series: (i) R$1.0 billion,
accruing interest at the CDI rate + 1.20% p.a.; and (ii) R$ 400 million, accruing interest at IPCA + 5.75%
p.a.
Amortization of Loans and Financing and Debentures (R$ MM)
Average Maturity: 3.2 years
At the end of 3Q18, the Net Debt/EBITDA ratio was 3.57x, primarily due to the CVA disbursement, which will
be passed on to final customers in the tariff adjustment in March 2019, below the contractual maximum
covenant limit of 3.75x. The bonds set forth restrictions on additional debt and, in 3Q18, the Company

28
3Q18 Earnings Release
exceeded the Net Debt/EBITDA ratio limit of 3.50x and was required to follow the franchise limits for
additional debt until it adjusts this ratio limit again.
In 3Q18, EBITDA/Interest ratio was 3.62x, above the minimum contractual limit of 2.00x.
Consolidated Gross and Net Debt (R$ MM)
Debt Indices Debt Service Costs

29
3Q18 Earnings Release

30
3Q18 Earnings Release
6.2. Debt Breakdown
Light SESA
Amortization¹ (R$ MM) Debt Indices
Average Maturity: 3.2 years
Light Energia
Amortization¹ (R$ MM) Debt Indices
Average Maturity: 3.6 years
1- Principal of loans and financing and debentures.

31
3Q18 Earnings Release
7. Consolidated Capital Expenditure
Breakdown of Capital Expenditure at Light SESA (Distribution and Management)
(R$ MM)
The Company's consolidated investment, excluding contributions, increased slightly by 3.6% (R$7 million) in
3Q18 compared to 3Q17. Contributions remained stable in the quarterly comparison, but decreased
significantly in the aggregate for the year (40.1% decrease).

32
3Q18 Earnings Release
8. Ownership and Corporate Structure and Capital Market
Light S.A.’s shares (LIGT3) were priced at R$12.77 at the end of September 2018. The Company’s market
value closed the quarter at R$2.6 billion.

33
3Q18 Earnings Release
9. Subsequent Events
9.1. Light Esco: Sale of All Shares
On October 4, 2018, the Company completed the sale of all shares held in the capital stock of Light Esco –
Prestação de Serviços S.A., its wholly-owned subsidiary, to Ecogen Brasil Soluções Energéticas S.A.
(“Ecogen”).
The transaction was completed upon the payment of R$43 million by Ecogen to the Company, net of debt
balances and following the fulfillment of all conditions precedent set forth in the Share Purchase Agreement
(Contrato de Compra e Venda de Ações), including the approval by the Brazilian Antitrust Authority (Conselho
Administrativo de Defesa Econômica – CADE). Final financial information will be prepared within 60 days,
when any price difference may be assessed and adjusted between the parties.
9.2. 15th Issuance of Debentures of Light SESA
On October 24, 2018, the 15th issuance of incentivized, unsecured, non-convertible debentures of Light SESA
was completed, pursuant to ICVM No. 400, with an additional guarantee, in the amount of R$700 million.
The issuance was divided in two series: the 1st series, in the amount of R$540 million, accruing interest at
IPCA + 6.83% p.a., maturing in seven years; and the 2nd series, in the amount of R$160 million, accruing
interest at the CDI rate + 2.2% p.a., maturing in four years.

34
3Q18 Earnings Release
10. Reporting Schedule
Disclaimer
Operating information and information relating to Management’s expectations on the future performance of the
Company have not been reviewed by the independent auditors. Forward-looking statements are subject to risks and
uncertainties. These statements are based on Management’s judgment and assumptions and information currently
available to the Company. Forward-looking statements include information about our current plans, opinions or
expectations, as well as the plans, opinions or expectations of the members of the Board of Directors and Board of
Executive Officers of the Company. Forward-looking statements and information also include information about
potential or assumed results of operations, as well as statements that are preceded or followed by, or include the terms
“believe,” “may,” “will,” “continue,” “expect,” “predict,” “intend,” “estimate” or similar words. Forward-looking
statements and information are not an assurance of future performance. They involve risks, uncertainties, and
assumptions as they relate to future events and therefore are contingent on circumstances which may or may not occur.
Future results and the creation of shareholder value may differ significantly from those expressed or suggested by
forward-looking statements. Many of the factors that will determine these results and amounts are beyond the control
of or cannot be predicted by LIGHT S.A.

35
3Q18 Earnings Release
APPENDIX I
Generation Projects

36
3Q18 Earnings Release
APPENDIX II
CVM EBITDA Reconciliation

37
3Q18 Earnings Release
APPENDIX III
Income Statement – Light SESA

38
3Q18 Earnings Release
Income Statement – Light Energia

39
3Q18 Earnings Release
APPENDIX IV
Statement of Financial Result – Light S.A.

40
3Q18 Earnings Release
APPENDIX V
Statement of Financial Position – Light S.A. (R$ million)

41
3Q18 Earnings Release
Statement of Financial Position – Light SESA (R$ million)

42
3Q18 Earnings Release
Statement of Financial Position – Light Energia (R$ million)

43
3Q18 Earnings Release
APPENDIX VI
Statement of Cash Flows – Light S.A.

44
3Q18 Earnings Release
Statement of Cash Flows – Light SESA

45
3Q18 Earnings Release
Statement of Cash Flows – Light Energia

46
3Q18 Earnings Release
List of Abbreviations and Acronyms
ACL – Free Contracting Environment
ANEEL – National Electric Energy Agency
APZ – Zero Loss Area
BNDES – Brazilian Development Bank
CCEE – Brazilian Electricity Trading Chamber
CCRBT – Rate Tier Fund Account
CDE – Energy Development Account
ACR Account – Regulated Market Account
CUSD – Distribution System Utilization Agreement
CUST – Transmission System Utilization Agreement
CVA – “A Component” Variation Offsetting Account
CVM – Brazilian Securities Commission
DDSD – Delegated Services Defense Office
DEC – Equivalent Outage Duration
DIC – Individual Outage Duration per Consumer Unit
DIT – Other Distribution Facilities
ESS – System Service Charges
FEC – Equivalent Outage Frequency
FIC – Individual Outage Frequency per Consumer Unit
GSF – Generation Scaling Factor
O&M – Operation and Maintenance
PCH – Small Hydro Plant
PECLD – Estimated Allowance for Doubtful Accounts
PLD – Difference Settlement Price
PMSO – Personnel, Materials, Services and Others
REN – Energy Recovery
TOI – Inspection Report
TUSD – Distribution System Usage Charge
TUST – Transmission System Usage Charge
UHE – Hydropower Plant
UTE – Thermal Power Plant
VNR – New Replacement Value