press release - faurecia
TRANSCRIPT
1
Press release
Nanterre (France), February 22, 2021
FULL-YEAR 2020 RESULTS & 2021 GUIDANCE
• Effective and appreciated Covid-19 employee protection protocol
• Record order intake of €26bn, leading to €72bn cumulated over last three years
• Net Cash Flow above €1bn in H2, fully offsetting H1
• Strong liquidity restored above pre-crisis level
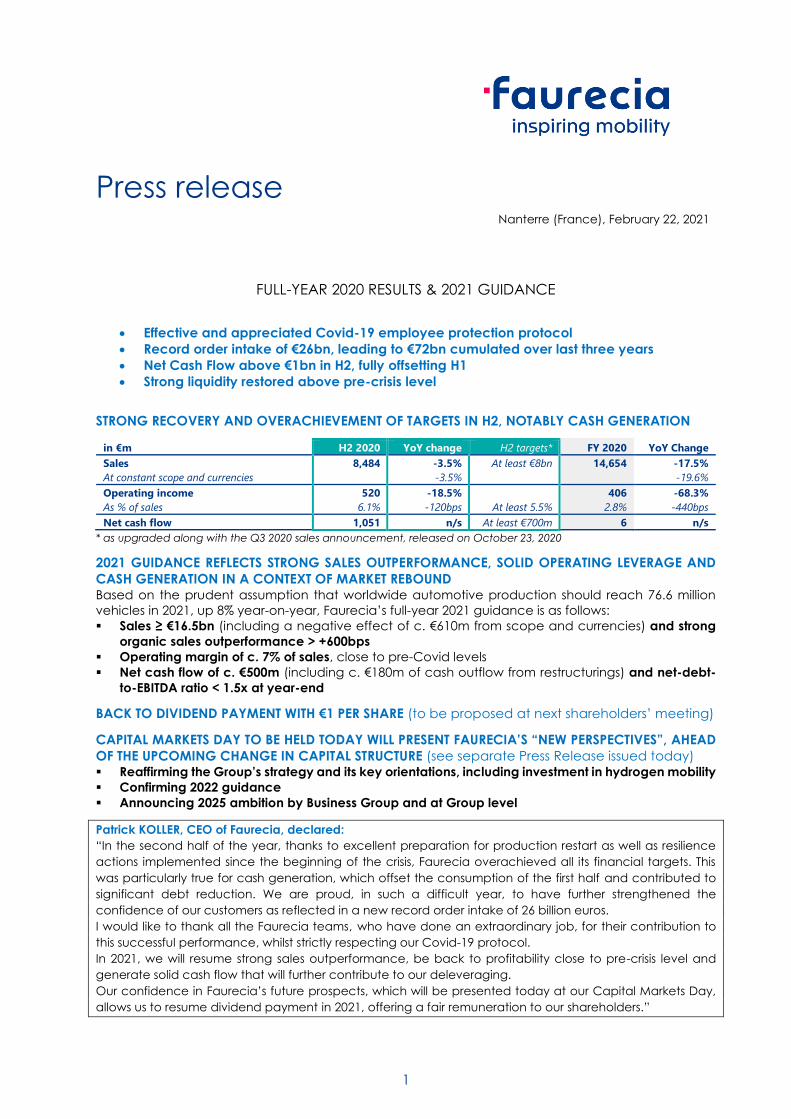
STRONG RECOVERY AND OVERACHIEVEMENT OF TARGETS IN H2, NOTABLY CASH GENERATION
in €m H2 2020 YoY change H2 targets* FY 2020 YoY Change
Sales
At constant scope and currencies
8,484 -3.5%
-3.5%
At least €8bn 14,654 -17.5%
-19.6%
Operating income
As % of sales
520
6.1%
-18.5%
-120bps
At least 5.5%
406
2.8%
-68.3%
-440bps
Net cash flow 1,051 n/s At least €700m 6 n/s
* as upgraded along with the Q3 2020 sales announcement, released on October 23, 2020
2021 GUIDANCE REFLECTS STRONG SALES OUTPERFORMANCE, SOLID OPERATING LEVERAGE AND
CASH GENERATION IN A CONTEXT OF MARKET REBOUND Based on the prudent assumption that worldwide automotive production should reach 76.6 million
vehicles in 2021, up 8% year-on-year, Faurecia’s full-year 2021 guidance is as follows:
▪ Sales ≥ €16.5bn (including a negative effect of c. €610m from scope and currencies) and strong
organic sales outperformance > +600bps
▪ Operating margin of c. 7% of sales, close to pre-Covid levels
▪ Net cash flow of c. €500m (including c. €180m of cash outflow from restructurings) and net-debt-
to-EBITDA ratio < 1.5x at year-end
BACK TO DIVIDEND PAYMENT WITH €1 PER SHARE (to be proposed at next shareholders’ meeting)
CAPITAL MARKETS DAY TO BE HELD TODAY WILL PRESENT FAURECIA’S “NEW PERSPECTIVES”, AHEAD
OF THE UPCOMING CHANGE IN CAPITAL STRUCTURE (see separate Press Release issued today) ▪ Reaffirming the Group’s strategy and its key orientations, including investment in hydrogen mobility
▪ Confirming 2022 guidance
▪ Announcing 2025 ambition by Business Group and at Group level
Patrick KOLLER, CEO of Faurecia, declared:
“In the second half of the year, thanks to excellent preparation for production restart as well as resilience
actions implemented since the beginning of the crisis, Faurecia overachieved all its financial targets. This
was particularly true for cash generation, which offset the consumption of the first half and contributed to
significant debt reduction. We are proud, in such a difficult year, to have further strengthened the
confidence of our customers as reflected in a new record order intake of 26 billion euros.
I would like to thank all the Faurecia teams, who have done an extraordinary job, for their contribution to
this successful performance, whilst strictly respecting our Covid-19 protocol.
In 2021, we will resume strong sales outperformance, be back to profitability close to pre-crisis level and
generate solid cash flow that will further contribute to our deleveraging.
Our confidence in Faurecia’s future prospects, which will be presented today at our Capital Markets Day,
allows us to resume dividend payment in 2021, offering a fair remuneration to our shareholders.”

2
Press release
• The 2020 consolidated financial statements have been approved by the Board of Directors at its meeting held
on February 19, 2021, under the chairmanship of Michel de ROSEN. These financial statements have been
audited.
• Operating income presented as Faurecia’s main performance indicator is Operating income before amortization
of intangible assets acquired in business combinations. All other definitions are explained at the end of this Press
Release, under the section “Definitions of terms used in this document”.
• All figures related to worldwide or regional automotive production refer to IHS Markit forecast dated February 16,
2021 (vehicles segment in line with CAAM for China).
STRONG IMPACT OF COVID-19 IN H1 BUT GRADUAL RECOVERY IN H2
The first half of the year was strongly impacted by the globalization of Covid-19 that heavily impacted the
automotive industry and all sectors of the economy.
Temporary shutdown of most of its customers’ production sites forced Faurecia to stop production in a large
number of its sites during the period.
In the first quarter of the year, worldwide automotive production fell by 22% to 17.2 million vehicles, mostly
impacted by China, and in the second quarter it fell by 46% to 11.5 million vehicles, mostly impacted by
Europe and North America, while China was restarting.
In this unprecedented context, Faurecia proved very agile and immediately implemented a strong action
plan to react to the crisis with three priorities:
• The first priority was the health and safety of all employees as well as the creation of the right
conditions for a safe restart of production, both managed through the very effective “Safer and
Stronger Together” protocol and the in-house production of personal protective equipment,
• The second priority was the close management of the Group’s liquidity and the protection of a
sound financial structure, which helped facing the low point at June 30 and recover financial
flexibility at year-end,
• The third priority was to deploy quick actions to further improve the Group’s resilience, which allowed
maintaining a strong operating leverage throughout the year and reduce breakeven of operations.
As from the third quarter, worldwide automotive production started to recover and worldwide automotive
production in the quarter was only 3.7% down vs. the third quarter of 2019 (19.5 million vehicles), while in the
fourth quarter it was even up 2.9% vs. the last quarter of 2019 (22.4 million vehicles).
The graph below shows Faurecia’s organic sales evolution by quarter:

3
Press release
Faurecia’s sales evolution reflected that of worldwide automotive production by quarter. It is worth
mentioning that Group product sales (i.e. excluding tooling and prototype sales) were up 2% in Q4 2020 on
an organic basis.
NEW RECORD ORDER INTAKE OF €26bn DESPITE THE CONTEXT
Despite the Covid-19 context, Faurecia continued to increase customer satisfaction, thanks to its Total
Customer Satisfaction program.
A new record intake of €26 billion in 2020 leads to a combined amount of €72 billion over the last three years
(2018-2020), representing continued market share gains and securing future profitable growth prospects.
New business awards, with high profitability, including:
• €2.5 billion for Clarion Electronics, significantly higher than the €2.1bn initially targeted, thus
demonstrating the strong potential for this Business Group,
• 20% for China, reflecting continued strong growth potential of the Chinese market.
OTHER KEY 2020 ACHIEVEMENTS
In 2020, Faurecia continued to deploy its strategy and among its main achievements of the year were:
• Successful integration of SAS Interior Modules: SAS Interior Modules (now 100%-owned by Faurecia)
has been integrated and consolidated since January 30, 2020 within the Interiors Business Group
• Acquisition of IRYStec: the Canadian start-up has developed the world’s first software platform using
perception and physiology to optimize the user experience of display systems while saving energy.
It is already in serial production on several Daimler vehicles
• New joint ventures with Xuyang and BAIC in China: the JV with Xuyang marks another milestone in
the production, assembly and sales of automotive display products, as well as relevant after-sales
services for OEMs, while the JV with BAIC further strengthens Faurecia’s Seating operations with
Hyundai-Kia and Daimler globally as well as BAIC own brands in China (the joint venture employs
450 people and operates 4 plants in Beijing, Chongqing, Huanghua and Xiangtan)
• Acceleration of hydrogen mobility solutions with, in particular, the creation of a global center of
expertise for Hydrogen Storage Systems in Bavans (France) and, in early 2021, the acquisition of CLD,
one of China’s largest high-pressure tank manufacturers
Faurecia also accelerated its carbon neutrality program and sustainability initiatives:
• Faurecia’s Carbon Neutrality program received the approval of SBTi,
• A partnership was signed with Schneider Electric to support the Group’s commitment to reach CO2
neutrality on scopes 1 & 2 by 2025,
• Faurecia’s sustainable purchasing strategy was recognized by EcoVadis,
• Faurecia ranked 42nd in the Wall Street Journal 100 World’s Most Sustainably Managed Companies.
Another priority for Faurecia is to enhance gender diversity, targeting 30% female managers and
professionals and 24% of females in the top 300 by 2025.
In addition, Faurecia’s commitment to employee engagement and talent development was strengthened
through an increasingly robust learning organization to support its transformation and the decision to
maintain 1,000 young graduates/VIEs and apprentices in France, among other initiatives. The latest
Employee Engagement Survey showed a significant improvement of 12 points in rating to reach 76%.
Lastly, the Group launched the Faurecia Foundation to support initiatives on education, mobility and
environment.
4
Press release
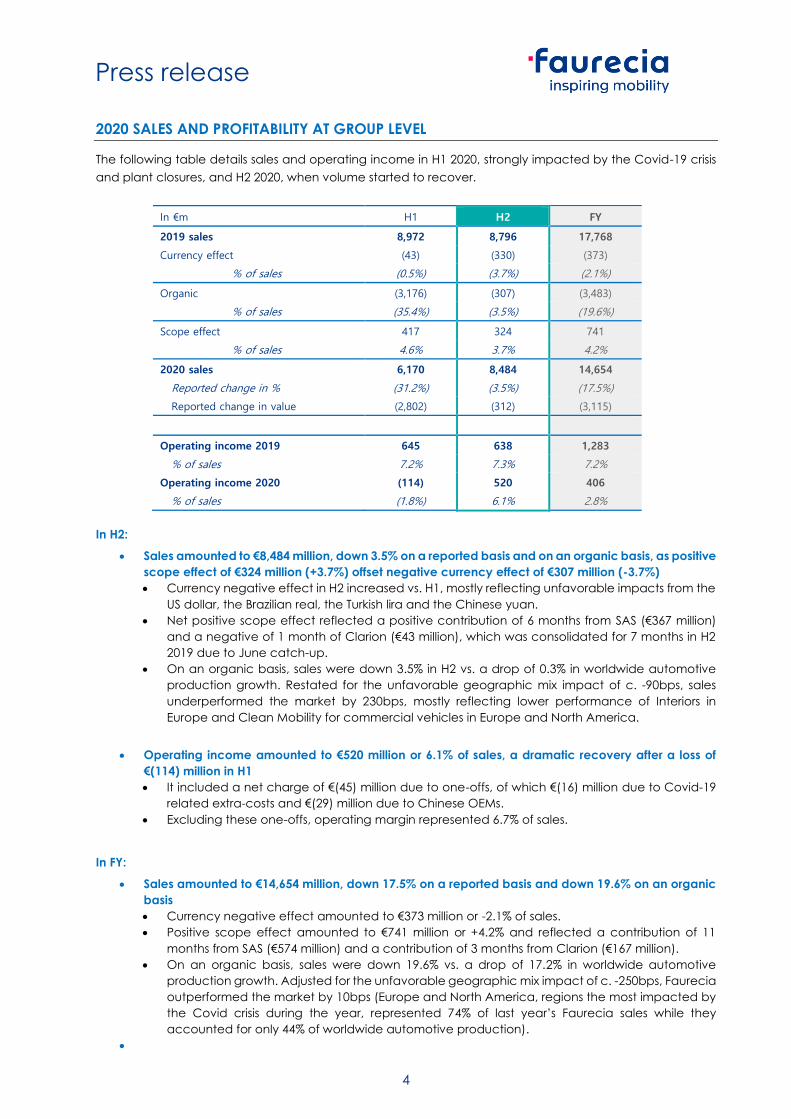
2020 SALES AND PROFITABILITY AT GROUP LEVEL
The following table details sales and operating income in H1 2020, strongly impacted by the Covid-19 crisis
and plant closures, and H2 2020, when volume started to recover.
In €m H1 H2 FY
2019 sales 8,972 8,796 17,768
Currency effect (43) (330) (373)
% of sales (0.5%) (3.7%) (2.1%)
Organic (3,176) (307) (3,483)
% of sales (35.4%) (3.5%) (19.6%)
Scope effect 417 324 741
% of sales 4.6% 3.7% 4.2%
2020 sales 6,170 8,484 14,654
Reported change in % (31.2%) (3.5%) (17.5%)
Reported change in value (2,802) (312) (3,115)
Operating income 2019 645 638 1,283
% of sales 7.2% 7.3% 7.2%
Operating income 2020 (114) 520 406
% of sales (1.8%) 6.1% 2.8%
In H2:
• Sales amounted to €8,484 million, down 3.5% on a reported basis and on an organic basis, as positive
scope effect of €324 million (+3.7%) offset negative currency effect of €307 million (-3.7%)
• Currency negative effect in H2 increased vs. H1, mostly reflecting unfavorable impacts from the
US dollar, the Brazilian real, the Turkish lira and the Chinese yuan.
• Net positive scope effect reflected a positive contribution of 6 months from SAS (€367 million)
and a negative of 1 month of Clarion (€43 million), which was consolidated for 7 months in H2
2019 due to June catch-up.
• On an organic basis, sales were down 3.5% in H2 vs. a drop of 0.3% in worldwide automotive
production growth. Restated for the unfavorable geographic mix impact of c. -90bps, sales
underperformed the market by 230bps, mostly reflecting lower performance of Interiors in
Europe and Clean Mobility for commercial vehicles in Europe and North America.
• Operating income amounted to €520 million or 6.1% of sales, a dramatic recovery after a loss of
€(114) million in H1
• It included a net charge of €(45) million due to one-offs, of which €(16) million due to Covid-19
related extra-costs and €(29) million due to Chinese OEMs.
• Excluding these one-offs, operating margin represented 6.7% of sales.
In FY:
• Sales amounted to €14,654 million, down 17.5% on a reported basis and down 19.6% on an organic
basis
• Currency negative effect amounted to €373 million or -2.1% of sales.
• Positive scope effect amounted to €741 million or +4.2% and reflected a contribution of 11
months from SAS (€574 million) and a contribution of 3 months from Clarion (€167 million).
• On an organic basis, sales were down 19.6% vs. a drop of 17.2% in worldwide automotive
production growth. Adjusted for the unfavorable geographic mix impact of c. -250bps, Faurecia
outperformed the market by 10bps (Europe and North America, regions the most impacted by
the Covid crisis during the year, represented 74% of last year’s Faurecia sales while they
accounted for only 44% of worldwide automotive production).
•
5
Press release
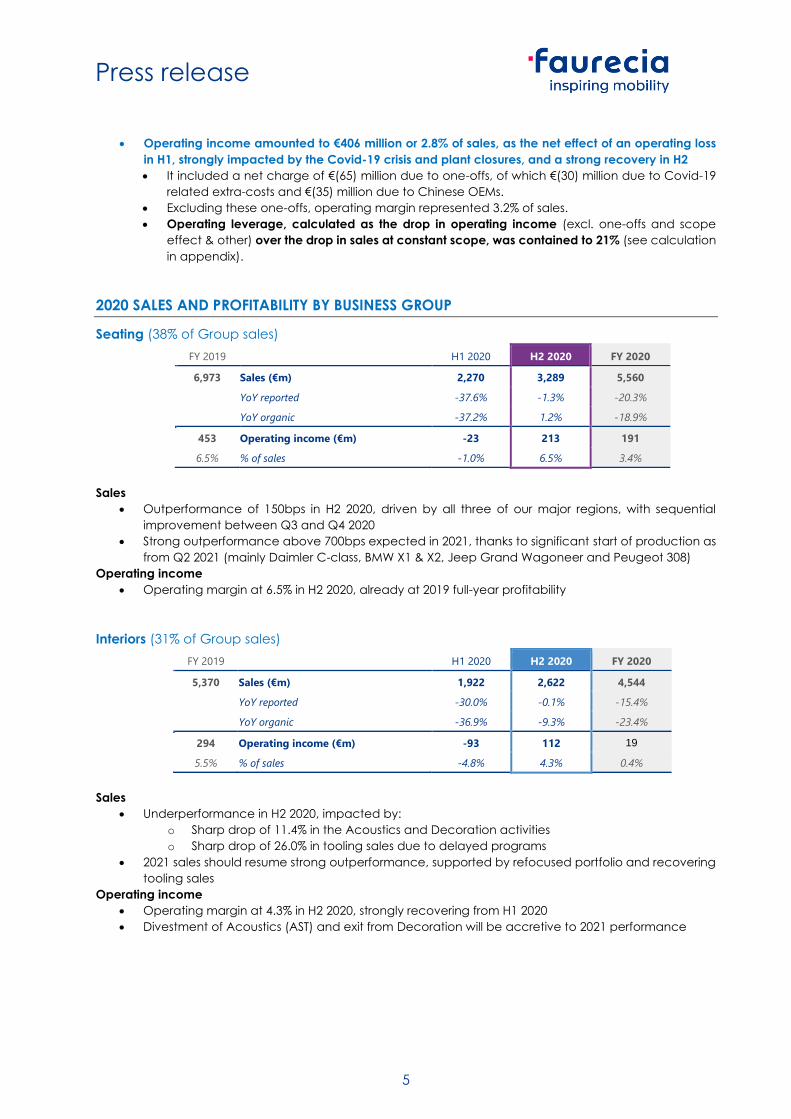
• Operating income amounted to €406 million or 2.8% of sales, as the net effect of an operating loss
in H1, strongly impacted by the Covid-19 crisis and plant closures, and a strong recovery in H2
• It included a net charge of €(65) million due to one-offs, of which €(30) million due to Covid-19
related extra-costs and €(35) million due to Chinese OEMs.
• Excluding these one-offs, operating margin represented 3.2% of sales.
• Operating leverage, calculated as the drop in operating income (excl. one-offs and scope
effect & other) over the drop in sales at constant scope, was contained to 21% (see calculation
in appendix).
2020 SALES AND PROFITABILITY BY BUSINESS GROUP
Seating (38% of Group sales)
FY 2019 H1 2020 H2 2020 FY 2020
6,973 Sales (€m) 2,270 3,289 5,560
YoY reported -37.6% -1.3% -20.3%
YoY organic -37.2% 1.2% -18.9%
453 Operating income (€m) -23 213 191
6.5% % of sales -1.0% 6.5% 3.4%
Sales
• Outperformance of 150bps in H2 2020, driven by all three of our major regions, with sequential
improvement between Q3 and Q4 2020
• Strong outperformance above 700bps expected in 2021, thanks to significant start of production as
from Q2 2021 (mainly Daimler C-class, BMW X1 & X2, Jeep Grand Wagoneer and Peugeot 308)
Operating income
• Operating margin at 6.5% in H2 2020, already at 2019 full-year profitability
Interiors (31% of Group sales)
FY 2019 H1 2020 H2 2020 FY 2020
5,370 Sales (€m) 1,922 2,622 4,544
YoY reported -30.0% -0.1% -15.4%
YoY organic -36.9% -9.3% -23.4%
294 Operating income (€m) -93 112 19
5.5% % of sales -4.8% 4.3% 0.4%
Sales
• Underperformance in H2 2020, impacted by:
o Sharp drop of 11.4% in the Acoustics and Decoration activities
o Sharp drop of 26.0% in tooling sales due to delayed programs
• 2021 sales should resume strong outperformance, supported by refocused portfolio and recovering
tooling sales
Operating income
• Operating margin at 4.3% in H2 2020, strongly recovering from H1 2020
• Divestment of Acoustics (AST) and exit from Decoration will be accretive to 2021 performance

6
Press release
Clean Mobility (26% of Group sales)
FY 2019 H1 2020 H2 2020 FY 2020
4,654 Sales (€m) 1,647 2,177 3,823
YoY reported -30.0% -5.4% -17.8%
YoY organic -29.5% -0.8% -15.3%
525 Operating income (€m) 10 191 201
11.3% % of sales 0.6% 8.8% 5.3%
Sales
• Performance broadly in line with the market (-50bps) in H2 2020
o Double-digit sales growth in China
o Drop in sales of commercial vehicles in Europe and North America, in line with regional
trends for this market segment
• 2021 sales should resume strong outperformance, supported by rebound in commercial vehicles
and increasing share of electrified vehicles
Operating income
• Operating margin at 8.8% in H2 2020, strongly recovering from H1 2020
Clarion Electronics (5% of Group sales)
FY 2019
(9 months) H1 2020 H2 2020 FY 2020
771 Sales (€m) 331 396 727
YoY reported 41.0% -26.2% -5.8%
YoY organic -49.4% -15.7% -26.0%
12 Operating income (€m) -9 4 -5
1.5% % of sales -2.7% 1.0% -0.7%
Sales
• Underperformance in H2 2020 similar with H1 2020, continuing to be strongly impacted by Nissan,
Clarion’s major customer
• Strong sales growth as from 2021, supported by:
o Focused portfolio on three product lines
o Commercial momentum reflected in 2020 order intake of €2.5bn
Operating income
• Back to profit in H2 2020, already benefiting from aggressive roadmap for cost competitiveness
• Excluding integration costs of €5 million, FY 2020 operating income was at breakeven
2020 SALES AND PROFITABILITY BY REGION
Europe (47% of Group sales)
FY 2019 H1 2020 H2 2020 FY 2020
8,641 Sales (€m) 3,027 3,945 6,972
YoY reported -33.2% -4.0% -19.3%
YoY organic -36.1% -7.5% -22.5%
558 Operating income (€m) -113 186 73
6.5% % of sales -3.7% 4.7% 1.0%
Sales
• Sales underperformance in H2 2020 reflected:
o Underperformance of Interiors, already commented
o Double-digit drop in sales for Clean Mobility Commercial Vehicles

7
Press release
Operating income
• Operating margin at 4.7% in H2 2020, still impacted by losses in Acoustics and Decoration activities
(Interiors)
North America (25% of Group sales)
FY 2019 H1 2020 H2 2020 FY 2020
4,483 Sales (€m) 1,475 2,157 3,632
YoY reported -35.6% -1.7% -19.0%
YoY organic -41.7% -1.8% -22.2%
283 Operating income (€m) -84 117 33
6.3% % of sales -5.7% 5.4% 0.9%
Sales
• Sales underperformance in H2 2020 (limited to 70bps in Q4) reflected:
o Double-digit drop in sales for Clean Mobility Commercial Vehicles
o Double-digit drop in sales for Clarion Electronics (Nissan)
Operating income
• Operating margin at 5.4% in H2 2020, close to H2 2019 profitability (5.9%)
Asia (24% of Group sales)
FY 2019 H1 2020 H2 2020 FY 2020
3,766 Sales (€m) 1,470 2,058 3,528
YoY reported -14.3% 0.4% -6.3%
YoY organic -23.2% 2.8% -9.1%
374 Operating income (€m) 101 208 308
9.9% % of sales 6.8% 10.1% 8.7%
Sales
• Outperformance of 150bps in Asia and 470bps in China in H2 2020
• Sales of €1.5 billion in China in H2 2020, up 11.2% on an organic basis, driven by Seating and Clean
Mobility with strong sales to international OEMs, new customers and commercial vehicles
Operating income
• Operating margin already back to double-digit figure in H2 2020, at 10.1% of sales
South America (3% of Group sales)
FY 2019 H1 2020 H2 2020 FY 2020
696 Sales (€m) 157 242 398
YoY reported -54.6% -31.3% -42.8%
YoY organic -42.1% -6.8% -24.2%
47.9 Operating income (€m) -14 8 -6
6.9% % of sales -8.8% 3.4% -1.4%
Sales
• Outperformance of 460bps in H2 2020: Brazil (c. 90% of sales in the region) organic sales were down
7.4% while Argentina organic sales were down 1.5%
Operating income
• Back to profit in H2 2020
• 2019 operating income included a €16 million profit from tax recovery in Brazil (PIS-Cofins)
BACK TO PROFIT IN H2 AT €54 MILLION, DESPITE INCREASED RESTRUCTURING EXPENSE

8
Press release
FULL-YEAR NET INCOME (Group share) POSTED A LOSS OF €379 MILLION
Group operating income stood at €406 million, vs. €1,283 million in 2019.
• Amortization of intangible assets acquired in business combinations: net charge of €92 million vs. a
net charge of €56 million in 2019; the increase mainly reflected Clarion Electronics for €53 million and
SAS (11 months) for €26 million.
• Restructuring costs: net charge of €286 million vs. a net charge of €194 million in 2019; the increase
reflected the measures taken to face the crisis. Restructuring costs should gradually reduce to reach
c. 120 million euros in 2021 and a normalized level of 80 to 100 million euros as from 2022.
• Other non-recurring operating income and expenses: net profit of €9 million vs. a net charge of €20
million in 2019; they included:
o A profit of €178 million due to the reevaluation of the initial 50% stake held in SAS,
o A charge of €150 million due to goodwill impairment of Clarion Electronics.
• Net financial result: net charge of €223 million vs. a net charge of €219 million in 2019.
• Income tax: net charge of €123 million vs. a net charge of €167 million in 2019; it included a charge
of €55 million due to taxation of strong results in China.
• Share of net income of associates: charge of €13 million vs. a profit of €38 million in 2019; 2019
included a positive contribution of €19 million from SAS, while 2020 included a negative contribution
of €17 million from Symbio.
Net income before minority interests was a loss of €321 million vs. a profit of €665 million in 2019.
Minority interests amounted to €57 million vs. €75 million in 2019.
Net income (Group share) was a loss of €379 million vs. a profit of €590 million in 2019.
NET CASH FLOW OF €6 MILLION, WITH STRONG CASH GENERATION IN H2 OF €1.1 BILLION
THAT OFFSET CASH CONSUMPTION IN H1
SIGNIFICANT DEBT REDUCTION AT DECEMBER 31 VS. JUNE 30 AND DELEVERAGING
REFLECTED IN NET-DEBT-TO-EBITDA RATIO IMPROVEMENT
STRONG LIQUIDITY RESTORED ABOVE PRE-CRISIS LEVEL
EBITDA stood at €1,679 million, vs. €2,404 million in 2019 reflected the drop of €877 million in operating
income, mitigated by higher depreciation and amortization. In H2 2020, EBITDA margin represented 13.8% of
sales compared to an EBITDA margin of 13.5% in the full-year 2019.
• Capital expenditure was contained to an outflow of €479 million vs. an outflow of €685 million in 2019.
In 2021, capital expenditure should be below €600 million.
• Capitalized R&D was an outflow of €619 million vs. an outflow of €681 million in 2019.
Capex reduced by 30.1% and capitalized R&D reduced by 9.1% reflected lower activity and
flexibilization actions.
• Change in working capital requirement was an outflow of €95 million vs. an inflow of €166 million in
2019; change in working capital requirement inflow of €552 million in H2 largely offset the €647 million
outflow in H1.
• In addition to change in working capital requirement, factoring of receivables was increased by €38
million vs. the end of 2019; factoring of receivables was back to a normalized level of c. €1bn (€972
million) at year-end.
• Restructuring represented an outflow of €125 million vs. an outflow of €166 million in 2019. In 2021,
the cash outflow from restructurings should amount to c. €180 million.
• Net financial expense was an outflow of €210 million vs. an outflow of €197 million in 2019; it reflected
the debt increase and one-offs related to actions taken during the crisis to protect liquidity.
• Income tax was an outflow of €197 million vs. an outflow of €296 million in 2019.
• Other operational items represented an inflow of €15 million vs. an inflow of €99 million in 2019. In
2019, they included the sale of Clarion’s HQ in Saitama for €110m (no P&L impact).
Net cash flow stood at €6 million, vs. €587 million in 2019; strong net cash flow of €1,051 million in H2 offset
the cash consumption of €1,045 million in H1.

9
Press release
• Dividend paid (incl. minorities) was an outflow of €35 million vs. an outflow of €212 million in 2019. In
2020, this amount only represented dividend paid to minority interests, as no dividend to
shareholders was paid due to the extraordinary context of the Covid-19 crisis.
• Share purchase was an inflow of €1 million vs. an outflow of €29 million in 2019.
• Net financial investments and other cash elements was an outflow of €364 million vs. an outflow of
€1,486 million in 2019; it mainly included the investment (50%) in SAS, while 2019 included the
acquisition of Clarion.
After a negative impact of €211 million related to IFRS16, the Group’s net financial debt stood at €3,128 million
at June 30 (vs. €2,524 million at December 31, 2019).
Net-debt-to-EBITDA ratio stood at 1.9x EBITDA at December 31, 2020 vs. 1.1x at December 31, 2019. The ratio
at year-end 2020 reflected a strong deleveraging in the second half of the year: at June 30, 2020, it stood a
2.3x.
At year-end, liquidity amounted to €4.3 billion, of which available cash for €3.1 billion and undrawn
Syndicated Credit Facility (SCF) for €1.2 billion.
This compares to €3.5 billion at December 31, 2019 (€2.3 billion available cash and €1.2 billion SCF) and €3.1
billion at June 30, 2020 (€2.5 billion available cash and €0.6 billion SCF).
PROPOSED DIVIDEND OF €1 PER SHARE REFLECTS CONFIDENCE IN PROFITABLE GROWTH
PROSPECTS
The Board of Directors will propose at the next Annual Shareholders’ Meeting, to be held in Paris on May 31,
the payment of a dividend of €1 per share. It will be paid in cash in June.
The decision to return to paying a dividend in 2021 reflects Faurecia’s confidence in profitable growth and
cash generation prospects, as they will be detailed during today’s Capital Markets Day.
It also reflects Faurecia’s strategy to resume a sustainable and progressive dividend path, consistent with
historical practices, and offer a fair and attractive remuneration to shareholders.
2021 GUIDANCE REFLECTS STRONG OPERATING LEVERAGE AND SOLID CASH FLOW
GENERATION
Faurecia expects worldwide automotive production to rebound to 76.6 million vehicles in 2021, up 8% vs.
2020.
This assumption is more conservative than IHS Markit forecast (dated February 2021) of 80.9 million vehicles,
as there are uncertainties in H1 2021, mainly related to Covid variants as well as electronic components
shortage, even if this could be caught up in H2 2021.
Based on this assumption that worldwide automotive production should reach 76.6 million vehicles in 2021,
Faurecia’s financial targets for the year are:
• Sales of at least €16.5 billion and sales outperformance > +600bps; the sales target includes c. €(610)
million negative effect, of which c. €(130) million from scope (a positive effect of €60 million from
one month of SAS and a negative effect of €190 million from the divestment of AST Acoustics) and
c. €(480) million from currencies
• Operating margin of c. 7% of sales, close to pre-Covid levels
• Net cash flow of c. €500 million and net-debt-to-EBITDA ratio < 1.5x at year-end; this target takes into
account a cash outflow of c. €180 million from restructurings
Faurecia’s assumption of 2021 worldwide automotive production assumes no major lockdown impacting
production or retail sales in any automotive region during the year.
All financial targets are based on 2021 average currency rates of 1.18 for USD/€ and 8.15 for CNY/€.

10
Press release
CAPITAL MARKETS DAY TO BE HELD TODAY OUTLINING FAURECIA’S “NEW PERSPECTIVES”,
AHEAD OF THE UPCOMING CHANGE IN CAPITAL STRUCTURE (see separate Press Release issued today)
Today at 1:30pm (CET), Faurecia will hold a Capital Markets Day (CMD).
This event will be webcasted and the Capital Markets Day can be followed through the following link:
https://channel.royalcast.com/faurecia-en/#!/faurecia-en/20210222_2
A specific Press Release was issued this morning that details the main takeaways of the CMD.
It will provide an overview of the strategy and mid-term perspectives for the Group and each of its Business
Groups as well as demonstrate the Group’s strong potential for value creation over the medium term.
Financial targets for 2022 are confirmed (based on an assumption of worldwide automotive production of
82.3 million vehicles and at constant 2021 scope and currencies):
• Sales of at least €18.5 billion
• Operating margin of 8% of sales
• Net cash flow of 4% of sales, representing c. €750 million
Faurecia will also present its 2025 ambition (based on an assumption of worldwide automotive production
of 90.9 million vehicles and at constant 2021 scope and currencies):
• Sales of at least €24.5 billion
• Operating margin above 8% of sales
• Net cash flow close to 4.5% of sales, representing c. €1.1billion
Over the five-year period (2021 to 2025):
• Organic sales CAGR will be of c. 11% and sales average annual outperformance will exceed
+500bps
• Cumulated net cash flow will exceed €4 billion driving continuous deleveraging
UPDATE ON THE DISTRIBUTION OF FAURECIA SHARES BY STELLANTIS
The completion of the FCA and Groupe PSA merger, effective since 16 January 2021, has given rise to the
new Stellantis group, which is now Faurecia’s main shareholder.
As part of the merger process, Stellantis will distribute in kind to its shareholders its Faurecia shares representing
c. 39% of the capital of the company.
Stellantis has announced that an extraordinary general meeting will take place on 8 March 2021 to approve
the distribution.
This distribution opens a new chapter for Faurecia: it will increase its free float (up to c. 85%), improve its
capital market profile and allow it to affirm its business strategy as an independent company.

11
Press release
Faurecia's financial presentation and financial report will be available at 8:30am today (Paris time) on the
Faurecia website: www.faurecia.com
A webcast will be held today at 9:00am (Paris time). If you wish to follow the presentation using the webcast,
please access the following link: https://channel.royalcast.com/faurecia-en/#!/faurecia-en/20210222_1
A replay will be available as soon as possible.
You may also follow the presentation via conference call:
• France: +33 (0)1 76 77 28 19
• United Kingdom: +44 (0)330 336 9411
• United States: +1 323-794-2093
Confirmation code: 8109503
Financial calendar
February 22, 2021: Capital Markets Day, at 1:30pm CET
April 19, 2021: Q1 2021 Sales (before market hours)
May 31, 2021: Annual Shareholders’ Meeting
July 26, 2021: H1 2021 Results (before market hours)
October 26, 2021: Q3 2021 sales (before market hours)
About Faurecia
Founded in 1997, Faurecia has grown to become a major player in the global automotive industry. With 266 industrial sites,
39 R&D centers and 114,500 employees in 35 countries, Faurecia is a global leader in its four areas of business: Seating,
Interiors, Clarion Electronics and Clean Mobility. Faurecia has focused its technology strategy on providing solutions for
the “Cockpit of the Future” and “Sustainable Mobility”. In 2020, the Group posted sales of €14.7 billion. Faurecia is listed
on the Euronext Paris stock exchange. For more information, please visit www.faurecia.com
Contacts
Press
Eric FOHLEN-WEILL
Head of Corporate Communications
Tel: +33 (0)1 72 36 72 58
Analysts/Investors
Marc MAILLET
Head of Investor Relations
Tel: +33 (0)1 72 36 75 70
Anne-Sophie JUGEAN
Deputy Head of Investor Relations
Tel: +33 (0)1 72 36 71 31

12
Press release
APPENDICES
Definitions of terms used in this document
1. Sales growth
Faurecia’s year-on-year sales evolution is made of three components:
• A “Currency effect”, calculated by applying average currency rates for the period to the sales
of the prior year,
• A “Scope effect” (acquisition/divestment),
• And “Growth at constant currencies”.
As “Scope effect”, Faurecia presents all acquisitions/divestments, whose sales on an annual basis
amount to more than €250 million.
Other acquisitions below this threshold are considered as “bolt-on acquisitions” and are included in
“Growth at constant currencies”.
In 2020, there was no effect from “bolt-on acquisitions”; as a result, “Growth at constant currencies” is
equivalent to sales growth at constant scope and currencies also presented as organic growth.
2. Operating income
Operating income is the Faurecia group’s principal performance indicator. It corresponds to net income
of fully consolidated companies before:
▪ Amortization of intangible assets acquired in business combinations;
▪ Other non-recurring operating income and expense, corresponding to material, unusual and non-
recurring items including reorganization expenses and early retirement costs, the impact of
exceptional events such as the discontinuation of a business, the closure or sale of an industrial site,
disposals of non-operating buildings, impairment losses recorded for property, plant and equipment
or intangible assets, as well as other material and unusual losses;
▪ Income on loans, cash investments and marketable securities; Finance costs;
▪ Other financial income and expense, which include the impact of discounting the pension benefit
obligation and the return on related plan assets, the ineffective portion of interest rate and currency
hedges, changes in value of interest rate and currency instruments for which the hedging
relationship does not satisfy the criteria set forth in relationship cannot be demonstrated under IFRS
9, and gains and losses on sales of shares in subsidiaries;
▪ Taxes.
3. Net cash-flow
Net cash-flow is defined as follow: Net cash from (used in) operating and investing activities less
(acquisitions)/disposal of equity interests and businesses (net of cash and cash equivalents), other
changes and proceeds from disposal of financial assets. Repayment of IFRS 16 debt is not included.
4. Net financial debt
Net financial debt is defined as follow: Gross financial debt less cash and cash equivalents and
derivatives classified under non-current and current assets. It includes the lease liabilities (IFRS 16 debt).

13
Press release
Profit and Loss Statement
2019 in €m H1 2020 H2 2020 2020 Change
17,768 Sales 6,170 8,484 14,654 -3,114
organic change -35.4% -3.5% -19.6%
1,283 Operating income
(before amort. of acquired intangible assets) (114) 520 406 -877
(56) Amort. of intangible assets acquired in business
combinations (46) (46) (92)
1,227 Operating income
(after amort. of acquired intangible assets) (160) 474 315 -912
(194) Restructuring (89) (197) (286)
(20) Other non-recurring operating income and expense 16 (7) 9
(219) Net interest expense & Other financial income
and expense (108) (115) (223)
794 Income before tax of fully consolidated companies (341) 155 (185)
(167) Income taxes (67) (56) (123)
(21.0%) as % of pre-tax income n/a (36.1%) n/a
627 Net income of fully consolidated companies (408) 99 (309) -936
38 Share of net income of associates (12) (1) (13)
665 Consolidated net income before minority interest (420) 99 (321)
(75) Minority interest (13) (45) (57)
590 Consolidated net income, Group share (433) 54 (379) -969
Cash Flow Statement
2019 in €m H1 2020 H2 2020 2020 Change
1,283 Operating income (114) 520 406 -877
1,121 Depreciation and amortization, of which: 623 650 1,273
438 - Amortization of R&D intangible assets 243 267 509
683 - Other depreciation and amortization 380 383 763
2,404 EBITDA 509 1,170 1,679 -725
13.5% % of sales 8.3% 13.8% 11.5%
(685) Capex (235) (244) (479)
(681) Capitalized R&D (305) (315) (619)
166 Change in WCR (647) 552 (95)
(57) Change in factoring (96) 134 38
(166) Restructuring (54) (71) (125)
(197) Financial expenses (94) (116) (210)
(296) Taxes (109) (88) (197)
99 Other (operational) (14) 29 15
587 Net cash flow (1,045) 1,051 6 -581
(212) Dividends paid (incl. mino.) (5) (30) (35)
(29) Share purchase 0 1 1
(1,486) Net financial investment & Other (369) 5 (364)
(906) IFRS16 impact (91) (121) (211)
(2,046) Change in net debt (1,510) 906 (604)
(478) Net debt at the beginning of the period (2,524) (4,034) (2,524)
(2,524) Net debt at the end of the period (4,034) (3,128) (3,128)
1.1x Net-debt-to-EBITDA ratio 2.3x 1.9x 1.9x

14
Press release
Net Cash Flow reconciliation
FY 2019 in €m H1 2020 H2 2020 2020 Change
587 Net cash flow (1,045) 1,051 6 -581
(1,130)
Sales/Acquisitions of investments and businesses
(net of cash) (224) (28) (252)
0 Proceeds from disposal of financial assets 0 0 0
54 Other changes from continued operations (3) (9) (12)
(490) Cash provided (used) by operating and investing
activities (1,272) 1,015 (257) 233
Operating leverage calculation
Sales (in €m)
Operating income (in €m)
2019 17,768 2019 1,283
Currency effect -373 (a) Volume impact -1,476 (c)
Organic -3,483 (b) Resilience actions 661 (d)
Scope effect 741
Scope & other 3
2020 before one-offs 471
One-offs -65
2020 14, 654 2020 406
Operating leverage in 2020 (c+d)/(a+b) 21%
Drop in operating income excl. Scope & other and one-offs -815
Drop in sales excluding Scope effect -3,856