press release first half 2020 results
TRANSCRIPT

The enclosed information constitutes regulated information as defined in the Royal Decree of 14 November 2007 regarding the duties of issuers of financial instruments which have been admitted for trading on a regulated market. Inside information.
Mechelen, July 30, 2020 – Telenet Group Holding NV (“Telenet” or the “Company”) (Euronext Brussels: TNET) announces its unaudited consolidated results under International Financial Reporting Standards as adopted by the European Union (“EU IFRS”) for the six months ended June 30, 2020.
HIGHLIGHTS
■ Living our purpose: staying one step ahead in the digital world, connecting people and creating experiences for a better quality of life, as illustrated by many voluntary initiatives during the COVID-19 pandemic for our customers and our community under the #samenerdoor/fairefaceensemble umbrella.
■ Continued strong FMC growth to 598,900 customers at June 30, 2020, +28% yoy, reaching around 29% of total customer relationships and driving 7,300 net mobile postpaid subscriber additions in the quarter.
■ A higher share of multiple-play and higher-tier broadband customers and the benefit of certain price adjustments drove a healthy 2% yoy growth in the fixed ARPU per customer relationship to €58.4 for both H1 and Q2 2020.
■ H1 2020 and Q2 2020 revenue of €1,272.2 million and €619.2 million, +1% and -3% yoy, respectively, and including the impacts of our acquisition of De Vijver Media (fully consolidated since June 3, 2019) and our divestiture of our former Luxembourg cable business (deconsolidated as of April 1, 2020). On a rebased(1) basis, our H1 2020 and Q2 2020 top line decreased nearly 3% and over 5% yoy due to significantly lower other revenue following the effects of the COVID-19 pandemic. Excluding other revenue, both our reported and rebased revenue for both periods was stable compared to the same period of last year, in line with our outlook.
■ Net profit of €184.9 million (Q2 2020: €31.7 million) in H1 2020, +230% yoy, driven by significantly lower net finance expense in the period and lower income tax expense.
■ H1 2020 and Q2 2020 Adjusted EBITDA(2) of €698.0 million and €352.4 million, +5% and +2% yoy on a reported basis, including the aforementioned inorganic impacts. On a rebased basis, our Adjusted EBITDA increased 2% yoy in H1 2020 and was stable versus Q2 2019, driven by (i) lower sales and marketing expenses due to the impact of the COVID-19 pandemic and last year's impact of the SFR customer migration and (ii) tight cost control.
■ Accrued capital expenditures(3) of €297.6 million in H1 2020, -3% yoy and equivalent to around 23% of revenue in the period. Excluding the recognition of the UK Premier League football broadcasting rights in H1 2019, our accrued capital expenditures increased 12% yoy. In Q2 2020, our accrued capital expenditures decreased 8% yoy to €124.9 million, or approximately 20% of revenue, reflecting the impacts of the COVID-19 pandemic.
■ Operating Free Cash Flow(4) of €400.4 million in H1 2020 (Q2 2020: €227.5 million), up 1% yoy. Excluding the impact of IFRS 16 and the recognition of the football broadcasting rights, rebased Operating Free Cash Flow growth reached a solid 5% in H1 2020 and 11% in Q2 2020.
■ Net cash from operating activities, net cash used in investing activities and net cash used in financing activities of €571.7 million, €255.4 million and €346.3 million, respectively, in H1 2020. H1 2020 Adjusted Free Cash Flow(5) increased 28% yoy to €263.9 million (Q2 2020: €180.5 million) due to phasing in our cash tax payment and robust Adjusted EBITDA growth. In H1 2020, we had a €10.6 million benefit under our vendor financing program as compared to €43.9 million in H1 2019. Excluding this impact, our Adjusted Free Cash Flow growth would have been even higher.
PRESS RELEASE
First Half 2020 ResultsAccelerated momentum in Q2 2020 with 9,500 net organic broadband additions, our best performance since Q4 2015, driven by improved sales and reduced churn.Robust financial performance in H1, delivering 230% profit growth due to non-cash variances in the fair value of our derivatives and 2% rebased Adjusted EBITDA growth.
Well positioned for the future and to navigate through the COVID-19 impacts: reaffirming both our 2018-2021 and FY 2020 outlook, as revised end-April 2020.
■ Operating Free Cash Flow guidance of a 6.5 to 8.0% CAGR(a,b) over the 2018-2021 period maintained. FY 2020 outlook reaffirmed targeting (i) rebased(c) revenue decline of around 2%(d), (ii) stable rebased revenue excluding other revenue versus FY 2019(d,e), (iii) rebased Adjusted EBITDA decline of around 1%(a), (iv) rebased Operating Free Cash Flow growth between 1-2%(a, b) and (v) Adjusted Free Cash Flow at the lower end of the €415.0 to €435.0 million range (a, f).
(a) Quantitative reconciliations to net profit (including net profit growth rates) and cash flows from operating activities for our Adjusted EBITDA, Operating Free Cash Flow and Adjusted Free Cash Flow guidance cannot be provided without unreasonable efforts as we do not forecast (i) certain non-cash charges including depreciation and amortization and impairment, restructuring and other operating items included in net profit, nor (ii) specific changes in working capital that impact cash flows from operating activities. The items we do not forecast may vary significantly from period to period.
(b) Excluding the recognition of football broadcasting rights and mobile spectrum licenses and excluding the impact from IFRS 16 on our accrued capital expenditures.
(c) Including the pre-acquisition revenue and Adjusted EBITDA of De Vijver Media (fully consolidated since June 3, 2019) and excluding the revenue and Adjusted EBITDA of Coditel S.à r.l. (deconsolidated as of April 1, 2020).
(d) Relative to both our reported revenue for the full year 2019 and our reported revenue excluding other revenue for the full year 2019, our revenue outlook for the full year 2020 would be broadly stable
(e) Other revenue includes (i) interconnect revenue from both our fixed-line and mobile telephony customers, (ii) advertising and production revenue from De Vijver Media NV, which we fully consolidated as of June 3, 2019, (iii) mobile handset sales, including the revenue earned under our "Choose Your Device" programs, (iv) wholesale revenue generated through both our commercial and regulated wholesale businesses, (v) product activation and installation fees and (vi) set-top box sales revenue as detailed under 2.1 Revenue.
(f) Assuming certain payments are made on our current 2G and 3G mobile spectrum licenses in Q4 2020 and the tax payment on our 2019 tax return will not occur until early 2021.
TELENET GROUP HOLDING NV - EARNINGS RELEASE FIRST HALF 2020 - 2

For the six months ended June 30, 2020 2019 Change %
FINANCIAL HIGHLIGHTS (€ in millions, except per share amounts)
Revenue 1,272.2 1,261.6 1 %
Operating profit 302.1 324.6 (7) %
Net profit 184.9 56.0 230 %
Net profit margin 14.5 % 4.4 %
Basic earnings per share 1.69 0.51 231 %
Diluted earnings per share 1.69 0.51 231 %
Adjusted EBITDA (2) 698.0 664.8 5 %
Adjusted EBITDA margin % 54.9 % 52.7 %
Accrued capital expenditures (excluding the recognition of football broadcasting rights and mobile spectrum licenses) (3) 297.6 266.5 12 %
Accrued capital expenditures as % of revenue (excluding the recognition of football broadcasting rights and mobile spectrum licenses) 23.4 % 21.1 %
Operating Free Cash Flow (4) 400.4 398.3 1 %
Net cash from operating activities 571.7 499.2 15 %
Net cash used in investing activities (255.4) (206.6) 24 %
Net cash used in financing activities (346.3) (241.3) 44 %
Adjusted Free Cash Flow (5) 263.9 206.7 28 %
OPERATIONAL HIGHLIGHTS (Total Services)
Video 1,835,600 1,902,200 (4) %
Basic video (6) 139,900 183,700 (24) %
Enhanced video (7) 1,695,700 1,718,500 (1) %
Broadband internet (8) 1,676,500 1,661,100 1 %
Fixed-line telephony (9) 1,195,400 1,234,800 (3) %
Mobile telephony (10) 2,795,800 2,748,300 2 %
Postpaid 2,394,900 2,282,000 5 %
Prepaid 400,900 466,300 (14) %
Triple-play customers 1,098,400 1,128,600 (3) %
Services per customer relationship (11) 2.29 2.29 — %
ARPU per customer relationship (€ / month) (11) (12) 58.4 57.2 2 %
N.M. - Not Meaningful
TELENET GROUP HOLDING NV - EARNINGS RELEASE FIRST HALF 2020 - 3

Commenting on the results, John Porter, Telenet’s Chief Executive Officer, stated:
"First of all, we hope you are all well and hopefully returning back to the so called “new normal”. I am very pleased with how efficiently our employees have adapted to working-from-home, underlining the superior quality of our HFC giga-network. We continued several initiatives to support all our stakeholders in these difficult times such as prolonging our mobile and fixed double data promotions for all our customers, expanding our TV offering for our Business customers in the care industry, providing free WiFi to students without Internet, laptop donations for Digital4Youth and, amongst many others, a 4G router solution for robots, to help strengthen connectivity in the care homes.
Despite the current ongoing Covid crisis, we accelerated positive operational momentum as we saw in the previous quarter. We managed to further grow our broadband customer base with 9,500 net adds while our digital TV customer base remained broadly stable. We further increased our FMC subscriber base, which represents the sum of our "WIGO", "YUGO" and "KLIK" fully converged bundle propositions, to 598,900, an increase of 28% year-on-year resulting in a 29% convergence rate, compared to 22% in the same period last year. Our mobile attach rate increased 3 percentage points to 40% compared to the same period last year.The pursuit of our continuous focus on FMC resulted in 7,300 net postpaid adds, significantly down compared to previous quarters runrate, largely attributable to the closure of our retail stores till the 11th of May and the inclusion of financial churn.
Sales of our B2B "KLIK" FMC bundles picked up again during the second half of Q2. We do see impact on our ICT integrator service business from COVID-19 because of the current economic slowdown.
On the entertainment side, we noted the main impact of Covid-19 on our De Vijver Media TV advertising revenues and our Play Sports offering where we lost 20,500 subscribers in Q2 2020 as the national Jupiler Pro League competition was stopped. Meanwhile, thanks to the re-start of several international competitions, we managed to stabilize churn.
Our core business remained intact as our total revenues excluding other revenues remained stable for the first half of 2020 year-on-year, confirming our resilience towards the ongoing crisis.
Our network is fully resilient during the COVID-19 pandemic, despite increased usage. Upstream data traffic on our HFC network increased 50%, and downstream 20% on average in Q2 2020, without any major outages. Fixed broadband connectivity during Covid-19 was the most reliable at Telenet, as 72% of Telenet customers never encountered any disruption, compared to 62% on average for the total market. The average download speed per customer in Q2 further increased to 206mbps, almost 50% faster compared to the same period last year. This yet again illustrates the solid state of our Gigabit fixed infrastructure and it’s our key goal to maintain network leadership in the future as well. In this context, we started talks with network company Fluvius about the realization of a data network of the future in Flanders for everyone in Flanders in the coming years.
Assuming no second outbreak would occur in the coming months, we reaffirm the updated full year 2020 guidance we gave post-Q1 2020 results."
TELENET GROUP HOLDING NV - EARNINGS RELEASE FIRST HALF 2020 - 4

Commenting on the results, Erik Van den Enden, Telenet’s Chief Financial Officer, stated:
"Despite the impact of the COVID-19 pandemic on parts of our business, notably during the second quarter, we have seen a strong financial performance over the first six months of the year. For the first six months of the year, we generated revenue of €1,272 million, which was up 1% year-on-year and included the impacts of our acquisition of De Vijver Media (fully consolidated since June 3, 2019) and our divestiture of our former Luxembourg cable business (deconsolidated as of April 1, 2020). Excluding both inorganic impacts, our top line decreased nearly 3% year-on-year in H1 2020. This mainly reflected a 15% decrease in our other revenue as a result of the COVID-19 pandemic, which includes amongst others interconnect revenue, handset-related revenue and advertising and production revenue at De Vijver Media. In Q2 2020, we generated revenue of €619 million, which represented a 3% decrease year-on-year on a reported basis and a 5% decrease on a rebased basis due to a sharp anticipated decline in our other revenue for the reasons mentioned above. Excluding other revenue in both periods, our top line was stable in both H1 and Q2 2020, which was in line with our revised guidance as presented at the end of April. Lower business services revenue in both periods due to the impact of the COVID-19 pandemic on our ICT integrator business was offset by higher recurring subscription revenue.
We once again demonstrated tight cost control in the first half of 2020, with a decrease in our total operating expenses of almost 8% year-on-year on a rebased basis. All our cost buckets showed an improved trend versus the same period of last year including (i) a 10% rebased decline in our direct costs (-5% on a reported basis), (ii) a 16% rebased decline in sales and marketing expenses (-10% on a reported basis) and (iii) a 14% rebased decline in our other indirect expenses (-12% on a reported basis). As a result, we achieved Adjusted EBITDA of €698 million for the six months ended June 30, 2020, up 5% year-on-year on a reported basis and up nearly 2% on a rebased basis. We succeeded in expanding our rebased Adjusted EBITDA margin by 250 basis points versus the same period of last year to 54.9%. Q2 2020 Adjusted EBITDA was €352 million, up 2% compared to the prior year period. On a rebased basis, our Adjusted EBITDA in Q2 2020 was stable compared to the same period of last year against the backdrop of the aforementioned 5% rebased revenue decline. In line with our full year 2020 outlook, we expect a softer Adjusted EBITDA performance in the second half, which includes a tougher comparison base for the third quarter relative to Q3 last year and an expected increase in certain cost drivers.
Our Operating Free Cash Flow reached €400 million for the six months ended June 30, 2020 (Q2 2020: €228 million), representing a modest 1% increase year-on-year as a 12% increase in our accrued capital expenditures (excluding the recognition in H1 2019 of the UK Premier League football broadcasting rights) was more than offset by the aforementioned increase in our Adjusted EBITDA. Excluding the impact of IFRS 16 and the recognition of the football broadcasting rights, rebased Operating Free Cash Flow growth reached a solid 5% in H1 2020.
Finally, the net cash generated by our operating activities totaled €572 million, which was up 15% year-on-year due to timing variances in the payment of our annual corporate income tax and solid Adjusted EBITDA growth. Our Adjusted Free Cash Flow reached €264 million in H1 2020 (Q2 2020: €181 million), up 28% year-on-year due to timing variances in our cash tax payment and healthy Adjusted EBITDA growth. As we expect to settle our cash tax payment in the third quarter of 2020, this will negatively affect the year-on-year comparison in Q3 2020. Our Adjusted Free Cash Flow for the six months ended June 30, 2020 included a nearly €11 million benefit from our vendor financing as compared to a €44 million benefit in H1 2019. Excluding these vendor financing-related impacts, our Adjusted Free Cash Flow growth would have been even higher.
Telenet enjoys a very robust liquidity and debt maturity profile with (i) a cash balance of €71 million at June 30, 2020, (ii) undrawn revolving credit facilities of €555 million with certain availabilities up to May 2026, (iii) a weighted average maturity of 8 years and (iv) no debt amortizations prior to March 2028, excluding short-dated commitments on our vendor financing commitments. Our net total leverage at June 30, 2020 remained stable at 4.0x, exactly at the mid-point of our leverage framework as presented during the December 2018 Capital Markets Day. This reflected the payment of a €142 million final dividend in May and €34 million spent under the Share Repurchase Program 2020. As such, we continue to deliver against our shareholder remuneration policy and will propose a next intermediate dividend to the board of directors at the end of October.
Looking back at the first half and looking ahead, we reaffirm both our full year 2020 outlook, as revised at the end of April, and our three-year Operating Free Cash Flow outlook. As a reminder, our full year outlook excludes the impact of any additional lock-down measures throughout the remainder of the year and assumes a gradual economic recovery after most of the COVID-related restrictions got lifted mid-May."

1 Operational highlights
IMPORTANT REPORTING CHANGES:
Merger between SFR-Coditel and Eltrona: On April 1, 2020, we divested our wholly-owned Luxembourg cable subsidiary Coditel S.à r.l. to Eltrona and acquired a 34% stake in the latter from Post Luxembourg. Following both transactions, we now hold a 50% minus 1 share ownership in Eltrona, which is the largest cable operator in Luxembourg. As of April 1, 2020, SFR-Coditel is no longer consolidated in our operational and financial results. Consequently, we removed 47,700 homes passed, 9,500 customer relationships and 18,500 RGUs (video: 9,200 RGUs, broadband: 5,500 RGUs and fixed-line telephony: 3,800 RGUs) from our consolidated subscriber counts as presented below and under 4. Consolidated interim operating statistics.
1.1 Multiple-play
OVERVIEW & MULTIPLE-PLAYAt June 30, 2020, we served 2,052,200 unique customer relationships, which represented approximately 61% of the 3,355,200 homes passed by our leading hybrid fiber coaxial ("HFC") network across our Flemish and Brussels footprint. Our cable network consists of a dense fiber backbone with local loop coaxial cable connections and spectrum of up to 1.2 GHz. Through both EuroDocsis 3.0 and 3.1 technologies, we offer data download speeds of up to 1 Gbps across our entire footprint, reaffirming our leading market position as the fastest internet service provider.
At June 30, 2020, we provided 4,707,500 fixed services ("RGUs") consisting of 1,835,600 video, 1,676,500 broadband internet and 1,195,400 fixed-line telephony subscriptions. Our Q2 2020 quarter-end subscriber numbers included the removal of certain non-paying subscribers in line with our accounting policy, even though we couldn't disconnect such subscribers before July 1, 2020 following specific COVID-19 related regulation imposed by the national telecoms regulator BIPT. In addition, our June 30, 2020 subscriber numbers excluded our former SFR-Coditel customers due to the merger with the Luxembourg cable operator Eltrona as mentioned above. Within our video mix, approximately 92% of our video subscribers had upgraded to our higher ARPU enhanced video platform at June 30, 2020. Enhanced video subscribers enjoy an enriched TV experience with unrestricted access to a wider range of digital, HD and pay television sports, series and movies channels, a vast library of domestic and international video-on-demand ("VOD") content and our over-the-top ("OTT") platform "Yelo Play". At June 30, 2020, we also served 2,795,800 mobile subscribers, of which approximately 86% are subscribed to one of our attractive mobile or fixed mobile converged ("FMC") rate plans. We reached a bundling rate of 2.29 fixed RGUs per unique customer relationship at the end of Q2 2020, which was stable compared to the prior year period. Approximately 32% of our cable customers subscribed to a quadruple-play bundle at June 30, 2020 (excluding mobile subscriptions under the BASE brand), a solid increase of 310 basis points compared to the same period of last year, indicating continued success of our fixed-mobile convergence strategy.
Net subscriber growth for our FMC bundles remained solid at 23,100 in Q2 2020. This represented a softer performance versus preceding quarters as substantially all of our retail locations were forced to close due to the COVID-19 pandemic until mid-May and during the same period last year we had just launched our new "WIGO S" and "WIGO Home" FMC bundles. For the six months ended June 30, 2020, we attracted 51,500 net FMC subscribers, underpinning again the growth potential of our fully integrated fixed-mobile offers. At June 30, 2020, our FMC customer base, which includes our "WIGO", "YUGO" and "KLIK" (B2B) customers, reached a total of 598,900 customers, which was up 28% year-on-year. As such, the penetration of FMC subscribers relative to the total number of customer relationships represented approximately 29% at the Q2 2020 quarter-end as compared to approximately 22% a year ago.
ARPU PER CUSTOMER RELATIONSHIP The ARPU per customer relationship, which excludes our mobile telephony revenue and certain other types of revenue, is one of our core operating statistics as we seek to obtain a larger share of our customers' telecommunication and entertainment spending. For both the six months ended June 30, 2020 and Q2 2020,
TELENET GROUP HOLDING NV - EARNINGS RELEASE FIRST HALF 2020 - 6

we yielded an ARPU per customer relationship of €58.4, which represented a healthy increase of 2% as compared to H1 2019 and Q2 2019. Growth in the ARPU per customer relationship was underpinned by (i) a higher proportion of multiple-play subscribers in our overall customer mix, (ii) a larger share of higher-tier broadband subscribers in our mix and (iii) the benefit from certain price adjustments. This favorable trend was partly offset by (i) a higher proportion of bundle discounts (including fixed-term promotions), (ii) lower out-of-bundle usage-related revenue and (iii) the effect of the changed allocation of bundle-related subscription revenue as further detailed under 2. Financial highlights.
1.2 Broadband internet
At June 30, 2020, we served 1,676,500 broadband internet subscribers, including the removal of 5,500 RGUs following the merger of Coditel S.à r.l. with the Luxembourg cable operator Eltrona as mentioned above. Excluding this effect, we recorded a robust 9,500 net organic subscriber additions in Q2 2020 (H1 2020: 17,600), which represented our strongest quarterly achievement since Q4 2015 and included a strong pick-up in the consumer segment. As such, we continued to see improved commercial momentum for our leading broadband services on the back of our improved product line-up and a growing customer demand for reliable high-speed connectivity solutions during the COVID-19 pandemic. Annualized churn decreased significantly from 8.3% in Q2 2019 to 6.4% in Q2 2020. As mentioned before, substantially all of our retail locations were forced to close until mid-May as a result of the COVID-19 pandemic, which favorably impacted our churn rates across all products.
As we continue to focus on maximizing the in-home connectivity customer experience, we distributed over 51,000 WiFi boosters to our customers during Q2 2020, totaling an impressive installed base of 645,000, which equals approximately 38% of our broadband customer base. Five years after the start of our fixed network upgrade program "De Grote Netwerf", we have started to commercialize data download speeds of 1 gigabit per second throughout our entire footprint through the "GIGA Speedboost" option for an additional €15 per month. Our Gigabit Speedboost customer base at June 30, 2020 grew 23% compared to the preceding quarter, underpinning the customer need for reliable and high-speed broadband services which we are able to provide thanks to our leading HFC network. Thanks to the continued uptiering of our broadband internet customer base, we further drove increases in the weighted average data download speed, reaching 206 Mbps at June 30, 2020. This represents an impressive growth of almost 50% compared to the same period a year ago. During the COVID-19 lockdown, we also observed a sharp increase in both download and upload offpeak traffic of 50% year-on-year during Q2 2020, while the monthly average volume used per user increased 47% in Q2 2020 compared to the same period last year.
1.3 Fixed-line telephony
At June 30, 2020, we served 1,195,400 fixed-line telephony subscribers, representing a 3% decrease compared to the same period of last year, reflecting an overall declining market trend and the removal of 3,800 RGUs following the aforementioned merger of our Luxembourg cable business with Eltrona. Relative to March 31, 2020, our fixed-line telephony subscriber base contracted by 7,100 RGUs on a net organic basis in Q2 2020 (H1 2020: -13,300). Since the outbreak of the COVID-19 pandemic, we have seen an increased fixed voice usage across our customer base. Similar to broadband internet, annualized churn for our fixed-line telephony service improved significantly compared to the same period of last year, improving 330 basis points to 7.1% in Q2 2020.
1.4 Mobile telephony
Our mobile telephony subscriber base, which excludes subscribers under our commercial wholesale partnerships and our SME customers, totaled 2,795,800 SIMs at the end of Q2 2020, including 2,394,900 postpaid subscribers. The remaining 400,900 mobile subscribers are prepaid subscribers under the BASE brand. Net mobile postpaid subscriber growth in Q2 2020 was significantly impacted by the closure of our physical retail outlets until mid-May. This particularly affected our standalone mobile business, which was only partly compensated by continued growth of our FMC subscriber base. Consequently, we achieved 7,300 net postpaid additions in Q2 2020 (H1 2020: 31,100).
TELENET GROUP HOLDING NV - EARNINGS RELEASE FIRST HALF 2020 - 7

1.5 Video
TOTAL VIDEOAt June 30, 2020, our total basic and enhanced video customer base reached 1,835,600 RGUs and included the removal of 9,200 video subscribers following the merger of SFR-Coditel with Eltrona as mentioned above. This represented a net organic loss of 7,200 video subscribers during Q2 2020 (H1 2020: -21,800), which represented our best quarterly result since Q2 2016. The aforementioned net loss excludes migrations to our enhanced video service and represents customers churning to competitors’ platforms, such as other digital television, OTT and satellite providers, or customers terminating their video service or having moved out of our service footprint. In October 2019, we launched our "Signal Switch" campaign in order to prepare for the switch-off of both the analog radio and video signals between 2020 and 2021. This will free up capacity on the network for the ever-increasing digital traffic. We decided to temporarily postpone this project as a result of the precautionary measures taken for the COVID-19 crisis. This project will be relaunched again depending on further developments of the current ongoing crisis.
ENHANCED VIDEOAt June 30, 2020, 1,695,700 of our video customers had upgraded to our higher ARPU enhanced video services, so they can enjoy a much richer TV experience, including free and unrestricted access to our “Yelo Play” app, through which they can enjoy a unique content experience on multiple connected devices in the home and out-of-home. This includes our latest digital TV platform, including our next-generation cloud-based set-top box with voice recognition capabilities, which we launched at the end of April 2019. At the end of Q2 2020, our enhanced video customer base remained broadly stable compared to March 31, 2020 (H1 2020: 3,000 net organic additions).
Our subscription VOD packages "Play" and "Play More" reached 421,200 customers in Q2 2020, which was broadly stable compared to the previous quarter-end. As in Q1 2020, our sports offering "Play Sports" continued to be impacted in Q2 2020 by the temporary halt of both national and international football championships and other major sports events due to the COVID-19 pandemic. At the end of Q2 2020, we had 198,300 "Play Sports" customers, representing a net loss of 20,500 subscribers compared to March 31, 2020. With certain international football leagues having resumed after the Q2 quarter-end, we've noted an improved trend in our "Play Sports" customer base.
TELENET GROUP HOLDING NV - EARNINGS RELEASE FIRST HALF 2020 - 8

2 Financial highlights
IMPORTANT REPORTING CHANGES:
Rebased growth: For purposes of calculating rebased growth rates on a comparable basis for the three months ended June 30, 2020 and the six months ended June 30, 2020, we have adjusted our historical revenue and Adjusted EBITDA to (i) include the pre-acquisition revenue and Adjusted EBITDA of De Vijver Media (fully consolidated since June 3, 2019) in our rebased amounts and (ii) exclude the revenue and Adjusted EBITDA of our former Luxembourg cable subsidiary Coditel S.à r.l. (deconsolidated as of April 1, 2020) from our rebased amounts for the three months ended June 30, 2019 and the six months ended June 30, 2019 to the same extent that the revenue and Adjusted EBITDA of such entities was included in our results for the three months ended June 30, 2020 and the six months ended June 30, 2020. See Definitions for more disclosures. For more information regarding the variance between our reported and rebased financial results, we refer to the Appendix in this press release.
Allocation of bundle-related subscription revenue: Following the recent revamp of our broadband internet standalone portfolio, a lower revenue share from our fixed and FMC bundles is allocated to broadband internet revenue as of January 1, 2020. This adversely impacts our broadband internet revenue, fully offset by a higher allocation to our video, fixed-line telephony and mobile telephony revenue. The aforementioned change also impacts the ARPU per customer relationship (as this excludes mobile telephony revenue), yet does not impact our total subscription revenue.
Restated statement of financial position December 31, 2019: In the course of Q1 2020, Telenet completed its accounting for the step acquisition of De Vijver Media concluded on June 3, 2019 (“purchase price allocation”), which resulted in the recognition of €4.6 million deferred tax liabilities through goodwill. The condensed consolidated statement of financial position as per December 31, 2019 has been restated accordingly.
Purchase price allocation for the Native Nation acquisition: The Company's December 31, 2019 statement of financial position has been restated, reflecting the retrospective impact of the purchase price allocation (“PPA”) and accounting policies alignment for the Native Nation acquisition, which was not yet available at year-end 2019. The fair value adjustment on intangible assets (€6.8 million) mainly related to the acquired trade names (€2.7 million), customer relationships (€2.4 million) and technology (€1.7 million). Together with the deferred tax impact of the above mentioned adjustments (€1.7 million), goodwill was reduced by €5.1 million. The recognition of the fair value of the intangible assets did not result in any material additional amortization expense for the period between the acquisition date (October 18, 2019) and December 31, 2019, and consequently, the consolidated statement of profit and loss and other comprehensive income for the twelve months ended December 31, 2019 has not been restated.
2.1 Revenue
For the six months ended June 30, 2020, we generated revenue of €1,272.2 million, which was up 1% versus €1,261.6 million in the prior year period. Our H1 2020 revenue included a full six-month contribution from the local media company De Vijver Media NV, of which we acquired the remaining 50% stake on June 3, 2019 and which has been fully consolidated as of then. As of April 1, 2020, our financial results no longer include the contribution of our Luxembourg cable subsidiary Coditel S.à r.l., which has been merged into Eltrona as mentioned above and in which we hold a 50% minus 1 share shareholding. Excluding both inorganic effects, our rebased H1 2020 revenue decreased nearly 3% (-2.7%) as compared to the same period last year and mainly reflected a 15% decrease in our other revenue as a result of the COVID-19 pandemic, as further described below.
Excluding other revenue, our rebased revenue for the six months ended June 30, 2020 was stable, in line with our revised full year guidance as presented at the end of April. Our total subscription revenue, including both cable and mobile subscription revenue, increased nearly 1% both on a reported and rebased basis. This solid performance was driven by (i) continued solid momentum for our FMC bundles in both the residential
TELENET GROUP HOLDING NV - EARNINGS RELEASE FIRST HALF 2020 - 9

and the business segments, (ii) the uptiering of broadband customers to higher speed bundles and (iii) the benefit of the August 2019 rate adjustments. This effect was almost fully offset by lower business services revenue, reflecting the negative effects from COVID-19 primarily on our ICT integrator business.
In Q2 2020, our operations yielded €619.2 million of revenue, which represented a 3% decrease versus Q2 2019 and reflected a more outspoken anticipated effect of the COVID-19 pandemic on our financial profile as compared to the preceding quarter. Excluding the aforementioned inorganic effects, our top line in the quarter contracted over 5% (-5.4%) on a rebased basis as compared to the prior year period on the back of a 26% decrease in our other revenue, largely reflecting the same factors as mentioned below. Excluding other revenue, our rebased revenue in Q2 2020 was stable compared to Q2 2019.
VIDEOOur video revenue represents the monthly fee paid by our video subscribers for the channels they receive in the basic tier and the revenue generated by our enhanced video subscribers which primarily includes (i) recurring set-top box rental fees, (ii) fees for supplemental premium content offerings, including our subscription VOD packages “Play”, “Play More” and “Play Sports” and (iii) transactional and broadcasting-on-demand services. In H1 2020, our video revenue amounted to €284.0 million (Q2 2020: €139.6 million), representing a 1% decrease compared to H1 last year, both on a reported and rebased basis. A higher revenue share from our FMC bundles as mentioned above and the benefit from certain rate adjustments were more than offset by the continued net loss of video subscribers and the strong decrease in our "Play Sports" sports pay-television subscriber base following the COVID-19 pandemic as described above under 1.5 Video.
BROADBAND INTERNETThe revenue generated by our residential and small business broadband internet RGUs totaled €323.5 million in H1 2020 (Q2 2020: €163.3 million), which was broadly stable compared to the same period of last year, both on a reported and rebased basis. Following the recent revamp of our broadband standalone portfolio, a lower revenue share from our fixed and FMC bundles is allocated to broadband internet revenue since January 1, 2020. This had an adverse impact on our broadband internet revenue, fully offset by a higher allocation to our video, fixed-line telephony and mobile telephony revenue. This shift in our revenue mix fully offset (i) higher SOHO B2B-related broadband revenue, (ii) the August 2019 price adjustment and (iii) the continued uptiering of our broadband internet customer base.
FIXED-LINE TELEPHONYOur fixed-line telephony revenue includes recurring subscription-based revenue from our fixed-line telephony subscribers and variable usage-related revenue, but excludes the interconnect revenue generated by these customers which is reported under other revenue. For the six months ended June 30, 2020, our fixed-line telephony revenue increased 4% year-on-year on both a reported and rebased basis to €113.8 million (Q2 2020: €57.0 million). The increase was mainly attributable to the favorable impact from the aforementioned reallocation of our fixed and FMC bundle revenue, the August 2019 price adjustment and higher usage-related revenue in a result of increased fixed-line calling behavior during the COVID-19 pandemic.
MOBILE TELEPHONYOur mobile telephony revenue represents the subscription-based revenue generated by our direct mobile telephony subscribers and out-of-bundle revenue, but excludes (i) the interconnect revenue generated by these customers, (ii) the revenue earned from handset sales and (iii) revenue recognized under our "Choose Your Device" programs which are all recorded in other revenue. In H1 2020, we generated mobile telephony revenue of €223.0 million (Q2 2020: €109.4 million), representing a 3% year-on-year increase on both a reported and rebased basis. The increase was mainly attributable to the favorable impact from the aforementioned reallocation of our fixed and FMC bundle revenue and continued solid net postpaid subscriber growth, driven by up -and cross-sell to our high-tier FMC bundles. These elements more than offset (i) lower out-of-bundle revenue generated by our mobile subscribers in excess of their monthly bundle on the back of our improved "WIGO" quad-play bundles, the shift to unlimited standalone mobile offers on both Telenet and BASE brands and the double data offer which we extended till the end of May because of the lockdown measures, (ii) higher bundle-related discounts following the success of our quad-play "WIGO" propositions and (iii) a continued decline in the number of prepaid subscribers.
TELENET GROUP HOLDING NV - EARNINGS RELEASE FIRST HALF 2020 - 10

BUSINESS SERVICESThe revenue reported under business services relates to (i) the revenue generated on non-coax products, including fiber and leased DSL lines, (ii) mobile telephony revenue generated by our SME customers, (iii) our carrier business and (iv) value-added services such as network hosting and managed data security. Our business services revenue also includes the revenue generated by the local ICT integrator Nextel, which we acquired on May 31, 2018. Revenue generated by our business customers on all coax-related products, such as our flagship "KLIK" bundle (formerly called "WIGO Business"), is allocated to our cable subscription revenue lines and is not captured within Telenet Business, our business services division.
Telenet Business generated revenue of €98.3 million for the six months ended June 30, 2020 (Q2 2020: €48.3 million), representing a 4% decrease on both a reported and rebased basis as compared to the prior year period. The decline was mainly caused by (i) a lower contribution from our May 2018 acquired ICT integrator business with COVID-19 resulting in certain project delays and postponements, (ii) lower out-of-bundle revenue generated by our SME mobile subscribers and (iii) a gradual shift from one-time revenue, such as equipment sales or project-related revenue, by recurring revenue earned on such transactions.
OTHEROther revenue primarily includes (i) interconnect revenue from both our fixed-line and mobile telephony customers, (ii) advertising and production revenue from De Vijver Media NV, which we fully consolidated as of June 3, 2019, (iii) mobile handset sales, including the revenue earned under our "Choose Your Device" programs, (iv) wholesale revenue generated through both our commercial and regulated wholesale businesses, (v) product activation and installation fees and (vi) set-top box sales revenue.
Our other revenue reached €229.6 million in H1 2020 (Q2 2020: €101.6 million), a 4% year-on-year increase on a reported basis following a full six-month contribution from De Vijver Media as mentioned above. On a rebased basis, our other revenue sharply declined by 15% year-on-year, reflecting (i) a rebased 23% decline in advertising and production revenue at De Vijver Media, (ii) a rebased 19% decline in revenue from handset sales and (iii) a rebased 17% decline in interconnect revenue. The same factors drove a 26% decrease in our other revenue in Q2 2020 versus last year on a rebased basis.
2.2 Expenses
For the six months ended June 30, 2020, we incurred total expenses of €970.1 million, representing a 4% increase compared to the prior year period. Our total expenses in H1 2020 reflected (i) the aforementioned inorganic impacts from the De Vijver Media acquisition and the merger of SFR-Coditel into Eltrona and (ii) a €18.5 million goodwill impairment charge on De Vijver Media following the re-assessment of their strategic long-range plan in Q2 2020, reflecting the impact of the COVID-19 pandemic on its financial profile. Total expenses represented approximately 76% of revenue for the six months ended June 30, 2020 (H1 2019: approximately 74%). Cost of services provided as a percentage of revenue represented approximately 55% in H1 2020 (H1 2019: approximately 54%), while selling, general and administrative expenses represented approximately 21% of our total revenue in H1 2020 (H1 2019: approximately 21%).
Our operating expenses, which include our (i) network operating expenses, (ii) direct costs, (iii) staff-related expenses, (iv) sales and marketing expenses, (v) outsourced labor and professional services and (vi) other indirect expenses, decreased nearly 4% on a reported basis for the six months ended June 30, 2020 despite the aforementioned inorganic impacts. On a rebased basis, our H1 2020 operating expenses decreased by almost 8% compared to the same period of last year. This was predominantly driven by (i) a 10% decrease in our direct costs due to significantly lower interconnect expenses and lower costs related to handset purchases during the COVID-19 pandemic, (ii) a 14% decrease in our indirect costs, mainly driven by lower facility-related costs and tight cost control and (iii) a 16% reduction in our sales and marketing expenses, including a lower spend in the second quarter due to COVID-19. In Q2 2020, total expenses were €470.3 million compared to €461.9 million in Q2 2019. Our total expenses in the quarter reflected (i) the aforementioned inorganic impacts from De Vijver Media acquisition and the SFR-Coditel merger into Eltrona and (ii) the aforementioned €18.5 million goodwill impairment charge. Our
TELENET GROUP HOLDING NV - EARNINGS RELEASE FIRST HALF 2020 - 11

operating expenses in the quarter decreased just over 8% and 11% year-on-year on a reported and rebased basis, respectively, predominantly reflecting the same drivers as mentioned above.
NETWORK OPERATING EXPENSESNetwork operating expenses for the six months ended June 30, 2020 were €100.7 million (Q2 2020: €46.4 million), a decrease of 1% year-on-year on both a reported and a rebased basis. DIRECT COSTS (PROGRAMMING AND COPYRIGHTS, INTERCONNECT AND OTHER)Our direct costs include all of our direct expenses such as (i) programming and copyright costs, (ii) interconnect costs and (iii) handset sales and subsidies. For the six months ended June 30, 2020, our direct costs were €242.5 million, a 5% decrease compared to H1 2019. On a rebased basis, our direct costs for the six months ended June 30, 2020 decreased 10% year-on-year due to significantly lower interconnect expenses and lower costs related to handset purchases during the COVID-19 pandemic. In Q2 2020, our direct costs were €112.2 million, representing a 13% decline compared to the prior year period. On a rebased basis, our direct costs showed a 17% year-on-year decrease, largely reflecting the same drivers as mentioned above.
STAFF-RELATED EXPENSESStaff-related expenses for the six months ended June 30, 2020 were €133.2 million (Q2 2020: €64.5 million), which represented an increase of 4% compared to the prior year period and reflected the aforementioned inorganic impacts. On a rebased basis, staff-related expenses for the six months ended June 30, 2020 decreased almost 3% relative to the same period of last year, as a result of continued tight cost control, a lower headcount as compared to last year and the impact of the COVID-19 pandemic on our staff-related expenses.
SALES AND MARKETING EXPENSESOur sales and marketing expenses for the six months ended June 30, 2020 were €40.0 million (Q2 2020: €18.8 million), representing a 10% year-on-year decrease due to phasing in certain marketing campaigns versus the same period of last year such as the SFR migration campaign and the impact of COVID-19 on our marketing and retail activity. On a rebased basis, sales and marketing expenses decreased 16% year-on-year for the same period and reflected primarily the same drivers as mentioned above.
OUTSOURCED LABOR AND PROFESSIONAL SERVICESCosts related to outsourced labor and professional services for the six months ended June 30, 2020 were €14.3 million (Q2 2020: €4.8 million), an 18% decrease both on a reported and rebased basis as a result of the COVID-19 pandemic and continued tight cost control.
OTHER INDIRECT EXPENSESOther indirect expenses reached €43.5 million for the six months ended June 30, 2020 (Q2 2020: €20.1 million), representing a robust 12% decrease compared to the prior year period on a reported basis. On a rebased basis, other indirect expenses decreased 14% year-on-year, driven by lower facility-related expenses and reflecting our continued focus on operating leverage and tight cost control.
DEPRECIATION, AMORTIZATION AND RESTRUCTURING, INCL. IMPAIRMENT OF LONG-LIVED ASSETS AND GAIN ON DISPOSAL OF SUBSIDIARIESDepreciation and amortization, including impairment of long-lived assets, gain on disposal of subsidiaries and restructuring charges, reached €386.8 million for the six months ended June 30, 2020 compared to €332.7 million for the prior year period and included the aforementioned €18.5 million goodwill impairment charge.
2.3 Net result
FINANCE INCOME AND EXPENSES For the six months ended June 30, 2020, net finance expense totaled €97.8 million compared to net finance expense of €230.7 million in the prior year period. Finance income in H1 2020 increased to €27.7 million as compared to €0.5 million last year, primarily due to a €22.7 million increase in our non-cash gain on derivatives. Finance expenses for the six months ended June 30, 2020 decreased sharply to €125.5 million
TELENET GROUP HOLDING NV - EARNINGS RELEASE FIRST HALF 2020 - 12

from €231.2 million in H1 2019, primarily due to the net effect of (i) a decrease of €78.7 million in non-cash loss on derivatives, (ii) a decrease of €18.3 million in non-cash foreign exchange loss on our USD-denominated debt and (iii) an increase of €15.2 million in loss on the extinguishment of debt following the January 2020 refinancing of both our euro and USD-denominated term loan facilities.
Net finance expense in Q2 2020 amounted to €103.6 million compared to €115.7 million in Q2 last year and included a €73.6 million non-cash foreign exchange gain on our USD-denominated debt versus a €35.2 million non-cash foreign exchange gain in Q2 last year. Net finance expense in Q2 2020 also reflected a €129.2 million non-cash loss on our derivatives versus €82.5 million in Q2 last year.
INCOME TAXES We recorded income tax expense of €16.4 million for the six months ended June 30, 2020 (Q2 2020: €10.2 million) compared to €36.6 million in H1 2019. Our income tax expense for the six months ended June 30, 2020 was favorably impacted by the recognition of the innovation income tax deduction in the first quarter of 2020, including a one-time effect of deductions related to prior periods.
NET PROFITWe realized a net profit of €184.9 million for the six months ended June 30, 2020 (Q2 2020: €31.7 million) compared to a net profit of €56.0 million in the prior year period. The substantial increase in our net profit was primarily driven by significantly lower net finance expense in the period and lower income tax expense as mentioned above. For the six months ended June 30, 2020, we achieved a healthy net profit margin of 14.5% (Q2 2020: 5.1%) compared to a net profit margin of 4.4% last year.
2.4 Adjusted EBITDA
For the six months ended June 30, 2020, we achieved Adjusted EBITDA of €698.0 million, representing a 5% increase versus the €664.8 million we delivered in H1 2019. Our Adjusted EBITDA included the impacts of our acquisition of De Vijver Media (fully consolidated since June 3, 2019) and our divestiture of our former Luxembourg cable business (deconsolidated as of April 1, 2020). On a rebased basis, excluding these inorganic impacts, our Adjusted EBITDA increased nearly 2% for the first six months of 2020, driven by (i) lower sales and marketing expenses due to the impact of the COVID-19 pandemic and last year's impact of the SFR customer migration and (ii) continued tight cost control as demonstrated by lower other indirect expenses, lower costs related to outsourced labor and professional services and lower staff-related expenses. We achieved an Adjusted EBITDA margin of 54.9% in H1 2020 as compared to 52.7% in H1 2019. On a rebased basis, we succeeded in expanding our Adjusted EBITDA margin by 250 basis points versus the same period of last year. In line with our full year 2020 outlook, we expect a softer Adjusted EBITDA performance in the second half, which includes a tougher comparison base for the third quarter relative to Q3 last year and an expected increase in certain cost drivers.
In Q2 2020, we realized Adjusted EBITDA of €352.4 million, which was up 2% compared to the prior year period when we achieved Adjusted EBITDA of €345.3 million and reflected the aforementioned inorganic impacts. On a rebased basis, our Adjusted EBITDA in Q2 2020 was stable compared to the same period of last year against the backdrop of the aforementioned 5% rebased revenue decline. Growth in our Adjusted EBITDA was mainly driven by (i) lower sales and marketing expenses in the quarter as a result of the COVID-19 pandemic, (ii) lower costs related to outsourced labor and professional services, (iii) lower staff-related expenses and (iv) lower other indirect costs as a result of our tight cost control. Consequently, we achieved an exceptional Adjusted EBITDA margin of 56.9% in the quarter compared to 54.3% a year ago, on a reported basis. As such, we obtained our best quarterly margin performance in more than six years' time. On a rebased basis, we managed to grow our Adjusted EBITDA margin by 290 basis points.
TELENET GROUP HOLDING NV - EARNINGS RELEASE FIRST HALF 2020 - 13

Exhibit 1: Reconciliation between profit for the period and Adjusted EBITDA (unaudited)
(€ in millions)
For the three months ended For the six months ended
June 30, June 30,
2020 2019 Change % 2020 2019 Change %
Profit for the period 31.7 42.0 (25) % 184.9 56.0 230 %
Income tax expense 10.2 15.7 (35) % 16.4 36.6 (55) %
Share of the result of equity accounted investees (0.9) 0.3 N.M. (1.3) 1.4 N.M.Loss (gain) on disposal of assets related to a subsidiary or a joint venture 4.3 — 100% 4.3 (0.1) N.M.
Net finance expense (income) 103.6 115.7 (10) % 97.8 230.7 (58) %
Depreciation, amortization, impairment and gain on disposal of subsidiaries 193.3 166.3 16 % 381.8 331.6 15 %
EBITDA 342.2 340.0 1 % 683.9 656.2 4 %
Share based compensation 6.2 4.4 41 % 8.0 6.9 16 %
Operating charges related to acquisitions or divestitures 0.6 0.2 200 % 1.7 0.6 183 %
Restructuring charges 4.0 0.7 471 % 5.0 1.1 355 %
Post measurement period adjustments related to business acquisitions (0.6) — 100% (0.6) — 100%
Adjusted EBITDA 352.4 345.3 2 % 698.0 664.8 5 %Adjusted EBITDA margin 56.9 % 54.3 % 54.9 % 52.7 %
Net profit margin 5.1 % 6.6 % 14.5 % 4.4 %
N.M. - Not Meaningful
2.5 Capital expenditures
Accrued capital expenditures for the six months ended June 30, 2020 reached €297.6 million, which marked a 3% decrease versus the same period of last year and equivalent to approximately 23% of revenue for the first six months of the year. We had a much higher investment profile in the first quarter as detailed in our Q1 2020 earnings release, which was more than offset by a lower investment profile in Q2 2020 due to COVID. Our H1 2020 accrued capital expenditures included the impacts of our acquisition of De Vijver Media (fully consolidated since June 3, 2019) and our divestiture of our former Luxembourg cable business (deconsolidated as of April 1, 2020), while our accrued capital expenditures in H1 2019 included the recognition of the UK Premier League broadcasting rights for a period of three seasons. Under EU IFRS, these football broadcasting rights have been capitalized as an intangible asset and will be amortized as the seasons progress. Excluding the recognition of the football broadcasting rights in H1 2019, our accrued capital expenditures for the six months ended June 30, 2020 increased 12% year-on-year.
In Q2 2020, our accrued capital expenditures decreased 8% to €124.9 million from €135.1 million in Q2 last year, equivalent to approximately 20% of revenue. With the exception of capital expenditures for products and services, all our investment buckets trended lower compared to same period of last year including lower network-related investments and lower customer-related capital expenditures as a result of the COVID-19 pandemic.
Capital expenditures related to customer premises equipment, which includes our spending on set-top boxes, modems and WiFi powerlines, amongst others, represented €52.4 million in H1 2020 (Q2 2020: €22.7 million). This represented a 11% decrease compared to the prior year period, which reflected higher investments related to our successful in-home connectivity campaigns and the launch of our next-gen set-top box, while the first half of 2020 reflected the impact of the COVID-19 pandemic. Capital expenditures related to customer premises equipment for the six months ended June 30, 2020 represented approximately 18% of our total accrued capital expenditures.
Accrued capital expenditures for network growth and upgrades amounted to €38.6 million in H1 2020 (Q2 2020: €15.9 million), marking a 29% decrease compared to the prior year period and predominantly reflected
TELENET GROUP HOLDING NV - EARNINGS RELEASE FIRST HALF 2020 - 14

the substantial completion of both our fixed and mobile network infrastructure improvement programs and to a lesser extent the impact of COVID-19 on our field operations. For the six months ended June 30, 2020, network-related capital expenditures represented approximately 13% of total accrued capital expenditures.
Capital expenditures for products and services, which reflects our investments in product development and the upgrade of our IT platforms and systems, amongst others, totaled €75.4 million in H1 2020 (Q2 2020: €39.4 million). This represents a strong 30% year-on-year increase, reflecting higher spending on our IT upgrade program. Capital expenditures for products and services represented approximately 25% of total accrued capital expenditures for the six months ended June 30, 2020.
The remainder of our accrued capital expenditures includes (i) refurbishments and replacements of network equipment, (ii) sports and programming acquisition costs, including certain content acquired by De Vijver Media, (iii) certain recurring investments in our IT platform and systems and (iv) lease additions under IFRS 16. These reached €131.2 million for the six months ended June 30, 2020 (Q2 2020: €46.9 million).
The above implies that approximately 56% of our accrued capital expenditures for the six months ended June 30, 2020 (Q2 2020: 62%) were scalable and subscriber growth related. We will continue to closely monitor our capital expenditures in order to make sure that they drive incremental returns.
Exhibit 2: Reconciliation between accrued capital expenditures and cash capital expenditures (unaudited)
(€ in millions)
For the three months ended For the six months ended
June 30, June 30,
2020 2019 Change % 2020 2019 Change %
Accrued capital expenditures 124.9 135.1 (8) % 297.6 307.8 (3) %
Assets acquired under capital-related vendor financing arrangements (19.3) (39.7) (51) % (49.1) (107.8) (54) %
Assets acquired under leases (12.2) (18.9) (35) % (39.3) (38.0) 3 %
Changes in current liabilities related to capital expenditures 21.3 11.8 81 % 23.0 28.9 (20) %
Cash capital expenditures 114.7 88.3 30 % 232.2 190.9 22 %
2.6 Operating Free Cash Flow
The sum of our Adjusted EBITDA and accrued capital expenditures yielded an Operating Free Cash Flow of €400.4 million for the six months ended June 30, 2020. Compared to H1 2019, our Operating Free Cash Flow increased slightly by 1% as a 12% increase in our accrued capital expenditures (excluding the recognition of the UK Premier League football broadcasting rights) was more than offset by the aforementioned 5% increase in our Adjusted EBITDA. Excluding the impact of IFRS 16 and the recognition of the football broadcasting rights, our rebased Operating Free Cash Flow would have grown 5% in the first half of 2020, representing a solid result relative to our full year 2020 outlook.
In Q2 2020, we generated €227.5 million of Operating Free Cash Flow, representing a robust 8% increase versus the same period of last year on the back of both lower accrued capital expenditures and higher Adjusted EBITDA. Excluding the impact of IFRS 16 in both periods, our rebased Operating Free Cash Flow growth reached a robust 11% in Q2 2020 versus Q2 2019.
TELENET GROUP HOLDING NV - EARNINGS RELEASE FIRST HALF 2020 - 15

Exhibit 3: Reconciliation to Operating Free Cash Flow (unaudited)
(€ in millions)
For the three months ended For the six months ended
June 30, June 30,
2020 2019 Change % 2020 2019 Change %
Adjusted EBITDA 352.4 345.3 2 % 698.0 664.8 5 %
Accrued capital expenditures (124.9) (135.1) (8) % (297.6) (307.8) (3) %
Recognition of football broadcasting rights — — —% — 41.3 100 %
Accrued capital expenditures excluding recognition of football broadcasting rights and mobile spectrum licenses
(124.9) (135.1) (8) % (297.6) (266.5) 12 %
Operating Free Cash Flow 227.5 210.2 8 % 400.4 398.3 1 %
2.7 Cash flow and liquidity NET CASH FROM OPERATING ACTIVITIES For the six months ended June 30, 2020, our operations yielded €571.7 million of net cash compared to the €499.2 million we generated during the prior year period. The net cash from our operating activities for the six months ended June 30, 2020 included the impacts of our acquisition of De Vijver Media (fully consolidated since June 3, 2019) and our divestiture of our former Luxembourg cable business (deconsolidated as of April 1, 2020). Our net operating cash flow was up a strong 15% year-on-year, driven by a timing variance in our annual cash tax payment and the aforementioned increase in our Adjusted EBITDA.
In Q2 2020, the net cash generated by our operating activities reached €289.2 million, representing a 13% decrease compared to Q2 2019 due to a worsened trend in our working capital versus the same period of last year.
NET CASH USED IN INVESTING ACTIVITIESWe used €255.4 million of net cash in investing activities for the six months ended June 30, 2020 compared to €206.6 million in H1 2019. The 24% increase in our net cash used in investing activities reflected both higher cash capital expenditures following a lower amount of assets procured through our vendor financing program as well as the aforementioned acquisition of a 34% shareholding in the Luxembourg cable operator Eltrona from Post Luxembourg. In Q2 2020, we used €138.0 million of net cash in investing activities, which was up 32% compared to the same period of last year and primarily reflected the same drivers as mentioned above.
We utilize a vendor financing program through which we are able to extend our payment terms for certain suppliers to 360 days at an attractive all-in cost. During H1 2020, we acquired €49.1 million of assets through capital-related vendor financing arrangements (Q2 2020: €19.3 million), favorably impacting our net cash used in investing activities for the equivalent amount. This represented a decline of 54% and 51% year-on-year, respectively, versus H1 and Q2 2019. Please refer to Section 2.5 - Capital expenditures for a reconciliation between accrued capital expenditures and cash capital expenditures.
NET CASH USED IN FINANCING ACTIVITIES For the six months ended June 30, 2020, the net cash used in financing activities was €346.3 million compared to €241.3 million of net cash used in financing activities in H1 2019. The net cash used in financing activities for the six months ended June 30, 2020 reflected a net cash outflow of €107.4 million related to loan repayments including the voluntary 10% redemption of our 3.50% €600.0 million Senior Secured Fixed Rate Notes due March 2028 for an aggregate amount of €56.6 million and scheduled repayments of our short-term vendor financing commitments. In addition, the net cash used in financing activities for the six months ended June 30, 2020 reflected the continued delivery against our shareholder remuneration policy as presented during the December 2018 Capital Markets Day. In May 2020, we paid a gross final dividend of €1.3050 per share (€142.3 million in aggregate) and in the first half of 2020 we also spent €34.4 million on share repurchases as part of our Share Repurchase Program 2020. Under this program, we acquired 1.1 million shares during March 2020 at an average price of €30.43. We also paid €13.4 million related to debt issuance
TELENET GROUP HOLDING NV - EARNINGS RELEASE FIRST HALF 2020 - 16

costs for debt refinancings completed in the first half of 2020. The remainder of the net cash used in financing activities primarily consisted of finance lease repayments and other financial payments.
In Q2 2020, we used €217.3 million of net cash in financing activities, which included the aforementioned dividend payment and the voluntary redemption of part of our Senior Secured Fixed Rate Notes, amongst other items.
ADJUSTED FREE CASH FLOWFor the six months ended June 30, 2020, we generated Adjusted Free Cash Flow of €263.9 million compared to €206.7 million in H1 last year. Relative to the same period of last year, our Adjusted Free Cash Flow increased 28% due to the aforementioned phasing in our cash tax payment and robust Adjusted EBITDA growth. As we expect to settle our cash tax payment in the third quarter of 2020, this will negatively affect the year-on-year comparison in Q3 2020. Our Adjusted Free Cash Flow for the six months ended June 30, 2020 included a €10.6 million benefit from our vendor financing as compared to a €43.9 million benefit in H1 2019. Excluding these vendor financing-related impacts, our Adjusted Free Cash Flow growth would have been even higher.
Our Adjusted Free Cash Flow in Q2 2020 was €180.5 million versus €186.9 million in the same period a year ago and included a €36.9 million higher contribution from our vendor financing program as compared to Q2 2019.
2.8 Debt profile, cash balance and net leverage ratio
DEBT PROFILEAt June 30, 2020, we carried a total debt balance (including accrued interest) of €5,660.4 million, of which €1,429.4 million principal amount is related to the € and USD-denominated Senior Secured Fixed Rate Notes due March 2028 and €3,151.2 million principal amount is owed under our 2020 Amended Senior Credit Facility with maturities ranging from April 2028 through April 2029. Our total debt balance at June 30, 2020 also included a principal amount of €365.5 million related to our vendor financing program and €4.0 million for the outstanding portion of the 2G and 3G mobile spectrum licenses. The remainder primarily represents lease obligations associated with the Interkabel Acquisition and lease liabilities following the adoption of IFRS 16 as of January 1, 2019.
At June 30, 2020, we carried €365.5 million of short-term debt related to our vendor financing program, all of which is maturing within less than twelve months. This represented an increase of €10.6 million and €36.9 million versus December 31, 2019 and March 31, 2020, respectively. For the full year 2020, we still anticipate our vendor financing program to remain relatively stable compared to the end of 2019. As of February 2020, we have reduced the applicable margin on our future short-dated commitments under the vendor financing program by 15 basis points to 2.10% over EURIBOR floored at 0%. Given the aforementioned size of the program, this will have a modest accretive impact on our Adjusted Free Cash Flow.
In the first half of 2020, we finalized several accretive (re)financing transactions. In January 2020, we successfully issued and priced a new 8.25-year USD 2,295 million Term Loan (“Facility AR”) and a new 9.25-year €1,110 million Term Loan (“Facility AQ”). We have used the net proceeds of these issuances to redeem in full the previous Term Loans AN and AO of USD 2,295 million and €1,110 million, respectively. Through this leverage-neutral transaction, we succeeded in reducing the margin on both term loans by 25 basis points, which further solidifies our Adjusted Free Cash Flow profile after the October 2019 refinancing of the 4.875% Senior Secured Notes due 2027.
In April 2020, we successfully issued a new 6.2-year €510.0 million revolving credit facility, replacing our former €460.0 million revolving credit facilities with certain availabilities up to June 2023. As such, we succeeded in extending and upsizing our revolving credit facilities, further strengthening our liquidity profile. The new RCF has the following characteristics: (i) maturity of May 31, 2026, (ii) a margin of 2.25% over EURIBOR (floored at 0%) and (iii) a commitment fee of 40% of the margin. The new RCF can be used for general corporate purposes, which may include acquisitions, distributions to shareholders and general working capital requirements of the Company.
TELENET GROUP HOLDING NV - EARNINGS RELEASE FIRST HALF 2020 - 17
In April 2020, we also completed the 10% repurchase of our 3.50% €600.0 million Senior Secured Fixed Rate Notes due March 2028. As a result of this transaction, the principal amount under these Notes decreased to €540.0 million, leading to annual cash interest savings of €2.1 million further adding to our robust Adjusted Free Cash Flow profile.
Excluding short-term liabilities related to our vendor financing program, we face no debt maturities prior to March 2028 with a weighted average maturity of 8.0 years at June 30, 2020. In addition, we also had full access to €555.0 million of undrawn commitments under our revolving credit facilities at June 30, 2020 with certain availabilities up to May 2026.
DEBT OVERVIEW AND PAYMENT SCHEDULES
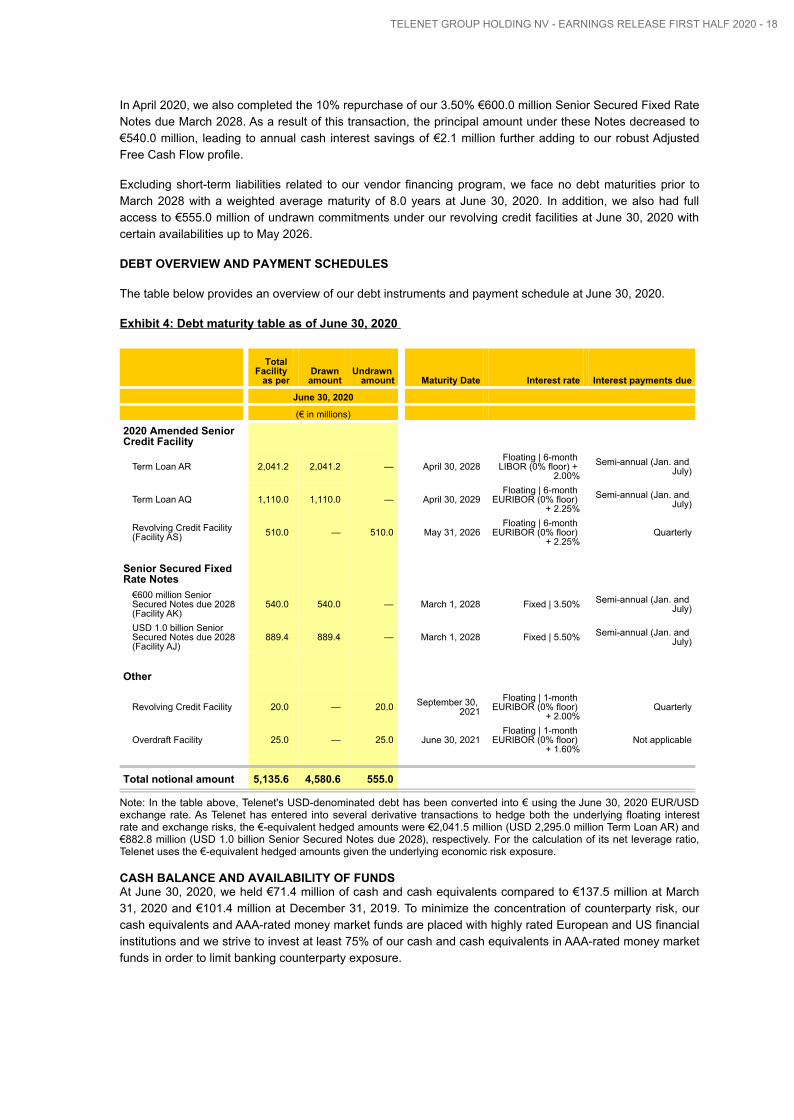
The table below provides an overview of our debt instruments and payment schedule at June 30, 2020.
Exhibit 4: Debt maturity table as of June 30, 2020
Total Facility
as perDrawn amount
Undrawn amount Maturity Date Interest rate Interest payments due
June 30, 2020
(€ in millions)
2020 Amended Senior Credit Facility
Term Loan AR 2,041.2 2,041.2 — April 30, 2028Floating | 6-month
LIBOR (0% floor) + 2.00%
Semi-annual (Jan. and July)
Term Loan AQ 1,110.0 1,110.0 — April 30, 2029Floating | 6-month
EURIBOR (0% floor) + 2.25%
Semi-annual (Jan. and July)
Revolving Credit Facility (Facility AS) 510.0 — 510.0 May 31, 2026
Floating | 6-month EURIBOR (0% floor)
+ 2.25%Quarterly
Senior Secured Fixed Rate Notes
€600 million Senior Secured Notes due 2028 (Facility AK)
540.0 540.0 — March 1, 2028 Fixed | 3.50% Semi-annual (Jan. and July)
USD 1.0 billion Senior Secured Notes due 2028 (Facility AJ)
889.4 889.4 — March 1, 2028 Fixed | 5.50% Semi-annual (Jan. and July)
Other
Revolving Credit Facility 20.0 — 20.0 September 30, 2021
Floating | 1-month EURIBOR (0% floor)
+ 2.00%Quarterly
Overdraft Facility 25.0 — 25.0 June 30, 2021Floating | 1-month
EURIBOR (0% floor) + 1.60%
Not applicable
Total notional amount 5,135.6 4,580.6 555.0
Note: In the table above, Telenet's USD-denominated debt has been converted into € using the June 30, 2020 EUR/USD exchange rate. As Telenet has entered into several derivative transactions to hedge both the underlying floating interest rate and exchange risks, the €-equivalent hedged amounts were €2,041.5 million (USD 2,295.0 million Term Loan AR) and €882.8 million (USD 1.0 billion Senior Secured Notes due 2028), respectively. For the calculation of its net leverage ratio, Telenet uses the €-equivalent hedged amounts given the underlying economic risk exposure.
CASH BALANCE AND AVAILABILITY OF FUNDSAt June 30, 2020, we held €71.4 million of cash and cash equivalents compared to €137.5 million at March 31, 2020 and €101.4 million at December 31, 2019. To minimize the concentration of counterparty risk, our cash equivalents and AAA-rated money market funds are placed with highly rated European and US financial institutions and we strive to invest at least 75% of our cash and cash equivalents in AAA-rated money market funds in order to limit banking counterparty exposure.
TELENET GROUP HOLDING NV - EARNINGS RELEASE FIRST HALF 2020 - 18
Relative to both March 31, 2020 and December 31, 2019, our cash balance decreased despite a robust Adjusted Free Cash Flow generation in the first half of the year. In the first half of 2020, a substantial part of our cash flow has been used under our shareholder remuneration policy, including the payment of a final gross dividend per share of €1.3050 (€142.3 million in aggregate) in May 2020 and €34.4 million of net cash used under the Share Repurchase Program 2020, which has been completed end-March 2020. We also redeemed 10% of our 3.50% €600.0 million Senior Secured Fixed Rate Notes due March 2028 in April for an aggregate amount of €56.6 million. Finally, we incurred a €13.4 million payment related to debt issuance costs for debt refinancings completed in the first half of 2020. In addition to our available cash balance, we also had access to €555.0 million of available commitments under our 2020 Amended Senior Credit Facility and our other revolving credit facilities at June 30, 2020, subject to compliance with the covenants mentioned below.
NET LEVERAGE RATIOAt the occasion of the December 2018 Capital Markets Day, we reconfirmed our leverage framework, maintained at 3.5x to 4.5x Net Total Debt to Consolidated Annualized Adjusted EBITDA ("net total leverage"). In absence of any material acquisitions and/or significant changes in our business or regulatory environment, we intend to stay around the 4.0x mid-point through an attractive and sustainable level of shareholder disbursements. At June 30, 2020, net total leverage was 4.0x, which was unchanged compared to March 31, 2020. This reflected the aforementioned final dividend payment in May 2020, amongst other items that impacted our cash balance at June 30, 2020, as further described above.
Our net covenant leverage, as calculated under the 2020 Amended Senior Credit Facility, differs from our net total leverage as it excludes (i) lease-related liabilities, (ii) any vendor financing-related short-term liabilities and includes (iii) the Credit Facility Excluded Amount (which is the greater of €400.0 million and 0.25x Consolidated Adjusted Annualized EBITDA). Our net covenant leverage reached 2.9x at June 30, 2020. This represented a decrease versus the 3.2x we reported at March 31, 2020 due to the adoption of our 2020 Amended Senior Credit Facility and the inclusion of the Credit Facility Excluded Amount. Our current net covenant leverage ratio is significantly below the springing maintenance covenant of 6.0x and the incurrence test of 4.5x net senior leverage. The aforementioned maintenance covenant only applies, however, in case we would draw 40% or more under our revolving credit facilities. At June 30, 2020, our revolving credit facilities were fully undrawn as mentioned above.
TELENET GROUP HOLDING NV - EARNINGS RELEASE FIRST HALF 2020 - 19

3 Outlook and other information
3.1 Outlook
We delivered a solid financial performance in the first half of 2020 relative to our revised full year 2020 outlook as presented at the end of April. For the first six months of the year, our revenue was up 1% year-on-year and included the impacts of our acquisition of De Vijver Media (fully consolidated since June 3, 2019) and our divestiture of our former Luxembourg cable business (deconsolidated as of April 1, 2020). Excluding these inorganic impacts, our revenue decreased nearly 3% over the first six months of the year on a rebased basis. As detailed in our revenue section, the decline was primarily attributable to our other revenue line, which includes (i) interconnect revenue, (ii) revenue related to the sale of handsets and (iii) advertising and production revenue from our media company De Vijver Media NV. Excluding our other revenue, which is most impacted by the COVID-19 pandemic, our revenue was stable on both a reported and rebased basis, which is in line with our current forecast. Despite a sharp reduction in cable wholesale rates as of July 1, 2020, we expect our other revenue to gradually recover in the second half of the year. Hence, we continue to see an overall revenue decline of around 2% on a rebased basis for the full year.
Year-to-date, we delivered a healthy 5% growth in our Adjusted EBITDA, which included the aforementioned inorganic effects. Excluding these impacts, our rebased Adjusted EBITDA increased nearly 2% in H1 2020, driven by (i) lower sales and marketing expenses due to the impact of the COVID-19 pandemic and last year's impact of the SFR customer migration and (ii) continued tight cost control. Given a tougher headline comparison base relative to the third quarter of last year and the aforementioned regulatory headwinds, we expect a softer Adjusted EBITDA performance in the second half, leading to an expected decrease of around 1% for the full year on a rebased basis.
Given the robust nature of both our fixed and mobile infrastructure and our demonstrated track record of carefully balancing our future investments, we still expect our Operating Free Cash Flow to grow, more specifically between 1 and 2% on a rebased basis with Operating Free Cash Flow up 5% year-on-year for the first six months of the year. Finally, we continue to target Adjusted Free Cash Flow of €415.0 - €435.0 million, skewed however towards the lower end of this range. We are well on track given achieved Adjusted Free Cash Flow of €263.9 million for in the first half of 2020.
Finally, we reconfirm our intention to maintain net total leverage around the 4.0x mid-point, while continuing to deliver on our shareholder remuneration strategy as presented during the December 2018 Capital Markets Day. Following the payment of both an intermediate and final dividend in December 2019 and May 2020 over 2019's Adjusted Free Cash Flow, respectively, we intend to distribute another intermediate dividend in December this year and a final dividend in May next year, both subject to board and shareholder approval. As part of our capital allocation framework, we aim to distribute between 50% and 70% of the prior year Adjusted Free Cash Flow to shareholders through intermediate and final dividends. Within the boundaries of the aforementioned net total leverage framework and in absence of any of the above factors, the remaining part of our Adjusted Free Cash Flow may be considered for incremental share buy-backs, extraordinary dividends, deleveraging, accretive acquisitions or a combination thereof.
TELENET GROUP HOLDING NV - EARNINGS RELEASE FIRST HALF 2020 - 20
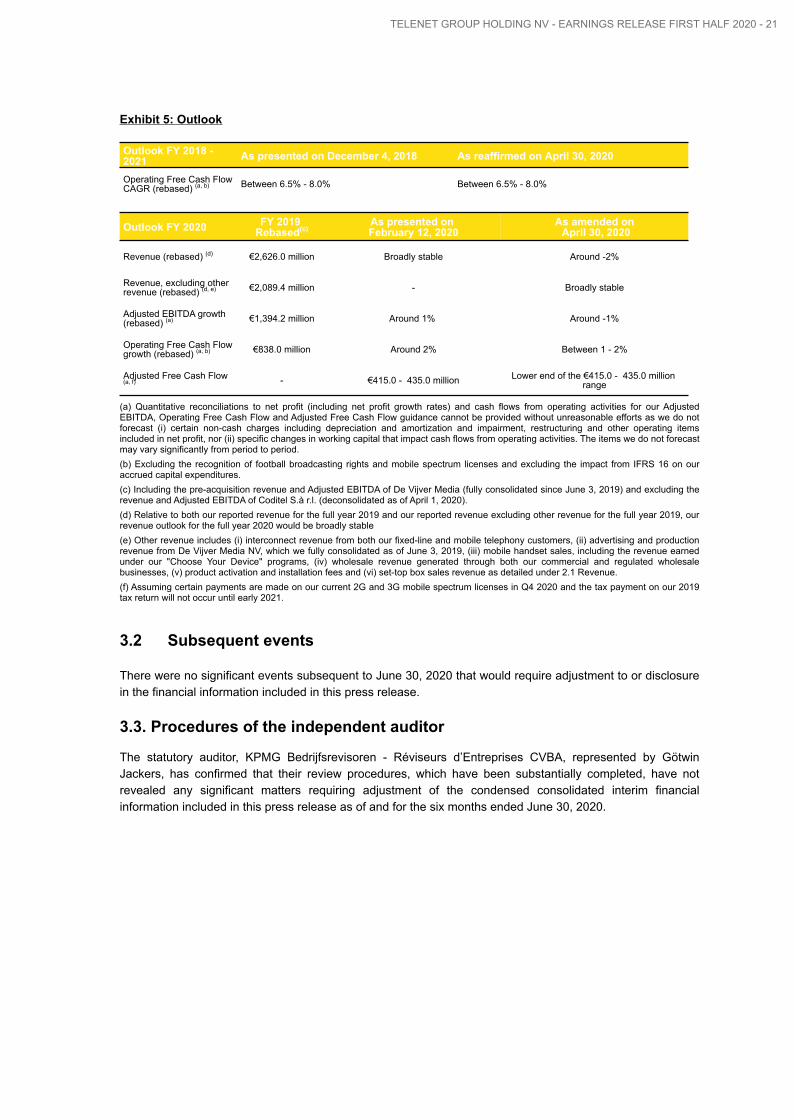
Exhibit 5: Outlook
Outlook FY 2018 - 2021 As presented on December 4, 2018 As reaffirmed on April 30, 2020
Operating Free Cash Flow CAGR (rebased) (a, b) Between 6.5% - 8.0% Between 6.5% - 8.0%
Outlook FY 2020 FY 2019 Rebased(c)
As presented on February 12, 2020
As amended on April 30, 2020
Revenue (rebased) (d) €2,626.0 million Broadly stable Around -2%
Revenue, excluding other revenue (rebased) (d, e) €2,089.4 million - Broadly stable
Adjusted EBITDA growth (rebased) (a) €1,394.2 million Around 1% Around -1%
Operating Free Cash Flow growth (rebased) (a, b) €838.0 million Around 2% Between 1 - 2%
Adjusted Free Cash Flow (a, f) - €415.0 - 435.0 million Lower end of the €415.0 - 435.0 million
range
(a) Quantitative reconciliations to net profit (including net profit growth rates) and cash flows from operating activities for our Adjusted EBITDA, Operating Free Cash Flow and Adjusted Free Cash Flow guidance cannot be provided without unreasonable efforts as we do not forecast (i) certain non-cash charges including depreciation and amortization and impairment, restructuring and other operating items included in net profit, nor (ii) specific changes in working capital that impact cash flows from operating activities. The items we do not forecast may vary significantly from period to period.(b) Excluding the recognition of football broadcasting rights and mobile spectrum licenses and excluding the impact from IFRS 16 on our accrued capital expenditures.(c) Including the pre-acquisition revenue and Adjusted EBITDA of De Vijver Media (fully consolidated since June 3, 2019) and excluding the revenue and Adjusted EBITDA of Coditel S.à r.l. (deconsolidated as of April 1, 2020). (d) Relative to both our reported revenue for the full year 2019 and our reported revenue excluding other revenue for the full year 2019, our revenue outlook for the full year 2020 would be broadly stable (e) Other revenue includes (i) interconnect revenue from both our fixed-line and mobile telephony customers, (ii) advertising and production revenue from De Vijver Media NV, which we fully consolidated as of June 3, 2019, (iii) mobile handset sales, including the revenue earned under our "Choose Your Device" programs, (iv) wholesale revenue generated through both our commercial and regulated wholesale businesses, (v) product activation and installation fees and (vi) set-top box sales revenue as detailed under 2.1 Revenue.(f) Assuming certain payments are made on our current 2G and 3G mobile spectrum licenses in Q4 2020 and the tax payment on our 2019 tax return will not occur until early 2021.
3.2 Subsequent events
There were no significant events subsequent to June 30, 2020 that would require adjustment to or disclosure in the financial information included in this press release.
3.3. Procedures of the independent auditor
The statutory auditor, KPMG Bedrijfsrevisoren - Réviseurs d’Entreprises CVBA, represented by Götwin Jackers, has confirmed that their review procedures, which have been substantially completed, have not revealed any significant matters requiring adjustment of the condensed consolidated interim financial information included in this press release as of and for the six months ended June 30, 2020.
TELENET GROUP HOLDING NV - EARNINGS RELEASE FIRST HALF 2020 - 21

4 Telenet Group Holding NV – Consolidated interim operating statistics
As of and for the three months ended June 30, 2020 2019 Change %
Total Services - Combined Network
Homes passed (13) 3,355,200 3,366,100 — %
Video
Basic video (6) 139,900 183,700 (24) %
Enhanced video (7) 1,695,700 1,718,500 (1) %
Total video 1,835,600 1,902,200 (4) %
Internet Residential broadband internet 1,450,100 1,453,900 — %
Business broadband internet 226,400 207,200 9 %
Total broadband internet (8) 1,676,500 1,661,100 1 %
Fixed-line telephony Residential fixed-line telephony 1,056,500 1,104,000 (4) %
Business fixed-line telephony 138,900 130,800 6 %
Total fixed-line telephony (9) 1,195,400 1,234,800 (3) %
Total RGUs (14) 4,707,500 4,798,100 (2) %
Churn (15)
Video 6.8 % 8.6 %
Broadband internet 6.4 % 8.3 %
Fixed-line telephony 7.1 % 10.4 %
Customer relationship information
Triple-play customers 1,098,400 1,128,600 (3) %
Total customer relationships (11) 2,052,200 2,091,600 (2) %
Services per customer relationship (11) 2.29 2.29 — %
ARPU per customer relationship (in € / month) (11) (12) 58.4 57.2 2 %
As of and for the three months ended June 30, 2020 2019 Change %
Mobile statistics
Mobile telephony
Postpaid subscribers 2,394,900 2,282,000 5 %
Prepaid subscribers 400,900 466,300 (14) %
Total mobile subscribers (10) 2,795,800 2,748,300 2 %
Note: Our Q2 2020 quarter-end subscriber numbers included the removal of certain non-paying subscribers in line with our accounting policy, even though we couldn't disconnect such subscribers before July 1, 2020 following specific COVID-19 related regulation imposed by the national telecoms regulator BIPT. In addition, our June 30, 2020 subscriber numbers excluded our former SFR-Coditel customers due to the merger into the Luxembourg cable operator Eltrona.
TELENET GROUP HOLDING NV - EARNINGS RELEASE FIRST HALF 2020 - 22

5 Telenet Group Holding NV – Selected EU IFRS condensed consolidated interim financial statements
5.1 EU IFRS condensed consolidated interim statement of profit or loss and other comprehensive income (unaudited)
(€ in millions, except shares and per share amounts)
For the three months ended For the six months ended
June 30, June 30,
2020 2019 Change % 2020 2019 Change %
Profit for the period
Revenue 619.2 635.6 (3) % 1,272.2 1,261.6 1 %
Expenses
Cost of services provided (332.7) (332.3) — % (701.8) (677.1) 4 %
Gross profit 286.5 303.3 (6) % 570.4 584.5 (2) %
Selling, general & administrative expenses (137.6) (129.6) 6 % (268.3) (259.9) 3 %
Operating profit 148.9 173.7 (14) % 302.1 324.6 (7) %
Finance income 76.6 0.3 25,433 % 27.7 0.5 5,440 %
Net interest income and foreign exchange gain 73.8 0.3 24,500 % 5.0 0.5 900 %
Net gain on derivative financial instruments — — —% 22.7 — 100%
Net gain on extinguishment of debt 2.8 — 100% — — 100%
Finance expenses (180.2) (116.0) 55 % (125.5) (231.2) (46) %
Net interest expense, foreign exchange loss and other finance expenses (51.0) (33.5) 52 % (110.3) (152.5) (28) %
Net loss on derivative financial instruments (129.2) (82.5) 57 % — (78.7) (100) %
Net loss on extinguishment of debt — — —% (15.2) — 100%
Net finance income (expense) (103.6) (115.7) (10) % (97.8) (230.7) (58) %
Share of the result of equity accounted investees 0.9 (0.3) N.M. 1.3 (1.4) N.M.
Gain (loss) on disposal of assets related to a subsidiary or a joint venture (4.3) — 100% (4.3) 0.1 N.M.
Profit before income tax 41.9 57.7 (27) % 201.3 92.6 117 %
Income tax expense (10.2) (15.7) (35) % (16.4) (36.6) (55) %
Profit for the period 31.7 42.0 (25) % 184.9 56.0 230 %
Other comprehensive income (loss) for the period, net of income taxItems that will not be reclassified to profit or lossRemeasurements of defined benefit liability/(asset), net of tax (12.5) — 100% (12.5) — 100%
Other comprehensive income for the period, net of income tax (12.5) — 100% (12.5) — 100%
Total comprehensive income for the period 19.2 42.0 (54) % 172.4 56.0 208 %
Profit attributable to: 31.7 42.0 (25) % 184.9 56.0 230 %Owners of the Company 31.9 42.0 (24) % 185.2 55.9 231 %
Non-controlling interests (0.2) — 100% (0.3) 0.1 N.M.
Total comprehensive income for the period, attributable to: 19.2 42.0 (54) % 172.4 56.0 208 %Owners of the Company 19.4 42.0 (54) % 172.7 55.9 209 %
Non-controlling interests (0.2) — 100% (0.3) 0.1 N.M.
TELENET GROUP HOLDING NV - EARNINGS RELEASE FIRST HALF 2020 - 23

(€ in millions, except shares and per share amounts)
For the three months ended For the six months ended
June 30, June 30,
2020 2019 Change % 2020 2019 Change %
Weighted average shares outstanding 109,043,372 109,613,988 109,545,183 110,014,822
Basic earnings per share 0.30 0.38 (21) % 1.69 0.51 231 %
Diluted earnings per share 0.30 0.38 (21) % 1.69 0.51 231 %
Revenue by Nature
Subscription revenue:
Video 139.6 143.0 (2) % 284.0 287.9 (1) %
Broadband internet 163.3 161.9 1 % 323.5 323.1 — %
Fixed-line telephony 57.0 54.2 5 % 113.8 109.8 4 %
Cable subscription revenue 359.9 359.1 — % 721.3 720.8 — %Mobile telephony 109.4 110.1 (1) % 223.0 217.3 3 %
Total subscription revenue 469.3 469.2 — % 944.3 938.1 1 %Business services 48.3 50.6 (5) % 98.3 102.7 (4) %
Other 101.6 115.8 (12) % 229.6 220.8 4 %
Total Revenue 619.2 635.6 (3) % 1,272.2 1,261.6 1 %
Expenses by Nature
Network operating expenses (46.4) (47.6) (3) % (100.7) (101.9) (1) %
Direct costs (programming, copyrights, interconnect and other) (112.2) (128.3) (13) % (242.5) (255.3) (5) %
Staff-related expenses (64.5) (63.9) 1 % (133.2) (128.4) 4 %
Sales and marketing expenses (18.8) (20.9) (10) % (40.0) (44.4) (10) %
Outsourced labor and professional services (4.8) (8.4) (43) % (14.3) (17.4) (18) %
Other indirect expenses (20.1) (21.2) (5) % (43.5) (49.4) (12) %
Restructuring charges (4.0) (0.7) 471 % (5.0) (1.1) 355 %
Post measurement period adjustments related to business acquisitions 0.6 — 100% 0.6 — 100%
Operating charges related to acquisitions or divestitures (0.6) (0.2) 200 % (1.7) (0.6) 183 %
Share-based payments granted to directors and employees (6.2) (4.4) 41 % (8.0) (6.9) 16 %
Depreciation (112.4) (105.3) 7 % (213.1) (208.8) 2 %
Amortization (46.5) (42.5) 9 % (92.3) (84.5) 9 %
Amortization of broadcasting rights (16.5) (19.0) (13) % (56.1) (39.0) 44 %
Impairment of long-lived assets - Intangible assets and goodwill (18.5) — 100% (21.3) — 100%
Gain on disposal of subsidiaries 0.9 0.6 50 % 3.0 1.0 200 %
Impairment of long-lived assets - Property and equipment (0.3) (0.1) 200 % (2.0) (0.3) 567 %
Total Expenses (470.3) (461.9) 2 % (970.1) (937.0) 4 %
N.M. - Not Meaningful
TELENET GROUP HOLDING NV - EARNINGS RELEASE FIRST HALF 2020 - 24

5.2 EU IFRS condensed consolidated interim statement of cash flows (unaudited)
(€ in millions)
For the three months ended For the six months ended
June 30, June 30,
2020 2019 Change % 2020 2019 Change %
Cash flows from operating activitiesProfit for the period 31.7 42.0 (25) % 184.9 56.0 230 %
Depreciation, amortization, impairment and restructuring charges 197.2 167.0 18 % 386.7 332.7 16 %
Working capital changes and other non cash items (48.3) 4.5 N.M. (16.3) 102.2 N.M.
Income tax expense 10.2 15.7 (35) % 16.4 36.6 (55) %
Net interest expense, foreign exchange loss and other finance expenses (22.7) 34.9 N.M. 105.4 152.5 (31) %
Net loss (gain) on derivative financial instruments 129.2 82.5 57 % (22.7) 78.7 N.M.
Loss (gain) on extinguishment of debt (2.9) — 100% 15.1 — 100%
Loss (gain) on disposal of assets related to a subsidiary or a joint venture 4.3 — 100% 4.3 (0.1) (4,400) %
Cash interest expenses and cash derivatives (9.3) (11.0) (15) % (101.6) (101.1) — %
Income taxes paid (0.2) (1.9) (89) % (0.5) (158.3) (100) %
Net cash from operating activities 289.2 333.7 (13) % 571.7 499.2 15 %
Cash flows from investing activitiesPurchases of property and equipment (72.6) (61.6) 18 % (144.1) (134.7) 7 %
Purchases of intangibles (42.1) (26.7) 58 % (88.1) (56.2) 57 %
Acquisitions of and loans to equity accounted investees (20.3) (0.7) 2,800 % (20.5) (0.9) 2,178 %
Acquisition of subsidiaries, net of cash acquired (3.5) (16.0) (78) % (3.5) (16.0) (78) %
Proceeds from sale of property and equipment 0.5 0.7 (29) % 0.8 1.2 (33) %
Net cash used in investing activities (138.0) (104.3) 32 % (255.4) (206.6) 24 %
Cash flows from financing activities
Repayments of loans and borrowings (195.3) (185.4) 5 % (332.8) (379.2) (12) %
Proceeds from loans and borrowings 143.6 56.9 152 % 225.4 211.2 7 %
Repurchase of own shares (5.4) (50.7) (89) % (34.4) (101.1) (66) %
Sale of own shares — 37.6 (100) % — 43.8 (100) %
Payments related to capital reductions and dividends (142.3) — 100% (142.3) — 100%
Payments for debt issuance costs (2.8) — 100% (13.4) — 100%
Other financing activities (incl. leases) (15.1) 4.5 N.M. (48.8) (16.0) 205 %
Net cash used in financing activities (217.3) (137.1) 58 % (346.3) (241.3) 44 %
Net increase (decrease) in cash and cash equivalentsCash at beginning of period 137.5 47.2 191 % 101.4 88.2 15 %
Cash at end of period 71.4 139.5 (49) % 71.4 139.5 (49) %
Net cash generated (used) (66.1) 92.3 N.M. (30.0) 51.3 N.M.
TELENET GROUP HOLDING NV - EARNINGS RELEASE FIRST HALF 2020 - 25
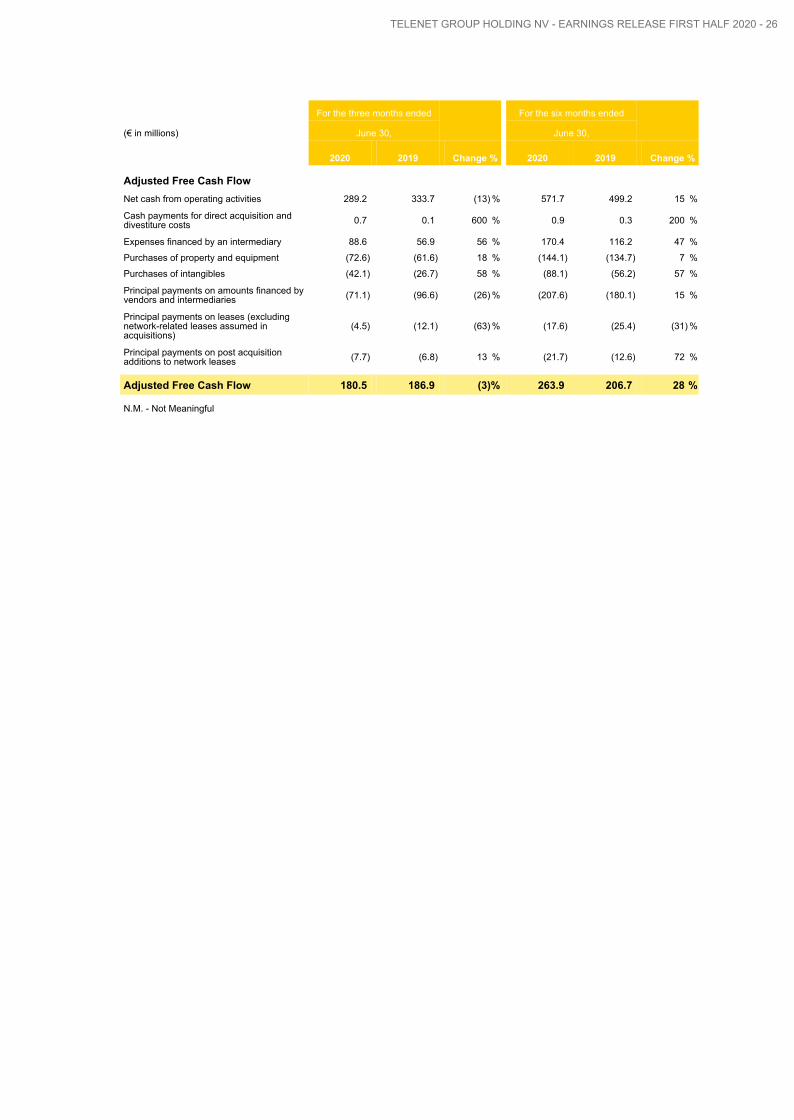
(€ in millions)
For the three months ended For the six months ended
June 30, June 30,
2020 2019 Change % 2020 2019 Change %
Adjusted Free Cash FlowNet cash from operating activities 289.2 333.7 (13) % 571.7 499.2 15 %
Cash payments for direct acquisition and divestiture costs 0.7 0.1 600 % 0.9 0.3 200 %
Expenses financed by an intermediary 88.6 56.9 56 % 170.4 116.2 47 %
Purchases of property and equipment (72.6) (61.6) 18 % (144.1) (134.7) 7 %
Purchases of intangibles (42.1) (26.7) 58 % (88.1) (56.2) 57 %
Principal payments on amounts financed by vendors and intermediaries (71.1) (96.6) (26) % (207.6) (180.1) 15 %
Principal payments on leases (excluding network-related leases assumed in acquisitions)
(4.5) (12.1) (63) % (17.6) (25.4) (31) %
Principal payments on post acquisition additions to network leases (7.7) (6.8) 13 % (21.7) (12.6) 72 %
Adjusted Free Cash Flow 180.5 186.9 (3) % 263.9 206.7 28 %
N.M. - Not Meaningful
TELENET GROUP HOLDING NV - EARNINGS RELEASE FIRST HALF 2020 - 26

5.3 EU IFRS condensed consolidated interim statement of financial position (unaudited)
(€ in millions)
June 30, December 31,Change
2020 2019 - Restated
ASSETS
Non-current Assets:Property and equipment 2,319.1 2,366.8 (47.7)
Goodwill 1,832.9 1,874.1 (41.2)
Other intangible assets 718.4 797.1 (78.7)
Deferred tax assets 211.1 261.4 (50.3)
Investments in and loans to equity accounted investees 79.1 16.3 62.8
Other investments 6.1 6.1 —
Derivative financial instruments 111.7 55.3 56.4
Other assets 20.7 27.9 (7.2)
Total non-current assets 5,299.1 5,405.0 (105.9)
Current Assets:Inventories 32.5 25.2 7.3
Trade receivables 194.0 204.5 (10.5)
Other current assets 135.7 130.4 5.3
Cash and cash equivalents 71.4 101.4 (30.0)
Derivative financial instruments 45.2 61.7 (16.5)
478.8 523.2 (44.4) Assets held for sale 29.9 — 29.9
Total current assets 508.7 523.2 (14.5)
TOTAL ASSETS 5,807.8 5,928.2 (120.4)
TELENET GROUP HOLDING NV - EARNINGS RELEASE FIRST HALF 2020 - 27

(€ in millions)
June 30, December 31,Change
2020 2019 - Restated
EQUITY AND LIABILITIES
Equity:Share capital 12.8 12.8 —
Share premium 80.7 80.7 —
Other reserves 666.1 695.7 (29.6)
Retained loss (2,244.9) (2,287.8) 42.9
Remeasurements (26.0) (13.5) (12.5)
Total equity attributable to owners of the Company (1,511.3) (1,512.1) 0.8 Non-controlling interests 25.2 25.1 0.1
Total equity (1,486.1) (1,487.0) 0.9
Non-current Liabilities:Loans and borrowings 5,144.9 5,206.0 (61.1)
Derivative financial instruments 283.0 261.4 21.6
Deferred revenue 3.5 3.8 (0.3)
Deferred tax liabilities 126.5 178.7 (52.2)
Other non-current liabilities 73.5 63.1 10.4
Provisions 15.6 17.6 (2.0)
Total non-current liabilities 5,647.0 5,730.6 (83.6)
Current Liabilities:Loans and borrowings 515.5 527.0 (11.5)
Trade payables 196.1 247.7 (51.6)
Accrued expenses and other current liabilities 409.0 418.4 (9.4)
Provisions 80.8 70.9 9.9
Deferred revenue 121.3 107.8 13.5
Derivative financial instruments 70.8 69.5 1.3
Current tax liability 248.4 243.3 5.1
1,641.9 1,684.6 (42.7) Liabilities directly associated with the assets held for sale 5.0 — 5.0
Total current liabilities 1,646.9 1,684.6 (37.7)
Total liabilities 7,293.9 7,415.2 (121.3)
TOTAL EQUITY AND LIABILITIES 5,807.8 5,928.2 (120.4)
TELENET GROUP HOLDING NV - EARNINGS RELEASE FIRST HALF 2020 - 28

6 Appendix6.1 Reconciliation reported versus rebased financial information
(unaudited)
(€ in millions)Reported
Acquisition impact De Vijver Media NV and divestment Coditel
S.à r.l.Rebased
Q1 2019 Q2 2019 H1 2019 Q1 2019 Q2 2019 H1 2019 Q1 2019 Q2 2019 H1 2019
Revenue by natureVideo 144.9 143.0 287.9 — (1.3) (1.3) 144.9 141.7 286.6
Broadband internet 161.2 161.9 323.1 — (0.2) (0.2) 161.2 161.7 322.9
Fixed-line telephony 55.6 54.2 109.8 — (0.1) (0.1) 55.6 54.1 109.7
Cable subscription revenue 361.7 359.1 720.8 — (1.6) (1.6) 361.7 357.5 719.2
Mobile telephony 107.2 110.1 217.3 — (0.1) (0.1) 107.2 110.0 217.2
Total subscription revenue 468.9 469.2 938.1 — (1.7) (1.7) 468.9 467.5 936.4
Business services 52.1 50.6 102.7 — (0.4) (0.4) 52.1 50.2 102.3
Other 105.0 115.8 220.8 27.5 21.0 48.5 132.5 136.8 269.3
Total Revenue 626.0 635.6 1,261.6 27.5 18.9 46.4 653.5 654.5 1,308.0
Operating expenses by NatureNetwork operating expenses (54.3) (47.6) (101.9) — 0.2 0.2 (54.3) (47.4) (101.7)
Direct costs (programming, copyrights, interconnect and other)
(127.0) (128.3) (255.3) (6.1) (6.5) (12.6) (133.1) (134.8) (267.9)
Staff-related expenses (64.5) (63.9) (128.4) (4.9) (3.5) (8.4) (69.4) (67.4) (136.8)
Sales and marketing expenses (23.5) (20.9) (44.4) (2.3) (1.0) (3.3) (25.8) (21.9) (47.7)
Outsourced labor and professional services (9.0) (8.4) (17.4) — — — (9.0) (8.4) (17.4)
Other indirect expenses (28.2) (21.2) (49.4) (1.3) 0.1 (1.2) (29.5) (21.1) (50.6) Total operating expenses (306.5) (290.3) (596.8) (14.6) (10.7) (25.3) (321.1) (301.0) (622.1)
Adjusted EBITDA 319.5 345.3 664.8 12.9 8.2 21.1 332.4 353.5 685.9
Adjusted EBITDA margin 51.0 % 54.3 % 52.7 % 50.9 % 54.0 % 52.4 %
Rebased information: For purposes of calculating rebased growth rates on a comparable basis for the three months ended June 30, 2020 and the six months ended June 30, 2020, we have adjusted our historical revenue and Adjusted EBITDA to (i) include the pre-acquisition revenue and Adjusted EBITDA of De Vijver Media (fully consolidated since June 3, 2019) in our rebased amounts and (ii) exclude the revenue and Adjusted EBITDA of our former Luxembourg cable subsidiary Coditel S.à r.l. (deconsolidated as of April 1, 2020) from our rebased amounts for the three months ended June 30, 2019 and the six months ended June 30, 2019 to the same extent that the revenue and Adjusted EBITDA of such entities was included in or excluded from our results for the three months ended June 30, 2020 and the six months ended June 30, 2020. We have reflected the revenue and Adjusted EBITDA of these entities in our 2019 rebased amounts based on what we believe to be the most reliable information that is currently available to us (generally pre-acquisition financial statements), as adjusted for the estimated effects of (a) any significant differences between our accounting policies and those of the acquired entities, (b) any significant effects of acquisition accounting adjustments, and (c) other items we deem appropriate. We do not adjust pre-acquisition periods to eliminate nonrecurring items or to give retroactive effect to any changes in estimates that might be implemented during post-acquisition periods. As we did not own or operate the acquired businesses during the pre-acquisition periods, no assurance can be given that we have identified all adjustments necessary to present the revenue and Adjusted EBITDA of these entities on a basis that is comparable to the
TELENET GROUP HOLDING NV - EARNINGS RELEASE FIRST HALF 2020 - 29

corresponding post-acquisition amounts that are included in our historical results or that the pre-acquisition financial statements we have relied upon do not contain undetected errors. In addition, the rebased growth percentages are not necessarily indicative of the revenue and Adjusted EBITDA that would have occurred if these transactions had occurred on the dates assumed for purposes of calculating our rebased amounts or the revenue and Adjusted EBITDA that will occur in the future. The rebased growth percentages have been presented as a basis for assessing growth rates on a comparable basis. Rebased growth is a non-GAAP measure as contemplated by the U.S. Securities and Exchange Commission's Regulation G and is an additional measure used by management to demonstrate the Company’s underlying performance and should not replace the measures in accordance with EU IFRS as an indicator of the Company’s performance, but rather should be used in conjunction with the most directly comparable EU IFRS measure.
TELENET GROUP HOLDING NV - EARNINGS RELEASE FIRST HALF 2020 - 30

6.2 Reconciliation between profit for the period and Consolidated Annualized EBITDA (unaudited)
Net total leverage, which is a non-GAAP measure as contemplated by the U.S. Securities and Exchange Commission’s Regulation G, is defined as the sum of loans and borrowings under current and non-current liabilities minus cash and cash equivalents ("Net Total Debt"), as recorded in the Company's statement of financial position, divided by the last two quarters' Consolidated Annualized Adjusted EBITDA. In its statement of financial position, Telenet's USD-denominated debt has been converted into € using the June 30, 2020 EUR/USD exchange rate. As Telenet has entered into several derivative transactions to hedge both the underlying floating interest rate and exchange risks, the €-equivalent hedged amounts were €2,041.5 million (USD 2,295.0 million Term Loan AR) and €882.8 million (USD 1.0 billion Senior Secured Notes due 2028), respectively. For the calculation of its net leverage ratio, Telenet uses the €-equivalent hedged amounts given the underlying economic risk exposure.
The following table provides a reconciliation of L2QA Profit for the period to L2QA Adjusted EBITDA.
(€ in millions)For the three months
endedFor the six months
endedLast two quarters'
annualized
March 31, 2020
June 30, 2020 June 30, 2020 June 30, 2020
Profit for the period 153.2 31.7 184.9 369.8
Income tax expense 6.2 10.2 16.4 32.8
Share of the result of equity accounted investees (0.4) (0.9) (1.3) (2.6) Loss (gain) on disposal of assets related to a subsidiary or a joint venture — 4.3 4.3 8.6
Net finance expense (income) (5.8) 103.6 97.8 195.6
Depreciation, amortization, impairment and gain on disposal of subsidiaries 188.5 193.3 381.8 763.6
EBITDA 341.7 342.2 683.9 1,367.8
Share based compensation 1.8 6.2 8.0 16.0
Operating charges related to acquisitions or divestitures 1.1 0.6 1.7 3.4
Restructuring charges 1.0 4.0 5.0 10.0
Post measurement period adjustments related to business acquisitions — (0.6) (0.6) (1.2)
Adjusted EBITDA 345.6 352.4 698.0 1,396.0 Adjusted EBITDA margin 52.9 % 56.9 % 54.9 % 54.9 %
Net profit margin 23.5 % 5.1 % 14.5 % 14.5 %
TELENET GROUP HOLDING NV - EARNINGS RELEASE FIRST HALF 2020 - 31

6.3 Definitions
(1) For purposes of calculating rebased growth rates on a comparable basis for the three months ended June 30, 2020 and the six months ended June 30, 2020, we have adjusted our historical revenue and Adjusted EBITDA to (i) include the pre-acquisition revenue and Adjusted EBITDA of De Vijver Media (fully consolidated since June 3, 2019) in our rebased amounts and (ii) exclude the revenue and Adjusted EBITDA of our former Luxembourg cable subsidiary Coditel S.à r.l. (deconsolidated as of April 1, 2020) from our rebased amounts for the three months ended June 30, 2019 and the six months ended June 30, 2019 to the same extent that the revenue and Adjusted EBITDA of such entities was included in or excluded from our results for the three months ended June 30, 2020 and the six months ended June 30, 2020. We have reflected the revenue and Adjusted EBITDA of these entities in our 2019 rebased amounts based on what we believe to be the most reliable information that is currently available to us (generally pre-acquisition financial statements), as adjusted for the estimated effects of (a) any significant differences between our accounting policies and those of the acquired entities, (b) any significant effects of acquisition accounting adjustments, and (c) other items we deem appropriate. We do not adjust pre-acquisition periods to eliminate nonrecurring items or to give retroactive effect to any changes in estimates that might be implemented during post-acquisition periods. As we did not own or operate the acquired businesses during the pre-acquisition periods, no assurance can be given that we have identified all adjustments necessary to present the revenue and Adjusted EBITDA of these entities on a basis that is comparable to the corresponding post-acquisition amounts that are included in our historical results or that the pre-acquisition financial statements we have relied upon do not contain undetected errors. In addition, the rebased growth percentages are not necessarily indicative of the revenue and Adjusted EBITDA that would have occurred if these transactions had occurred on the dates assumed for purposes of calculating our rebased amounts or the revenue and Adjusted EBITDA that will occur in the future. The rebased growth percentages have been presented as a basis for assessing growth rates on a comparable basis. Rebased growth is a non-GAAP measure as contemplated by the U.S. Securities and Exchange Commission's Regulation G and is an additional measure used by management to demonstrate the Company’s underlying performance and should not replace the measures in accordance with EU IFRS as an indicator of the Company’s performance, but rather should be used in conjunction with the most directly comparable EU IFRS measure.
(2) EBITDA is defined as profit before net finance expense, the share of the result of equity accounted investees, income taxes, depreciation, amortization and impairment. Adjusted EBITDA is defined as EBITDA before stock-based compensation, post measurement period adjustments related to business acquisitions and restructuring charges, and before operating charges or credits related to successful or unsuccessful acquisitions or divestitures. Operating charges or credits related to acquisitions or divestitures include (i) gains and losses on the disposition of long-lived assets, (ii) due diligence, legal, advisory and other third-party costs directly related to the Company’s efforts to acquire or divest controlling interests in businesses, and (iii) other acquisition-related items, such as gains and losses on the settlement of contingent consideration. Adjusted EBITDA is a non-GAAP measure as contemplated by the U.S. Securities and Exchange Commission’s Regulation G and represents an additional measure used by management to demonstrate the Company’s underlying performance and should not replace the measures in accordance with EU IFRS as an indicator of the Company’s performance, but rather should be used in conjunction with the most directly comparable EU IFRS measure. A reconciliation of this measure to the most directly comparable EU IFRS measure is disclosed in Exhibit 1 on page 14.
(3) Accrued capital expenditures are defined as additions to property, equipment and intangible assets, including additions from capital leases and other financing arrangements, as reported in the Company’s consolidated statement of financial position on an accrued basis.
(4) Operating Free Cash Flow (“OFCF”) is defined as Adjusted EBITDA minus accrued capital expenditures as reported in the Company’s consolidated financial statements. Accrued capital expenditures exclude the recognition of football broadcasting rights and mobile spectrum licenses. Operating Free Cash Flow is a non-GAAP measure as contemplated by the U.S. Securities and Exchange Commission’s Regulation G and represents an additional measure used by management to demonstrate the Company’s underlying performance and should not replace the measures in accordance with EU IFRS as an indicator of the Company’s performance, but rather should be used in conjunction with the most directly comparable EU IFRS measure.
(5) Adjusted Free Cash Flow is defined as net cash provided by the Company’s operating activities, plus (i) cash payments for third-party costs directly associated with successful and unsuccessful acquisitions and divestitures and (ii) expenses financed by an intermediary, less (i) purchases of property and equipment and purchases of intangibles as reported in the Company's consolidated statement of cash flows, (ii) principal payments on amounts financed by vendors and intermediaries, (iii) principal payments on capital leases (exclusive of network-related leases that were assumed in acquisitions), and (iv) principal payments on post acquisition additions to network leases, each as reported in the Company’s consolidated statement of cash flows. Adjusted Free Cash Flow is a non-GAAP measure as contemplated by the U.S. Securities and Exchange Commission's Regulation G and is an additional measure used by management to demonstrate the Company’s ability to service debt and fund new investment opportunities and should not replace the measures in accordance with EU IFRS as an indicator of the Company’s performance, but rather should be used in conjunction with the most directly comparable EU IFRS measure.
(6) Basic Video Subscriber is a home, residential multiple dwelling unit or commercial unit that receives Telenet's video service over the Combined Network either via an analog video signal or via a digital video signal without subscribing to any recurring monthly service that requires the use of encryption-enabling technology. Encryption-enabling technology includes smart cards, or other integrated or virtual technologies that Telenet uses to provide its enhanced service offerings. Telenet counts Revenue Generating Unites (“RGUs”) on a unique premises basis. In other words, a subscriber with multiple outlets in one premise is counted as one RGU and a subscriber with two homes and a subscription to Telenet's video service at each home is counted as two RGUs.
TELENET GROUP HOLDING NV - EARNINGS RELEASE FIRST HALF 2020 - 32

(7) Enhanced Video Subscriber is a home, residential multiple dwelling unit or commercial unit that receives Telenet's video service over the Combined Network via a digital video signal while subscribing to any recurring monthly service that requires the use of encryption-enabling technology. Enhanced Video Subscribers are counted on a unique premises basis. For example, a subscriber with one or more set-top boxes that receives Telenet's video service in one premise is generally counted as just one subscriber. An Enhanced Video Subscriber is not counted as a Basic Video Subscriber. As Telenet migrates customers from basic to enhanced video services, Telenet reports a decrease in its Basic Video Subscribers equal to the increase in Telenet's Enhanced Video Subscribers.
(8) Internet Subscriber is a home, residential multiple dwelling unit or commercial unit that receives internet services over the Combined Network.
(9) Fixed-line Telephony Subscriber is a home, residential multiple dwelling unit or commercial unit that receives fixed-line voice services over the Combined Network. Fixed-line telephony Subscribers exclude mobile telephony subscribers.
(10) Telenet's mobile subscriber count represents the number of active subscriber identification module (“SIM”) cards in service rather than services provided. For example, if a mobile subscriber has both a data and voice plan on a smartphone this would equate to one mobile subscriber. Alternatively, a subscriber who has a voice and data plan for a mobile handset and a data plan for a laptop (via a dongle) would be counted as two mobile subscribers. Customers who do not pay a recurring monthly fee are excluded from Telenet's mobile telephony subscriber counts after a 90-day inactivity period.
(11) Customer Relationships are the number of customers who receive at least one of Telenet's video, internet or telephony services that Telenet counts as RGUs, without regard to which or to how many services they subscribe. Customer Relationships generally are counted on a unique premises basis. Accordingly, if an individual receives Telenet's services in two premises (e.g. a primary home and a vacation home), that individual generally will count as two Customer Relationships. Telenet excludes mobile-only customers from Customer Relationships.
(12) Average Revenue Per Unit (“ARPU”) refers to the average monthly subscription revenue per average customer relationship and is calculated by dividing the average monthly subscription revenue (excluding mobile services, Business-to-Business ("B2B") services, interconnect, channel carriage fees, mobile handset sales and installation fees) for the indicated period, by the average of the opening and closing balances for customer relationships for the period.
(13) Homes Passed are homes, residential multiple dwelling units or commercial units that can be connected to the Combined Network without materially extending the distribution plant. Telenet's Homes Passed counts are based on census data that can change based on either revisions to the data or from new census results.
(14) RGU is separately a Basic Video Subscriber, Enhanced Video Subscriber, Internet Subscriber or Fixed-line Telephony Subscriber. A home, residential multiple dwelling unit, or commercial unit may contain one or more RGUs. For example, if a residential customer subscribed to Telenet's enhanced video service, fixed-line telephony service and broadband internet service, the customer would constitute three RGUs. Total RGUs is the sum of Basic Video, Enhanced Video, Internet and Fixed-line Telephony Subscribers. RGUs generally are counted on a unique premises basis such that a given premises does not count as more than one RGU for any given service. On the other hand, if an individual receives one of Telenet's services in two premises (e.g. a primary home and a vacation home), that individual will count as two RGUs for that service. Each bundled cable, internet or fixed-line telephony service is counted as a separate RGU regardless of the nature of any bundling discount or promotion. Non-paying subscribers are counted as subscribers during their free promotional service period. Some of these subscribers may choose to disconnect after their free service period. Services offered without charge on a long-term basis (e.g. VIP subscribers, free service to employees) generally are not counted as RGUs. Telenet does not include subscriptions to mobile services in its externally reported RGU counts.
(15) Customer Churn represents the rate at which customers relinquish their subscriptions. The annual rolling average basis is calculated by dividing the number of disconnects during the preceding 12 months by the average number of customer relationships. For the purpose of computing churn, a disconnect is deemed to have occurred if the customer no longer receives any level of service from Telenet and is required to return Telenet's equipment. A partial product downgrade, typically used to encourage customers to pay an outstanding bill and avoid complete service disconnection is not considered to be disconnected for purposes of Telenet's churn calculations. Customers who move within Telenet's cable footprint and upgrades and downgrades between services are also excluded from the disconnect figures used in the churn calculation.
(16) Telenet's ARPU per mobile subscriber calculation that excludes interconnect revenue refers to the average monthly mobile subscription revenue per average mobile subscribers in service and is calculated by dividing the average monthly mobile subscription revenue (excluding activation fees, handset sales and late fees) for the indicated period, by the average of the opening and closing balances of mobile subscribers in service for the period. Telenet's ARPU per mobile subscriber calculation that includes interconnect revenue increases the numerator in the above-described calculation by the amount of mobile interconnect revenue during the period.
(17) Net total leverage is defined as the sum of loans and borrowings under current and non-current liabilities minus cash and cash equivalents ("Net Total Debt"), as recorded in the Company's statement of financial position, divided by the last two quarters' Consolidated Annualized Adjusted EBITDA. In its statement of financial position, Telenet's USD-denominated debt has been converted into € using the June 30, 2020 EUR/USD exchange rate. As Telenet has entered into several derivative transactions to hedge both the underlying floating interest rate and exchange risks, the €-equivalent hedged amounts were €2,041.5 million (USD 2,295.0 million Term Loan AR) and €882.8 million (USD 1.0 billion Senior Secured Notes due 2028), respectively. For the calculation of its net leverage ratio, Telenet uses the €-equivalent hedged amounts given the underlying economic risk exposure. Net total leverage is a non-GAAP measure as contemplated by the U.S. Securities and Exchange Commission's Regulation G.
TELENET GROUP HOLDING NV - EARNINGS RELEASE FIRST HALF 2020 - 33

(18) Net covenant leverage is calculated as per the 2020 Amended Senior Credit Facility definition, using Net Total Debt (using the €-equivalent hedged amounts for its USD-denominated debt as highlighted above), excluding (i) subordinated shareholder loans, (ii) capitalized elements of indebtedness under the Clientele and Annuity Fees, (iii) any finance leases entered into on or prior to August 1, 2007, (iv) any indebtedness incurred under the network lease entered into with the pure intermunicipalities, (v) any vendor financing-related liabilities, and including (vi) the Credit Facility Excluded Amount (which is the greater of (a) €400.0 million and (b) 0.25x Consolidated Annualized Adjusted EBITDA), divided by last two quarters’ Consolidated Annualized Adjusted EBITDA.
Contacts
Investor Relations: Rob Goyens [email protected] Phone: +32 15 333 054
Bart Boone [email protected] Phone: +32 15 333 738
Press & Media Relations: Stefan Coenjaerts [email protected] Phone: +32 15 335 006
About Telenet – As a provider of entertainment and telecommunication services in Belgium, Telenet Group is always looking for the perfect experience in the digital world for its customers. Under the brand name Telenet, the company focuses on offering digital television, high-speed Internet and fixed and mobile telephony services to residential customers in Flanders and Brussels. Under the brand name BASE, it supplies mobile telephony in Belgium. The Telenet Business department serves the business market in Belgium and Luxembourg with connectivity, hosting and security solutions. More than 3,000 employees have one aim in mind: making living and working easier and more pleasant. Telenet Group is part of Telenet Group Holding NV and is quoted on Euronext Brussel under ticker symbol TNET. For more information, visit www.telenet.be. Liberty Global - one of the world’s leading converged video, broadband and communications companies, innovating and empowering people in six countries across Europe to make the most of the digital revolution – owns a direct stake of 58.3% in Telenet Group Holding NV (excluding any treasury shares held by the latter from time to time).
Additional Information – Additional information on Telenet and its products can be obtained from the Company’s website https://www.telenet.be. Further information regarding the operating and financial data presented herein can be downloaded from the investor relations pages of this website. The Company’s Consolidated Annual Report 2019 as well as unaudited condensed consolidated interim financial statements and presentations related to the financial results for the six months ended June 30 have been made available on the investor relations pages of the Company’s website (https://investors.telenet.be).
Safe Harbor Statement under the U.S. Private Securities Litigation Reform Act of 1995 – Various statements contained in this document constitute “forward-looking statements” as that term is defined under the U.S. Private Securities Litigation Reform Act of 1995. Words like “believe,” “anticipate,” “should,” “intend,” “plan,” “will,” “expects,” “estimates,” “projects,” “positioned,” “strategy,” and similar expressions identify these forward-looking statements related to our financial and operational outlook; future growth prospects; strategies; product, network and technology launches and expansion and the anticipated impact of acquisitions on our combined operations and financial performance, which involve known and unknown risks, uncertainties and other factors that may cause our actual results, performance or achievements or industry results to be materially different from those contemplated, projected, forecasted, estimated or budgeted whether expressed or implied, by these forward-looking statements. These factors include: potential adverse developments with respect to our liquidity or results of operations; potential adverse competitive, economic or regulatory developments; the potential adverse impact of the recent outbreak of the novel cornoavirus (COVID-19) pandemic, our significant debt payments and other contractual commitments; our ability to fund and execute our business plan; our ability to generate cash sufficient to service our debt; interest rate and currency exchange rate fluctuations; the impact of new business opportunities requiring significant up-front investments; our ability to attract and retain customers and increase our overall market penetration; our ability to compete against other communications and content distribution businesses; our ability to maintain contracts that are critical to our operations; our ability to respond adequately to technological developments; our ability to develop and maintain back-up for our critical systems; our ability to continue to design networks, install facilities, obtain and maintain any required governmental licenses or approvals and finance construction and development, in a timely manner at reasonable costs and on satisfactory terms and conditions; our ability to have an impact upon, or to respond effectively to, new or modified laws or regulations; our ability to make value-accretive investments; and our ability to sustain or increase shareholder distributions in future periods. We assume no obligation to update these forward-looking statements contained herein to reflect actual results, changes in assumptions or changes in factors affecting these statements.
Financial Information – The consolidated annual financial statements of Telenet Group Holding as of and for the year ended December 31, 2019 have been prepared in accordance with EU IFRS unless otherwise stated and have been made available on the Company’s website.
Non-GAAP measures –Adjusted EBITDA, Operating Free Cash Flow, Adjusted Free Cash Flow and net total leverage are non-GAAP measures as contemplated by the U.S. Securities and Exchange Commission’s Regulation G. For related definitions and reconciliations, see the Investor Relations section of the Liberty Global plc website (https://www.libertyglobal.com). Liberty Global plc is the Company’s controlling shareholder.
This document has been released on July 30, 2020 at 7:00am CET
TELENET GROUP HOLDING NV - EARNINGS RELEASE FIRST HALF 2020 - 34