press release for immediate release:contact: roseanne pawelec, tuesday, july 23, 2002(617) 624-5006...
TRANSCRIPT
Press Release
FOR IMMEDIATE RELEASE: CONTACT: Roseanne Pawelec,
Tuesday, July 23, 2002 (617) 624-5006
NEARLY HALF OF ALL MASSACHUSETTS RESIDENTS OVERWEIGHT OR OBESE
New MDPH Study Finds Obesity Increasing

One out of two Massachusetts adults are either overweight or obese according tonew survey statistics released by the Massachusetts Department of Public Health todayfrom the BRFSS (Behavioral Risk Factor Surveillance System). Over 8,000Massachusetts adults responded to the random telephone survey conducted in the year2000 by MDPH’s Health Surveillance Program.
“Obesity is a preventable epidemic,” said MDPH Commissioner, Dr. HowardKoh. “It erodes our quality of life, causes death and illness and places an enormousfinancial burden on our health care system, “ Dr. Koh added.
The report released today, “Growing Concerns about Obesity Among Adults inMassachusetts: A Statistical Analysis of BRFSS Data,” also indicated:
17% of Massachusetts adults are obese. (A person 5’6” tall is considered obese ifhe/she weighs more than 185 lbs.)
Men are almost 50% more likely to be overweight than women: more than 6 out of 10men (64%) and 4 out of 10 women (42%) were overweight in Massachusetts in 2000.(A person 5’6” tall is considered overweight if he/she weighs more than 155 lbs.)
Persons with less than a high school education are twice as likely as college graduatesto be obese (24% vs. 12%).
The race-sex group with the highest rate of obesity is black women: more than 3 outof 10 black women are obese (31%). Asian men and women have the lowest rate ofobesity.
Although Massachusetts has the 4th lowest level of overweight among all US states,the trends in the Commonwealth and nationwide are alarming: in Massachusetts,overweight increased 30% in the last decade from 40% in 1990 to 52% in 2000).During this time, the increase nationwide was from 45% to 57% (a 27% increase).

In addition to the survey results, MDPH presented data from the Pregnancy andPediatric Nutrition Surveillance Systems on pregnant and postpartum women whoparticipated in the Massachusetts WIC Nutrition Program(WIC) in 1999, and childrenwho participated in WIC in 2001. That data indicated: 43% of the women were either overweight(24%) or obese (19%) prior to their current
pregnancy. 51% of the participants gained more than the recommended amount of weight during
their pregnancy. Asian women were far less likely to be overweight prior to pregnancy (17% compared
to 42% among white non-Hispanic women, 50% among black non-Hispanic womenand 45% among Hispanic women).
Among infants and children between ages 2 and 5:
More than one third of children aged 2 to 5 were either at risk for overweight oralready overweight.
The prevalence of overweight was lowest among Asian children (12% compared to14% among white non-Hispanic, 16% among black non-Hispanic and 21% amongHispanic children).
The data presented will be used by the Massachusetts Department of Public Health tofurther inform and target obesity prevention and education programs to those at greatestrisk

Growing Concerns about Obesity Among Adults in Massachusetts: A Statistical Analysis of BRFSS Data
Health Survey Program
Division of Research and Epidemiology
Bureau of Health Statistics, Research, and Evaluation
Massachusetts Department of Public Health
July 2002
Overweight and obesity may not be infectious
diseases, but they have reached epidemic proportion
in the United States. Overweight and obesity are
increasing in both genders and among all population
groups.
- David Satcher
former U.S. Surgeon General

Morbidity Associated with Obesity
• heart disease
• type 2 diabetes
• hypertension
• elevated incidence of joint and mobility problems
• some types of cancer

What is the BRFSS?
° Random-digit-dial telephone survey
° Adults ages 18 and older
° Joint collaboration between CDC and State Departments of
Health
° Massachusetts BRFSS since 1986
° Data are weighted: provide population-based estimates of
health
° N = 8,149 (year 2000)

BRFSS
TOBACCO
CANCER CONTROL
DRUG &ALCOHOL
SEXUALBEHAVIOR
DOMESTICVIOLENCE BLOOD PRESSURE
AND CHOLESTEROL
NUTRITIONAND EXERCISE
ORAL HEALTH
HEALTH CARE ACCESS
OSTEOPOROSIS
HEIGHT, WEIGHT,WEIGHT CONTROL

How is obesity measured in adults?How is obesity measured in adults?
• Self report on height and weight
• Body Mass Index (BMI): a measure of weight in relation to height
= weight (kg) / height (m) 2
• Classification:
Underweight: BMI < 18.5
Overweight: BMI 25.0-29.9
Obese: BMI > 30.0Note: classification of children is different

Overweight Obese
Height BMI 25.0-29.9 BMI > 30
5’ 128 lbs. 153 lbs.
5’2’’ 136 164
5’4’’ 145 174
5’6’’ 155 186
5’8’’ 164 197
6’ 184 221
Overweight and Obese by Height
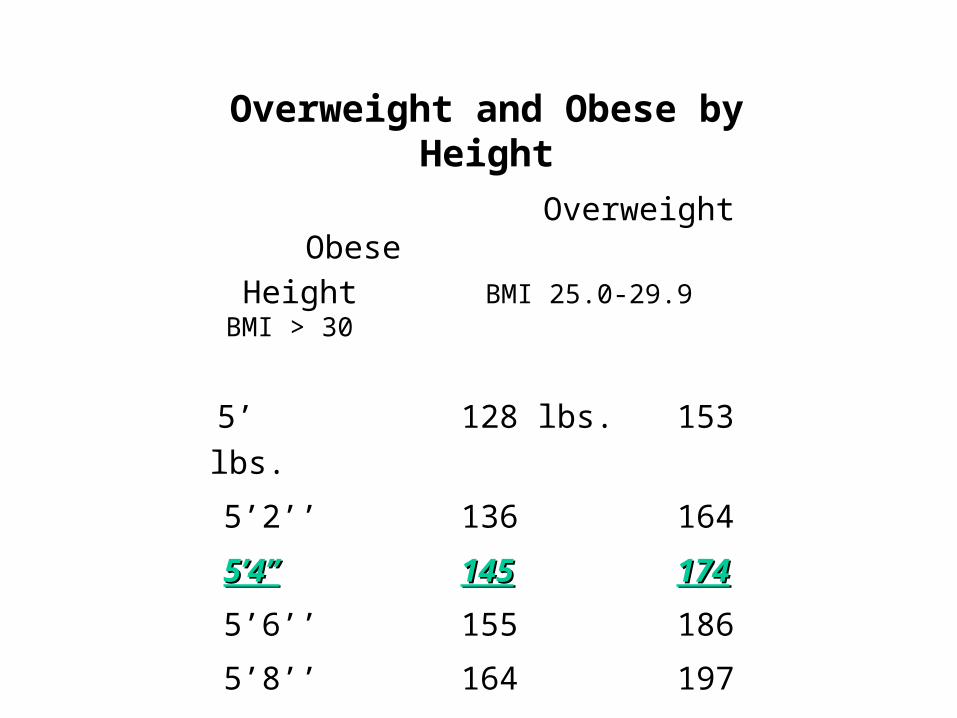
Overweight Obese
Height BMI 25.0-29.9 BMI > 30
5’ 128 lbs. 153 lbs.
5’2’’ 136 164
5’4’’5’4’’ 145145 174174
5’6’’ 155 186
5’8’’ 164 197
6’ 184 221
Overweight and Obese by Height

Percentage Overweight/Obese
and Obese by Sex,
Massachusetts Adults BRFSS 2000
64
18
42
16
0
20
40
60
80
100
Overweight/ obese Obese
Perc
enta
ge
men women

Percentage Overweight/Obese by Sex and Race,
Massachusetts Adults, BRFSS 2000
65 6469
4341
6455
16
0
20
40
60
80
100
White Black Hispanic Asian
Perc
enta
ge
men women

Percentage Obese by Sex and Race,
Massachusetts Adults, BRFSS 2000
1821
17
8
15
31
19
00
10
20
30
40
50
White Black Hispanic Asian
Perc
enta
ge
men women

Percentage Overweight/Obese and Obese by Age,
Massachusetts Adults, BRFSS 2000
3545
5259 60 62
48
913
17 21 21 21
12
0
20
40
60
80
100
18-24 25-34 35-44 45-54 55-64 65-74 75+
perc
enta
ge
Overweight/obese
Obese
Age
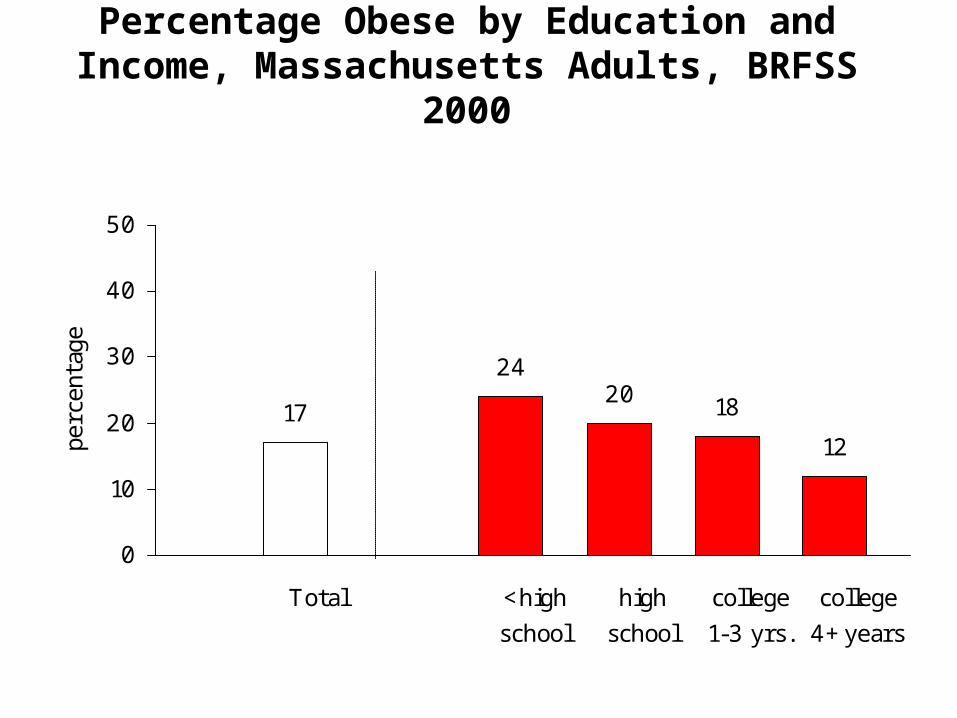
Percentage Obese by Education and Income, Massachusetts Adults, BRFSS 2000
17
2420 18
12
0
10
20
30
40
50
Total < high
school
high
school
college
1-3 yrs.
college
4+ years
perc
enta
ge

Percentage Obese by Education and Income, Massachusetts Adults, BRFSS 2000
1721 19
16 15 13
0
10
20
30
40
50
Tota
l
<$25
,000
$25-3
4,99
9
$35-4
9,99
9
$50-7
4,99
9
$75,000
+
perc
enta
ge

Percentage Obese by Region, Massachusetts Adults, BRFSS 2000
17 17 19 1714
18 17
0
10
20
30
40
50
Total Western Central North
East
Metro
West
South
East
Boston
perc
enta
ge

Percentage Overweight/Obese by Fruit and Vegetable Consumption, Massachusetts Adults,
BRFSS 2000
6758
43 41
0
20
40
60
80
100
1-4 servings 5+ servings 1-4 servings 5+ servings
perc
enta
ge
men women

Percentage Overweight/Obese and Obese by Regular Physical Activity,
Massachusetts Adults, BRFSS 2000
62 65
34
46
1320
1118
0
20
40
60
80
100
regular not regular regular not regular
perc
enta
ge
overweight/ obese
obese
men women

Percentage Overweight/Obese by Smoking Status,
Massachusetts Adults BRFSS 2000
57
37
71
43
63
42
0
20
40
60
80
100
men women
perc
enta
ge
current former never

Percentage Overweight/Obese by Marital Status and Sex,
Massachusetts Adults, BRFSS 2000
61
45
67
41
0
20
40
60
80
100
men women
perc
enta
ge
single married/ unmarried couple

Percentage Overweight/Obese by Presence of Children in Household, Massachusetts Adults,
BRFSS 2000
64 65
4146
0
20
40
60
80
100
no children children no children children
perc
enta
ge
men women

Prevalence of Diabetes among Overweight/Obese,
Massachusetts, Adults BRFSS 2000
7 8
3 3
0
5
10
15
20
25
men women
perc
enta
ge
Overweight/ Obese Not overweight/ obese

Prevalence of CHD/Angina among Overweight/Obese Adults age 40+,
Massachusetts, BRFSS 2000
13
986
0
5
10
15
20
25
men women
perc
enta
ge
Overweight/Obese Not overweight/obese

Trends for Overweight for US and Massachusetts, 1990-2000
0
10
20
30
40
50
60
1990 1991 1992 1993 1994 1995 1996 1997 1998 1999 2000
MA US

How is Massachusetts Doing?
MA % MA Rank HP 2010%
overweight 52 4th N/ A
obese 17 5th 15
Any exercise in past month 76 13th NA
f ruit and vegetable consumption 31 4th NA
current smoker 20 8th 12
Rank: 1=Best, 50=Worst

Summary of Adult Data
• Current obesity epidemic in Massachusetts mirrors national trends
• groups at greater risk include:
– persons with low income or education
– certain racial ethnic groups
– more sedentary adults
• BRFSS data should be used to inform policy and develop
prevention and treatment approaches
Growing Concerns about Obesity in Massachusetts during Pregnancy and
Early Childhood: A Statistical Analysis of
WIC PNSS and PedNSS Data
Bureau of Family and Community Health,
Massachusetts Department of Public HealthJuly 23, 2002

Massachusetts WIC Program
• Preventive nutrition program with benefits that include supplemental nutritious foods, nutrition education, and referrals to health care
• Pregnant or postpartum women, infants, and children up to age 5 who are at "nutritional risk" and meet income guidelines are eligible
• Massachusetts WIC Program annually serves approx. 33,000 women, and 120,000 infants and children, using federal and state funds

Goals of PNSS and PedNSS
Pregnancy Nutrition Surveillance System (PNSS,1979 - present)
To monitor behavioral and nutritional risk factors among moderate- to low-income U.S. pregnant & postpartum women participating in public health programs
Pediatric Nutrition Surveillance System (PedNSS,1973 - present)
To monitor the general health and nutritional status of moderate- to low-income U.S. children served by public health programs
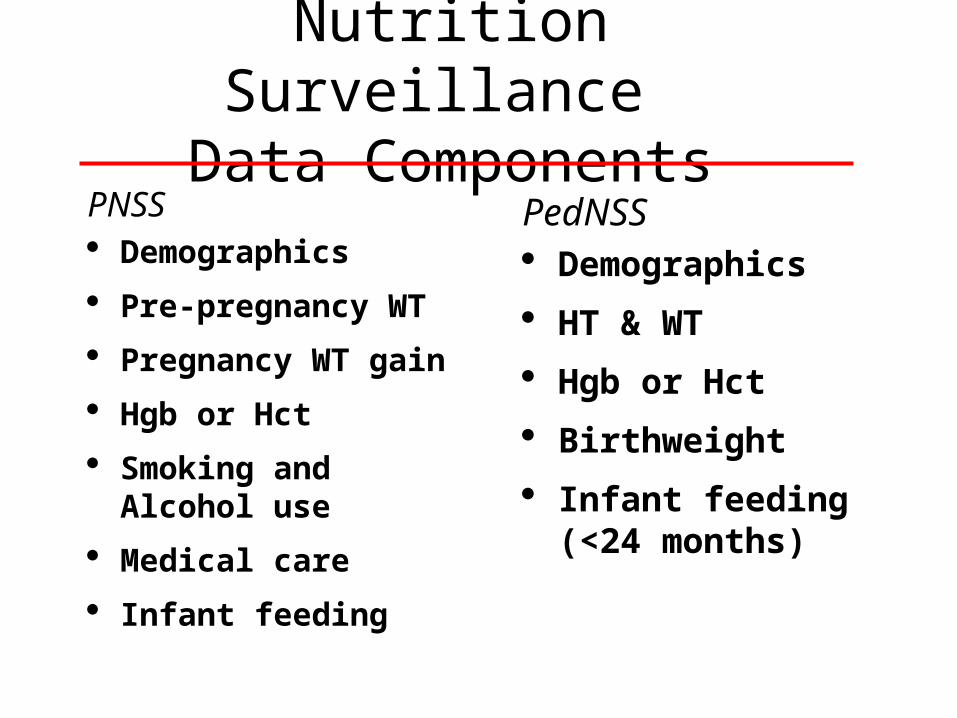
Nutrition Surveillance Data Components
PedNSS Demographics
HT & WT
Hgb or Hct
Birthweight
Infant feeding (<24 months)
PNSS Demographics
Pre-pregnancy WT
Pregnancy WT gain
Hgb or Hct
Smoking and Alcohol use
Medical care
Infant feeding

Massachusetts WIC/PNSS Demographic Characteristics
Age: 20% age < 20
54% age 20-29
26% age >= 30
Race/Hispanic Ethnicity:50% White non-Hispanic
18% Black non-Hispanic
25% Hispanic
6% Asian
Education: 22% < 12 y completed
71% >= 12 y completed
7% unknown

18.325.3
5.87.2 5.1
50.4
10.9
74.7
0
20
40
60
80
100
White Non-Hispanic Black Non-Hispanic Hispanic Asian
Race/Hispanic Ethnicity
Pe
rce
nt
WIC Participants MA Statewide Birth Data
Race/Hispanic ethnicity among MA WIC participants compared to
MA statewide birth data1999 MA WIC/PNSS
Source: Massachusetts WIC Program, 1999 (n=33,176); Massachusetts Births 1999, MDPH, 2001 (n=80,866)

18.823.8
7.1
50.3
0
20
40
60
80
100
Underweight Normal weight Overweight Obese
Pre-Pregnancy Weight Status
Pe
rce
nt
Pre-pregnancy weight status 1999 MA WIC/PNSS
Source: Massachusetts WIC Program, 1999 (n=26,856)
42.6% combined

Pre-pregnancy weight statusby maternal age 1999 MA WIC/PNSS
Source: Massachusetts WIC Program, 1999 (n=26,855)
4.6 3.6
43.6
9.9
7.3
58.749.3
45.4
31.4
43.450.0 52.8
0
20
40
60
80
100
< 20 20-29 30-34 >=35
Maternal Age Category
Pe
rce
nt
Underweight Normal Weight Overweight or Obese
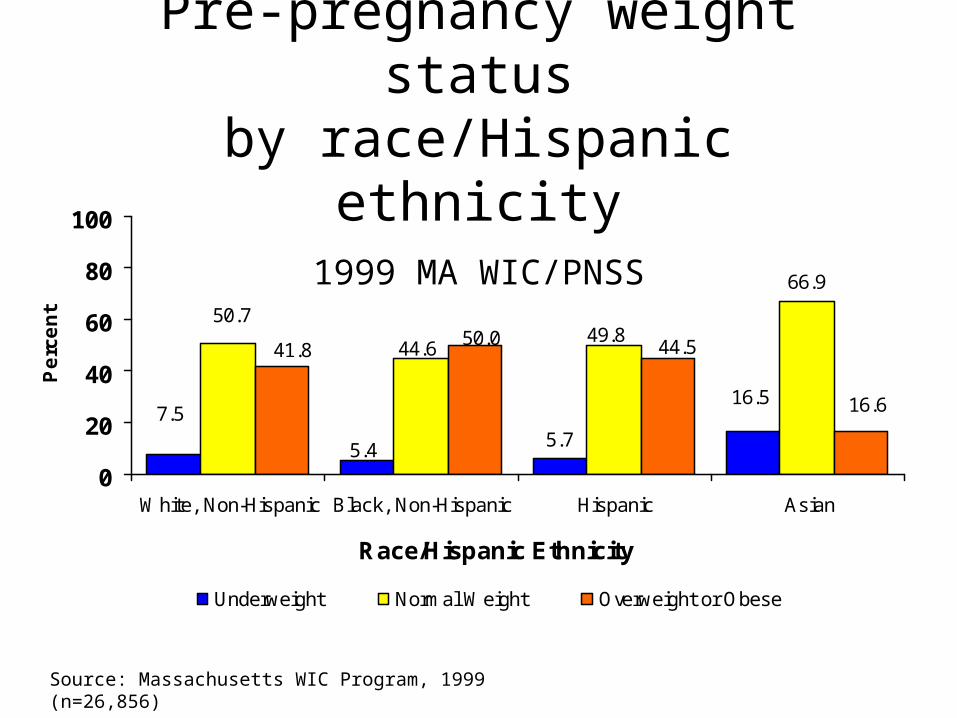
5.7
66.9
7.5
5.4
16.5
50.7
44.649.8
16.6
41.850.0 44.5
0
20
40
60
80
100
White, Non-Hispanic Black, Non-Hispanic Hispanic Asian
Race/Hispanic Ethnicity
Pe
rce
nt
Underweight Normal Weight Overweight or Obese
Pre-pregnancy weight statusby race/Hispanic ethnicity
1999 MA WIC/PNSS
Source: Massachusetts WIC Program, 1999 (n=26,856)

6.3 4.4 5.3
43.3 40.445.7
9.2
48.057.0 54.352.3
33.8
0
20
40
60
80
100
0 children 1 child 2 children >= 3 children
Parity
Pe
rce
nt
Underweight Normal Weight Overweight or Obese
Pre-pregnancy weight status by parity
1999 MA WIC/PNSS
Source: Massachusetts WIC Program, 1999 (n=25,883)

22.6 26.2
51.2
0
20
40
60
80
100
Less than Recommended Recommended More than Recommended
Weight Gain Status
Pe
rce
nt
Source: Massachusetts WIC Program, 1999 (n=22,876)
Weight gain status during pregnancy 1999 MA WIC/PNSS

25.331.6
17.324.8 26.725.0 26.227.7
43.147.5
57.7
47.1
0
20
40
60
80
100
0 children 1 child 2 children >= 3 children
Parity
Pe
rce
nt
Less than Recommended Recommended More than Recommended
Weight gain status during pregnancy by parity
1999 MA WIC/PNSS
Source: Massachusetts WIC Program, 1999 (n=25,094)

Pediatric Nutrition Surveillance System (PedNSS)
• Short Stature• height-for-age < 5th percentile1
• Underweight• weight-for-age < 5th percentile
• Risk for Overweight• 85th percentile < weight-for-height2 < 95th percentile
• Overweight• >= 95th percentile weight-for-height
• Anemia
1 All percentiles given are relative to the 2000 CDC growth chart reference2 Substituted here for BMI-for-age; both measures are interchangeable in this age range

A Note about Terminology...
Pediatric Terms Adult TermsUnderweight Underweight
Normal Normal
At Risk for Overweight Overweight
Overweight Obese
Terminology for roughly equivalent categories is different in children than in adults. The term “obesity” is not recommended for use when describing children. The term “overweight” reflects a different category in children than in adults.

Massachusetts2001 PedNSS (%)
National 2000PedNSS (%)
Age< 12 months 26 3812 - 24 months 25 22> 24 months 49 40
Race/Hispanic Ethnicity
White Non-Hispanic 45 43Black Non-Hispanic 19 22Hispanic 30 29Asian 6 3All Other 4
PedNSS Demographic Characteristics

6.55.5
3.9 3.8 3.74.9
8.26.4
4.4 4.6 4.0
6.2
0
5
10
15
0-11 months
12-23months
24-35months
36-47months
48-59months
All Age Grps
Age in Months
Pe
rce
nt
2001 MA WIC PedNSS 2000 National PedNSS
Source: Massachusetts WIC Program, 2001 (n= 117,270).
Prevalence of short stature by age 2001 MA WIC/PedNSS

5.5
2.83.03.83.3
12.5
5.44.34.54.8
3.5
7.5
0
5
10
15
0-11months
12-23months
24-35months
36-47months
48-59months
All Age Grps
Age in Months
Pe
rce
nt
2001 MA WIC PedNSS 2000 National PedNSS
Prevalence of underweight by age 2001 MA WIC/PedNSS
Source: Massachusetts WIC Program, 2001 (n= 117,423).

17.8 16.4 15.017.017.115.7
0
10
20
30
40
24-35 months 36-47 months 48-59 months
Age in Months
Pe
rce
nt
At Risk for Overweight Overweight
Prevalence of risk for overweight and overweight by age
2001 MA WIC/PedNSS
Source: Massachusetts WIC Program, 2001 (n= 55,896). Children >= 2 years old.
33.5% 33.5% 32.0%

13.916.0
20.7
12.216.0 16.7 18.0
13.1
0
10
20
30
40
White Non-Hispanic Black Non-Hispanic Hispanic Asian
Race/Hispanic Ethnicity
Pe
rce
nt
At Risk for Overweight Overweight
Source: Massachusetts WIC Program, 2001 (n= 55,896). Children >= 2 years old.
29.9% 32.7% 38.7% 25.3%
Prevalence of risk for overweight and overweight by
race/Hispanic ethnicity 2001 MA WIC/PedNSS
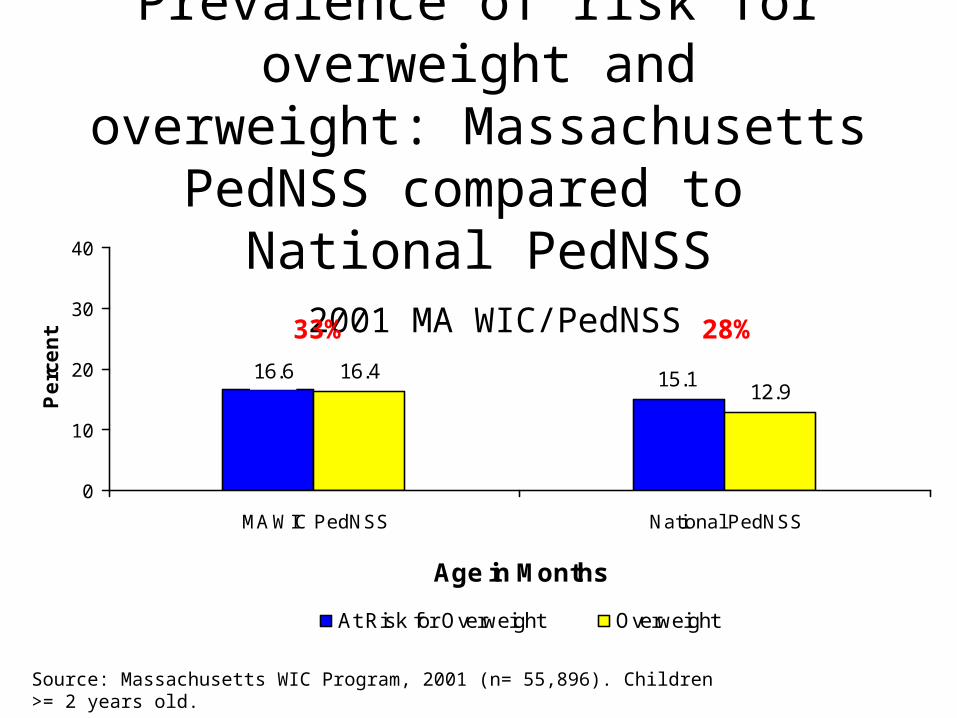
16.412.9
15.116.6
0
10
20
30
40
MA WIC PedNSS National PedNSS
Age in Months
Pe
rce
nt
At Risk for Overweight Overweight
Prevalence of risk for overweight and overweight: Massachusetts PedNSS
compared to National PedNSS 2001 MA WIC/PedNSS
Source: Massachusetts WIC Program, 2001 (n= 55,896). Children >= 2 years old.
33% 28%
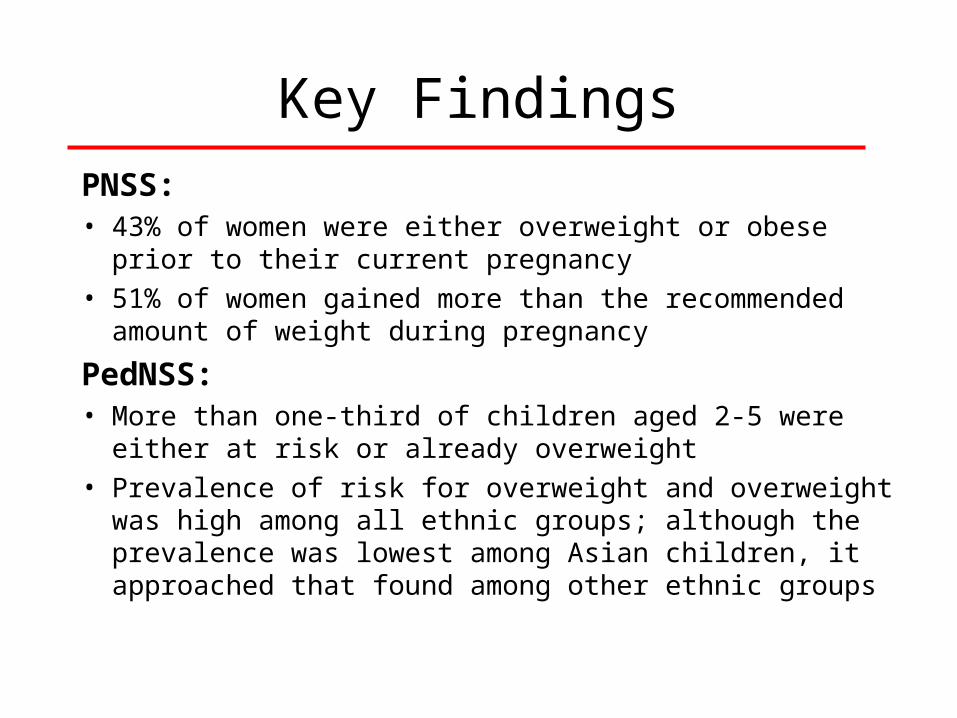
Key Findings
PNSS:• 43% of women were either overweight or obese prior to their
current pregnancy• 51% of women gained more than the recommended amount of
weight during pregnancy
PedNSS:• More than one-third of children aged 2-5 were either at risk or
already overweight• Prevalence of risk for overweight and overweight was high
among all ethnic groups; although the prevalence was lowest among Asian children, it approached that found among other ethnic groups