pressure-minimization method for prediction of two-phase ... · pdf filepressure-minimization...
TRANSCRIPT
October 2016 • Oil and Gas Facilities 1
Pressure-Minimization Method for Prediction of Two-Phase-Flow Splitting
R. Dabirian, The University of Tulsa; L. Thompson, Cimarex; and R. Mohan and O. Shoham, The University of Tulsa
was developed to predict the splitting phenomena under these re-gimes. Shoham extended his flow-splitting work to a horizontal re-duced tee with a smaller-diameter branch arm (Shoham et al. 1989). Hong (1978) studied two-phase-flow splitting for a branching tee, considering the effect of side-arm angle and flow regimes on gas and liquid splitting. Hong and Griston (1995) studied flow splitting of an air/water system and concluded that, as the air split ratio in-creased to greater than 2:1, the experimental data points deviated from a 50:50 split. Hong and Griston (1995) also studied the effects of some devices on flow splitting. They recommended that nozzles be inserted directly downstream of an impacting tee to increase the chance of equal splitting. Azzopardi et al. (1987) considered the effects of annular flow for splitting at the tee junction. Azzopardi et al. (1988) investigated the effect of churn flow in the tee junc-tions. The experimental results for churn flow were the same as those for annular flow; therefore, they concluded that the inlet-gas- and liquid-flow rates do not affect flow splitting. Peake (1992) concluded theoretically that uneven two-phase-flow splitting oc-curs as a result of unequal vapor-flow splitting. Tshuva et al. (1999) studied two-phase-flow splitting in horizontal and inclined parallel pipes. Taitel et al. (2003) studied the splitting of gas and liquid for four parallel pipes with a common inlet and outlet manifold capable of inclining from 0 to 15°. For the horizontal case, they observed identical splitting for each looped pipe, while for the other incli-nation angles, they observed a stagnant flow in at least one pipe. Pustylnik et al. (2006) investigated flow splitting in the lines on the basis of stability analysis, and proposed a model that was able to predict the number of pipes filled with stagnant liquid. One of the more-recent investigations on flow splitting was conducted by Al-varez et al. (2010). Their study investigated two-phase-flow split-ting for looped lines such as parallel and looped configurations, and they developed a mechanistic model capable of predicting split ratio and pressure drop across each looped line on the basis of equal gas/liquid ratio in each branch. The purpose of our study is to dis-cover the manner in which two phases of gas and liquid are split on the basis of the minimum pressure drop.
Experimental ProgramA novel and unique facility has been constructed at the University of Tulsa that enables the measurement of pressure drop and flow splitting for different looped-line configurations. Fig. 1 shows a schematic of the flow loop, which consists of three fundamental parts—storage, looped pipes, and the gas/liquid cylindrical cyclone (GLCC©). Dabirian (2012) may be referred to for more details.
Air is introduced into the facility from an air compressor, and water is introduced into the facility from a tank upstream of a cen-trifugal pump. Two-phase flow of gas/liquid travels through a 30-ft-long, 2-in.-inside-diameter (ID) polyvinyl-chloride inlet pipe, which is installed upstream of the impacting tee. The inlet pipe is relatively long to ensure that the flow is fully developed. The pres-sure transducer is installed approximately 2 ft upstream of the im-pacting tee. The impacting tee is installed to split the two-phase flow into two lines. Two valves are installed on each side of the im-pacting tee to allow for flow through only one branch of the system. The length of each of the parallel lines is approximately 20 ft to en-sure fully developed flow. The facility allows the use of different
Copyright © 2016 Society of Petroleum Engineers
This paper (SPE 166197) was accepted for presentation at the SPE Annual Technical Conference and Exhibition, New Orleans, 30 September–2 October 2013, and revised for publication. Original manuscript received for review 19 November 2015. Revised manuscript received for review 26 May 2016. Paper peer approved 31 May 2016.
SummaryLooped gas/liquid multiphase-flow pipelines are used by the oil and gas industry to reduce pressure drop and increase flow capacity. They can be installed alone as a flow splitter or combined in series to form a manifold. Application of looped lines is not unique to the petroleum industry; they are also applied in other industries such as nuclear and chemical. However, there has not yet been a compre-hensive fundamental investigation of the flow behavior or predic-tive methods available for such systems because of the complexity involved with respect to process variables such as flow patterns, fluid properties, phase velocities, and pipe geometry.
Uneven splitting of the gas and liquid phases between the two looped lines can cause malfunction of the downstream pro-cessing equipment; therefore, a total of 65 experiments at different flow conditions in a looped-lines system using different-diam-eter looped-line configurations are conducted in this study to in-vestigate the pressure drop during uneven flow splitting. Most of the experiments are carried out with slug flow at the system inlet, while flow patterns such as slug flow, dispersed flow, and stratified flow are observed in the looped pipes. A computational algorithm is developed for predicting gas/liquid two-phase-flow splitting in the looped lines on the basis of energy minimization. The algo-rithm predicts the uneven splitting of the two phases and the cor-responding pressure drop across the loop. Additionally, the model shows that maximum pressure drop occurs when there is equal splitting in the looped lines. Good agreements have been achieved between the measured and predicted flow splitting and pressure drop across the looped lines.
IntroductionParallel looped-line sections are installed routinely to decrease pres-sure drop and increase the cross-sectional area of flow to increase flow capacity. They can be installed singly as flow splitters or com-bined in series to form a manifold. Looped lines have many appli-cations; for instance, they are widely used in oilfield flowlines to increase the handling capacity of transportation to refinery systems, and they have been applied in the nuclear industry for use in heat exchangers, boilers, and condensers in power plants and cooling systems. However, two-phase-flow splitting is a very complex phe-nomenon, and there appears to be a lack of fundamental under-standing of the splitting process. Flow splitting depends on several variables, such as flow patterns, phase behaviors, fluid properties, phase velocities, and pipe geometry, including pipe roughness, diameter, length, and inclination angle of the looped lines. Each of these variables can have an effective role in the splitting ratio and pressure drop. In addition, the geometry of the tee junction and the devices inserted into the tee affect the flow splitting.
Shoham et al. (1987) investigated two-phase-flow splitting at a horizontal regular pipe tee. The data were collected for stratified smooth, stratified wavy, and annular flow regimes, and a model

2 Oil and Gas Facilities • October 2016
pipe diameters on each branch downstream of the splitting tee to study the effect of the diameter of each line on the splitting ratio and pressure drop. Air and water are used in this study as gas and liquid phases, respectively.
As can be seen from Fig. 1, the two-phase flow of gas and liquid goes through the inlet pipe from Section 1. At Section 2, the flow is split at the tee junction into two looped lines at Section 3 to increase the handling capacity of the system. At the end of each line at Section 4, GLCCs are installed to separate the flow and measure the flow rate of gas and liquid by use of single-phase flowmeters. After the sepa-ration of gas and liquid at each GLCC, the phases are recombined at Section 5, and the mixed flow from the two lines travels to the two-phase separator at Section 6. The air is vented from the tank, and the liquid is recycled continuously through the system.
A total of 65 experiments are conducted at various superficial velocities of gas and liquid and with different diameter configura-tions to obtain flow-splitting and pressure-drop data for the looped-lines system. In this study, the data acquisition for two-phase-flow splitting is carried out for three different configurations:
• Equal-diameter configuration: Looped lines with the same diameter are studied (i.e., the system is completely symmet-rical). In this study, configurations of 0.5-in.-diameter looped lines and 1-in.-diameter looped lines are used.
• Unequal-diameter configuration: Looped lines with different diameters are used to create different flow-splitting ratios. In this study, configurations of 0.5- and 1-in.-diameter looped lines and 0.5- and 2-in.-diameter looped lines are used.
• Single-line configuration: Looped lines of equal diameter are left completely open, and two-phase flow travels through them. Then, one of the lines is closed, and the flow with the same superficial-velocity conditions travels through the open side. The purpose of these experiments is to understand the effect of the looped lines on the pressure drop. In this study, three equal-diameter configurations are investigated: 0.5-in.-diameter looped lines, 1-in.-diameter looped lines, and 2-in.-diameter looped lines.
The flow pattern observed in each side of the facility shown in Fig. 1 for the various diameter configurations is given in Table 1.
Experimental ResultsThe experimental results for three configurations of study are pre-sented in terms of the gas fraction (Fgas1) and the liquid fraction (Fliq1), which can be calculated as follows:
Fq
qgas1gas1
gas inlet
= , ........................................................................(1)
and
Fq
qliqliquid
liquid inlet1
1= . .......................................................................(2)
The diagonal lines in Figs. 2 through 7 represent the equal split-ting between two sides. The area above the diagonal line represents a liquid-rich splitting ratio, while a gas-rich splitting ratio entering the side is shown below the diagonal line.
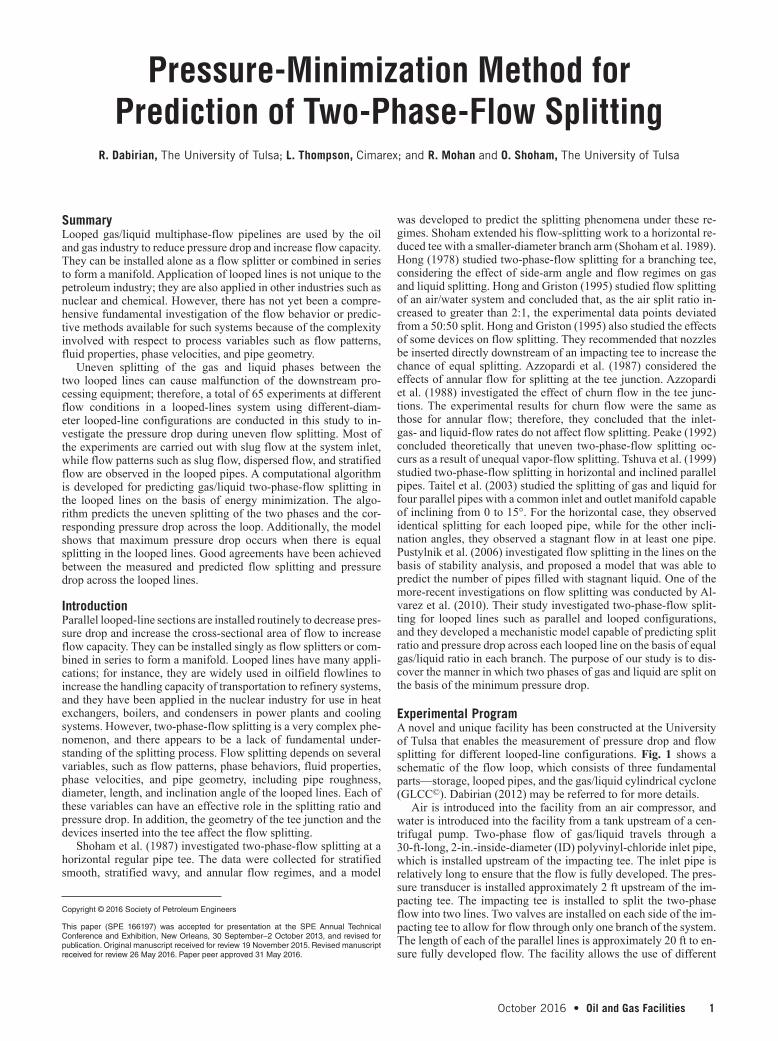
Equal-Diameter Configuration. In this configuration, flow split-ting is considered in a symmetrical system, in which the lines have the same diameters. In this case, two diameter configurations are considered—0.5-in. diameter and 1-in. diameter. Fig. 2 represents flow splitting for the 0.5-in.-diameter configuration with a com-bination of superficial liquid velocities (Vsl = 0.15, 0.2, and 0.25 m/s) and superficial gas velocities (Vsg = 2.5 and 3.0 m/s). As can be seen from Fig. 2, the discrepancy between the experimental data and the ideal 50:50 split is less than 5%, and the splitting of gas and liquid is approximately 50:50. This means that the gas and liquid fractions of both lines are almost the same for all superficial veloci-ties of gas and liquid.
Flow splitting is also investigated for a 1-in.-diameter configu-ration, as shown in Fig. 3. The experiments were run at three su-
Inlet1
23 4
5 6
4
3V
V
V
V
LC
LC Liquid-Level Control
Pressure Measurement
Flow-Rate Measurement
Video
P
P
P
P
LC
F
F
FF
F
Fig. 1—Schematic of the parallel looped-lines facility.
Side 1 and Side 2 ID (in.)
Inlet SuperficialVelocities (m/s) Side Flow Pattern
0.5 and 0.5 Vsg = 2.5 and 3 Side 1 Dispersed bubble
Vsl = 0.15, 0.2, and 0.25 Side 2 Dispersed bubble
1.0 and 1.0 Vsg = 7, 8, and 9 Side 1 Slug
Vsl = 0.2, 0.25, and 0.3 Side 2 Slug
0.5 and 2.0 Vsg = 5, 6, 7, 8, and 9 Side 1 Stratified
Vsl = 0.2 Side 2 Slug
0.5 and 2.0 Vsg = 5, 6, 7, 8, and 9 Side 1 Slug
Vsl = 0.3 Side 2 Slug
0.5 and 1.0 Vsg = 3.5, 4, 4.5, and 5 Side 1 Slug
Vsl = 0.2 and 0.3 Side 2 Slug
Table 1—Flow patterns observed in the parallel looped-lines facility.
October 2016 • Oil and Gas Facilities 3
perficial gas velocities (Vsg = 7, 8, and 9 m/s) and three superficial liquid velocities (Vsl = 0.2, 0.25, and 0.3 m/s). The experimental re-sults show that the splitting is almost 50:50, and there is less than a 2% discrepancy from equal splitting. The results confirm the reli-ability of the data for the 1-in.-diameter looped-lines configuration.
Unequal-Diameter Configuration. This subsection presents re-sults from unequal-diameter lines. Two different unequal-diame-ter configurations are used: 0.5 and 2 in. and 0.5 and 1 in. In this study, different flow conditions are studied to better understand
the splitting ratio and pressure drop. Side 1 is the side with small-er diameter (0.5 in.), and Side 2 is the side with larger diameter (1 or 2 in.).
0.5- and 2-in.-Diameter Configuration. This subsection presents the experimental results for the 0.5- and 2-in.-diameter configura-tion. Five different superficial gas velocities (Vsg = 5, 6, 7, 8, and 9 m/s) and two superficial liquid velocities (Vsl = 0.2 and 0.3 m/s) are used to conduct the experiments. At lower superficial liquid velocities (Vsl = 0.2 m/s), the flow pattern in Side 1 is stratified and
1
0.8
0.6
0.4
0.2
00 0.2 0.4 0.6
Splitting Gas Fraction of Side 1
Spl
ittin
g Li
quid
Fra
ctio
n of
Sid
e 1
0.5 in.
0.5 in.-Diameter Looped-Lines Configuration
0.8 1
Fig. 2—Experimental results for the (equal) 0.5-in.-diameter looped-lines configuration.
1 in.-Diameter Looped-Lines Configuration
Splitting Gas Fraction of Side 1
Spl
ittin
g Li
quid
Fra
ctio
n of
Sid
e 1 1
0.8
0.6
0.4
0.2
0
1 in.
0 0.2 0.4 0.6 0.8 1
Fig. 3—Experimental results for the (equal) 1-in.-diameter looped-lines configuration.
Splitting Gas Fraction of Side 2
Vsl = 0.2 m/s
Vsg = 9 m/s
Vsg = 8 m/s
Vsg = 7 m/s
Vsg = 6 m/s
Vsg = 5 m/s
Spl
ittin
g Li
quid
Fra
ctio
n of
Sid
e 2 1
0.9
0.8
0.7
0.6
0.50.5 0.6 0.7 0.8 0.9 1
Fig. 4—Experimental results for Side 2 of the 0.5- and 2-in.-diam-eter looped-lines configuration at Vsl = 0.2 m/s.
Vsl = 0.3 m/s
Spl
ittin
g Li
quid
Fra
ctio
n of
Sid
e 2 1
0.9
0.8
0.7
0.6
0.5
Splitting Gas Fraction of Side 20.5 0.6 0.7 0.8 0.9 1
Vsg = 9 m/s
Vsg = 8 m/s
Vsg = 7 m/s
Vsg = 6 m/s
Vsg = 5 m/s
Fig. 5— Experimental results for Side 2 of the 0.5- and 2-in.-diameter looped-lines configuration at Vsl = 0.3 m/s.
Vsl = 0.2 m/s
Spl
ittin
g Li
quid
Fra
ctio
n of
Sid
e 2 1
0.9
0.8
0.7
0.6
0.5
Splitting Gas Fraction of Side 20.5 0.6 0.7 0.8 0.9 1
Vsg = 5 m/s
Vsg = 4 m/s
Vsg = 4.5 m/s
Vsg = 3.5 m/s
Fig. 6— Experimental results for Side 2 of the 0.5- and 1-in.- diameter looped-lines configuration at Vsl = 0.2 m/s.
Vsl = 0.3 m/s
Spl
ittin
g Li
quid
Fra
ctio
n of
Sid
e 2 1
0.9
0.8
0.7
0.6
0.5
Splitting Gas Fraction of Side 2
0.5 0.6 0.7 0.8 0.9 1
Vsg = 5 m/s
Vsg = 4 m/s
Vsg = 4.5 m/s
Vsg = 3.5 m/s
Fig. 7— Experimental results for Side 2 of the 0.5- and 1-in.- diameter looped-lines configuration at Vsl = 0.3 m/s.
4 Oil and Gas Facilities • October 2016
the flow pattern in Side 2 is slug flow, while for higher superficial liquid velocity, the flow pattern in both sides is slug flow.
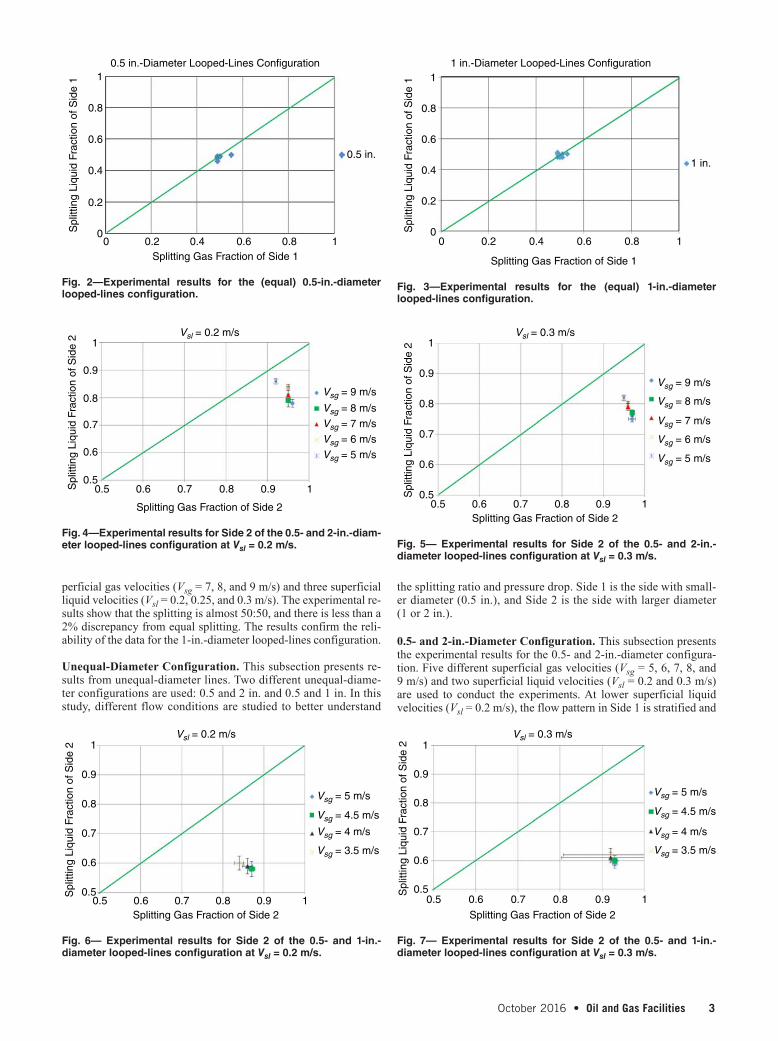
Fig. 4 shows the splitting liquid and gas fractions for Side 2 with Vsl = 0.2 m/s. As can be seen in Fig. 4, the gas fraction is between 92 and 96%, while the liquid fraction changes between approx-imately 78 and 86% going to the larger diameter. Flow-splitting ratios are also presented in Fig. 5 for Side 2 at Vsl = 0.3 m/s and dif-ferent superficial gas velocities. The gas is almost split between 95 and 97%, while the liquid fraction changes between 75 and 82%. For both cases, at a specific superficial liquid velocity, increasing the superficial gas velocity increases gas fraction and decreases the liquid fraction in the larger-diameter side (Side 2). Comparing the gas/oil ratio at the inlet with the gas/liquid ratio of the lines, it can be concluded that the gas/liquid ratio in the larger-diameter line is greater than that of the smaller-diameter line because gas has a ten-dency to migrate through the larger-diameter pipe.
0.5- and 1-in.-Diameter Configuration. This is the second un-equal-diameter configuration that is discussed in this section. Four superficial gas velocities (Vsg = 3.5, 4, 4.5, and 5 m/s) and two su-perficial liquid velocities (Vsl = 0.2 and 0.3 m/s) are used to conduct the experiments. Fig. 6 shows the splitting ratio with Vsl = 0.2 m/s for this configuration. Gas is split between 84 and 87% in Side 2, while liquid is split between 58 and 60%. The experiments are also conducted with Vsl = 0.3 m/s and the same superficial gas velocities as used in the Vsl = 0.2 m/s case, with the results shown in Fig. 7. The fraction of gas is approximately between 93 and 95%, while the liquid fraction changes between 59 and 64%.
For both unequal-diameter configurations, at a specific superfi-cial liquid velocity, increasing the superficial gas velocity increases gas fraction and decreases the liquid fraction in Side 2. Comparing the gas/liquid ratio at the inlet with the gas/liquid ratio of the lines, it can be concluded that the gas/liquid ratio in the larger-diameter line is greater than that in the smaller-diameter line because gas has a tendency to migrate through the larger-diameter pipe.
Single-Line Configuration. First, the gas/liquid two-phase flow travels through the equal-diameter looped-lines system, and the flow is split between the two pipes. Then, the pressure drop is measured by the pressure transducer installed at the inlet and outlet pipes. After taking the measurement, one of the lines is closed, and the flow with the same superficial velocities as the preceding case travels through just one pipe, and the pressure drop along the line is measured.
The looped-lines system consists of three fundamental parts: the impacting tee, pipeline, and GLCC. In this study, the pressure drop in each individual part is investigated. The experimental facility is small in comparison to those facilities installed in the industry, where the pressure drop across the pipelines is much greater than the pressure drops in the impacting tee and GLCC. In industrial
facilities, the pressure drop across the pipeline is dominant. In the experimental facility, pressure drops in the tee and GLCC may not be a negligible part of the overall pressure drop; hence, steps were taken to carefully measure pressure drops in each component.
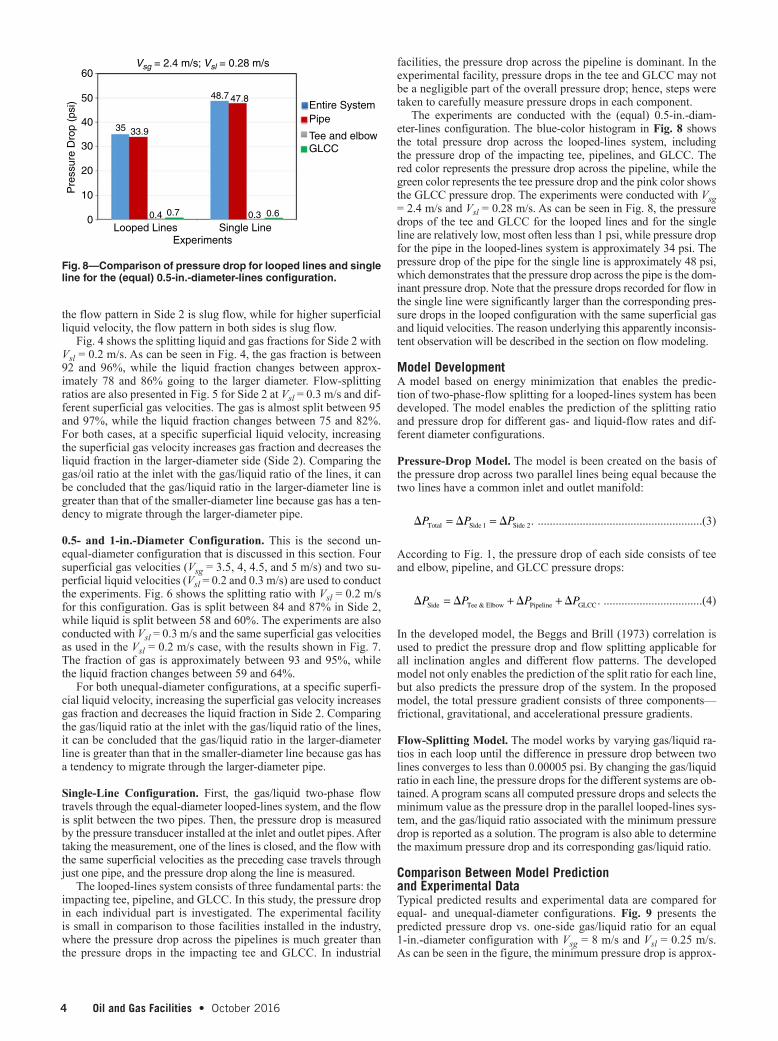
The experiments are conducted with the (equal) 0.5-in.-diam-eter-lines configuration. The blue-color histogram in Fig. 8 shows the total pressure drop across the looped-lines system, including the pressure drop of the impacting tee, pipelines, and GLCC. The red color represents the pressure drop across the pipeline, while the green color represents the tee pressure drop and the pink color shows the GLCC pressure drop. The experiments were conducted with Vsg = 2.4 m/s and Vsl = 0.28 m/s. As can be seen in Fig. 8, the pressure drops of the tee and GLCC for the looped lines and for the single line are relatively low, most often less than 1 psi, while pressure drop for the pipe in the looped-lines system is approximately 34 psi. The pressure drop of the pipe for the single line is approximately 48 psi, which demonstrates that the pressure drop across the pipe is the dom-inant pressure drop. Note that the pressure drops recorded for flow in the single line were significantly larger than the corresponding pres-sure drops in the looped configuration with the same superficial gas and liquid velocities. The reason underlying this apparently inconsis-tent observation will be described in the section on flow modeling.
Model DevelopmentA model based on energy minimization that enables the predic-tion of two-phase-flow splitting for a looped-lines system has been developed. The model enables the prediction of the splitting ratio and pressure drop for different gas- and liquid-flow rates and dif-ferent diameter configurations.
Pressure-Drop Model. The model is been created on the basis of the pressure drop across two parallel lines being equal because the two lines have a common inlet and outlet manifold:
� � �P P PTotal Side Side 2= =1 . .......................................................(3)
According to Fig. 1, the pressure drop of each side consists of tee and elbow, pipeline, and GLCC pressure drops:
� � � �P P P PSide Tee & Elbow Pipeline GLCC= + + . .................................(4)
In the developed model, the Beggs and Brill (1973) correlation is used to predict the pressure drop and flow splitting applicable for all inclination angles and different flow patterns. The developed model not only enables the prediction of the split ratio for each line, but also predicts the pressure drop of the system. In the proposed model, the total pressure gradient consists of three components—frictional, gravitational, and accelerational pressure gradients.
Flow-Splitting Model. The model works by varying gas/liquid ra-tios in each loop until the difference in pressure drop between two lines converges to less than 0.00005 psi. By changing the gas/liquid ratio in each line, the pressure drops for the different systems are ob-tained. A program scans all computed pressure drops and selects the minimum value as the pressure drop in the parallel looped-lines sys-tem, and the gas/liquid ratio associated with the minimum pressure drop is reported as a solution. The program is also able to determine the maximum pressure drop and its corresponding gas/liquid ratio.
Comparison Between Model Prediction and Experimental Data Typical predicted results and experimental data are compared for equal- and unequal-diameter configurations. Fig. 9 presents the predicted pressure drop vs. one-side gas/liquid ratio for an equal 1-in.-diameter configuration with Vsg = 8 m/s and Vsl = 0.25 m/s. As can be seen in the figure, the minimum pressure drop is approx-
Vsg = 2.4 m/s; Vsl = 0.28 m/s60
50
40
30
20
10
0Looped Lines Single Line
Experiments
Pre
ssur
e D
rop
(psi
)
0.4 0.7
33.9
48.7 47.8
0.3 0.6
Entire SystemPipe
Tee and elbowGLCC
35
Fig. 8—Comparison of pressure drop for looped lines and single line for the (equal) 0.5-in.-diameter-lines configuration.

October 2016 • Oil and Gas Facilities 5
imately 5.6 psi where the gas/liquid ratio of one side is very small, and the maximum pressure drop is approximately 7.8 psi where the gas/liquid ratio is approximately 32 m3/m3. The acquired pressure drop from the experiment is approximately 6.4 psi, while the corre-sponding gas/liquid ratio is approximately 32 m3/m3.
The model results indicate that maximum pressure drop occurs when the gas/liquid ratio splits evenly between two parallel lines, and minimum pressure drop occurs when gas migrates preferen-tially to one branch. This appears to contradict the measured data, which suggest that the fluids distribute themselves evenly between the two branches. Note that the experimental pressure-drop mea-surements seem to concur with the model predictions for equally sized pipes. Multiphase flow through pipes with the same superfi-cial phase velocities results in greater pressure drop than if the same multiphase-flow phases redistribute themselves naturally between the looped lines. According to the model, this would result in the maximum pressure drop across the system. The results for single-line flow validate this statement. The apparent contradiction is ex-plained as follows: At any instant when the flowing stream enters the tee, more gas migrates to one side (say, the right) to minimize the pressure drop. At the following instant, the entering stream en-counters two equally good paths for the gas to migrate to prefer-entially and, in this instance, the gas migrates to the left branch. Because there are always two equally good paths from which to se-lect, a time average of the measured gas/liquid ratios in each branch would be the same as the inlet value, even though the instantaneous gas/liquid ratio values are different. It is believed that the smaller pressure drops measured in the parallel loop experiments compared with the single-line experiments confirm this hypothesis.
Fig. 10 shows the predicted pressure drop vs. the different pos-sibilities of the gas/liquid ratios of the larger-diameter side with the experimental-data condition of Vsg = 4.5 m/s and Vsl = 0.25 m/s for the (unequal) 0.5- and 1-in.-diameter-line configuration. As can be seen, the minimum pressure drop occurs when most of the
gas travels to the larger-diameter side, and the maximum pressure drop occurs when the gas/liquid ratios are split evenly between two lines. As can be seen in Figs. 11 and 12, the discrepancy between experimental data and model prediction for pressure drop is ap-proximately 30%, and that between splitting gas fraction and liquid fraction is approximately 20%. For the case of pressure drop, the model gives reasonable predictions at lower pressure drops cor-responding to unequal configurations. For equal configurations (especially the 0.5-in.-diameter configuration), the model under-predicts the pressure drop by up to 30%. The experimental results show that the high discrepancies occur when there are dispersed bubbles in the looped line. We believe that the Beggs and Brill (1973) correlation is unable to predict the pressure drop accurately under this flow regime. To decrease the discrepancies between the model prediction and experiment, we suggest use of a mechanistic model developed by Taitel and Dukler (1976) instead of the Beggs and Brill (1973) correlation. It is also interesting to note that gas-splitting ratio is constantly overpredicted by the model.
ConclusionsThe objective of this study is to obtain reliable methods of pre-dicting flow splitting of a two-phase (gas/liquid) stream when trav-eling through parallel looped lines. The following points are the summary and conclusions of this study:1. A unique and novel experimental facility is constructed and ap-
propriate instruments (mass flowmeters, vortex shedding meter, pressure transducers) are installed to obtain reliable measure-ments during the experimental runs. A total of 65 experiments are conducted with different gas- and liquid-velocity combina-tions and different diameter configurations.
1 in.-Diameter Configuration
Gas/Liquid Ratio (m3/m3)
1 in.Experimentaldata
9
8
7
6
5
43.2 32 320
Pre
ssur
e D
rop
(psi
)
Fig. 9—Predicted pressure drop for the (equal) 1-in.-diameter-lines configuration with Vsg = 8 m/s and Vsl = 0.25 m/s.
Maximum Pressure Drop(Equal Splitting)
Minimum Pressure Drop
Model
Data
Gas/Liquid Ratio (m3/m3) in 1-in. Pipe
9
10
11
8
7
6
5
410 15 20 25 30 35 40
Pre
ssur
e D
rop
(psi
)
Pressure Drop vs. Gas/Liquid Ratio
Fig. 10—Comparison between experimental data and predicted results with Vsg = 4.5 m/s and Vsl = 0.25 m/s for the (unequal) 0.5- and 1-in.-diameter-line configuration.
50
40
30
20
∆P M
odel
Pre
dict
ion
(psi
)
∆P Experimental Data (psi)
10
00 10 20 30 40
–30%
+30%
50
Fig. 11—Discrepancy between pressure-drop prediction and ex-perimental data.
1
0.8
0.6
0.4
0.2
00 0.2 0.4 0.6 0.8
Fgas1
Fliq1
Split-Ratio Experimental Data
Spl
it-R
atio
Mod
el P
redi
ctio
n
1
–20%
+20%
Fig. 12—Discrepancy between split-ratio prediction and experi-mental data.
6 Oil and Gas Facilities • October 2016
Hong, K. C. 1978. Two-Phase Flow Splitting at a Pipe Tee. J Pet Technol 30 (2): 290–296. SPE-6530-PA. http://dx.doi.org/10.2118/6530-PA.
Hong, K. C. and Griston, S. 1995. Two-Phase Flow Splitting at an Im-pacting Tee. SPE Prod & Fac 10 (3): 184–190. SPE-27866-PA. http://dx.doi.org/10.2118/27866-PA.
Peake, W. T. 1992. Steam Distribution Surveillance and Analysis. Presented at the SPE Western Regional Meeting, Bakersfield, California, USA, 30 March–1 April. SPE-24079-MS. http://dx.doi.org/10.2118/24079-MS.
Pustylnik, L., Barneai, D., and Taitel, Y. 2006. Prediction of Two-Phase Flow Distribution in Parallel Pipes Using Stability Analysis. AIChE J 52 (10): 3345–3352. http://dx.doi.org/10.1002/aic.10949.
Shoham, O., Arirachakaran, S., and Brill, J. P. 1989. Two-Phase Flow Split-ting in a Horizontal Reduced Pipe Tee. Chemical Engineering Science 44 (10): 2388–2391. http://dx.doi.org/10.1016/0009-2509(89)85174-7.
Shoham, O., Brill, J. P., and Taitel, Y. 1987. Two-Phase Flow Splitting in a Tee Junction—Experiment and Modelling. Chemical Engineering Science 42 (11): 2667–2676. http://dx.doi.org/10.1016/0009-2509(87)87017-3.
Taitel, Y. and Dukler, A. E. 1976. A Model for Predicting Flow Regime Tran-sitions in Horizontal and Near Horizontal Gas-Liquid Flow. AIChE Journal 22 (1): 47–55. http://dx.doi.org/10.1002/aic.690220105.
Taitel, Y., Pustylnik, M., Tshuva, M. et al. 2003. Flow Distribution of Gas and Liquid in Parallel Pipes. International Journal of Multiphase Flow 29 (7): 1193–1202. http://dx.doi.org/10.1016/S0301-9322(03)00067-3.
Tshuva, M., Barnea, D., and Taitel, Y. 1999. Two-Phase Flow in Inclined Parallel Pipes. International Journal of Multiphase Flow 25 (6–7): 1491–1503. http://dx.doi.org/10.1016/S0301-9322(99)00048-8.
Ramin Dabirian holds a PhD degree in mechanical engineering from The University of Tulsa. He joined The University of Tulsa as a research as-sistant in the TUSTP group in pursuit of an MS degree in petroleum en-gineering. Dabirian’s research interests are multiphase-flow modeling in pipelines and multiphase separation and transportation. He holds a BS degree in petroleum engineering from the Petroleum University of Tech-nology, Iran. Dabirian is a member of SPE.
Leslie G. Thompson is a senior reservoir engineer at Cimarex Energy. Previously, he was an associate professor of petroleum engineering at The University of Tulsa. Thompson’s research interests include reser-voir/wellbore flow modeling and rate- and pressure-transient analysis in unconventional reservoirs. He holds a PhD degree in petroleum en-gineering from the University of Tulsa. Thompson is a member of SPE and serves as a technical editor for SPE Journal.
Ram S. Mohan is a professor of mechanical engineering at The University of Tulsa and a fellow of the American Society of Mechanical Engineers. He teaches and conducts research in the areas of multiphase flow, oil/water dispersion, instrumentation and measurements, control systems, compact separators, computer-aided design, and manufacturing pro-cesses. Mohan currently serves as the codirector of TUSTP, supported by several oil companies. He also directs several projects supported by the Chevron TU-CoRE. Mohan has authored or coauthored more than 75 refereed publications in the areas of his research, holds four patents/invention disclosures, and has received several best-paper awards. He holds a BSc degree in mechanical engineering from the University of Kerala, India, and MS and PhD degrees in mechanical engineering from the University of Kentucky. Mohan is a member of SPE.
Ovadia Shoham is the F. M. Stevenson Distinguished Presidential Chair Pro-fessor of Petroleum Engineering at The University of Tulsa. Since 1994, he has directed TUSTP, conducting research on compact separators and several projects supported by industry. Shoham has authored or coauthored more than 90 publications in the areas of multiphase flow, multiphase separation, and production operations and holds four patents/invention disclosures. He holds BS and MS degrees in chemical engineering from the Technion in Is-rael and The University of Houston, respectively, and a PhD degree in me-chanical engineering from Tel Aviv University. Shoham has published a widely referenced SPE book, Mechanistic Modeling of Gas-Liquid Flow. He is a re-cipient of the 2003 SPE International Production and Operations Award and has received several best-paper awards. Shoham is a member of SPE.
2. The experimental results for equal-diameter looped lines indi-cate that, with different gas- and liquid-velocity combinations, even or equal split condition has been achieved.
3. Applying gas/liquid flow to unequal-diameter lines results in unequal splitting. Because the density of gas in comparison to the density of liquid is less, the gas is dramatically more un-evenly split than the liquid. The data analysis shows that the gas tends to travel more toward the larger-diameter side; therefore, the gas/liquid ratio of that side will be greater in comparison with the smaller-diameter side.
4. For the single-line-configuration studies, the experimental data show that at the same flow conditions, the looped pipes of equiv-alent area of cross-section tend to decrease the pressure drop in comparison with a single pipe.
5. The experimental results show that most of the pressure drop occurs along the pipe rather than at the tee/elbow and GLCC; therefore, total loop pressure drop and two-phase splitting are not strong functions of the configuration of the tee junction.
6. A computational algorithm is developed from a simple flow-splitting model for predicting gas/liquid two-phase-flow split-ting in looped lines on the basis of energy minimization. Good agreement was achieved between the proposed model and the experimental data, with a discrepancy of less than 30% for the pressure-drop data and less than 20% for the splitting data. For the case of pressure drop, the model gives reasonable predictions at lower pressure drops (corresponding to unequal configura-tions) and consistently underpredicts the data for equal-splitting configuration. The gas-splitting ratio is constantly overpredicted by the model. The difference between the model prediction and experimental data could be a result of the inability of the Beggs and Brill (1973) correlation to predict the pressure drop accu-rately for the dispersed-bubble-flow condition. To improve the model predictions, it is recommended to evaluate unified mech-anistic models applicable for all flow patterns.
Nomenclature Fgas1 = gas fraction Fliq1 = liquid fraction qgas1 = gas-flow rate in Line 1, m3/s qgas inlet = gas-flow rate at inlet, m3/s qliquid1 = liquid-flow rate in Line 1, m3/s qliquid inlet = liquid-flow rate at inlet, m3/s Vsg = superficial gas velocity, m/s Vsl = superficial liquid velocity, m/s ΔP = pressure drop
AcknowledgmentsThe authors wish to express appreciation for the financial support of Chevron Tulsa University Center of Research Excellence (TU-CoRE) and the Tulsa University Separation Technology Projects (TUSTP).
ReferencesAlvarez, L., Mohan, R. S., Shoham, O. et al. 2010. Multiphase Flow Split-
ting in Parallel/Looped Pipelines. Presented at the SPE Annual Tech-nical Conference and Exhibition, Florence, Italy, 19–22 September. SPE-135723-MS. http://dx.doi.org/10.2118/135723-MS.
Azzopardi, B. J., Purvis, A., and Govan, A. H. 1987. Annular Two-Phase Flow Splitting at an Impacting T. International Journal of Multiphase Flow 13 (5): 605–614. http://dx.doi.org/10.1016/0301-9322(87)90038-3.
Azzopardi, B. J., Purvis, A., and Govan, A. H. 1988. Flow Split of Churn Flow at a Vertical Impacting T. Int. Journal of Eng. Fluid Mech. 1: 320–329.
Beggs, H. D. and Brill, J. P. 1973. A Study of Two-Phase Flow in Inclined Pipes. J Pet Technol 25 (5): 607–617. SPE-4007-PA. http://dx.doi.org/10.2118/4007-PA.
Dabirian, R. 2012. Prediction of Two-Phase Flow Splitting in Looped Lines Based on Energy Minimization. MS Thesis, The University of Tulsa.