pressure prediction model for compression garment … prediction model for compression garment...
TRANSCRIPT

Pressure Prediction Model for CompressionGarment Design
W. Y. Leung,* D. W. Yuen, PhD,* Sun Pui Ng, PhD,† S. Q. Shi, PhD*
Based on the application of Laplace’s law to compression garments, an equation for predict-ing garment pressure, incorporating the body circumference, the cross-sectional area of fab-ric, applied strain (as a function of reduction factor), and its corresponding Young’s modu-lus, is developed. Design procedures are presented to predict garment pressure using theaforementioned parameters for clinical applications. Compression garments have beenwidely used in treating burning scars. Fabricating a compression garment with a requiredpressure is important in the healing process. A systematic and scientific design method canenable the occupational therapist and compression garments’ manufacturer to custom-makea compression garment with a specific pressure. The objectives of this study are 1) to de-velop a pressure prediction model incorporating different design factors to estimate thepressure exerted by the compression garments before fabrication; and 2) to propose moredesign procedures in clinical applications. Three kinds of fabrics cut at different bias angleswere tested under uniaxial tension, as were samples made in a double-layered structure. Setsof nonlinear force-extension data were obtained for calculating the predicted pressure. Us-ing the value at 0° bias angle as reference, the Young’s modulus can vary by as much as 29%for fabric type P11117, 43% for fabric type PN2170, and even 360% for fabric typeAP85120 at a reduction factor of 20%. When comparing the predicted pressure calculatedfrom the single-layered and double-layered fabrics, the double-layered construction pro-vides a larger range of target pressure at a particular strain. The anisotropic and nonlinearbehaviors of the fabrics have thus been determined. Compression garments can be methodi-cally designed by the proposed analytical pressure prediction model. (J Burn Care Res2010;31:716–727)
Compression garments are commonly used in healingburns, or wounds, on patients after plastic surgery. Itacts as the second skin and exerts pressure on thewounded area to prevent the formation of hypertro-phic scar. After the dimensions of a wounded bodypart are obtained by using a measuring tape, a set ofpaper patterns are drawn according to the design ofthe compression garments. The sizes of these patternpieces are then reduced by a predefined percentage togenerate an external pressure on the required bodypart. This percentage is referred to as the reduction
factor. In Hong Kong, most burn cases are referredto occupational therapists in different burn carecenters located in hospitals. As a local clinical prac-tice, compression garments are produced by theoccupational therapists themselves in individualburn care centers. Therefore, they are responsiblefor deciding the appropriate pressure level to beexerted on the wound by means of choosing thecorresponding reduction factor according to the tensilefabric property being used for making the compressiongarments.
During the clinical visit, the occupational therapistmeasures the body size of a particular wound on thepatient, and the tailor makes the compression gar-ment. Depending on the body part, a 5 to 20% re-duction factor is applied to obtain the required levelof pressure.1–4 Each paper pattern is laid on a piece ofelastic fabric to allow a fabric piece in the same shapeto be cut. Finally, the compression garments are madeby sewing up all the fabric pieces. In the review byMacintyre and Baird,2 the recommended pressure
From the *Department of Mechanical Engineering and †Instituteof Textiles and Clothing, The Hong Kong Polytechnic University,Hung Hom, Kowloon, Hong Kong.
Address correspondence to Sun Pui Ng, PhD, Institute of Textilesand Clothing, The Hong Kong Polytechnic University, RmQT306, Yuk Choi Road, Hung Hom, Kowloon 999077, HongKong.
Copyright © 2010 by the American Burn Association.1559-047X/2010
DOI: 10.1097/BCR.0b013e3181eebea0
716

provided by the garment could vary from 5 to 40 mmHg. The required pressure level could also be influ-enced by the duration of treatment, as suggested byWard5 and Gallagher et al.6 A small pressure over along period of time might be equivalent to a largepressure over a short period of time.
Fricke et al7 and Rappoport et al8 reported that ifan excessive amount of pressure was applied on thechild patient with facial burn, patient was at risk fordental or skeletal growth disturbance. A smiliarproblem was also found by Ram et al.9 They stud-ied the effect of pressure therapy for an adult afterorthodontic surgery. The patient was subjected toexcessive pressure from a pressure garment de-signed in the conventional manner. A serious den-tal deformation resulted after wearing the pressuregarment. Therefore, occupational therapists are re-quired to review patients’ healing progress and ad-just the tightness of compression garments on aregular basis. A fit that is too loose or too tightrequires the garment to be refabricated.
As the curvature of a particular body part variesfor different bodily forms, large discrepancies ingarment pressure may result from different patientswhen a unique reduction factor is used for thatbody part. In addition, it is found that the requiredpressure on the wounded area cannot be attainedwhen the fabric grain direction is not aligned withthe stretching direction. Some research has pro-posed that the fabric anisotropic properties wererelated to different fiber orientations10,11; Lo10 de-fined the bias angle to be the angle between thefiber grain and the applied loading directions.However, no study was focused on the applicationof bias angles in designing compression garmentsusing knitted fabrics. Other than the bias angle, thenumber of fabric layers can also increase the pres-sure exerted on patients. Macintyre and Baird2 con-cluded the double layers of compression garmentcan produce greater pressure in treating the scar.However, no further study was done on the selec-tion of the number of fabric to achieve the desiredpressure.
It is well proven that garment pressure can be cal-culated from the fabric tension per unit length andthe curvature of body part. The work by Macintyre3
has provided a scientific method for designing com-pression garments that exert designated pressures. Byusing Laplace’s law, the garment pressure applied ona particular body part can be determined once thefabric tension and the body circumference have beenmeasured and incorporated in the equation. Thismethod has been validated by experimental pressurevalues, and the efficacy of different pressures can bemonitored from a garment made in-house. To pro-vide a more comprehensive methodology, the currentproposed work expresses the fabric tension in terms offabric stiffness at a corresponding strain, which is de-termined from the nonlinear fabric stress–straincurve. Therefore, the fabric tension being incorpo-rated in the Laplace’s law, the calculation will becloser to the real condition. Thus, the predictionmodel can be facilitated by using the fabric stiffnessvalues obtained from the mathematically fitted stress–strain curve, instead of using discrete experimentaltension data. Furthermore, the fabric tension can beaffected by the bias angle effect and the number offabric layers. These factors have also been explored inthis study.
METHODS
Measurement of Fabric Tensile Properties atDifferent Bias AnglesThree types of elastic fabrics were tested in this study.Two of them were suggested by an experienced oc-cupational therapist as they were currently used formaking compression garments in the largest localburn care center. For comparison purposes, a com-monly used elastic fabric for making tight-fit girdleswas also included for testing. All test fabrics are com-posed of nylon yarns but use different percentages ofelastane filaments. Table 1 shows the specifications ofthe test fabrics. Using the Tensile Tester of the Kawa-bata Evaluation System (KES-FB1), the tensile prop-erties at different bias angles were obtained.4,11–13
Table 1. Specifications of test fabrics
Fabric ID P11117 PN2170 AP85120
Usage Compression garment (severe condition; adultpatient)
Compression garment (mild condition;child patient)
Girdle
Composition Nylon: 68%, Spandex�: 32% Nylon: 82%, Spandex�: 18% Nylon: 79%, Roica�: 21%No. of gauge 32 gauge 28 gauge Satin Net 56 gaugeThickness (mm) 0.45 0.42 0.49Weight (g/m2) 213 155 175
Journal of Burn Care & ResearchVolume 31, Number 5 Leung et al 717

A fabric sample of size 20 cm � 20 cm was requiredfor each test. To minimize the effect of temperatureand moisture, all prepared fabric samples were firstkept in a room controlled at a temperature of 20 �2°C and a relative humidity of 65 � 3% for 24 hoursbefore the test. The test was also carried out at thesame environmental settings. As defined in Figure 1,each sample was cut at a bias angle (�) between 0 and90° at 10° increments for the tensile tests. Three fab-ric samples cut at the same bias angle were tested todetermine the average properties. Force and exten-sion data were obtained from the tensile tester. Thecorresponding engineering stresses and strains werecalculated by Equations (1) and (2), respectively.
� �F
A0(1)
where � � engineering stress (Pa), F � tensile forceapplied to the fabric (N), and Ao � cross-sectionalarea of fabric (m2).
� ��ll0
(2)
where � � engineering strain, �l � extension of fabricin the tension test (mm), and l0 � initial length offabric (mm).
The experimental results were postprocessed to rep-resent the stress and the Young’s modulus as functionsof strain so that they can be conveniently used in theproposed analytical pressure prediction model. Thestress–strain data points were fitted with a second-orderpolynomial as given in Equation (3), and the Young’smodulus (E) was derived in Equation (4) by differenti-ating Equation (3) with respect to the applied strain.
���� � a1� � a2�2 (3)
where a1, a2 � coefficients of the second-orderpolynomial.
E��� ��
�� a1 � 2a2� (4)
Figure 1. Fabric samples along different bias directions.
Figure 2. Experiment setup on testing the double-layered fabrics.
Table 2. Summary of tested double-layeredfabrics combinations
Bias Angle
Fabric 1 (P11117) Fabric 2 (P11117)0° 0°0° 10°0° 90°40° 50°80° 90°
Fabric 1 (PN2170) Fabric 2 (PN2170)0° 0°0° 10°0° 90°40° 50°80° 90°
Fabric 1 (P11117) Fabric 2 (PN2170)0° 0°0° 90°90° 0°
Journal of Burn Care & Research718 Leung et al September/October 2010
Measurement of Fabric Properties forDouble-Layered FabricsSome studies2,14,15 have suggested that garmentpressure would be increased by a double-layered con-struction. To evaluate the effective tensile property ofa composite compression garment, an experimentwas conducted on two overlaid fabrics. The setup andtesting conditions were the same as in the single-layered fabric test, except that two layers of fabricswere first seamed together before the experiment, asdenoted in Figure 2. The size of the fabrics remainedunchanged in this test. When the fabrics are under thesame strain, the total load sustained by the composite,Fc, is the sum of the forces experienced by fabric 1, F1,and fabric 2, F2, as shown in Equation (5). Table 2summarizes the combinations tested.
F� � F1 � F2 (5)
Because F � �A and � � E, Equation (5) can berewritten as Equation (6):
Ec�� A1 � A2� � E1�A1 � E2�A2 (6)
where Ec � effective Young’s modulus of compositefabric at strain � (Pa), E1 � Young’s modulus of fabric1 at strain � (Pa), E2 � Young’s modulus of fabric 2 at
strain � (Pa), A1 � cross-sectional area of fabric 1, andA2 � cross-sectional area of fabric 2.
After rearrangement, the Young’s modulus of acomposite fabric can be obtained as Equation (7):
Ec � E1
A1
A1 � A2� E2
A2
A1 � A2(7)
Because all fabric samples were cut in the same widthfor testing, the variables of areas in Equation (7) werethen replaced by the individual fabric thicknesses, andthe equivalent composite Young’s modulus was fur-ther simplified to Equation (8):
Ec � E1
t1
t1 � t2� E2
t2
t1 � t2(8)
where t1 � thickness of fabric 1 and t2 � thickness offabric 2. The values of E1, E2 and t1, t2 are given inTable 3.
Prediction of Garment Pressure Using theLaplace’s LawEquation (9) shows Laplace’s law, which is widelyused in predicting the pressure generated by com-pression garment:3,16–18
P �Tr (9)
where P � garment pressure (Pa), T � tension perunit fabric length (N/m), and r � radius of curvatureof the circular surface (m).
From this equation, it can be seen that onlythe tension per unit length T is significant in pro-
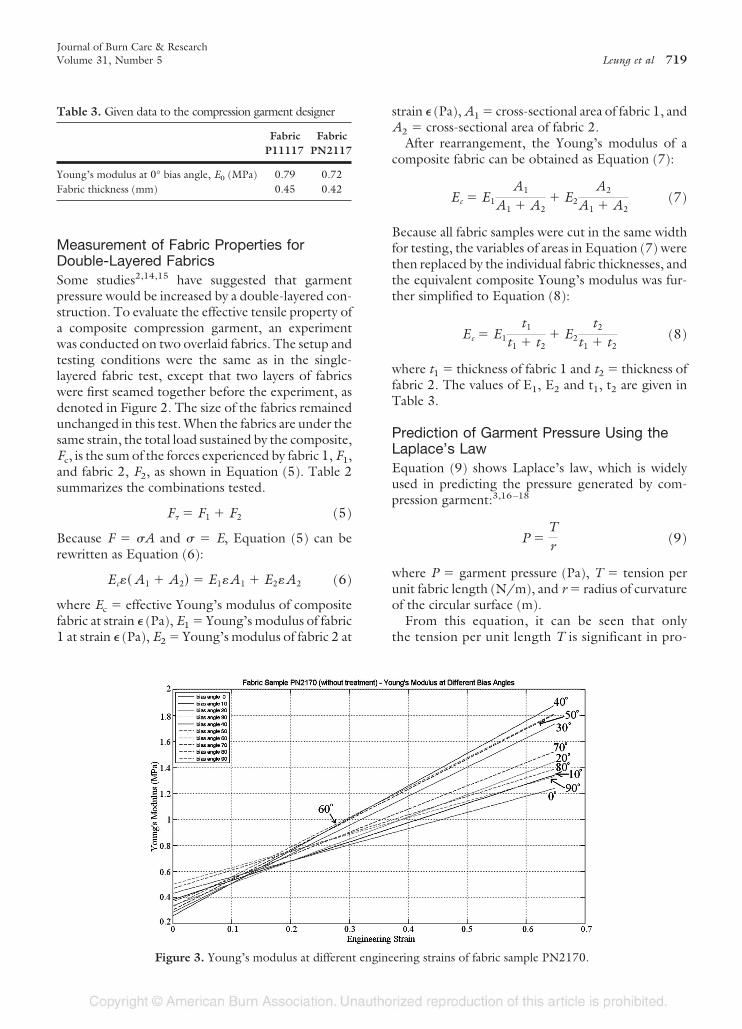
Figure 3. Young’s modulus at different engineering strains of fabric sample PN2170.
Table 3. Given data to the compression garment designer
FabricP11117
FabricPN2117
Young’s modulus at 0° bias angle, E0 (MPa) 0.79 0.72Fabric thickness (mm) 0.45 0.42
Journal of Burn Care & ResearchVolume 31, Number 5 Leung et al 719

viding a specific garment pressure for a particularbody part (ie, a fixed r). Based on Equations (1)and (4),
E �F
A0�
at a particular strain. Because
T �F
l0 � �l �F
l0�1 � ��,
the tension T can be expressed in terms of theYoung’s modulus as shown in Equation (10):
T �EA0�
l0�1 � ��(10)
It should be noted that l0 is the circumference ofthe compression garment before wearing orstretching. Consider c � circumference of bodypart � 2�r and 1 mm Hg is equal to 133.32 Pa inEquation (9), the garment pressure P (in mm Hg)exerted on a patient at a particular curvature r andstrain � can be calculated in terms of the tensilefabric properties as shown in Equation (11):
P �2�EA0�
133.32cl0�1 � ��(11)
When f denotes the reduction factor of the com-pression garment, l0 � c (1 � f). As an example, thelength of a compression garment (l0) will be 80% ofthe target body circumference (c) if a reductionfactor (f) of 20% is used. In addition, the extensionof a compression garment (�l) should be equal to(c � l0).
Figure 4. A, Change of Young’s modulus at different biasangles of fabric sample P11117. B, Change of Young’smodulus at different bias angles of fabric sample PN2170.C, Change of Young’s modulus at different bias angles offabric sample AP85120.
Figure 5. SEM photos of fabric sample P11117 at biasangle at (A) 0% strain and (B) 100% strain.
Journal of Burn Care & Research720 Leung et al September/October 2010

Thus,
f �1 l0
c ��l
l0 � �l ��
1 � �(12)
and
l0 � c�1 f � � c�1 �
1 � �� �c
1 � �
(13)
Substituting Equation (13) into Equation (11),
P �2�EA0�
133.32c2 (14)
RESULTS AND DISCUSSION
Anisotropic Properties of Single-LayeredFabricsThe Young’s moduli of fabrics generally increased withthe engineering strain at all bias angles. A typical plot ofYoung’s modulus versus strain for fabric type PN2170 isshown in Figure 3. The anisotropic behaviors of thefabrics were confirmed as the Young’s moduli were dif-ferent when measured at different bias angles andstrains. The effect of such fabric anisotropy on compres-sion garment design could be discussed with ease byreplotting the data with the bias angle as the horizontalaxis as shown in Figure 4. The Young’s moduli varied
Figure 6. A, Effective Young’s modulus of double-layered fabric (P11117-0° � P11117-0°). B, Effective Young’s modulus ofdouble-layered fabric (PN2170-0° � PN2170-0°).
Journal of Burn Care & ResearchVolume 31, Number 5 Leung et al 721

drastically with bias angles. Using the Young’s modulusat 0° bias angle as the reference value, the Young’s mod-ulus can vary by as much as 29% for P11117, 43% forPN2170, and even 360% for AP85120 at a reductionfactor of 20% (or 0.25 strain). For each kind of fabric,the highest Young’s modulus value could be observed ata specific bias angle. Referring to fabrics P11117 andAP85120, the highest Young’s modulus was found atbias angle 90° among all strains, whereas it was mea-sured at 60° for fabric PN2170.
The structure of a knitted fabric attributes its aniso-tropic properties. To illustrate this fact, the change ofyarn geometry of fabric P11117 loaded at 30° bias anglewas captured by a scanning electron microscope. In Fig-
ure 5A, six connected knots of the unloaded fabric areindicated as dots and they form an inclined rectangle.When the fabric was stretched at 100% strain, the sixknots were deformed and a horizontally aligned hexa-gon was formed as shown in Figure 5B. When the fabricwas loaded in this particular angle, both wale and courseelastic yarns equally shared the applied tension. There-fore, the Young’s modulus at this bias angle was nearlyconsistent at the concerned range of strain.
Anisotropic Properties of Double-LayeredFabricsAfter overlaying one layer of fabric P11117 at 0° biasangle with a second layer of fabric P11117 also at 0°
Figure 7. A, Effective Young’s modulus of double-layered fabric (P11117-0° � P11117-10°). B, Effective Young’s modulusof double-layered fabric (PN2170-0° � PN2170-10°).
Journal of Burn Care & Research722 Leung et al September/October 2010

bias angle, the KES-F tensile test was conducted, andthe results were postprocessed to produce Figure 6A.The experimental results for fabric PN2170 under thesame test are given in Figure 6B. It could be observedthat even if both layers were of the same fabric and ofthe same bias angle, the double-layered constructionproduced a different E versus � curve. The reason maybe that the load was partially shared by the seam linesduring the tensile test. At large strains, the stretchedfabrics appeared wavy, implying that the load was notuniformly distributed across the width of the fabricsample. The results for two other sets of bias anglescombinations, 0° � 10° and 40° � 50°, are given inFigures 7 and 8, respectively. Equation (8) was used
to predict the effective modulus of elasticity of thedouble-layered compression garment, and the pre-dicted values were slightly higher than the experimentalvalues at all strains. Results of experiments on overlayingtwo different fabrics, P11117 and PN2170, at differentbias angles are shown in Figures 9 and 10. It can benoticed that Equation (8) still works for a double-lay-ered garment made from the two fabrics as the predictedtrend, and values of Young’ modulus at various strainswere close to the experimental ones. Furthermore, theYoung’s modulus of the double-layered constructionvaried less with the engineering strain when comparedwith individual fabrics. The key point is to select a fabricin which its Young’s modulus increases with the applied
Figure 8. A, Effective Young’s modulus of double-layered fabric (P11117-40° � P11117-50°). B, Effective Young’s modulusof double-layered fabric (PN2170-40° � PN2170-50°).
Journal of Burn Care & ResearchVolume 31, Number 5 Leung et al 723

strain while the other exhibits a decrease in Young’smodulus. By using this double-layered construction,the occupational therapist can produce a compressiongarment exerting more consistent pressure over a largerrange of strains. The following numerical example high-lights this advantage.
Suppose an occupational therapist is required todesign a compression garment that can exert a pres-sure of 25 mm Hg on certain body part of a patient.The circumference c of the body part is found to be0.27 m by measurement. The occupational therapistis given the following data.
The occupational therapist uses the modifiedLaplace’s law (Equation 14) to design the compres-
sion garment. Using the conventional single-layeredconstruction, if fabric P11117 is selected, the strainrequired is 0.4 (or 29% reduction factor). Alterna-tively, if fabric PN2170 is selected, the strain requiredis 0.47 (or 32% reduction factor).
However, the Young’s moduli of both fabrics are sen-sitive to the applied strain. The Young’s modulus offabric P11117 is actually 0.6559 MPa at 0.4 strain,which implies that the exerted garment pressure is just20.61 mm Hg. The percentage difference is �17.56%.On the other hand, the Young’s modulus of fabricPN2170 is 0.9766 MPa at 0.47 strain, which impliesthat the exerted garment pressure exerted is increased to33.65 mm Hg. The percentage difference is �34.6%.
Figure 10. Effective Young’s modulus of double-layered fabric (P11117-0° � PN2170-90°).
Figure 9. Effective Young’s modulus of double-layered fabric (P11117-0° � PN2170-0°).
Journal of Burn Care & Research724 Leung et al September/October 2010

If the occupational therapist uses a double-layeredconstruction, the 25 mm Hg pressure exerted will beshared by the two different fabrics. If the pressureexerted by fabric P11117 is 15 mm Hg, and fabricPN2170 is 10 mm Hg, the strain required is 0.24(19.5% reduction factor) for fabric P11117 and0.19 (15.9% reduction factor) for fabric PN2170.
Again, because of strain sensitivity, the Young’smodulus of fabric P11117 is actually 0.8012 MPa at0.24 strain, which implies that the exerted garmentpressure is 15.21 mm Hg. The percentage differenceis �1.42%. On the other hand, the Young’s modulusof fabric PN2170 is 0.6528 MPa at 0.19 strain, whichimplies that the exerted garment pressure is increasedto 9.067 mm Hg. The percentage difference is�9.33%. The total pressure is 24.277 mm Hg, andthe overall percentage difference is just �2.89%. Thedouble-layered garment can deliver the target pres-sure whereas the single-layered garments cannot. Ta-ble 4 summarizes the calculations for the example.
The experiments on the double-layered construc-tion also pave the way toward multilayered construc-tion and point to other possible ways of sewing dif-ferent fabrics together to fabricate compressiongarments that have the desired properties.
Design Procedures for Clinical ApplicationThe experiments on fabric anisotropy and double-lay-ered construction provide clues to a better way of de-signing compression garment. Until now, occupationaltherapists have only varied the reduction factor and thetype of fabrics in their design. The design space is veryconstrained. If the anisotropic tensile property of the
fabric is used, then each type of fabrics has a range ofYoung’s modulus to offer, instead of a single value. Thedouble-layered construction approach further allowsthe occupational therapist to combine either the sametype of fabrics or different types of fabrics at differentbias angles to yield the desired properties. The designspace is thus enlarged many times. In the following para-graphs, a design example is presented to illustrate thepower of these new tools.
Suppose a therapist is requested to design a com-pression garment that can exert a pressure P ofvalue 25 mm Hg on a patient’s body part that has acircumference c of 0.27 m. Using Table 5, the ther-apist has several choices to achieve the desired pres-sure. The therapist can select to provide 14.99 mmHg pressure with a layer of fabric P11117 at 15%reduction factor and bias angle 90° and 10.16 mmHg pressure with another layer of fabric PN2170 at15% reduction factor and bias angle 30°. The dou-ble-layered construction using the two fabrics willcombine to provide a total garment pressure of25.15 mm Hg, close to 25 mm Hg.
Alternatively, the therapist can also stick with asingle-layered construction and apply a higher reduc-tion factor to achieve the desired pressure. From Ta-ble 5, fabric AP85120 at 20% reduction factor andbias angle 60° can produce 23.09 mm Hg pressurethat is close to 25 mm Hg.
CONCLUSIONS
In the common practice of compression gar-ment design, only the types of elastic fabric andreduction factor are applied to define the elasticity.
Table 4. An example calculation of single-layered and double-layered garments
Required Strain, �
ReductionFactor, f
Corresponding Young’sModulus, E� (MPa)
Actual Pressure,P (mm Hg)
%Difference
Single-layer approachP11117 (target pressure � 25 mm Hg)
0.4 29% 0.6559 20.61 �17.56%PN2170 (target pressure � 25 mm Hg)
0.47 32% 0.9766 33.65 �34.6%Double-layer approach
P11117 (target pressure � 15 mm Hg)0.24 19.5% 0.8012 15.21 �1.42%
PN2170 (target pressure � 10 mm Hg)0.19 15.9% 0.6528 9.067 �9.33%
Overall % difference for double-layered approach ��9.067 � 15.21� 25
25 100% � �2.89%
Journal of Burn Care & ResearchVolume 31, Number 5 Leung et al 725

This custom-made garment may not reach thedesired pressure by considering these two factorsalone. A diverse design of compression garment cancombine different requirements.
This study has demonstrated a scientific and sys-tematic approach to the design of compression gar-ment by considering more factors, including thenumber of layers in construction and the anisotro-pic behavior of the fabric. Occupational therapistscan combine different design factors to achieve the
optimal pressure for a particular wearer. The choice indesigning the custom-fitted compression garmentcan be wider and more flexible. In the example illus-trated, the target pressure can be achieved in twoways: double-layered fabrication of different fabrics atthe same reduction factor or selecting some higherreduction factors. Occupational therapists can there-fore choose the most suitable garment constructionfor designated pressure level during the recoveryprocess.
Table 5. Design table for three fabrics
Strain
Bias Angle
0.1 (10% ReductionFactor)
0.18 (15% ReductionFactor)
0.25 (20% ReductionFactor)
E (MPa) P (mm Hg) E (MPa) P (mm Hg) E (MPa) P (mm Hg)
Fabric sample: P11117 (fabric thickness �
0.45 mm)0° 0.93 7.30 0.86 12.16 0.79 15.5110° 0.91 7.15 0.85 12.02 0.79 15.5120° 0.84 6.60 0.79 11.17 0.76 14.9230° 0.77 6.05 0.75 10.60 0.74 14.5340° 0.69 5.42 0.7 9.90 0.72 14.1450° 0.67 5.26 0.69 9.76 0.71 13.9460° 0.75 5.89 0.77 10.89 0.79 15.5170° 0.91 7.15 0.9 12.72 0.89 17.4880° 1.1 8.64 1.01 14.28 0.98 19.2490° 1.11 8.72 1.06 14.99 1.02 20.03
Fabric sample: PN2170 (fabricthickness � 0.42 mm)
0° 0.55 4.03 0.64 8.45 0.72 13.2010° 0.53 3.89 0.64 8.45 0.74 13.5620° 0.51 3.74 0.65 8.58 0.77 14.1130° 0.55 4.03 0.77 10.16 0.94 17.2340° 0.56 4.11 0.8 10.56 1.01 18.5150° 0.58 4.25 0.8 10.56 0.99 18.1460° 0.61 4.47 0.83 10.95 1.02 18.6970° 0.55 4.03 0.7 9.24 0.83 15.2180° 0.62 4.55 0.73 9.63 0.83 15.2190° 0.63 4.62 0.73 9.63 0.82 15.03
Fabric sample: AP85120 (fabricthickness � 0.49 mm)
0° 0.34 2.91 0.4 6.16 0.44 9.4110° 0.33 2.82 0.38 5.85 0.43 9.1920° 0.31 2.65 0.36 5.54 0.42 8.9830° 0.31 2.65 0.38 5.85 0.44 9.4140° 0.35 2.99 0.44 6.77 0.52 11.1250° 0.46 3.93 0.63 9.70 0.78 16.6860° 0.66 5.64 0.88 13.55 1.08 23.0970° 0.91 7.78 1.17 18.01 1.4 29.9480° 1.04 8.90 1.36 20.94 1.63 34.8590° 1.1 9.41 1.4 21.55 1.67 35.71
Values in boldface indicate the solution to the design example.
Journal of Burn Care & Research726 Leung et al September/October 2010

ACKNOWLEDGMENTS
We thank Ms. Amelia Chan, PDOT, occupationaltherapist in Princess of Wales Hospital, for providinga professional consultation.
REFERENCES
1. Ng SF. Medical clothing: a tutorial paper on pressure gar-ments. Int J Cloth Sci Technol 1993;5:17–24.
2. Macintyre L, Baird M. Pressure garments for use in the treat-ment of hypertrophic scars—a review of the problems associ-ated with their use. Burns 2006;32:10–5.
3. Macintyre L. Designing pressure garments capable of exert-ing specific pressures on limbs. Burns 2007;33:579–86.
4. Macintyre L, Gilmartin S, Rae M. The impact of design vari-ables and aftercare regime on the long-term performance ofpressure garments. J Burn Care Res 2007;28:725–33.
5. Ward RS. Pressure therapy for the control of hypertrophicscar formation after burn injury. A history and review. J BurnCare Rehabil 1991;12:257–62.
6. Gallagher JM, Kaplan S, Maguire GH, Leman CJ, Johnson P,Elbaum L. Compliance and durability in pressure garments.J Burn Care Rehabil 1992;13:239–43.
7. Fricke NB, Omnell ML, Dutcher KA, Hollender LG, EngravLH. Skeletal and dental disturbances in children after facialburns and pressure garment use: a 4-year follow-up. J BurnCare Rehabil 1999;20:239–49.
8. Rappoport K, MuLler R, Flores-Mir C. Dental and skeletalchanges during pressure garment use in facial burns: a sys-tematic review. Burns 2008;34:18–23.
9. Ram S, Abraham A, Daniel JH, Shlomo C. Effect of facialpressure garments for burn injury in adult patients after orth-odontic treatment. Burns 2001;27:409–12.
10. Lo WM. A study of fabric anisotropy. PhD thesis, The HongKong Polytechnic University; 2001.
11. Ng SP, Ng R, Yu W. Bilinear approximation of anisotropicstress-strain properties of woven fabrics. Res J Text Apparel2005;9:50–6.
12. Liu R, Kwok Y, Li Y, Lao T, Zhang X. Effects of materialproperties and fabric structure characteristics of graduatedcompression stockings (GCS) on the skin pressure distribu-tions. Fibers Polym 2005;6:322–31.
13. Li Y, Dai XQ. Fabrics—KES-F System and the FAST System.In: Li Y, Dai XQ, editors. Biomechanical Engineering of Tex-tiles and Clothing. 1st ed. Cambridge, UK: WoodheadPublishing; 2006. p. 208–14.
14. Robertson JC, Druett JE, Hodgson B, Druett J. Pressuretherapy for hypertrophic scarring: preliminary communica-tion. J R Soc Med 1980;73:348–54.
15. Hui CL, Ng SF. Model to predict interfacial press-ures in multilayer elastic fabric tubes. Text Res J 2001;71:683–7.
16. Yu W, Fan JT, Qian XM, Tao XM. A soft mannequin for theevaluation of pressure garments on human body. Sen’i Gak-kaishi 2004;60:57–64.
17. Seo H, Kim SJ, Cordier F, Hong K. Validating a cloth sim-ulator for measuring tight-fit clothing pressure. In: Bruno L,Dinesh M, editors. Proceedings of the 2007 ACM Sympo-sium on Solid and Physical Modeling, Tsinghua University,Beijing, June 04–06, 2007. p. 431–7.
18. Yildiz N. A novel technique to determine pressure in pressuregarments for hypertrophic burn scars and comfort properties.Burns 2007;33:59–64.
Journal of Burn Care & ResearchVolume 31, Number 5 Leung et al 727