pretrial detention and case processing measures: a … detention and case processing measures: ......
TRANSCRIPT

i
Pretrial Detention and Case Processing Measures:
A Study of Nine New Mexico Counties
Authored by: Kristine Denman
Research assistance:
Veronica Carrion Erin M. Ochoa
Maribel Jáuregui Connor Magnuson
Karin Thomas
Report preparation assistance: Veronica Carrion
Jenna Dole Maribel Jáuregui
Connor Magnuson
New Mexico Statistical Analysis Center
Kristine Denman, Director November 25, 2016
rev. 5/26/17
June 2009
This project was supported by Grant # 2014-BJ-CX-K024 from the State Justice Statistics program. The State Justice Statistics program is a
component of the Office of Justice Programs which also includes the Bureau of Justice Statistics, the National Institute of Justice, the Office of
Juvenile Justice and Delinquency Prevention, and the Office for Victims of Crime. Points of view or opinions in this document are those of the
author and do not represent the official position or policies of the United States Department of Justice.

ii
Acknowledgements
We would like to thank the detention centers who provided the data for this study. We would also like
to thank the New Mexico Association of Counties for their assistance in identifying detention centers
who may be willing to participate and facilitating data. In addition, we appreciate their willingness to
allow us to use their data for this study. We would also like to thank the New Mexico Sentencing
Commission for their assistance with this project.
Finally, I would like to express my appreciation to the research staff who worked on this project. This
project would not have been possible without their hard work and assistance.

iii
Table of contents
Contents Section I. Introduction.................................................................................................................................. 1
New Mexico county detention centers ..................................................................................................... 2
Pretrial detention process in New Mexico ................................................................................................ 3
Assessment of case processing and pretrial detention in New Mexico ................................................... 3
Report Contents ........................................................................................................................................ 4
Section II. Study purpose and questions ...................................................................................................... 5
Methods .................................................................................................................................................... 6
Data sources and access ....................................................................................................................... 6
Procedures ................................................................................................................................................ 7
Identified the sample ............................................................................................................................ 7
Sample inclusion and exclusion criteria ................................................................................................ 7
Sample Description ................................................................................................................................... 9
Data elements ......................................................................................................................................... 10
Case processing variables ................................................................................................................... 10
Pretrial compliance/performance....................................................................................................... 11
Legal and extralegal factors ................................................................................................................ 11
Analytic approach ................................................................................................................................... 12
Section III. Case processing statistics and performance measures............................................................ 14
Court cases found ................................................................................................................................... 14
Number of court cases and court venue ............................................................................................ 14
Characteristics of court cases found compared to eligible cases ....................................................... 14
Time to case filing ................................................................................................................................... 17
Time between offense to case filing ................................................................................................... 18
Timing of booking relative to case filing ............................................................................................. 19
Measures of time to adjudication ........................................................................................................... 20
Clearance rate by booking ...................................................................................................................... 22
Clearance rate by court venue ............................................................................................................ 23
Average time to adjudication among cases disposed within two years ............................................. 23
Conviction and sentencing ...................................................................................................................... 24

iv
Section IV. Pretrial detention ..................................................................................................................... 25
Pretrial detention rates and time ........................................................................................................... 25
Length of pretrial detention by county ............................................................................................... 26
Characteristics of detainees .................................................................................................................... 28
Demographic characteristics of those detained pretrial .................................................................... 29
Current offense and pretrial detention .............................................................................................. 30
Prior offenses and pretrial detention ................................................................................................. 30
Pretrial detention and bond.................................................................................................................... 31
Relative influence of legal and extralegal variables on pretrial detention ............................................. 32
Influence of legal and extralegal factors on pretrial detention by court venue ................................. 35
Influence of legal and extralegal variables on length of pretrial detention ........................................... 36
Length of detention by court venue ................................................................................................... 38
Section V. Pretrial performance ................................................................................................................. 40
Section VI. Relationship between pretrial detention and case outcomes................................................. 42
Custody status and adjudication rates .................................................................................................... 42
Days to disposition by custody status pretrial ........................................................................................ 43
Pretrial detention by adjudication status ............................................................................................... 43
Relative influence of legal and extralegal variables on adjudication ...................................................... 44
Length of time to adjudication ................................................................................................................ 46
Conviction and pretrial detention ........................................................................................................... 48
VII. Conclusion ............................................................................................................................................. 52
Case processing and performance measures ......................................................................................... 52
Cases accepted for prosecution .......................................................................................................... 52
Time to case filing ............................................................................................................................... 52
Time to adjudication and rates of disposition .................................................................................... 53
Conviction rates .................................................................................................................................. 53
Pretrial detention .................................................................................................................................... 54
Factors associated with pretrial detention ......................................................................................... 54
Success during pretrial period ............................................................................................................ 55
Influence of pretrial detention on adjudication ................................................................................. 55
Influence of pretrial detention on conviction ..................................................................................... 56
Discussion and recommendations .......................................................................................................... 57

v
Study limitations and future research .................................................................................................... 59
References .................................................................................................................................................. 61
Appendices .................................................................................................................................................. 63
Appendix A. Map of New Mexico judicial districts ................................................................................ 64
Appendix B. Description of all detainees and sample detainees ............................................................ 65
Appendix C. Time between booking and offense by court venue .......................................................... 67
Appendix D. Time between booking and filing by county ..................................................................... 68
Appendix E. Days detained using point in time versus longitudinal data .............................................. 70
Appendix F. Detention results with and without Colfax and Sandoval counties ................................... 71
Appendix G. Pretrial detention and bond .............................................................................................. 74
Appendix H. Characteristics by adjudication and conviction status ...................................................... 75
Appendix I. Adjudication logistic regression models ............................................................................. 78
List of Tables Table II.1 Bookings and Eligible Cases ......................................................................................................... 10 Table III.1 Bookings Associated with Multiple Court Cases by Court Venue .............................................. 14 Table III.2 Demographics of Eligible Cases and Those Found in Court ....................................................... 15 Table III.3 County of Origin by Eligible Cases and Those Found in Court ................................................... 16 Table III.4 Current Offense by Eligible Cases and Those Found in Court .................................................... 16 Table III.5 Prior Criminal History by Eligible Cases and Those Found in Court ........................................... 17 Table III.6 Days between Offense Date and First Court Case Filing Date ................................................... 19 Table III.7 Timing of Filing from Booking by Court Venue and Degree of Offense ..................................... 19 Table III.8 Average Number of Days from Booking to Filing by Custody Status ......................................... 20 Table III.9 Average Time to Disposition by Court Venue by Case ............................................................... 21 Table III.10 Time to Disposition by Court Venue by Case .......................................................................... 22 Table III.11 Months to Disposition for All Cases Associated with Booking ................................................. 22 Table III.12 Average Time to Adjudication .................................................................................................. 24 Table III.13 Case Outcomes ......................................................................................................................... 24 Table III.14 Sentence Type by Court Venue ............................................................................................... 24 Table IV.1 Average Time Detained .............................................................................................................. 25 Table IV.2 Average Time Detained by Pretrial Detention Period ............................................................... 26 Table IV.3 Length of Pretrial Detention ...................................................................................................... 27 Table IV.4 Median Time Detained by Period Detained and County ........................................................... 27 Table IV.5 Demographic Characteristics by Detention Status .................................................................... 29 Table IV.6 Pretrial Detention by Current Offense ....................................................................................... 30 Table IV.7 Pretrial Detention by Criminal History ....................................................................................... 31 Table IV.8 Pretrial Detention and Bond ...................................................................................................... 32 Table IV.9 Logistic Regression Results: Detained or Not ............................................................................ 34 Table IV.10 Logistic Regression Results: Pretrial Detention by Court Venue ............................................. 36 Table IV.11 Multiple Regression Results: Length of Pretrial Detention ...................................................... 37

vi
Table IV.12 Multiple Regression Results: Length of Pretrial Detention with and without Bond Variable 38 Table IV.13 Multiple Regression Results: Length of Detention by Court Venue ........................................ 39 Table V.1 New Offenses, FTAs, and Overall Pretrial Compliance ............................................................... 40 Table V.2 Offense Type Among Those Who Had a New Arrest Pretrial ..................................................... 41 Table VI.1 Time to Disposition by Period Detained and Court Venue ........................................................ 43 Table VI.2 Time Detained by Disposition and Court Venue ........................................................................ 44 Table VI.3 Logistic Regression Results: Adjudication within Two Years All Cases and by Court Venue .... 46 Table VI.4 Multiple Regression Results: Time to Adjudication All Cases and by Court Venue ................... 48 Table VI.5 Time Detained by Conviction Status .......................................................................................... 49 Table VI.6 Conviction Status by Detention Period and Court Venue .......................................................... 49 Table VI.7 Whether Convicted Among Cases Disposed Within Two Years ................................................. 51
List of Figures Figure III.1 Percent of Cases Disposed by Court Venue and Time to Disposition ....................................... 23 Figure IV.1 Length of Pretrial Detention ..................................................................................................... 25 Figure IV.2 Percent of Detainees Released by Number of Days Detained ................................................. 28 Figure VI.1 Custody Status and Adjudication by Time Detained and Court Venue .................................... 42
List of Appendix Figures and Tables
Table B.1 Characteristics of Detainees ....................................................................................................... 65 Table B.2 County Detention Center of Detainees ....................................................................................... 65 Table B.3 Current Offense of Detainees ..................................................................................................... 66 Table B.4 Prior Offense History of Detainees ............................................................................................. 66 Table C.1: Time Between Booking and Offense .......................................................................................... 67 Table C.2: Time Between Booking and Offense by County ........................................................................ 67 Table D.1: Timing of Booking Relative to Filing .......................................................................................... 68 Table D.2: Time from Booking to Filing by County ..................................................................................... 68 Table E.1 Demographic Characteristics by Detention Status ..................................................................... 71 Table E.2 Logistic Regression Results: Detained or Not .............................................................................. 72 Table E.3 Logistic Regression Results: Detained or Not by Court Venue .................................................... 73 Table F.1 Logistic Regression Results of Pretrial Detention and Bond ...................................................... 74 Table G.1 Demographics by Adjudication and Conviction Status .............................................................. 75 Table G.2 County of Booking by Adjudication and Conviction Status ....................................................... 75 Table G.3 Current Offense by Adjudication and Conviction status ........................................................... 76 Table G.4 Criminal History by Adjudication and Conviction Status ........................................................... 77 Table H.1 Adjudication with All Cases Logistic Regression Models ........................................................... 78 Table H.2 Adjudication with Magistrate Court Only Logistic Regression Models ..................................... 79 Table H.3 Adjudication with District Court Only Logistic Regression Models............................................ 80

1
Section I. Introduction Pretrial detention has garnered attention throughout the nation. Studies suggest individuals are
unnecessarily detained (Green, 2011, Subramanian et al. 2015) and this is certainly a concern in New
Mexico. For example, many individuals in Bernalillo County are detained for relatively minor offenses up
to the initial court appearance (Steelman, 2009) or beyond (Guerin, 2013; Kalmanoff et al. 2014).
Freeman’s (2012) length of stay study of select counties reiterates that many misdemeanants are
detained for some time in detention facilities throughout the state, with an overall median of 80 days
ranging up to a median of 106 days at one facility. The length of detainment impacts more than the
detainee. It also drains jail resources that would likely be better spent on those who have been
convicted, rather than housing those who have not been convicted for an extended period of time.
There are likely many causes of excessive and unnecessary pretrial detention. Experts suggest that the
use of an appropriate risk needs assessment, bail reform, alternatives to detention, and enhanced case
processing may all play a role in improving the situation (Came, 2015; Greene, 2011; Kalmanoff et al.
2014; Subramanian et al. 2015). In New Mexico, while the court is statutorily required (Rule 5-401 §C
NMRA) to take into account various factors when determining conditions of release (e. g., the nature of
the crime, character history, potential harm to the community if released, likelihood to appear), they do
not administer a standardized risk needs assessment, as is the case in many jurisdictions across the
nation (Pretrial Justice Institute, 2014). Some jail inmates may be held only because they cannot afford
bail (Pretrial Justice Institute, 2014). Indeed, in their review of Bernalillo County case flow, Steelman et
al. (2009) report that one complaint against judges in the metro court is their “propensity to set high
bonds” resulting in motions to lower bond (Steelman et al., 2009) and the unnecessary detainment of
some individuals. Among those who are released pretrial, Steelman et al. (2009) found high rates of
failure to appear.1 Together, these findings suggest that the lack of a validated RNA is problematic, and
possibly results in detention of individuals who do not need to be detained and release of individuals
who should not be released.
Importantly, in New Mexico, nearly all defendants are considered bail-eligible, as currently written in the
New Mexico Constitution, Article II, §. 13. This article indicates that judges are not allowed to require
defendants to post excessive bail and are not allowed to detain individuals except under very specific
circumstances (e.g., capital offenses), though clearly judges sometimes do order what would be
considered excessive bail. As written, the state constitution does not allow judges to consider factors
such as the defendant’s flight risk or the danger they pose to the community when making decisions
about pretrial detainment. The rule noted in the paragraph above (Rule 5-401 §C NMRA) governs
conditions of release, not whether the individual should be released. Currently, there is a proposed
constitutional amendment that would reform New Mexico’s bail practices. It would allow judges to
consider the risk the individual poses to the community and their flight risk when determining whether
1 Steelman et al. (2009) report that 60-70% of felony cases processed in Bernalillo County involve failure to appear
and bench warrants.
2
bail is allowable. This issue will be brought to New Mexico voters in the upcoming November election.
This is an important consideration to ensure appropriate decisions are made regarding who should be
released and who should be detained.
Slow court case processing also adds significantly to the problem of pretrial detention. Importantly,
rules limiting time to prosecution in district court (Rule 5-604 § B NMRA) were rescinded by the New
Mexico Supreme Court in 2011, such that there is currently no state statute governing maximum
acceptable time limits between case filing and commencement of trial for felony cases for most of New
Mexico. Similarly, Rule 6-802 § C NMRA requiring judges to have a hearing for probation violators
within 30 days was overturned in 2013. However, in 2015, in an effort to reduce overcrowding at the
Bernalillo Metropolitan Detention Center and increase speedy resolution of cases, the New Mexico
Supreme Court enacted Local Rule 2-400. This rule requires that cases go to trial within a specific time
frame depending on the factors of the case; it applies only to cases tried in the Second Judicial District
(Bernalillo County). There is a rule, however, governing maximum time limits for magistrate courts (Rule
6-506 NMRA). This rule indicates that cases must be heard within 182 days of arraignment (or other
dates if there are other considerations, like competency assessments).
New Mexico county detention centers Like other jails across the country, county detention facilities in New Mexico hold individuals convicted
of a crime (serving a sentence of 364 days or less), those arrested for a new crime, and individuals
detained for probation/parole violations awaiting judgment and sentencing. Counties are therefore
responsible for housing numerous types of inmates. Unlike many other states, though, the population
of jail inmates in New Mexico has historically exceeded that of the state prisons (Steelman et al., 2013).2
County detention facilities struggle with both the cost of housing pretrial detainees and managing the
jail population to avoid overcrowding. The decision to order pretrial detention rests with judges. While
detention costs and overcrowding are certainly of concern to the judiciary, judges must base their
decisions on ensuring both defendants’ attendance at court proceedings and community safety.
Detention practices and pretrial length of stay are further influenced by factors such as local law culture
and statutes, including speedy trial rules and plea practices.
Pretrial detention has been associated with a host of problems for the detainee as well. For example,
research suggests individuals detained pretrial tend to have more severe sentences even after other
variables such as demographics, offense type, and criminal history are controlled for (LJAF, 2013; Sacks
and Ackerman, 2014). Moreover, pretrial detention can have other unintended consequences. For
example, low risk offenders may be more likely to re-offend if detained (LJAF, 2013; Lowenkamp,
VanNostrand, and Holsinger, 2013).
2 Recent estimates indicate the jail population has decreased recently, driven largely by declines in jail stays within
Bernalillo County (NMSC, 2016).

3
Pretrial detention process in New Mexico In New Mexico, everyone who is arrested for a felony offense is booked into a county detention facility,
though individuals may also be booked for a less serious crime. Fingerprint and palm print impressions
are taken, and a state tracking number is assigned to the prints and booking sheet (NMSA 29-3-8). The
detainee may post bail, be eligible for bond, or released on recognizance prior to an initial appearance
(Rule 5-401 NMRA). The next step is the initial appearance, where the individual may post bail if not yet
released, be released on his/her own recognizance, or continue to be held. At this point, the defendant
is apprised of the charges against him, the penalties associated with those charges, and his rights
regarding the criminal process (Rule 5-301 NMRA). If the person is detained and was arrested without a
warrant, a probable cause hearing is held (Rule 5-301 NMRA) no later than the first appearance. Next is
commencement of prosecution, which may occur via an indictment with a grand jury, an information, or
preliminary hearing (Rule 5-201 NMRA). Felony cases are then filed in district court and an arraignment
is held where the defendant is advised of his/her rights and enters a plea to the charges. Next, the
defendant is adjudicated, either through trial by jury or through a plea agreement, though the
prosecutor can choose to drop the charges at any point. Finally, the defendant is sentenced if found
guilty. The process for individuals arrested for a misdemeanor is similar (flow charts of the process are
available through the University of New Mexico’s Judicial Education Center at:
http://jec.unm.edu/manuals-resources/case-flow-charts).
Assessment of case processing and pretrial detention in New Mexico There are a total of 13 judicial districts for New Mexico’s 33 counties. Currently, all 13 judicial districts in
the state are required to report standard annual measures to the legislature (time to disposition from
case filing) as set forth in the General Appropriations Act, and provide other information (total
adjudicated, pending and convicted cases by offense type and court type) to the Administrative Office of
the Courts (AOC) for an annual report. The disposition rates reported by the AOC measure “whether a
court is keeping up with incoming cases.” As such, the measure is computed by dividing the total
number of disposed cases by the sum of new and reopened cases. Thus, pending cases are included in
the disposed numbers, but are not included in the denominator. A rate that exceeds 100% indicates
that the court is reducing backlogged cases.
The AOC also summarizes the status of pending cases. This includes how many pending cases there are,
how long they have been pending (up to six months or more than six months) separated by whether
they are inactive due to a bench warrant. In addition, they report the total number of trials held, and
disposition by trial type (convicted, acquitted, pled, dismissed, etc.).
Several studies have examined case processing and pretrial detention. However, most of these efforts
have been focused on Bernalillo County. Bernalillo County handles the largest number of cases, has had
one of the worst overcrowding situations, and has the longest time to disposition in the state. They also
have the most resources to study these problems, and therefore have been the subject of several
studies examining case flow (e.g., Steelman et al., 2009), juvenile case processing (e.g. Swisstack et al.,
n.d.), pretrial length of stay and overcrowding (e.g., Guerin, 2013; Kalmanoff, 2013), as well as studies
regarding special programs such as DWI-drug court and mental health court. While other counties do
4
not have the volume of cases that Bernalillo has, they are still impacted by pretrial length of stay and jail
crowding. However, beyond the annual data reported to the Legislature and AOC, there is little data
available to assess case processing outside of Bernalillo County. While Freeman (2007, 2013) examined
length of stay for detainees in select counties, this was based on “snapshot” data and was limited in
scope. Further, it does not include an assessment of case processing measures.
Though the current performance measures used by the state are important, they are limited. They do
not provide information about pretrial release decision making or whether there is differential case
processing based on factors such as individual characteristics or pretrial detention. Moreover, as
Steelman et al. (2009, 2013) point out, the utilization of case filing date as the beginning date to
calculate time to disposition is flawed, likely resulting in underestimates of actual time to disposition. As
noted above, studies have focused primarily on Bernalillo County, leaving out important areas of our
state despite the need and desire to understand case processing and length of stay in these areas. This
study aims to examine pretrial detention and explore case processing performance measures not
currently used in New Mexico.
Report Contents We explore case processing statistics and performance measures in Section III. We begin this section
with a description of the legal and extralegal characteristics of individuals for whom we found one or
more corresponding cases in the court. Next, we examine the time to case filing from two points in
time: offense date and booking date. Third, we explore overall rates and time to adjudication. Finally,
we describe conviction rates and sentences.
We focus on pretrial detention in Section IV. Here, we examine pretrial detention rates and the amount
of time people remain in the detention centers. Next, we describe the characteristics of detainees.
Finally, we explore the relative influence of legal and extralegal factors on pretrial detention in
multivariate models.
In Section V, we examine pretrial performance. The intent of this analysis is to determine to what
extent those released pending the disposition of their cases comply with pretrial demands. We measure
two outcomes: failure to appear for court and new arrests.
The last set of analyses focuses on the relationship between pretrial detention and three measures of
case processing: adjudication, time to adjudication, and conviction. We present these results in Section
VI. Here, we examine the association between pretrial detention and these measures both individually
and in conjunction with other variables.
We conclude with Section VII. We summarize the key findings of the study, discuss their implications,
and describe the limitations of this study.

5
Section II. Study purpose and questions The purpose of the current study is to provide information about pretrial detention and case processing
to counties outside of Bernalillo. One aspect of this study is to explore case processing and performance
measures that are more robust than those currently used. As noted above, current measures include
time to disposition (from date of filing), and the total adjudicated, pending, and convicted cases by
offense type and court type. We explore the feasibility of including other measures of case processing
and performance measures such as:
Number of arrests/bookings
Proportion of individuals whose cases are accepted for prosecution among those admitted for new charges
Time to case filing
Adjudication rate
Length of time to adjudication among detainees
Conviction rate
Sentencing rate
Second, this study seeks to further understand the extent of pretrial detention and the factors that are
associated with pretrial detention. Thus, we examine:
Rates of pretrial detention
Average time detained
Legal and extralegal factors associated with pretrial detention (whether or not detained) and
length of pretrial detention
Third, we wanted to determine whether pretrial decision-making appears to be accurate. When
deciding whether to release someone pretrial, the judge must weigh the consequences of detaining
someone who has not been convicted against ensuring attendance at court proceedings and community
safety. Thus, we calculate:
Number and proportion of individuals released pretrial who fail to appear
Number and proportion of individuals released pretrial who have a new offense
Finally, this study explores whether pretrial detention influences case processing and outcomes.
Specifically, we examine whether pretrial detention is associated with adjudication, time to
adjudication, and conviction. We seek to determine how pretrial detention is associated with case
processing times and case outcomes independently, and in conjunction with legal and extralegal factors.
The purpose of this portion of the analysis is to explore the following:
In what ways is pretrial detention associated with case processing times and case outcomes
independently and in conjunction with legal and extralegal factors?

6
Methods
Data sources and access
We used several sources of data for this project. Nine county detention facilities participated in the
study: Chaves County, Colfax County, Doña Ana County, Luna County, McKinley County, Otero County,
Sandoval County, Santa Fe County and Valencia County. The counties represented here are located
throughout the state and include both urban and rural areas. Together, these facilities are estimated to
hold nearly 28% of all individuals confined in county detention centers statewide. Doña Ana and Santa
Fe hold the third and fourth highest number of detainees in the state. The counties included here
represent 8 of the 13 judicial districts in New Mexico. A map indicating the location of the counties and
detention centers is available in Appendix A.
Each of the participating counties provided us with an automated dataset capturing all bookings in 2012
and 2013 with the exception of Doña Ana, who provided 2012 data only. We received approval for the
project from the University of New Mexico’s Institutional Review Board. All counties provided us with
the following information: personal identifiers, dates of booking and release, statute violations,
demographic information, booking or person number, arresting agency ORI number, and description.
We also requested information about bail, reason for detention, and release status. Most counties
provided us with booking category (e.g., new charge, warrant, probation/parole violation, other),
release status (e.g., pending disposition or not), detainment reason (e.g., held without bail, could not
post bail, other), and how released (e.g., bail, with release conditions, recognizance). However, the
information contained in these fields varied across detention centers. We received information about
the amount of bond ordered from seven counties.
In addition to the automated data from the detention facilities, we utilized information from two other
sources. First, we obtained arrest data from The New Mexico Department of Public Safety (DPS), which
maintains the state central repository of criminal history data. These data are maintained in DPS’
Criminal Justice Information System and are used by DPS to generate criminal history background checks
(state rap sheets). The SAC receives quarterly statewide arrest data; these are the same data used to
populate an individual’s state criminal history record. These data include all hardcopy and electronically
submitted fingerprint impressions in New Mexico; all agencies who submit fingerprint cards or
impressions are required to provide the same information. Each entry represents a custody change
(arrest or incarceration) with one line of data for each offense type associated with a given arrest or
incarceration. Besides offense information, the data include personal identifiers and demographics.
These data include arrests from 2001 to 2014.
Finally, we received automated data from the Administrative Office of the Courts (AOC). We used these
data to track court cases related to bookings through magistrate and district courts (municipal cases
were not included). These data include personal identifiers, offense type (all charges for which
prosecution against an individual is being sought), court case number, date of case filing, date of
disposition, and disposition of each charge. Court data were provided by the Administrative Office of
the Courts (AOC) and includes a number of tables. Data extracted from these tables include personal

7
identifiers, filing date, offense, court case number, charge disposition, and sentence. We supplemented
these data by looking up some records in the New Mexico Courts secure records inquiry website.
Procedures
Identified the sample
Each detention center extracted the data from their systems differently. Some detention centers
provided the data in a single dataset, while others provided multiple datasets. Our first step was to
convert the data from each county into SPSS into a standardized format (i.e., one line of data for each
booking). Next, we standardized key variables across each dataset (e.g., recoded each race variable
using the same values). We then merged the datasets from each of the counties together.
Some individuals were detained at multiple facilities. Therefore, our next step was to identify each
unique individual across all datasets. Since names and other personal identifiers vary somewhat across
datasets due to spelling errors, false information, etc., we manually identified each unique individual
across all detention centers. Once we completed the process, we created unique numbers for each
individual.
We then identified unique stays within facilities. Some counties release individuals and re-book them
when they go to court, or are released for other reasons. In some counties, the booking number was
different for each re-admission, and in other counties the booking number remained the same. We
identified these stays and created admission and release dates that reflect the first booking and final
release. This process resulted in a master list of individuals consisting of potential bookings within each
county and corrected admission and release dates. We matched this list with the DPS data using
personal identifiers (the process is described below).
Sample inclusion and exclusion criteria
Our purpose was to track pretrial detention for those individuals who were booked on a new charge in a
state district or magistrate court. Thus, inmates who were booked in order to serve a sentence for a
previous charge were excluded, as were those who were detained on federal charges, on a tribal
warrant, slated for extradition to another county or state, held for another jurisdiction, or detained for a
probation/parole violation only.
In order to limit the files in this way, we used a variety of indicators within the detention center data to
determine whether the booking was for a new offense. These indicators varied by facility. Some
detention centers clearly defined which bookings involved a new offense. However, many facilities did
not have a variable that defined the arrestee’s status. For those facilities, we used a combination of
variables to determine status. These included release reason, booking charges, booking agency, and
booking category. In addition, for those whose booking charges were vague (e.g., warrant), we used
DPS arrest data to supplement in those cases where the booking date matched the arrest date (the
procedures for matching the booking and arrest data are described below).
8
Once this was complete, we created a master list of all individuals who were detained for a new offense
using the first booking within each county. We then merged this master list with the AOC data to find
the corresponding court case using personal identifiers.3 These included last name and first name (using
Soundex matching and then checking the results for accuracy), date of birth, and last four digits of social
security number. We matched data in iterations, using various combinations of personal identifiers (ex:
all identifiers; last name, date of birth, social security numbers; etc.). We then checked all non-perfect
matches and assigned each variable a value reflecting the likelihood that it was a match. We then
determined whether the case was a likely match using the results of all four data elements. The
likelihood values ranged from a “perfect match” to “definitely not a match.” For those in between, we
considered those that were very likely (ex: names slightly misspelled, but date of birth and social
security number correct) a match. We excluded those that were unlikely matches and those that could
have been a match, but we were not confident about. Thus, we were more likely to exclude true
matches than to include false matches. We used this process to match booking data and DPS data as
well.
Among the person matches made within the court (AOC) data, we then endeavored to find the court
case(s) that corresponded with the booking. We included only those court cases processed in the same
county as potential matches. In addition, only those cases that logically matched the booking date were
considered. For example, we immediately excluded cases disposed prior to the booking date or offense
dates that occurred after the booking date. We considered the following as the best match: cases with
filing dates that were the same or within a few days of the booking date, and an offense date that was
the same or nearly the same as the booking date. For the remaining cases that had bookings that could
be matches, we compared offense type and the timing of the disposition date relative to the booking.
We also looked up several hundred cases online through the AOC’s secure court records inquiry website.
Specifically, we searched those cases that looked like they could be matches, or where the time
between booking and filing appeared erroneous even though the offense date matched the booking
date. In many of those cases, we found an earlier magistrate court case that had not been found in the
first search; in others, it was clear that there should be a magistrate court case, but it was not in the
automated files. In that case, we kept the district court case as the correct case but this may skew the
number of days between booking and filing for some cases. We also checked the online data to verify
the accuracy of matches and better understand cases with unexpected patterns (e.g., booking dates that
occurred after filing dates).
We randomly checked some of the felony-level cases for which we did not find a corresponding court
case using the secure court website. We found that most really did not have a corresponding court
case. However, some did have a corresponding court case. We could not find a matching case for a
number of reasons. These include: a match was not made using the personal identifiers; we could not
3 Although two detention centers provided court case numbers, often these were not in the same format as the court. Thus,
we did not use these to merge detention center and court data. However, when available, we did use the court case numbers to manually check that our merges using personal identifiers were accurate.

9
link the booking with the court case (most often this occurred because the recorded offense date from
the court was subsequent to the booking and we could not find definitive evidence that the booking was
related to the court case even though it may have been); and we found a corresponding court case in
another district (which violates the study bounds). Based on our exploration of the online data, we
know that in some cases, the court case exists but it was not in the dataset provided to us. It is unclear
why some cases were not included in the data we have, and it is an issue that we will pursue in the
future. We estimate that up to 5% of felony level cases not found actually have court case matches.
Sample Description The sample included individuals who were booked into a participating New Mexico county detention
center (jail) between January 1, 2012 and December 31, 2013. While our primary focus was on pretrial
detention, this study offers an opportunity to illustrate the volume of individuals who flow through our
detention centers each year. Over the two-year period, a total of 80,470 bookings occurred at these
facilities.4 The number of unique individuals, regardless of county, was 48,643. The number of bookings
per individual over the two-year period ranges from 1 to 34. Most (68.8%, N=33,487) were booked a
single time. The average number of bookings was 1.65 (std. dev. 1.385).
Some individuals were booked at multiple facilities throughout the study period. In some cases,
individuals committed crimes in multiple jurisdictions, accounting for their presence in multiple
detention centers. Others were booked in one jurisdiction but transferred to a different detention
facility until release or case resolution. The number of individuals by county facility is 50,879. Of those,
38,507 were booked for a new offense (as opposed to a probation violation, federal hold, tribal hold,
etc.).
For the purposes of this study, we limited the data to the first booking for a new offense that occurred
within each county. This resulted in a total of 32,357 first bookings per county for a new offense. While
most people were represented in the sample only once, there were up to three bookings per person, all
of which were in different counties. Just over one-quarter (25.9%) of the bookings involved one or more
felonies. Thus, most bookings involved misdemeanors.
4 Based on the number of bookings in Doña Ana County in 2012, we project that the total number of bookings for
all nine counties for both years would be over 90,000.

10
Table II.1 Bookings and Eligible Cases
All cases
Stage N % of total
Total number of bookings 80,470 100%
Total number of individuals 48,643 100%
All bookings per person per county 50,879 100%
All bookings for a new offense per person per county
38,507 75.7%
First booking for a new offense per person per county
32,357 63.6%
Data elements In order to answer the questions posed above along with case processing statistics and performance
measures, we created multiple variables. The first set of variables measures key pretrial case processing
points. The second capture compliance and performance while on pretrial status. The last set of data
includes legal and extralegal variables that may influence pretrial detention and case processing
decisions.
Case processing variables
Length of pretrial detention represents the number of days between the date of booking and date of
release from the detention center or adjudication of the last case (whichever was first) for each eligible
booking during 2012/2013 calendar years. In some cases, the detainee was not yet released and the
case was not yet resolved. In those cases, we used an end date of 6/1/16, the date of the last data
received from the court. We also created a dichotomous (binary) variable which indicates any pretrial
detention. A value of “0” was assigned to individuals booked and released the same day (in other
words, who were not detained pretrial) and “1” for those detained one or more days.
The time between booking and case filing represents the number of days from the booking date to the
date the first case was filed. In some cases the individual was booked after filing. This occurred for both
district and magistrate court cases. We sampled some of these cases and discovered that individuals
were booked as a result of a pre-adjudication warrant. We found no evidence of an arrest or booking
for the individual prior to this event, and therefore include them in the study. In other cases, the reason
for detention was that the person failed to appear for a court case. When we discovered this, we
eliminated those cases.
We also calculated the time between offense and case filing. The offense date was extracted from the
court data. Sometimes the offense date listed in the court data was wrong. We found this in some
district court cases that had been bound over from magistrate court. In these instances, the date of the
offense was related to an event in the magistrate court case (date opened/closed there) rather than the
date of the offense. We know that this is the wrong offense date because the documents in the online
court query (Odyssey) indicated the cases were related (bound over). When these were discovered, we
used the offense date from the magistrate court rather than the district court. In other cases, it was

11
clear that the offense date was recorded incorrectly based on the date of the case filing (e.g., the
offense date recorded in the court occurred after the filing date). In those cases, we omitted the
offense date from the analysis.
We created a dichotomous variable which indicates whether a case was disposed within two years
(coded as “1” if yes, and “0” if no) for multivariate analyses. We chose the two year mark for two
reasons. First, most cases should be adjudicated within two years. Second, the date of the last eligible
booking was 12/31/13. The latest date in the data we received from the court was 12/31/15. Thus, two
full years of data would end 12/31/15 for those booked on 12/31/13. We determined whether a case
was disposed based on the case status variable in the court. A related measure included in this study is
time to disposition. Currently, New Mexico (and many other jurisdictions) uses the date of filing as the
beginning point. However, this may underestimate the actual time to disposition. Therefore, for
multivariate analyses we calculated the number of days to disposition from the date of booking or the
date the case was filed, whichever is earliest, to date of disposition.
Among adjudicated cases, we determined whether the case resulted in conviction, coded as “1” if yes
and “0” if no. Further, from the court data, we determined the sentence type. This was coded as “1” if
the sentence included any incarceration time (jail or prison) and “0” if not. Note that in some cases, the
incarceration period was suspended. However, since individuals who do not perform well on probation
could ultimately be incarcerated due to that original sentence, we distinguished those who had the
charge versus those who did not.
Pretrial compliance/performance
In order to assess pretrial compliance/performance, we tracked failure to appear among individuals
who were released pretrial as well as whether they committed a new offense while released. We
constructed the dichotomous/binary failure to appear variable (“0” if they did not fail to appear and “1”
if they did fail to appear”) from subsequent bookings and/or arrests. While it would be ideal to track
this information from the court, we did not receive the entire event history for each case. Thus, we
were not able to use court data to determine failure to appear. We determined whether the individual
committed a new offense from the arrest data.
Legal and extralegal factors
We expect a number of legal and extralegal variables may be related to pretrial detention, conviction
and sentence severity including: demographics, current offense, and prior criminal history.
Demographic information included age, gender and race/ethnicity. In general, these data were
procured from the detention center datasets. In some cases, though, the data were either missing or
incomplete (e.g., we received race but not ethnicity). In those instances, we supplemented with the DPS
data that matched that booking. Age is rounded to years and is calculated from the booking date.
Gender is coded as “1” if male and “0” if female. We combined race and ethnicity into four categories
for most of the analyses: White (non-Hispanic), Native American, Hispanic (any race), and other (e.g.,
Black, Asian, multi-race). It is important to understand that in some cases, the race/ethnicity variable is
based on self-reported information; in other cases, it is based on the perceptions of others (e.g., booking

12
staff). Further, while we used DPS data to supplement when information was missing, for Sandoval and
Colfax counties, ethnicity is missing from the DPS data as well.
We received current offense data from both the detention centers and the courts (among those court
cases found). Generally, the violation data from the detention centers was less complete than the court
data. Thus, for most analyses, we used the most serious offense for which the individual was charged
by the court. The most serious offense was coded in the following order: violent, property, drug, DWI,
other, and public order. In addition, we created a variable to measure offense severity. This was coded
as a “1” if the offense involved a felony and “0” if it was a misdemeanor or was not recorded and the
case was tried in magistrate court (fewer than 1% were not recorded). We used the same coding
scheme when analyzing offense information from the booking data.
Prior criminal history was constructed from the DPS arrest data. We captured the number of prior
arrests, number of prior felony arrests, and most serious prior offense (coded the same way as most
serious current offense). This includes any arrests that occurred prior to that associated with the
current booking. We also constructed a variable which measured whether there were any prior failure
to appear charges listed in the arrest data.
Analytic approach Throughout the report we utilize univariate and bivariate descriptive statistics to examine the sample,
explore case processing statistics, and to understand the bivariate relationships between key decision
points and legal and extralegal variables.5 We completed multivariate analyses to assess which factors
are associated with pretrial detention, adjudication, and conviction while holding the other variables
constant. We calculated logistic regression models for dichotomous (binary) dependent variables (e.g.,
whether or not someone was detained pretrial). The results produce an odds-ratio coefficient for each
independent variable. The odds ratio can be interpreted as the multiplicative change in the odds of an
event occurring (e.g., detention pretrial). For example, an independent variable measuring gender could
be coded as male as the outcome of interest (1) and female as the reference category (0). If the odds
ratio were 1.3, this would indicate that an increase of one unit in this independent variable (i.e., being
male) is expected to increase the odds of detention by 30%. In other words, males would be 30% more
likely or have 1.3 times the odds of females to be detained. Similarly, an odds ratio of 0.7 would indicate
that an increase of one unit in that independent variable would decrease the odds of recidivism by 30%;
that is, males would be 30% less likely to be detained.
We analyzed each outcome variable of interest with a series of nested models or blocks. By assessing
the data in this way, we not only are able to determine whether one or more variables are statistically
significant by examining the coefficients produced, but we can also determine whether there is a
significant change from one block to another as measured by the change in the -2 Log Likelihoods. This
5 Univariate analyses examine a single variable; the intent is to describe that variable. Bivariate analyses are used
to examine the relationship between two variables. Multivariate analyses are used to examine the relationship between multiple independent variables and a dependent variable.

13
difference produces a chi-square statistic; the degrees of freedom are equal to the number of variables
added in each block. The purpose of analyzing the data in this way is to ensure that any significant
differences are detected, as the analysis of the coefficients alone is sometimes incomplete.
We calculated a series of multiple regression models to assess which legal and extralegal factors are
associated with time detained pretrial and time to adjudication. We report the standardized (beta)
coefficients. Positive values indicate that an increase in the independent variable corresponds with an
increase in the dependent variable. Negative values indicate that an increase in the independent
variables is associated with a decrease in the dependent variable. Regression diagnostics suggested
that there were some violations of assumptions in some models (e.g., heteroscedasticity). Thus, we
calculated the models using General Linear Modeling. The results yielded the same interpretation, thus,
we opted to present the results from OLS regression as it is more familiar to most people. All analyses
were completed using SPSS v. 23 software.
Importantly, there are some limitations to the data. Two counties reported only race, not ethnicity, and
not all counties provided information about bond. Thus, when applicable, we calculated models with
and without these counties. In some cases, this changed some of the results. We report those
differences.
14
Section III. Case processing statistics and performance measures One purpose of this study was to explore the feasibility and utility of measuring case processing
statistics and performance measures in addition to what is currently recorded by the Administrative
Office of the Courts. Each point in the criminal justice system can create a delay that lengthens the
overall time to adjudication, and for those detained, the length of time they spend in jail. The unit of
analysis for the case processing statistics below is a combination of person and county.
Court cases found One objective of this study was to assess prosecutorial decision-making by compiling data on the
number of cases accepted for prosecution. Although we found a court case for 75% of eligible cases, we
found a court case that definitively corresponded to the booking in just over half (55.4%) of the cases.
In other words, we were able to confirm that in 55.4% of cases, prosecutors filed charges against the
defendant in the same jurisdiction as the booking. However, this varies by offense severity. We found
72% of felony-level cases in the court data, but just 49.5% of misdemeanor cases. This is perhaps not
surprising as some offenses may have been seen in a lower court (ex: municipal court) or in another
jurisdiction, which are excluded from our study. Indeed, almost half (47.5%) of the misdemeanor cases
not found involved a public order offense. These court cases could be heard in a municipal court rather
than magistrate or district court. Thus, most cases not found were likely to involve lower level charges.
Ultimately, though, we were unable to determine with any certainty the rates of acceptance for
prosecution due to the complications with matching court cases with bookings and the study bounds.
Number of court cases and court venue
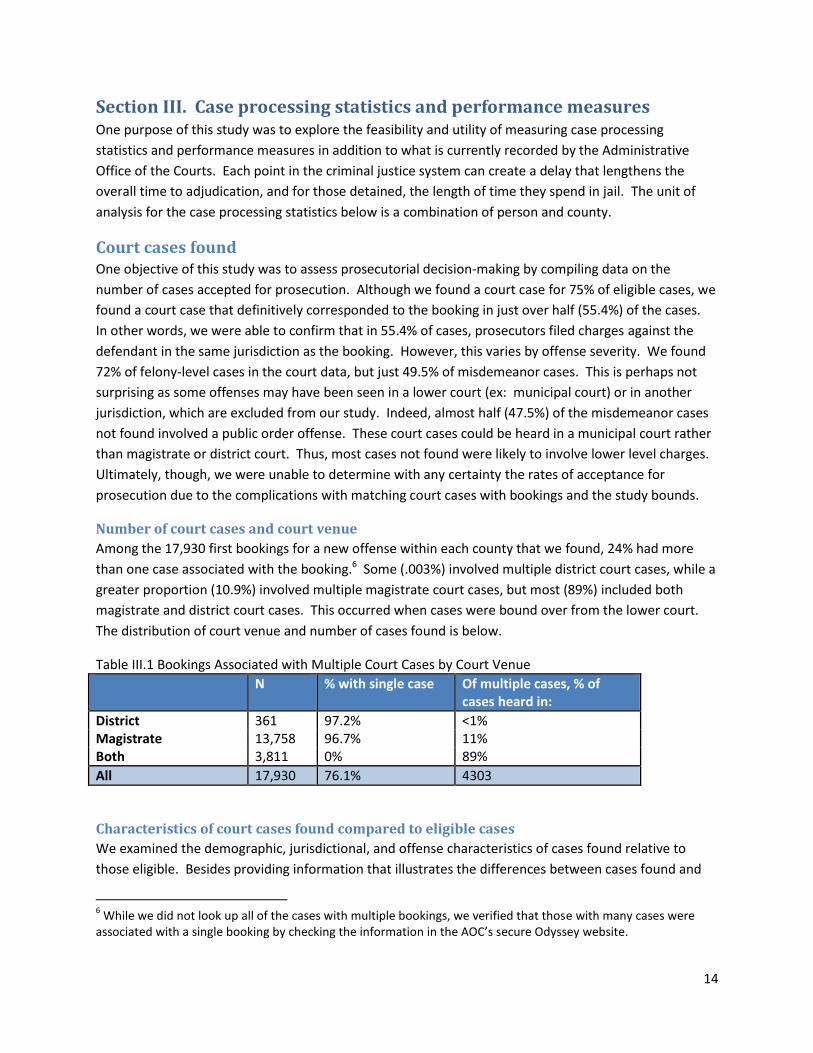
Among the 17,930 first bookings for a new offense within each county that we found, 24% had more
than one case associated with the booking.6 Some (.003%) involved multiple district court cases, while a
greater proportion (10.9%) involved multiple magistrate court cases, but most (89%) included both
magistrate and district court cases. This occurred when cases were bound over from the lower court.
The distribution of court venue and number of cases found is below.
Table III.1 Bookings Associated with Multiple Court Cases by Court Venue
N % with single case Of multiple cases, % of cases heard in:
District 361 97.2% <1% Magistrate 13,758 96.7% 11% Both 3,811 0% 89%
All 17,930 76.1% 4303
Characteristics of court cases found compared to eligible cases
We examined the demographic, jurisdictional, and offense characteristics of cases found relative to
those eligible. Besides providing information that illustrates the differences between cases found and
6 While we did not look up all of the cases with multiple bookings, we verified that those with many cases were
associated with a single booking by checking the information in the AOC’s secure Odyssey website.

15
those eligible, these analyses also provide a description of the sample of cases used for the remainder of
the report.7
Our sample final differs in some ways from the pool of eligible candidates. Those individuals for whom
we found a corresponding court case were slightly older (median age of 32 years compared to 31).
Additionally, we found some differences by race and ethnicity. The final sample included fewer Native
Americans (17% compared to 22% of eligible cases) and more White non-Hispanics (41% compared to
39%) and Hispanic detainees (38% vs. 35%). As noted previously, two counties did not record ethnicity.
Thus, we calculated race and ethnicity without those two counties as well. The proportion of Hispanics
increased to nearly 45% and White non-Hispanics decreased to 30% among all detainees with new
charges. However, the pattern is the same. That is, we found court cases for a slightly greater
proportion of White and Hispanic defendants than Native Americans or those of some other race.
Table III.2 Demographics of Eligible Cases and Those Found in Court
Detainees with new charges
Detainees found in court
Age** Mean (s.d.) Median
33.93 (11.58) 31.00
34.10 (11.71) 32.00
N 32,320 17,930
Race***
All counties Excludes Sandoval and Colfax counties
All counties
Excludes Sandoval and Colfax counties
Native American 22.1% 21.9% 17.3% 17.6% Hispanic 34.5% 44.5% 37.8% 45.0% White 39.3% 29.9% 41.2% 33.8% Other 4.1% 3.7% 3.7% 3.5% N 32,357 24,745 17,930 14,910
Gender*** Male 74.0% 75.5% Female 26.0% 24.5% N 32,357 17,930
***p≤.001, **p≤.01
The proportion of cases found with an associated court case was not the same as the proportion of
cases originating from each of the counties. A noticeably greater proportion of cases found originated in
Doña Ana County (15% compared to 10% of eligible cases). A much smaller percentage of cases
originated in Sandoval County (14% compared to 21% of eligible cases).
7 See Appendix B for a description of all detainees and those in the sample.

16
Table III.3 County of Origin by Eligible Cases and Those Found in Court
County*** Detainees with new charges (N=32,357)
Detainees found in court (N=17,930)
Chaves 10.8% 9.5% Colfax 2.5% 2.5% Doña Ana 10.3% 15.3% Luna 2.8% 3.6% McKinley 14.7% 15.7% Otero 5.6% 7.8% Sandoval 21.0% 14.4% Santa Fe 19.8% 18.1% Valencia 12.5% 13.1%
***p≤.001
The current offense differed somewhat as well. Among the cases for which we found an associated
court case, the type of offense tended to be more serious. As displayed in the table below, while 22.5%
of eligible cases involved a violent offense, 31.1% of cases found involved a violent offense. Further,
nearly 34% of cases found involved an offense that was listed as a felony in the booking data, compared
to 26% of all eligible cases.
Table III.4 Current Offense by Eligible Cases and Those Found in Court
Current offense ᵻ Detainees with new charges (N=32,357)
Detainees with corresponding court case (N=17,930)
Current offense*** Violent 22.5% 31.1% Property 14.0% 13.3% Drug 8.5% 9.6% DWI 19.4% 22.5% Other 2.1% 1.2% Public order 24.1% 16.9% Probation violation only 0.3% 0.0% Warrant-charge unknown 4.8% 2.6% Serving sentence 0% 0% Unknown 4.4% 2.7%
Offense severity*** Felony 25.9% 33.7% Misdemeanor 62.4% 59.2% Unknown or N/A 11.7% 7.1%
***p≤.001 ᵻ Current offense information reported here was gathered from the detention centers and supplemented from arrest data, when available.
Prior criminal history, though, was the same for both eligible cases and those found. Over half (58%) of
those in the sample had a history of one or more arrests. The average number of arrests was just
slightly higher among eligible cases (4.15) than cases found (4.06), but the median number of offenses

17
was the same (3.00). Nearly 40% of the sample had one or more prior arrests involving a violent crime.
The next most common, most serious prior offense was DWI (about 20%) followed closely by property
offenses. Twelve percent of the sample had one or more prior arrests for a failure to appear at a court
hearing.
Table III.5 Prior Criminal History by Eligible Cases and Those Found in Court
Prior criminal history Detainees with new charges
Detainees found in court
Prior arrests % N
58.5% 32,357
58.3% 17,930
Number prior arrests Mean (std. dev) Median N
4.15 (4.10) 3.00 18,936
4.06 (4.02) 3.00 10,448
MSO priors Violent Property Drug DWI Other Public order N
39.5% 18.9% 9.2% 19.8% 3.9% 8.6% 18,936
38.8% 18.1% 9.9% 20.2% 4.0% 8.9% 10,448
Any prior FTA N
12.3% 32,357
12.3% 17,930
Time to case filing One factor that can influence the length of pretrial detention is the number of days before a case is filed.
Thus, the second case processing measure we examined was time to case filing. Recall that we have
included both magistrate and district court cases. Some cases were heard only in magistrate court,
some only in district, and some in both. Cases heard in both venues were typically bound over from
magistrate court to district court; this occurred in 93% of bookings where there were multiple court
cases involving different court venues.
When determining time to case filing, the question arises, what is the appropriate beginning date? One
way to measure time to case filing is from the date of the offense. This is a reasonable starting point
and reflects rules within New Mexico that define the statute of limitations for filing both misdemeanor
and felony level cases. Petty misdemeanors must be filed within one year of the offense, misdemeanors
within two years, and up to three years for felonies. There are, however, exceptions to this rule. The
clock stops if: the defendant leaves or hides; the complaint is lost, mislaid, or destroyed; the complaint
is quashed; or if there is not currently enough evidence to proceed but a new complaint is filed later
(New Mexico Administrative Office of the Courts & UNM School of Law Judicial Education Center, 2014).

18
Time between offense to case filing
The average time between the offense and the case filing date was just over fourteen days; the median
number of days was two (see Table III.6 below).8 We also examined the time between offense date and
filing date by the court venue: district only, magistrate only, and those for whom we found cases in
both courts. Cases involving the magistrate court, regardless of whether or not they were later bound
over to district court, were filed more quickly. The median number of days between the offense and the
filing was two days; the mean number of days for magistrate only cases was 7.49 days, and was 23.65
days for those involving both magistrate and district court. Note that the maximum number of days
between the offense date and court case filing date varies; this influences the calculated mean number
of days. Thus, the median may be more representative of the actual number of days between offense
and filing date for most cases.
Since the filing date represents the first case associated with the booking, we also examined the number
of days between the offense and filing dates for magistrate court and district court separately for those
cases that were bound over to district court. We found the median number of days to the filing in the
magistrate court was 2 days, and was 57 days for district court.
The time between the offense and filing dates was longest for those cases involving only a district-level
court case. The mean number of days between the most proximate offense date and the earliest filing
date was 194.09, with a median of 93 days. It is possible that some of the cases we classified as
involving the district court only, did in fact, have an associated magistrate court case we did not find. If
this were the case, the time between the offense and initial filing would be shorter. However, the time
between the offense and filing dates was shorter for district court cases that were first heard in
magistrate court compared to those heard only in district court.
We also examined the data by felony versus misdemeanor cases. The number of days between offense
and filing was significantly (p≤.001) longer for felony cases than for misdemeanors: an average of nearly
33 days compared to just four days for misdemeanors. The median number of days, however, was the
same for both. This indicates that most cases are filed relatively quickly, but some felony level cases
experience long delays that have skewed the average.
8 We used the offense date recorded by the court. In many bookings involving cases bound over from the
magistrate court, the date of the offense listed in the district court was the date that it was bound over rather than the date of the criminal incident. The filing date is the date of the first case if multiple cases were associated with the booking.

19
Table III.6 Days between Offense Date and First Court Case Filing Date
Mean (s.d.) Median Minimum to maximum
N
Overall All cases 14.68 (97.34) 2.00 0 to 4654 17,921
Court venue
Magistrate only 7.49 (60.79) 2.00 0 to 2608 13,752
Both district and magistrate cases 23.65 (135.58) 2.00 0 to 4654 3,808 Magistrate 21.19 (143.28) 2.00 0 to 4654
District 107.44 (197.03) 57.0 0 to 4707 District only 194.09 (317.79) 93.00 0 to 3371 361
Degree of offense
Felony 32.68 (157.49) 2.00 0 to 4654 6,543 Misdemeanor 4.25 (17.41) 2.00 0 to 589 11,286
Timing of booking relative to case filing
Another method to assess whether cases are being filed in a timely manner is to use the date of booking
as the beginning point. While bookings most often precede or are on the same date as the case filing
date, in 13% of the cases, the case was filed before the individual was booked. As can be seen in Table
III.7, nearly 50% of district court only cases were booked after case filing. It is likely that many of those
were initiated as a result of a grand jury indictment rather than an initial arrest. Note, though, that this
comprises a very small number of the overall sample- just 180 cases. The remaining 2061 cases in which
charges were filed before booking occurred were initiated in magistrate court. This occurs when the
court issues a pre-adjudication warrant or a warrant for failure to appear when summoned as described
in a citation. Among those cases that were heard in magistrate court only, 10% of cases involved
individuals booked after the filing date. Among cases that began in magistrate court but were ultimately
resolved in district court, 18% of the individuals were booked after the initial filing date.
We also examined timing of the booking by degree of the offense listed in the court. Reiterating the
findings above, misdemeanants were more likely to be booked prior to filing than felons. However, both
were more likely to be booked prior to or the same day as the case filing date.
Table III.7 Timing of Filing from Booking by Court Venue and Degree of Offense
Booked prior to filing date
Booked the same day as filing date
Booked after filing date
N
All cases 71.6% 15.9% 12.5% 17,930
Court venue*** District court only 44.3% 5.8% 49.9% 361 Magistrate court only 73.9% 16.2% 9.9% 13,758 Both 65.7% 15.9% 18.3% 3,811 Offense degree*** Felony 64.5% 17.1% 18.3% 6,577 Misdemeanor 75.6% 15.3% 9.1% 11,353
***p≤.001

20
Time between booking and filing by detention status
Besides the rules that the time between the offense date and case filing in general, additional rules
indicate that cases should be filed more quickly if the defendant is in custody. Thus, we would expect
that the number of days between booking and filing would be shorter for those in custody at the time of
case filing. The data confirms this expectation. In the table below, we examine the time to filing for
those who were booked before the case was filed. The average time between booking and filing for
those in custody was 1.87 days, with a median of one day. Among those who were not in custody at the
time the case was filed, the average number of days was 6.01, with a median of two days.
Table III.8 Average Number of Days from Booking to Filing by Custody Status
Custody status % (N) Average days from booking to filing
Median days from booking to filing
All cases In custody 57.0% (7,315) 1.87 (3.36) 1.00
Not in custody 43.0% (5,515) 6.01 (20.34) 2.00
District court only In custody 43.1% (69) 8.26 (9.97) 6.00
Not in custody 56.9% (91) 76.49 (86.90) 50.00
Magistrate court only
In custody 52.9% (5,378) 1.74 (2.74) 1.00
Not in custody 47.1% (4,787) 4.27 (7.17) 2.00
Both In custody 74.6% (1,868) 3.77 (18.07) 1.00
Not in custody 25.4% (637) 16.86 (56.28) 3.00 Significant differences found at p≤.001 for cases overall and by court venue
The time between booking and filing among those detained varied somewhat by whether the case was
heard in district court only. Among cases heard only in district court, the median number of days
between booking and filing for those in custody was 6 days, and just 1 day for those involving the
magistrate court (whether resolved there or bound over).
Among those not in custody at the time of the case filing, the median number of days increases
dramatically: 50 days, with an average of 76.49 days. The median number of days for those whose cases
were only in magistrate court was two, and three for those who had both magistrate and district court
cases.
Measures of time to adjudication The AOC measures time to adjudication from the case filing date for magistrate and district court cases
separately. Thus, for defendants who have multiple cases (such as when a case is bound over), the
actual time to case resolution is underestimated. In addition, for those detained prior to case filing, the
use of the filing date underestimates the length of time to resolution. However, we do not know the
extent to which using these criteria underestimates time to resolution.
Thus, we began by measuring time to adjudication from three different points: the date of booking, the
date of case filing, and the earliest of these dates. Since some individuals were involved with multiple
cases, we began by examining the time to adjudication by each court case. The table below shows the
time to disposition from the booking date, the filing date, and the earliest date. For cases involving the
magistrate court, the median time to disposition is shorter when we begin with the booking date rather

21
than filing date. This occurs both for cases that are heard only in magistrate court (96 days versus 105
days) and those bound over to district court (31 days versus 34 days). The same is true when the case is
tried only in district court; the median time to disposition from the booking date is 227.5 days compared
to 307 days from the filing date. However, for cases that begin in magistrate court and are then bound
over to district court, the time from case filing is shorter (270 days) than from booking (348 days). Thus,
the true time in the system may be under-reported when using the filing date for district court cases
that begin in magistrate court, but not for cases heard only in magistrate court. Due to these mixed
findings, the best measure of time to disposition is the earliest date available. While expected, it is
notable that the time to resolution for magistrate cases that were bound over to the district court are
significantly shorter than those whose ultimate resolution occurred in magistrate court.
Table III.9 Average Time to Disposition by Court Venue by Case
District court only
Magistrate court only
Both
Magistrate District
From booking date Mean (std. dev.) 334.64 (303.79)
152.87 (176.04)
52.59 (104.89)
421.71 (276.10)
Median 227.50 96.00 31.00 348.00
From filing date Mean (std. dev.) 406.48 (322.64)
164.39 (184.89)
65.62 (105.79)
355.43 (264.33)
Median 307.00 105.00 34.00 270.00
From earliest date Mean (std. dev.) 426.29 (323.58)
166.95 (185.11)
69.26 (109.32)
427.43 (275.19)
Median 331.50 108.00 35.00 352.00
Note: The unit of analysis for this table is each court case
We explored the proportion of cases that were resolved by time categories. This analysis allows us to
better understand how many cases are resolved within various periods of time, rather than the average
time to adjudication. Here we compared the time to adjudication from the filing date compared to the
earliest date.
As would be expected, the majority of magistrate cases were disposed within six months. Confirming
the analyses above, a greater proportion of magistrate court cases that were bound over to the district
court were adjudicated within six months compared to those heard only in magistrate court. District
court cases were more likely to take between one and two years to adjudicate. Using the earliest date
rather than the filing date made relatively little difference for district only cases and magistrate cases in
terms of the proportion of cases disposed within each period (e.g., 6 months, 1 year, 2 years). However,
the differences were substantial for district court cases bound over from magistrate court, especially for
those cases disposed within six months, two years, or two years or more.

22
Table III.10 Time to Disposition by Court Venue by Case
District only Magistrate only Both
Magistrate District
From earliest date
From filing date
From
earliest
date
From
filing
date
From
earliest
date
From
filing
date
From
earliest
date
From
filing
date
Disposed within 6 months
23.4% 25.3% 69% 69.6% 92.3% 93.0% 15.9% 28.6%
Disposed within 1 year
26.4% 27.5% 17.4% 16.9% 4.9% 4.5% 33.1% 30.1%
Disposed within 2 years
28.3% 26.7% 9.4% 9.4% 1.9% 1.8% 30.7% 25.8%
Disposed 2 years or more
16.1% 14.7% 2.1% 2.0% 0.6% 0.5% 14.8% 10.0%
Ongoing 5.7% 5.7% 2.2% 2.2% 0.6% 0.2% 5.4% 5.4%
N 367 367 14,126 14,126 3,859 3,859 3,871 3,871
Note: The unit of analysis for this table is each court case
Clearance rate by booking Next, we assessed the proportion of cases associated with each booking that were disposed. For this
analysis and those remaining, we include all cases associated with the booking of interest; thus, the unit
of analysis is the booking, not the case. Further, we use the earliest date as the starting point to
calculate time to disposition. By the end of the study period, nearly all (97%) cases were disposed (had a
final disposition on all cases associated with the booking), and 98.3% had at least one case that was
disposed. However, since cases entered the study at different times, the exposure time differed. Thus,
we standardized the time to adjudication to two years. Just under 92% of cases associated with the
booking of interest were adjudicated within two years. Over half (56%) of the cases were adjudicated
within six months, another 15% took one year to be resolved, and 5% took two years.
Table III.11 Months to Disposition for All Cases Associated with Booking
N % Cumulative %
Disposed within 6 months 10,048 56.0 % 56.0%
Disposed within 1 year 3,754 20.9% 77.0%
Disposed within 2 years 2,638 14.7% 91.7%
Disposed 2 years or more 952 5.3% 97.0%
Ongoing 538 3.0% 100%

23
Clearance rate by court venue
Time to adjudication varied by court venue. As illustrated in Figure III.1, cases heard in magistrate court
were significantly more likely to be resolved within six months than cases that included district court.
Further, 4% of cases heard only in magistrate court were either not yet resolved or took more than two
years to resolve, compared to 22% of cases heard in district court (either solely in district court or bound
over from magistrate court). Among cases heard only in district court, 24% were resolved within six
months compared to 14% of those which included both magistrate and district court. However, nearly
50% of bookings associated with any district court case (whether solely or bound over from magistrate
court) were disposed of within one year.
Figure III.1 Percent of Cases Disposed by Court Venue and Time to Disposition
Average time to adjudication among cases disposed within two years
The average time to adjudication for all cases associated with each booking is displayed in Table III.12
below. Overall, among cases disposed within two years, the average time to disposition was 189.40
days; the median was 138 days.9 As may be expected, the median time to adjudication was longest for
cases involving both magistrate and district court (315 days) and shortest for cases heard in magistrate
court only (107 days).
9 We limited the analysis to cases disposed within two years so the follow up period would be the same for all bookings in the
sample.
24
%
69
%
14
% 2
6%
18
%
33
%
29
%
10
%
32
%
16
%
2%
16
%
6%
2%
6%
0%
10%
20%
30%
40%
50%
60%
70%
80%
District only Magistrate only Both
Percent of cases disposed by court venue and time to disposition
6 months
1 year
2 years
More than 2 years
No disposition

24
Table III.12 Average Time to Adjudication
Average time to
adjudication
Median N
All Cases 189.40 (169.51) 138 16,440 District court cases 308.23 (184.43) 272 281
Magistrate court cases 151.73 (145.83) 107 13,166
Both 343.93 (172.21) 315 2,993
Conviction and sentencing Over half (58.7%) of the cases prosecuted resulted in a conviction. However, convictions were more
common among cases involving the district court than those heard in magistrate court only. Just over
half (54%) of bookings associated with only magistrate court cases resulted in a conviction, while 80% of
those involving the district court resulted in conviction.
Table III.13 Case Outcomes
N %
Conviction all cases 16,288 58.7%
District only 234 80.3%
Magistrate only 13,136 53.5%
Both 2,918 80.5%
Sentencing information was available in the automated court records for most cases. However, we did
not have sentencing information for 17% of cases. Among those for whom we did have sentencing
information, most cases resulted in either some period of confinement (42.4%), whether ultimately
suspended or not, or probation only (41%). However, this varied by court venue. Cases involving district
court were more likely to include a period of confinement, whereas magistrate cases were more likely to
include probation only.
Table III.14 Sentence Type by Court Venue
All cases District court only Magistrate court only
Both district and magistrate court
Sentence type N % N % N % N %
Some confinement 4,046 42.0% 108 50.2% 2,620 37.3% 1,318 54.9%
Probation only 3,825 40.1% 67 31.2% 3,023 43.0% 774 32.3%
Time served only 56 0.6% 3 1.4% 34 0.5% 19 0.8%
Unknown 1,677 17.4% 37 17.2% 1,352 19.2% 288 12.0%

25
Section IV. Pretrial detention The primary purpose of this research is to examine pretrial detention. In this section, we explore the
length of pretrial detention and examine factors associated with pretrial detention. Note that we use
the terms “days detained,” “time detained,” and “length of stay” interchangeably. All refer to the
number of days individuals were detained pretrial.
Pretrial detention rates and time Over half (67%) of those in the sample were detained for at least 24 hours, while just over one-third of
the sample was detained for three or more days. The maximum number of days that anyone was
detained pretrial was 1327.
Figure IV.1 Length of Pretrial Detention
Overall, defendants were detained an average of 13 days, with a median of one day. We also examined
the length of detention among those who were detained one or more days. Among those detained for
some period of time, but less than the entire pretrial period, the average number of days detained
increased slightly to just under 14 days, with a median of two days. Less than 10% of the sample was
detained for the duration of the pretrial period. Among those that were detained the entire pretrial
period, the average number of days detained increased to 59 days, with a median of 17 days.
Table IV.1 Average Time Detained
Mean (std dev) Median N
Average time detained entire sample 13.46 (55.21) 1.00 17,930
Average time detained if in for at least one day but not entire time
13.91 (52.01) 2.00 10,375
Average time detained if detained from booking until disposition
58.83 (115.911) 17.00 1,648
The number of days detained increased rapidly between those detained for at least one day and those
detained for the entire pretrial period. This is especially notable for those whose cases are heard in
32.90%
23.00%
8.90%
35.20%
0.00%
5.00%
10.00%
15.00%
20.00%
25.00%
30.00%
35.00%
40.00%
Booked andreleased
Detained 1 day Detained 2 days Detained 3 ormore days
Length of pretrial detention

26
district court. Among district court cases overall, the median number of days detained was four. The
median number of days detained for those detained one or more days increased to 7 days. The median
number of days detained was much higher for those detained the entire pretrial period: 126 days.
Among defendants whose cases were heard in magistrate court only, the median number of days
detained was 14 for those who spent the entire pretrial period in jail, compared to just 2 days for those
who spent some part of the pretrial period in detention.
Table IV.2 Average Time Detained by Pretrial Detention Period
District Court
Magistrate Court
Mean Median N Mean Median N
Average time detained entire sample
39.86 (105.32)
4.00 4,172 5.45 (18.27)
1.00 13,758
Average time detained if in for at least one day
32.36 (89.33)
7.00 3,006 6.39 (18.92)
2.00 7,369
Average time detained if detained from booking until disposition
175.67 (186.54)
126.00 393 22.24 (33.92)
14.00 1,255
Length of pretrial detention by county
As can be seen in the Table IV.3 below, the length of detention varies significantly by county. Arrestees
booked into Chaves, Doña Ana, Luna, and Otero County detention centers were more likely to be
booked and released than to be detained. Notably, over half of those individuals booked into Doña Ana
county (51.4%) were released the same day they were booked, and the median number of days
detained was 0. Individuals booked into the Colfax County Detention Center remained there an average
of nearly 18 days, with a median of 5 days. Further, 77.6% of those booked into the Colfax County
Detention Center were detained one or more days. However, the proportion of individuals who were
detained at least one day was highest at the McKinley County Detention Center, where nearly 80% were
detained at least one day. However, the average number of days detained there was relatively low
(9.95 days), with a median of two days.

27
Table IV.3 Length of Pretrial Detention
Detainees found in court
% of sample Booked and released
% of sample Detained one or more days
Average time detained
Median time detained
% within county detained at least one day
Chaves (n=1703) 9.5% 12.6% 8.0% 19.51 (69.58) 1.00 55.2% Colfax (n=442) 2.5% 1.6% 2.9% 17.76 (38.40) 5.00 77.6% Doña Ana (n=2745) 15.3% 24.3% 10.9% 11.55 (52.95) 0.00 48.6% Luna (n=641) 3.6% 4.1% 3.3% 24.98 (78.31) 1.00 69.1% McKinley (n=2815) 15.7% 9.1% 18.9% 9.95 (31.29) 2.00 79.6% Otero (n=1405) 7.8% 8.2% 7.6% 17.11 (65.01) 1.00 64.7%
Sandoval (n=2578) 14.4% 11.1% 16.0% 9.79 (44.23) 2.00 69.5% Santa Fe (n=3246) 18.1% 18.8% 17.8% 8.35 (41.02) 1.00 71.5%
Valencia (n=2355) 13.1% 10.3% 14.5% 20.42 (78.48) 2.00 73.4%
N 17,930 5,907 12,023*** 17,930*** 17,930 12,023
***p≤.001, **p≤.01, *p<.05
In Table IV.4 below, we illustrate the median number of days detained overall, among those detained
for some period of time, and for those detained the entire pretrial period. Although individuals in Doña
Ana County and Chaves County were among the least likely to be detained at all, they have the longest
median detention times when detained for the entire pretrial period. For all counties except Colfax, the
median time detained was significantly longer for those detained the entire pretrial period than for
those detained for only some period of time before trial.
Table IV.4 Median Time Detained by Period Detained and County
Median time detained overall
Median time detained if detained for some period of time
Median time detained if detained for entire pretrial period
Chaves (n=1703) 1.00 3.00 28.50 Colfax (n=442) 5.00 8.00 7.00
Doña Ana (n=2745) 0.00 1.00 37.50 Luna (n=641) 1.00 3.00 28.00
McKinley (n=2815) 2.00 3.00 16.00 Otero (n=1405) 1.00 2.00 18.50
Sandoval (n=2578) 2.00 2.00 14.00 Santa Fe (n=3246) 1.00 1.00 15.00
Valencia (n=2355) 2.00 3.00 20.00
Overall 1.00 2.00 17.00 N 17,930 10,375 1,648

28
Readers who are familiar with the New Mexico Sentencing Commission’s (NMSC) study (Freeman, 2012)
on length of stay may notice the times reported here are much shorter in comparison. The difference is
due to the methodology used. Since we include everyone who was booked over a two-year period for a
new offense, the time detained is heavily influenced by the volume of individuals who are booked and
released or those who spend a very short time in each facility. Conversely, the NMSC examined a
sample of individuals who were detained on one particular day. Studies that use this method are more
influenced by those who spend a long time in the facility. Taking these differences in methodology into
consideration, we can infer that most people spend a relatively short time detained; however, those
who do remain in the detention centers tend to spend a relatively long time detained.
This point is illustrated with the following graph, which shows the proportion of people released by the
number of days detained. For example, 32.9% of the detainees were booked and released (the point
directly above the 0). This percentage drops to nearly 2.8% when the number of days detained is four.
There is a slight increase at 13 days, when 1.3% of detainees were released. After this point, the
proportion of releases is less than 1% and remains steady. Most of those are detained for a relatively
long time. Please see Appendix E for additional information.
Figure IV.2 Percent of Detainees Released by Number of Days Detained
Characteristics of detainees In this section, we compare the characteristics of those detained pretrial to those who were booked and
released. When the data allow, we also compare length of time detained by detainee characteristics.
We begin with demographic characteristics. We then explore the relationship between pretrial
detention and current offenses, prior offenses, and bond.
0
5
10
15
20
25
30
35
0
16
32
48
64
81
98
11
4
13
0
14
7
16
4
18
2
20
5
22
4
25
0
27
2
30
1
34
2
37
6
45
1
53
0
61
1
78
0
% r
ele
ase
d
Number of days
% of detainees released by number of days detained

29
Demographic characteristics of those detained pretrial
The average age of individuals in the sample was 34.10. Those who were booked and released were
slightly younger (33.93 years old) than those detained one or more days (34.18 years old); the difference
was not statistically significant.
As can be seen in the table below, when comparing percentages of those booked and released to those
detained one or more days, Native Americans were more likely to be detained than Hispanic and White
arrestees.10 These differences were statistically significant. The average time detained, however, was
shortest for Native Americans and longest for arrestees from “other” racial/ethnic groups (i.e., Asian,
African American, unknown) followed by White arrestees. These differences were also statistically
significant. Conversely, the median length of time detained for Native Americans was 2 days, but 1 day
for all other racial/ethnic groups. Overall, these results suggest that while Native Americans are more
likely to be detained, those who are detained for long periods of time are more likely to be from other
racial or ethnic groups.
Almost 76% of the sample was male, which means that only a quarter of our sample were female.
Males were significantly more likely to be detained than females. While the median length of stay was
the same for both males and females, the average length of detention was significantly longer for males
(15.32 days compared to 7.74 for females) indicating that on average, males are detained for longer
periods of time than females.
Table IV.5 Demographic Characteristics by Detention Status Detainees
found in court Booked and released
Detained one or more days
Average time detained
Median time detained
Age
Mean (s.d.) Median
34.10 (11.71) 32.00
33.93 (11.88) 31.00
34.18 (11.63) 32.00
--- ---
N 17,925 5,904 12,021 --- ---
Race
Native American 17.3% 9.7% 21.1%*** 10.35 (38.02)*** 2.00
Hispanic 37.8% 42.2% 35.7% 13.40 (56.97) 1.00
White 41.2% 44.6% 39.5% 14.32 (57.36) 1.00
Other 3.7% 3.6% 3.8% 18.89 (76.11) 1.00
N 17,930 5,907 12,023 17,930 17,930
Gender
Male 75.5% 73.5% 76.4%*** 15.32 (60.26)** 1.00
Female 24.5% 26.5% 23.6% 7.74 (34.81) 1.00
N 17,930 5,907 12,023 17,930 17,930
***p≤.001, **p≤.01, *p<.05
10
We also examined these data without Sandoval and Colfax Counties since these counties did not record Hispanic ethnicity.
While there were some differences in the proportion of Hispanics (more) and Whites (fewer) when we exclude these counties, the general results are the same: Native Americans were more likely to be detained than either Whites or Hispanics, and the average time detained was about the same for each racial/ethnic group. However, a greater proportion of Hispanics were detained than Whites. This is summarized in Appendix F.

30
Current offense and pretrial detention
In Table IV.6 below, we display pretrial detention by current offense information as recorded in the
court. Individuals whose most serious offense involved a violent crime, property crime, or drug crime
were more likely to be detained for at least one day than those with other offenses. The average
number of days detained was greatest for those accused of the aforementioned crimes as well.
Although those with a violent offense were detained for the longest average number of days, the
median number of days was highest for property offenders, indicating that most property offenders
spend slightly more time in detention than violent offenders and that some violent offenders spend an
especially long time detained, skewing the average.
As might be expected, those whose current offense included a felony charge were both more likely to be
detained and to spend a longer time in pretrial detention. Likewise, individuals whose cases were heard
in magistrate court only were less likely to be detained; they were also detained for a significantly
shorter amount of time than those whose cases involved district court.
Table IV.6 Pretrial Detention by Current Offense
Detainees found in court
Booked and released
Detained one or more days
Average time detained
Median time detained
Current offense
Violent 31.8% 22.6% 36.4%*** 22.75 (84.19) *** 2.00
Property 13.6% 7.6% 16.6% 20.22 (54.28) 3.00
Drug 10.1% 9.0% 10.6% 12.91 (38.90) 1.00
DWI 22.7% 31.6% 18.3% 4.59 (14.11) 1.00
Other 3.4% 4.2% 3.0% 4.38 (13.61) 1.00
Public order 16.4% 23.4% 13.0% 4.45 (19.27) 1.00
Unknown 1.9% 1.6% 2.1% 12.11 (55.00) 1.00
N 17,930 5,907 12,023 17,930 17,930
Offense degree severity
Felony 36.7% 18.8% 45.5%*** 29.02 (86.56)*** 4.00
Misdemeanor 62.7% 80.5% 54.0% 4.44 (15.93) 1.00
Unknown 0.6% 0.7% 0.6% 3.62 (6.49) 1.00
N 17,930 5,907 12,023 17,930 17,930
Type of court
District 2.0% 1.3% 2.4%*** 42.92 (123.79)*** 6.00
Magistrate court only 76.7% 86.9% 71.7% 5.45 (18.27) 1.00
Both 21.3% 11.8% 25.9% 39.57 (103.41) 4.00
N 17,930 5,907 12,023 17,930 17,930
***p≤.001, **p≤.01, *p<.05
Prior offenses and pretrial detention
More than half (58%) of those in our sample had at least one prior offense. The proportion was greater
for those who were detained at least one day: 62%. Further, the average time detained was significantly
longer for those with one or more prior arrests (16.21 days) compared to those who did not have any
prior arrests (9.61 days). Those who were detained also had a greater average number of prior arrests
(4.34) than those who were booked and released (3.32). In addition, those with a prior felony arrest

31
were more likely to be detained, and for a longer time than those without a prior felony arrest (22.55
days vs. 10.05 days, respectively).
Based on prior arrest information, 12% of the sample was arrested for a previous failure to appear (FTA)
at a court hearing. Note that this measure likely underestimates actual prior FTA in court, as explained
previously. Those with a documented FTA were significantly more likely to be detained than those
without a prior FTA. While those with a prior FTA were detained for a longer period of time than those
without an FTA (15 days compared to 13 days on average), the difference was not statistically
significant.
Table IV.7 Pretrial Detention by Criminal History Prior criminal
history Detainees found in court
Booked and released
Detained one or more days
Average time detained
Median time detained
Prior arrests Prior arrests 58.3% 50.7% 62.0%*** 16.21 (57.85) *** 1.00
No prior arrests 41.7% 49.3% 38.0% 9.61 (51.06) 1.00
N 17,930 5,907 12,023
Number of prior arrests
Mean (std. dev) Median N
4.06 (4.02) 3.00 N=10,448
3.32 (3.42) 2.00 N=2,993
4.34 (4.21) *** 3.00 N=7,455
Prior arrest for a felony offense
Prior felony 27.2% 19.3% 31.1% *** 22.55 (66.56) 3.00
No prior felony N
72.8% 4,885
80.7% 1,141
68.9% 3,744
10.05 (49.88)
1.00
Number of prior felony arrests
Mean (std. dev) Median N
2.184 (1.83) 1.00 4,885
1.911 (1.71) 1.00 1,141
2.27 (1.86)*** 2.00 3,744
Most serious prior offense
Violent Property Drug DWI Other Public order N
38.8% 18.1% 9.9% 20.2% 4.0% 8.9% 10,448
32.0% 13.2% 11.0% 28.8% 4.5% 10.5% 2,993
41.5%*** 20.1% 9.5% 16.8% 3.8% 8.3% 7,455
22.26(72.95) 19.00(53.24) 13.34(56.05) 7.16(34.72) 12.13 (38.26) 9.28(33.98) 10,448
2.00 2.50 1.00 1.00 1.00 1.00
Prior failure to appear
Any prior FTA 12.3% 8.8% 14.0% *** 15.05 (44.36) 2.00
No prior FTA N
77.7% 17,930
91.2% 5,907
86.0% 12,023
13.23 (56.56) 1.00
***p≤.001, **p≤.01, *p<.05
Pretrial detention and bond We examined the relationship between pretrial detention and bond. Among counties who provided
bond information, some amount of bond was noted for most individuals; nearly 80% had some amount
listed.11 Those who had a bond amount listed were more likely to be booked and released than those
11
Information about bond was not provided by two counties, and therefore are excluded here. Further, the bond amounts did not always appear to be accurate. For example, we noted some very, very high bonds set for very minor offenses. After looking up some of these cases, we discovered that bond information from another incident was included for that individual. Thus, we opted to examine the smallest bond amount listed.

32
who did not have a bond amount. The data from some counties was adequately populated to
determine whether someone was eligible for bail versus released on their own recognizance; however,
these data were not sufficient to make that determination in other counties. Thus, we could not
determine whether the omission of a bond amount was because the individual was not eligible for bond
or if it was because it was not required (i.e., the person was released on their own recognizance).
Among those who did have a bond amount listed, the average minimum amount was significantly higher
among those detained for at least one day, though the median was lower suggesting that the large
values are skewing the averages. The bivariate correlation between pretrial detention days and amount
of bond among those with bond was weak (.070) though statistically significant (p=.01).12
Table IV.8 Pretrial Detention and Bond Detainees
found in court
Booked and released
Detained one or more days
Average time detained
Median time detained
Bond Listed Has bond listed 80.1% 88.7% 75.3% 8.29 (38.80) 1.00 No bond listed 19.9% 11.3% 24.7% 30.32 (82.77) 5.00
N 12,913 4,642 8,271 8,271 8,271
Bond amount Average amount of bond $3,088.20 (46,754.69)
$1,879.41 (5,069.68)
$5,158.15 (67,115.16)
Median amount of bond $1,000.00 $1,000.00 $1,000.00
N 12,913 4,642 8,271
Relative influence of legal and extralegal variables on pretrial detention The bivariate analyses above suggest a number of legal and extralegal factors are associated with
whether or not someone is detained. However, it is important to understand the relative influence of
each of those variables once other factors are taken into consideration. Thus, we calculated binary
logistic regression models to determine which legal and extra-legal factors play a role in whether
someone is detained rather than booked and released. We calculated three different models. The
baseline model includes only demographic variables; the second adds current offense information, and
the last adds prior offense information.
These results are displayed in the table below. The coefficients are log-odds, as described in the
methods section. Values over one indicate that for every one-unit increase, the odds of detention
increase by that amount. Values less than one indicate that the odds of detention decrease for every
one-unit increase in the predictor variables. The addition of each set of variables (current and prior
offense history) to the baseline model with demographics significantly improved the fit of the model.
While logistic regression does not produce a statistic that summarizes the variance explained in the
dependent variable, a pseudo-R2 can be examined. These values also indicate that the model improves
with each set of additional variables.
12
Correlations range in value from -1 to +1, with 0 indicating no relationship and 1 indicating a perfect relationship.

33
Several demographic variables were significantly related to pretrial detention. Older individuals, males,
and those who are Native American were significantly more likely to be detained one or more days.
Notably, the odds of being detained one or more days is more than 3 times greater for Native Americans
than for Whites, even after controlling for prior and current offenses as seen in Model 3. When we
included all counties, Hispanics were no more likely than Whites to be detained pretrial. Recall,
however, that we did not have ethnicity for two counties. When we ran the models without those two
counties, we found that Hispanics were significantly more likely than Whites to be detained for at least
one day. These results are available in Appendix F.
Offense type also matters. Relative to those whose most serious offense is a violent crime, those with a
drug offense, DWI, other offense or public order offense are significantly less likely to be detained one
or more days. Those with a property offense, however, are equally likely to be detained as those with a
violent offense. Those whose current offense includes one or more felonies are 2.9 times more likely to
be detained than those who only have misdemeanors.
Prior offense information was also significantly related to pretrial detention. Those whose prior arrests
include a felony or a violent offense, or who had previously failed to appear for a court date were much
more likely to be detained one or more days than those who did not.

34
Table IV.9 Logistic Regression Results: Detained or Not Model 1 Model 2 Model 3
Demographics only
Age 1.002 1.009*** 1.009***
Race (white omitted)
Hispanic 0.942† 0.987† 0.943†
Native American 2.463*** 3.508*** 3.404***
Other 1.182 1.105 1.102
Gender (female omitted)
Male 1.195*** 1.228*** 1.156***
Current offense Current offense (Violent omitted)
Property 1.136* 1.088
Drug 0.655*** 0.650***
DWI 0.432*** 0.463***
Public order 0.456*** 0.474***
Other 0.456*** 0.448***
Degree (Misdemeanor omitted)
Felony 2.961*** 2.896***
Prior offense Number prior felony arrests 1.135***
Prior violent offense (no omitted)
1.319***
Prior FTA (no omitted) 1.259***
Model summary
Constant 1.487 1.141 1.037
N 17,925 17,925 17,925
-2LL model 1 (df) 22294.11 (5) 20315.89 (11)*** 20108.23 (14)***
Cox & Snell R square .023 .125 .136
Nagelkerke R Square .033 .175 .189
% correct 67.1% 70.4% 71.2% ***p≤.001, **p≤.01, *p≤.05
†When we excluded Colfax and Sandoval counties, we found Hispanics were significantly more likely to be detained.
We recognize that bond is an important component of pretrial detention. Two detention centers did
not provide us with information about bond. Thus, we estimated these models separately. We chose to
use amount of bond as the predictor. This was not significantly related to pretrial detention. The results
are available in Appendix F.

35
Influence of legal and extralegal factors on pretrial detention by court venue
Since the factors that influence pretrial detention may vary by the court venue, we ran separate logistic
regression models for those cases that had any district court involvement and those that were heard
only in magistrate court.13 We found some differences; these are displayed below.
In the models with all counties, age is statistically significant only for cases heard only in magistrate
court, not those heard in district court. Regardless of court venue, though, Native Americans are
significantly more likely to be detained than Whites. However, whether someone is male is only
significant when we include all cases, not by court type.
When the models exclude Colfax and Sandoval counties, we found that Hispanics were more likely than
Whites to be detained. This variable was significant in the overall model and for the magistrate court
only model, but not the district court only model. A comparison of the model results is available in
Appendix F.
Although the direction of the relationships between current offense and pretrial detention is the same
regardless of which court ultimately heard the case, the strength of the relationship varies somewhat by
court type. Among cases involving district court, arrestees with property offenses were significantly
more likely to be detained than those with violent offenses, though the significance level was relatively
low (p≤.05). Those with drug offenses, DWI, public order, and other offenses were all less likely to be
detained than those with a violent offense. However, the strongest relationship in terms of statistical
significance among district court cases was DWI; those individuals who were booked for a DWI were
significantly less likely to be detained than those with a violent offense. In all models, those whose
offense included a felony were significantly more likely to be detained, with the odds of detention
varying from 2.6 to 3.96 times more than those with only a misdemeanor.
Finally, all of the prior offense history variables were significantly related to the likelihood of detention
regardless of court venue. However, among cases heard in district court, whether the individual had an
arrest for a violent offense had the weakest relationship with detention in terms of statistical
significance.
13
In the bivariate, rate of pretrial detention and length of pretrial detention among those who had cases in both magistrate and district court was most similar to those who had only district court cases rather than magistrate court cases only. Further, there were so few district court only cases that a multivariate analysis was not possible with this subgroup. Therefore, we compare all cases with any district court involvement to those with only magistrate court involvement.

36
Table IV.10 Logistic Regression Results: Pretrial Detention by Court Venue All cases Any
district court
Magistrate court only
Demographics Age 1.009*** .997 1.011***
Race (white omitted)
Hispanic .943† .854† .970†
Native American 3.404*** 4.896*** 3.380***
Other 1.102 1.149 1.088
Gender (female omitted)
Male 1.156*** 1.177 1.159***
Current offense
Most serious offense (Violent omitted)
Property 1.088 1.287* 1.001
Drug .650*** .799* .588***
DWI .463*** .523*** .451***
Public order .474*** .438* .470***
Other .448*** .927 .429***
Degree (Misdemeanor omitted)
Felony 2.896*** 3.955*** 2.618***
Prior offenses Number prior felony arrests 1.135*** 1.215*** 1.112***
Prior violent offense (no omitted) 1.319*** 1.384*** 1.251***
Prior FTA (no omitted) 1.259*** 1.332*** 1.323***
Model summary
Constant 1.037 1.021 .997
N 17,925 4,171 13,754
Cox & Snell R square model 3 .136 .082 .120
Nagelkerke R Square model 3 .189 .134 .163
% correct model 3 71.2% 82.7 67.6% ***p≤.001, **p≤.01, *p<.05
†When we excluded Colfax and Sandoval counties, we found Hispanics were significantly more likely to be
detained.
Influence of legal and extralegal variables on length of pretrial detention It is also important to assess the relative influence of legal and extralegal variables on the length of
pretrial detention. In order to assess this, we calculated multivariate linear regression models. Like the
logistic regression models above, we computed three different models, adding in groups of variables
each time. While the original, demographics only model indicates that Native Americans spend
significantly less time detained than Whites, once other variables are accounted for, this finding was no
longer statistically significant. Further, when we excluded Sandoval and Colfax counties, we found that
Hispanic detainees were detained for a significantly shorter number of days than Whites. All models
indicate that males were significantly more likely to be detained than females.
The current offense was also significantly associated with length of detention. Those individuals whose
most serious offense was a violent crime spent a significantly greater amount of time in pretrial
detention than those with any other offense. Felony offenders had a significantly longer length of stay

37
than those charged with a misdemeanor. Further, this variable had the strongest relationship with
length of stay, indicating that it was the best predictor of length of stay.
Finally, both the number of prior felony arrests and whether there was a prior violent offense
significantly increased the predicted length of stay. Surprisingly, though, those with a prior FTA were
associated with a significant decline in the predicted number of days detained.
Table IV.11 Multiple Regression Results: Length of Pretrial Detention Model 1 Model 2 Model 3
Demographics Age -.008 .005 .005
Race (white omitted)
Hispanic -.010 -.002 -.009†
Native American -.026*** -.001 -.003
Other .015 .012 .011
Gender (female omitted)
Male .058*** .056*** .047***
Current offense Information
Most serious offense (Violent omitted)
Property -.046*** -.050***
Drug -.075*** -.075***
DWI -.069*** -.060***
Other -.036*** -.035***
Public order -.061*** -.060***
Degree (Misdemeanor omitted)
Felony .205*** .198***
Prior Offense Number prior felony arrests .069***
Prior violent offense (no omitted) .031**
Prior FTA (no omitted) -.019***
Model summary
F-test 16.037*** 98.185*** 86.369***
Adjusted R-square .004 .056 .063
N 17,924 17,924 17,924
***p≤.001, **p≤.01, *p<.05
†When we exclude Sandoval and Colfax counties, this is significant (p≤.01).
While bond was not significantly associated with whether or not an individual was detained pretrial, it
was a significant predictor of length of detention. The positive value indicates that individuals with
higher bonds were more likely to be detained for a greater length of time. Once bond was considered,
two of the race/ethnicity variables were significant. Hispanic detainees were more likely to spend
significantly fewer days in the detention facility than Whites. Those whose race/ethnicity was in the
“other” category were more likely to spend more time in jail than Whites were, though this was only
marginally significant. Recall that when we include bond, we exclude two counties, so this may account
for the change in the significance of these variables. The relationship between the remaining variables
and length of stay remained the same.

38
Table IV.12 Multiple Regression Results: Length of Pretrial Detention with and without Bond Variable Days detained
Days detained with bond variable
Demographics Age .005 .005
Race (White omitted)
Hispanic -.009 -.034***
Native American -.003 -.011
Other .011 .014*
Gender (Female omitted)
Male .047*** .041***
Current offense (Violent omitted)
Current offense information
Property -.050*** -.042***
Drug -.075*** -.068***
DWI -.060*** -.056***
Public order -.035*** -.054***
Other -.060*** -.034***
Degree (Misdemeanor omitted)
Felony .198*** .209***
Prior offense Number prior felony arrests .069*** .067***
Prior violent offense (no omitted) .031** .034***
Prior FTA (no omitted) -.019*** -.020*
Bond Minimum bond amount --- .025**
Model summary
N 17,924 12,907
R-square .063 .068
Adjusted R-square .063 .067
F-test 86.647 (14/17910 df)*** 62.963 (15/2892)***
***p≤.001, **p≤.01, *p<.05
Length of detention by court venue
We computed the regression models separately for those cases that had any district court involvement
and those that involved magistrate court cases only. The results are displayed below. We found that
while race/ethnicity was not a significant predictor in the overall model or for district court cases, it was
for magistrate court cases. Relative to White detainees, Hispanic detainees were held for a significantly
shorter time, while Native Americans were held for a significantly longer time.
Regardless of court venue, males were detained for a significantly longer time. Those booked for a
violent offense spent a significantly longer time detained, regardless of court venue, compared to
offenders booked for non-violent offenses. However, the period of detention was not significantly
different between offenders charged with a violent offense and those charged with a property offense
among those who were seen only in magistrate court. In all models, current felony offense is
statistically significant, indicating that those booked for a felony spend a significantly longer time
detained than those booked for a misdemeanor only.
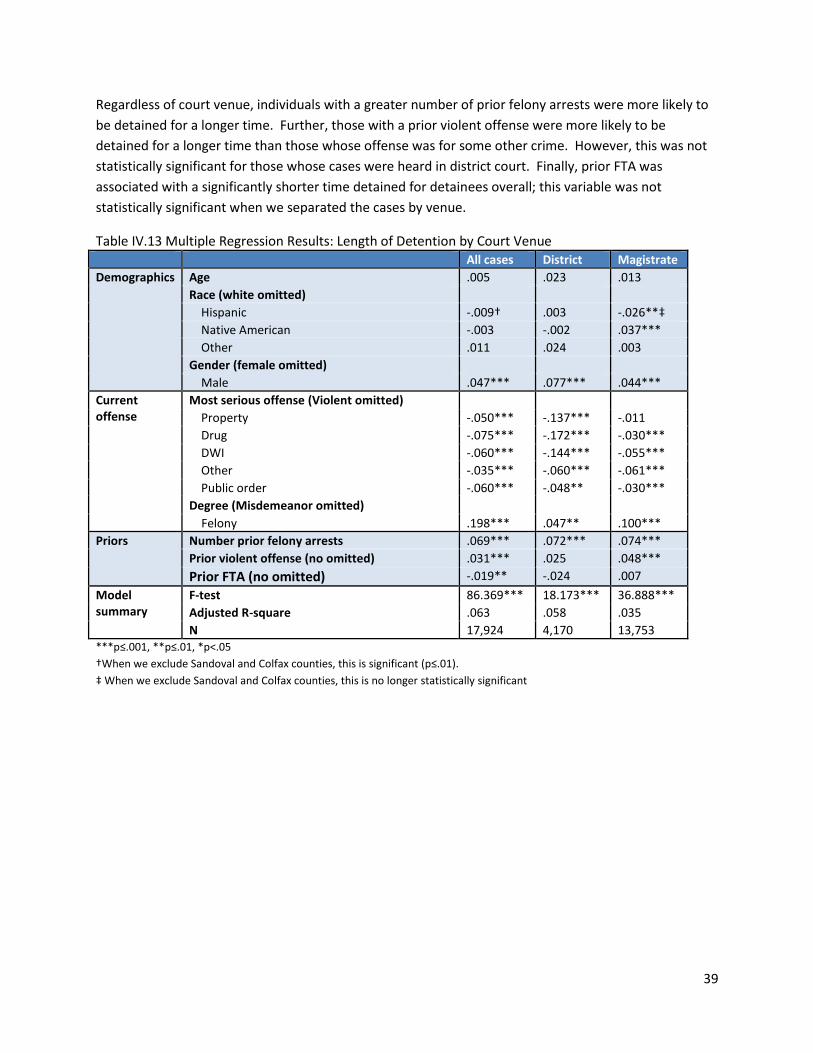
39
Regardless of court venue, individuals with a greater number of prior felony arrests were more likely to
be detained for a longer time. Further, those with a prior violent offense were more likely to be
detained for a longer time than those whose offense was for some other crime. However, this was not
statistically significant for those whose cases were heard in district court. Finally, prior FTA was
associated with a significantly shorter time detained for detainees overall; this variable was not
statistically significant when we separated the cases by venue.
Table IV.13 Multiple Regression Results: Length of Detention by Court Venue All cases District Magistrate
Demographics Age .005 .023 .013
Race (white omitted)
Hispanic -.009† .003 -.026**‡
Native American -.003 -.002 .037***
Other .011 .024 .003
Gender (female omitted)
Male .047*** .077*** .044***
Current offense
Most serious offense (Violent omitted)
Property -.050*** -.137*** -.011
Drug -.075*** -.172*** -.030***
DWI -.060*** -.144*** -.055***
Other -.035*** -.060*** -.061***
Public order -.060*** -.048** -.030***
Degree (Misdemeanor omitted)
Felony .198*** .047** .100***
Priors Number prior felony arrests .069*** .072*** .074***
Prior violent offense (no omitted) .031*** .025 .048***
Prior FTA (no omitted) -.019** -.024 .007
Model summary
F-test 86.369*** 18.173*** 36.888***
Adjusted R-square .063 .058 .035
N 17,924 4,170 13,753 ***p≤.001, **p≤.01, *p<.05
†When we exclude Sandoval and Colfax counties, this is significant (p≤.01).
‡ When we exclude Sandoval and Colfax counties, this is no longer statistically significant

40
Section V. Pretrial performance Judges must make determinations about whether someone is likely to fail to appear (FTA) or commit a
new offense while awaiting trial. This is an important aspect of the pretrial release decision-making
process. In this section, we examine FTAs and new offenses, both of which are considered failures if
committed during the pretrial period.
Among those who were released during the pretrial period, 18% committed a new offense. New
offenses were much more common among those whose cases were being heard in the district court
(34.7%) rather than magistrate court only (13.2%). However, some of these offenses were likely FTAs.
On occasion, the arrest violation in the DPS data lists the original charge rather than the FTA.
We determined whether someone failed to appear during the pretrial period using data from the
booking facilities as well as arrest (DPS) data. Among those who were released pretrial, we found
indications of FTAs for 7% (N=1282) of the sample. Those who had a case involving the district court
were more likely to have an FTA (14%, N=586) than those whose cases were heard only in magistrate
court (5%, N=696).
Overall, 20% of individuals had either an FTA or a new arrest. Those with a district court case were
much more likely to have some sort of failure: 37% had an FTA, new arrest, or both. Just 15% of those
with only magistrate court cases had an FTA, new arrest, or both.
Table V.1 New Offenses, FTAs, and Overall Pretrial Compliance
Total N % n
New offenses during pretrial 16,240 18.2% 2,959 Any district cases 3,779 34.7% 1,310 Magistrate only 12,461 13.2% 1,649
FTA during pretrial 16,240 7.0% 1,282 Any district cases 3,779 15.5% 585 Magistrate only 12,461 5.6% 692
Any pretrial failure (new offense or FTA) 17,930 20.3% 3,644 Any district cases 4,172 37.4% 1,559 Magistrate only 13,758 15.2% 2,085
In the table below, we display the types of offenses for which people were arrested while awaiting
disposition. Property offenses were most common in cases overall: 24% of people were arrested for a
property offense. However, this was influenced by those with a district court case. Nearly one-third
(31%) of those whose case was being tried in district court and had a new arrest were arrested for a
property offense. The next most common offense among this group was a violent offense (23%)
followed by a drug offense (16%).
Conversely, among those with a new arrest who were awaiting magistrate court case resolution, the
most common offense was a public order offense (29.8%), some of which were likely FTAs. The next
most common offense among this group was a property offense (19%) followed by DWI (17%).

41
Table V.2 Offense Type Among Those Who Had a New Arrest Pretrial
Magistrate court only District court Total
Drug Offense 8.9% 16.1% 12.2% DWI Offense 17.1% 6.0% 12.1% Property Offense 19.0% 31.0% 24.4% Public Order Offense 29.8% 12.5% 21.9% Violent Offense 16.4% 23.1% 19.4% Other Offenses 8.7% 11.3% 9.9% Total 1,511 1,252 2,763
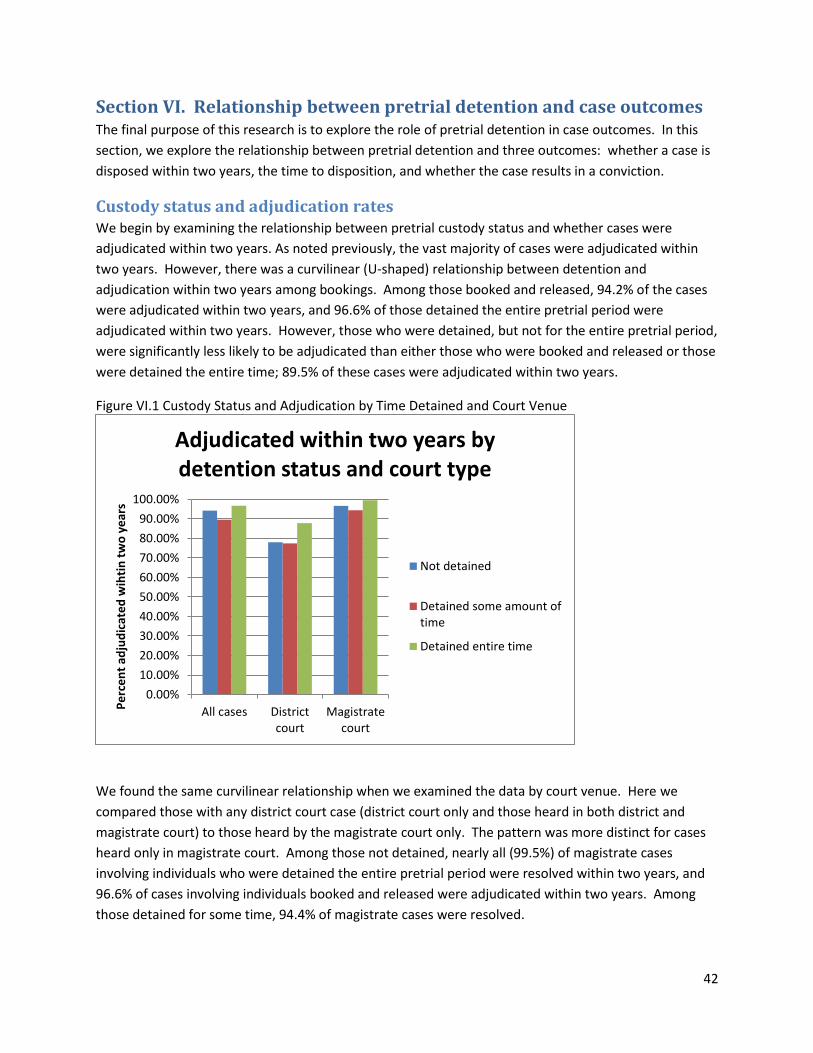
42
Section VI. Relationship between pretrial detention and case outcomes The final purpose of this research is to explore the role of pretrial detention in case outcomes. In this
section, we explore the relationship between pretrial detention and three outcomes: whether a case is
disposed within two years, the time to disposition, and whether the case results in a conviction.
Custody status and adjudication rates We begin by examining the relationship between pretrial custody status and whether cases were
adjudicated within two years. As noted previously, the vast majority of cases were adjudicated within
two years. However, there was a curvilinear (U-shaped) relationship between detention and
adjudication within two years among bookings. Among those booked and released, 94.2% of the cases
were adjudicated within two years, and 96.6% of those detained the entire pretrial period were
adjudicated within two years. However, those who were detained, but not for the entire pretrial period,
were significantly less likely to be adjudicated than either those who were booked and released or those
were detained the entire time; 89.5% of these cases were adjudicated within two years.
Figure VI.1 Custody Status and Adjudication by Time Detained and Court Venue
We found the same curvilinear relationship when we examined the data by court venue. Here we
compared those with any district court case (district court only and those heard in both district and
magistrate court) to those heard by the magistrate court only. The pattern was more distinct for cases
heard only in magistrate court. Among those not detained, nearly all (99.5%) of magistrate cases
involving individuals who were detained the entire pretrial period were resolved within two years, and
96.6% of cases involving individuals booked and released were adjudicated within two years. Among
those detained for some time, 94.4% of magistrate cases were resolved.
0.00%
10.00%
20.00%
30.00%
40.00%
50.00%
60.00%
70.00%
80.00%
90.00%
100.00%
All cases Districtcourt
Magistratecourt
Pe
rce
nt
adju
dic
ate
d w
ihti
n t
wo
ye
ars
Adjudicated within two years by detention status and court type
Not detained
Detained some amount oftime
Detained entire time

43
There was a very slight difference in adjudication rates among those booked and released and those
detained some period of time (but not the entire pretrial period) among district court cases (78% of
those booked and released and 77.4% of those detained some period of time). A much greater
proportion (87.8%) of cases were resolved within two years among those who were detained the entire
pretrial period. Overall, the cases of those detained the entire pretrial period were most likely to be
adjudicated within two years.
Days to disposition by custody status pretrial Consistent with the results above, we found the mean and median number of days to disposition for all
cases adjudicated within two years was highest for those detained for some, but not all, of the pretrial
detention time. Interestingly, when we examine time to disposition by magistrate only cases compared
to those with any district court involvement, both the mean and median time to adjudication decreases
with increasing periods of detention. However, these results are consistent with those above, which
indicated that the cases of those detained the entire pretrial period were more likely to be adjudicated
within two years.
Table VI.1 Time to Disposition by Period Detained and Court Venue
All cases District court cases Magistrate court cases
Mean (s.d.)
Median N Mean Median N Mean Median N
Booked and released***
186.21 (163.72)
137.00 5,565 366.23 (170.81)
351.00 603 164.33 (147.97)
121.00 4,962
Detained some time***
209.30 (174.48)
160.00 9,281 351.88 (170.23)
322.00 2,326 161.62 (146.98)
117.00 6,955
Detained entire time***
84.65 (138.62)
23.00 1,594 222.27 (168.95)
192.00 345 46.63 (91.92)
16.00 1,249
***p≤.001, **p≤.01, *p<.05
Pretrial detention by adjudication status We compared the length of pretrial detention by adjudication status. When court type was not
considered, those whose cases were adjudicated within six months spent the shortest time detained,
with an average of 7 days and median of 1 day. The average number of days detained increased with
increasing time to adjudication; however, the median number of days remained the same (1 day) for
cases resolved within 2 years and increased thereafter. Individuals whose cases that took more than
two years to resolve were detained an average of 33 days, with a median of 2 days.
We examined this by court type as well. For cases heard in district court, the average number of days
detained was nearly the same for cases disposed within 6 months as those disposed within one year,
and increased thereafter. However, the median number of days detained was highest for district court
cases resolved within six months, and was between 3 and 4 days except for cases not yet resolved,

44
which had a median of 7 days. Conversely, among cases heard in magistrate court, the average number
of days detained increased with increased time to disposition, while the median number of days
remained at 1 except for cases not yet adjudicated (2 days).
Contrary to the results above, this indicates that on average, those whose cases were not yet disposed
were detained longer. However, the median number of days detained was the same for magistrate
court cases regardless of disposition status. Moreover, among district court cases, the median number
of days detained was highest among cases disposed within six months. These differences suggest that
among those whose cases take longer to adjudicate, some individuals were detained for long periods of
time but most were not.
Table VI.2 Time Detained by Disposition and Court Venue
All cases District court cases Magistrate court cases
Mean (s.d.)
Median N Mean (s.d.)
Median N Mean (s.d.) Median N
Case disposed within 6 months
7.07 (18.57)
1.00 10048 35.66 (47.65)
14.00 614 5.21 (12.78)
1.00 9434
Case disposed 6 months to 1 year
16.34 (48.44)
1.00 3754 35.58 (71.47)
4.00 1342 5.63 (22.14)
1.00 2412
Case disposed 1 to 2 years
22.92 (79.54)
1.00 2638 40.23 (105.86)
3.00 1318 5.64 (29.36)
1.00 1320
Case disposed over 2 years
31.93 (122.27)
2.00 952 44.10 (144.90)
3.00 661 4.30 (11.89)
1.00 291
Case not yet disposed
33.56 (138.20)
3.00 538 61.09 (198.03)
7.00 237 11.89 (47.62)
2.00 301
Relative influence of legal and extralegal variables on adjudication In order to assess whether pretrial detention is related to adjudication once other factors are
considered, we calculated a series of nested logistic regression models. The baseline model includes
only demographics, the second model adds current offense information, the third includes prior offense
information, and the last includes the number of days detained pretrial.14 The model summaries
14
A summary of the bivariate relationship between adjudication and each of the variables in this model is available in Appendix
G.

45
indicate that the inclusion of each additional set of variables did significantly improve the overall model
(See Appendix H for the results of each step in the model). In addition, we calculated the models
separately for those cases involving district court compared to those heard only in magistrate court. The
results from the final models are below.
When all cases are considered, relative to White defendants, cases involving Hispanic defendants were
significantly less likely to be adjudicated within two years. Conversely, those involving Native Americans
were significantly more likely to be adjudicated. Cases heard in district court involving Hispanic
defendants were less likely to be adjudicated within two years than cases involving White defendants.
We found no substantive differences when we excluded Sandoval and Colfax counties. Further, cases
involving male defendants were slightly more likely to be adjudicated within two years if they involved
district court. However, we found no significant demographic differences among cases heard only in
magistrate court.
We also found that some offenses were more likely to be adjudicated within two years. Relative to
violent offenses, DWI, public order, and other offenses were significantly more likely to be adjudicated.
However, when we limited the data to court type, we found that among district court cases, only those
involving DWI were significantly more likely to be disposed of within two years compared to cases
involving a violent offense. In magistrate court, all offense types were more likely than violent offenses
to be adjudicated within two years. Property offenses, for example, were four times more likely than
violent offenses to be disposed within two years. When we examined all cases, those involving a felony
were significantly less likely than misdemeanor cases to be adjudicated within two years. As might be
expected, felony status was not a significant predictor of adjudication in cases involving district court.
However, felonies were 1.6 times as likely to be adjudicated if they were heard in magistrate court.
We included prior criminal history in the multivariate model since felony arrests and prior FTAs were
significantly related to adjudication in the bivariate analyses. The results below indicate that having a
prior violent offense or an FTA was significantly related to the likelihood of adjudication. There was
some variation by court type though. Among district court cases, having a prior FTA significantly
increased the odds of adjudication within two years, but prior offenses did not have a statistically
significant effect. Conversely, among magistrate court cases, having a prior arrest for a violent offense
significantly increased the odds of adjudication. While it is not clear why criminal history would play a
role in the likelihood of adjudication within two years, it could be that those with prior offenses or FTAs
were more likely to plea to the charges.
Importantly, pretrial detention was significantly related to adjudication, even after other variables were
taken into account. The longer individuals remained detained, the less likely it was that their case would
be adjudicated within two years. This variable was a significant predictor of adjudication when we
considered all cases together, and when we considered cases by court venue.
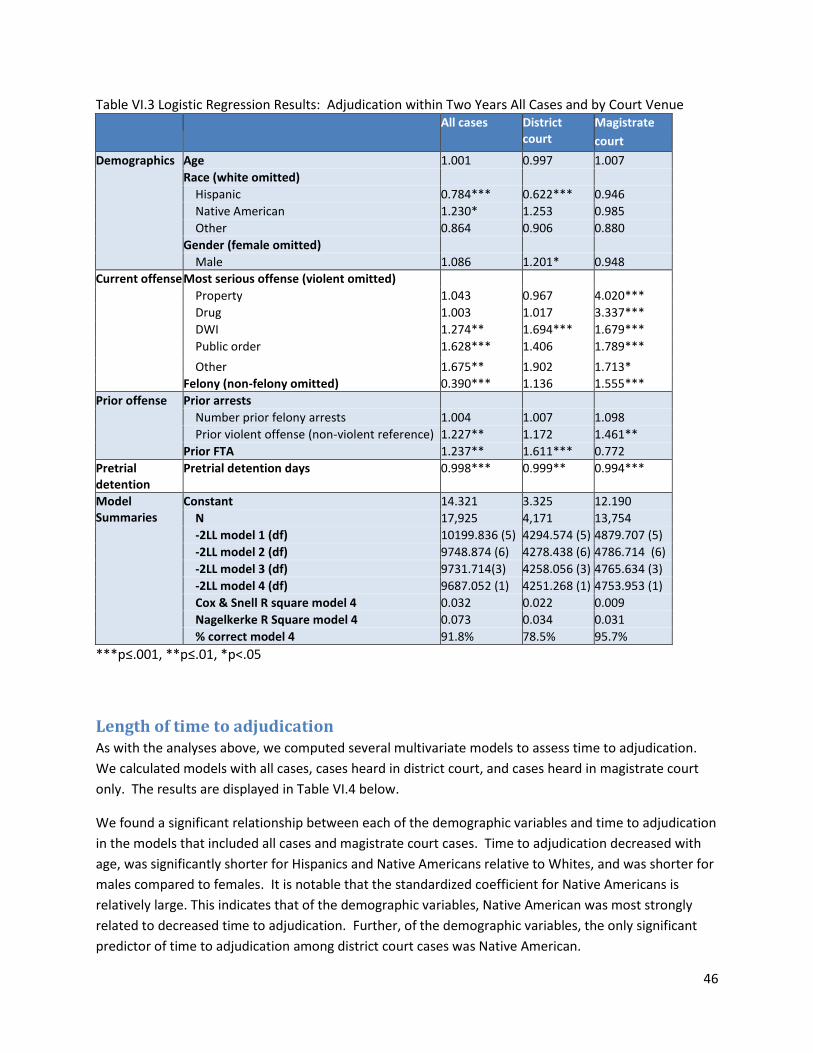
46
Table VI.3 Logistic Regression Results: Adjudication within Two Years All Cases and by Court Venue All cases District
court Magistrate
court
Demographics Age 1.001 0.997 1.007
Race (white omitted)
Hispanic 0.784*** 0.622*** 0.946
Native American 1.230* 1.253 0.985
Other 0.864 0.906 0.880
Gender (female omitted)
Male 1.086 1.201* 0.948
Current offense Most serious offense (violent omitted)
Property 1.043 0.967 4.020***
Drug 1.003 1.017 3.337***
DWI 1.274** 1.694*** 1.679***
Public order 1.628*** 1.406 1.789***
Other 1.675** 1.902 1.713*
Felony (non-felony omitted) 0.390*** 1.136 1.555***
Prior offense Prior arrests
Number prior felony arrests 1.004 1.007 1.098
Prior violent offense (non-violent reference) 1.227** 1.172 1.461**
Prior FTA 1.237** 1.611*** 0.772
Pretrial detention
Pretrial detention days 0.998*** 0.999** 0.994***
Model Summaries
Constant 14.321 3.325 12.190
N 17,925 4,171 13,754
-2LL model 1 (df) 10199.836 (5) 4294.574 (5) 4879.707 (5)
-2LL model 2 (df) 9748.874 (6) 4278.438 (6) 4786.714 (6)
-2LL model 3 (df) 9731.714(3) 4258.056 (3) 4765.634 (3)
-2LL model 4 (df) 9687.052 (1) 4251.268 (1) 4753.953 (1)
Cox & Snell R square model 4 0.032 0.022 0.009
Nagelkerke R Square model 4 0.073 0.034 0.031
% correct model 4 91.8% 78.5% 95.7%
***p≤.001, **p≤.01, *p<.05
Length of time to adjudication As with the analyses above, we computed several multivariate models to assess time to adjudication.
We calculated models with all cases, cases heard in district court, and cases heard in magistrate court
only. The results are displayed in Table VI.4 below.
We found a significant relationship between each of the demographic variables and time to adjudication
in the models that included all cases and magistrate court cases. Time to adjudication decreased with
age, was significantly shorter for Hispanics and Native Americans relative to Whites, and was shorter for
males compared to females. It is notable that the standardized coefficient for Native Americans is
relatively large. This indicates that of the demographic variables, Native American was most strongly
related to decreased time to adjudication. Further, of the demographic variables, the only significant
predictor of time to adjudication among district court cases was Native American.

47
When we calculated the models excluding Sandoval and Colfax counties, we found that when we
considered all cases regardless of venue, time to adjudication was still significantly shorter for Hispanics
relative to White defendants, though less so (p≤.05). Further, there were no significant differences
between Hispanics and Whites when the data were limited to magistrate court cases.
Offense type was also a significant predictor of time to adjudication. In the overall model, relative to
those with a violent offense, the time to adjudication was significantly longer for those with a drug or
DWI offense. Conversely, public order infractions were likely to be disposed of more quickly than
violent offenses. Felony cases were more likely to take significantly longer to adjudicate than
misdemeanors.
However, among cases disposed of in district court, only property crime was a significant predictor of
time to adjudication. Relative to those with a violent offense, cases involving a property offense were
more likely to be adjudicated sooner. However, among magistrate court cases, DWI cases were
associated with a longer time to adjudication relative to violent offenses, while all other offenses were
associated with a significantly shorter time to disposition. Further, in magistrate court, offenses
involving a felony were more likely to be adjudicated more quickly than misdemeanors. This variable
was not a significant predictor of time to adjudication in the district court case model.
We did find some evidence of a relationship between prior offenses and time to adjudication as well.
Prior FTA was significantly related to time to adjudication in the overall model and the district court
model, though only marginally so. The coefficient indicates that time to adjudication was shorter for
those with a prior FTA. Among magistrate court cases, prior felony arrests were a significant predictor
of time to adjudication: a greater number of prior felony arrests predicted a shorter time to
adjudication.
Even after all of these variables were included in the models, pretrial detention time was a significant
predictor of time to adjudication. The longer a defendant was detained, the longer the time to
adjudication. This variable was significant in all models, regardless of court venue.

48
Table VI.4 Multiple Regression Results: Time to Adjudication All Cases and by Court Venue All Cases Only District
Cases Only Magistrate Cases
Demographics Age -0.024*** 0.004 -0.035***
Race (White omitted)
Hispanic -0.044***† -0.005 -0.037***‡
Native American -0.113*** -0.091*** -0.091***
Other -0.012 -0.010 -0.012
Gender (Female omitted)
Male -0.021** -0.027 -0.020*
Current offense (Violent omitted)
Current offense information
Property 0.008 -0.058** -0.032***
Drug 0.045*** -0.011 -0.018*‡
DWI 0.101*** -0.009 0.079***
Public order -0.045*** -0.023 -0.060***
Other 0.014 -0.010 0.021*
Degree (Misdemeanor omitted)
Felony 0.146*** 0.027 -0.160***
Prior offense Number prior felony arrests 0.000 0.011 -0.027**
Prior violent offense (no omitted) -0.004 -0.014 -0.016
Prior FTA (no omitted) -0.020*‡ -0.037*‡ -0.006
Pretrial detention
Pretrial detention days 0.121*** 0.037* 0.031***
Model summary
N 16,433 3,272 13,161
R-square 0.071 0.015 0.054
Adjusted R-square 0.070 0.011 0.053
F-test 83.085*** 3.345*** 50.324***
***p≤.001, **p≤.01, *p≤.05
† When we excluded Sandoval and Colfax counties, this significance level declined to p≤.05
‡ When we excluded Sandoval and Colfax counties, this was no longer statistically significant
Conviction and pretrial detention Finally, we explored whether pretrial detention was associated with conviction. We found a statistically
significant relationship between pretrial detention and conviction.15 Individuals who were convicted
spent a much longer time in pretrial detention on average than those whose cases were dismissed or
acquitted. However, the median time was the same: just one day.
This varied, though, by court venue. Among cases that were disposed in magistrate court, the mean
number of days detained was five and the median was one, regardless of whether the case resulted in a
conviction. Among cases with any district court involvement, those who were not convicted spent a
shorter time detained (30 days on average) than those who were convicted (38 days on average). The
15
Conviction is defined as any finding of guilt.

49
median number of days detained was also greater for those convicted: six days versus three for those
not convicted.
Table VI.5 Time Detained by Conviction Status All cases District court cases Magistrate court cases
Mean (s.d.) Median Mean (s.d.) Median Mean (s.d.) Median
Not Convicted
7.73 (32.004) 1.00 30.21 (83.678) 3.00 5.46 (19.185) 1.00
Convicted 14.02 (46.385) 1.00 38.49 (81.563) 6.00 5.19 (15.064) 1.00
In Table VI.6 below, we compare conviction status by whether the individual was booked and released,
detained for some time, or detained the entire pretrial period. Those detained during the entire pretrial
period were much more likely to be convicted than those who were booked and released or detained
for some time. Further, the likelihood of conviction was higher for those who were detained pretrial
regardless of court venue. Nearly all (93%) of those whose cases were heard in district court and were
detained the entire pretrial period were convicted, and 69% of similarly situated individuals in
magistrate court were convicted. Overall, 75% of individuals detained the entire pretrial period were
convicted.
Table VI.6 Conviction Status by Detention Period and Court Venue Booked and released Detained some time Detained entire time
All Cases***
Convicted 56.6% 57.5% 74.5%
N 5,565 9281 1594
Magistrate Court***
Convicted 54.2% 50.1% 69.3%
N 4,953 6,940 1,243
District Court***
Convicted 76.9% 79.6% 92.7%
N 577 2,244 331
p≤.001
Finally, we examined the influence of the length of pretrial detention on conviction after controlling for
various legal and extralegal variables. The results of the multivariate models, calculated for all cases,
cases involving district court, and magistrate court cases only, are displayed in Table VI.7 below. We
found several demographic variables were significantly related to the likelihood of conviction. Older
individuals were significantly less likely to be convicted regardless of court venue. Relative to White
defendants, Hispanic and Native American defendants were significantly less likely to be convicted in all
cases and among magistrate court cases. However, race was not a significant predictor of conviction in
the district court model. We found no differences with respect to Hispanic ethnicity when we excluded
Colfax and Sandoval counties. Finally, in all three models, men were significantly more likely to be
convicted than women.
Relative to cases involving a violent crime as the most serious offense, cases involving a DWI were
significantly more likely to result in conviction regardless of court venue. Indeed, the odds of conviction

50
were five times higher for cases involving a DWI than a violent crime for all cases and for cases heard in
magistrate court. Further, the log-odds of conviction were significantly higher for all types of offenses
except “other” offenses when all case types were considered. However, when we limited the model to
include district court cases only, the log-odds of conviction were significantly higher only for property
crimes and DWI. Among magistrate court cases, all types of offenses were significantly more likely than
violent crimes to result in conviction. Whether the case involved a felony was a significant predictor of
conviction for cases overall. However, this variable was not statistically significant for either the district
court model or the magistrate court model.
We found the number of prior felony arrests was a marginally significant predictor of conviction in cases
overall. However, the likelihood of conviction increased by 12% (or 1.12 times) for every prior felony
arrest in the district court model. However, this variable was not a significant predictor of conviction in
the magistrate court model. Moreover, whether the individual had a prior violent offense or FTA did not
significantly increase the odds of conviction in any model.
Lastly, in all models, the odds of conviction were significantly higher for those who were detained
pretrial. Among all court cases, the odds of conviction increase by 1.005 times for each additional day
someone was detained once other factors are taken into account. Thus, for example, someone who was
detained for 10 days would have a 5% greater chance of being convicted than someone booked and
released. While pretrial detention was statistically significant in both the magistrate and district court
models, it was only marginally so.

51
Table VI.7 Whether Convicted Among Cases Disposed Within Two Years All cases District
court cases
conviction
Magistrate court
conviction
Demographics Age 0.995*** 0.991** 0.996*
Race (white omitted)
Hispanic 0.851*** 0.856 0.860***
Native American 0.677*** 0.856 0.718***
Other 1.170 1.075 1.175
Gender (female omitted)
Male 1.123** 1.207* 1.140**
Current offense Most serious offense (violent omitted)
Property 1.605*** 1.319** 1.452***
Drug 1.652*** 1.195 1.491***
DWI 5.027*** 2.111*** 5.027***
Public order 1.660 0.674 1.133*
Other 1.096*** 0.649 1.777***
Degree (misdemeanor omitted)
Felony 1.663*** 1.277 0.938
Prior offense Number prior felony arrests 1.016*‡ 1.122*** 0.989
Prior violent offense (no omitted) 0.950 0.983 0.928
Prior FTA (no omitted) 0.978 1.127 0.992
Pretrial detention Pretrial detention days 1.005*** 1.001* 1.002*
Model Summary Constant 0.861 2.763 0.285
N 16,435 3,273 13,162
-2LL model 1 (df) 22196.173 (5) 3232.999 (5) 18153.087 (5)
-2LL model 2 (df) 20762.613 (6) 3203.640 (6) 16894.693 (6)
-2LL model 3 (df) 20785.226(3) 3181.943 (3) 16889.504 (3)
-2LL model 4 (df) 20695.193 (1) 3175.635 (1) 16885.689 (1)
Cox & Snell R square model 4 0.091 0.021 0.094
Nagelkerke R Square model 4 0.123 0.034 0.125
% correct model 4 64.0% 80.4% 62.4% ***p≤.001, **p≤.01, *p≤.05

52
VII. Conclusion The objectives of this study were to compile case processing statistics, explore pretrial detention time
and the characteristics of those detained pretrial, and examine whether pretrial detention as well as
other legal and extra-legal factors influence case outcomes. In this section, we describe the findings and
discuss their implications. We also offer suggestions for future research and conclude with the study
limitations.
Case processing and performance measures One of the possible reasons for unnecessary pretrial detention time is a delay in case processing. In this
study, we chose to focus on case processing performance measures that are not currently utilized by the
courts, and used different methodologies to assess measures currently used (e.g., using booking date
rather than filing date when measuring time to adjudication). It is important to understand whether
these measures could provide information that would be meaningful to stakeholders when considering
pretrial detention.
Cases accepted for prosecution
We began by exploring the proportion of cases accepted for prosecution among those booked on a new
charge. While not a measure of the performance of the courts, it is important to understand how many
cases are accepted or rejected for prosecution. Additionally, it could be indicative of police
performance- whether those arrested and booked for a crime were justly detained. In order to
construct this measure, we limited the data to the first booking in each county for a new offense. We
tracked cases that were within the same county as the booking incident, and found a definitive match
for 55% of the cases overall (72% of felony-level cases and 50% of misdemeanor-level cases). However,
these figures likely underestimate the true number of cases accepted for prosecution since we did not
include cases that were tried in other counties or cases tried in municipal court. Thus, more information
is needed to successfully construct this measure.
Time to case filing
Next, we examined time to case filing from two points: the offense date and the booking date. New
Mexico requires that charges to be filed against a defendant within particular time frames, which vary
depending on whether the case is a felony or misdemeanor. The shortest time is one year for petty
misdemeanors, two years for misdemeanors, and up to three years for felonies (though there are
exceptions). For most cases, the median time between the offense date and filing date was 2 days.
However, the median time was much longer for cases involving district court only (93 days), while cases
first heard in magistrate court then bound over to district court were filed more quickly (57 days).
Despite these differences, these results indicate that the filing dates occurred well within the guidelines
for most cases.
We also examined the time from booking to case filing. While we expected cases would be filed after
booking, in 28% of cases, the case was filed before booking occurred. This occurred more often for
individuals with felony-level offenses (18%) than those with only misdemeanors (9%). There are two
possible reasons for these findings. First, individuals may have been booked as the result of a grand jury
indictment rather than during an arrest. Second, there may have been an underlying magistrate court

53
case we did not discover. In the case of the latter, we would have used the filing date from the
magistrate court as the first filing date that may have been the same or subsequent to the booking.
New Mexico rules govern how quickly a case must be filed depending on whether the defendant is in
custody. Consistent with these rules, among those booked prior to case filing, the time between
booking and filing was significantly shorter for individuals who were in custody at the time of filing. The
greatest delays were among those whose cases were heard only in district court, where the median
number of days between booking and filing was 13 days, whereas it was only two days for cases
originating in magistrate court.
Time to adjudication and rates of disposition
Besides assessing whether New Mexico district attorneys comply with recommended timelines for filing
charges, we also examined time to adjudication. We first explored which date best represents time in
the system: booking date or case filing date. The time to adjudication is likely underestimated for cases
processed through district court when the filing date is used, so the booking date would be more
accurate. However, for cases heard only in magistrate court, the filing date better reflects time in the
criminal justice system for most cases. Therefore, the best measure of time in the criminal justice
system would be to use whichever date is first.
Next, we assessed time to adjudication using the earliest date as the beginning point. We examined
adjudication rates both at the case level and by booking, since some bookings were associated with
multiple cases. At the case level, we found that the median number of days to disposition for
magistrate court cases was 83 days from either booking or filing date, whichever was first. The median
number of days to disposition was 301 days for cases heard in district court.
Even though some bookings were associated with multiple cases, the vast majority of cases were
resolved within two years. As would be expected, cases involving only the magistrate court were
resolved more quickly. Nearly 70% were adjudicated within six months, while 14% took more than one
year to resolve. Most cases involving district court, both those initiated in district court and those
bound over from magistrate court, took between one and two years to resolve.
Conviction rates
Most cases (59%) resulted in the conviction of the defendant; cases involving district court were much
more likely to result in conviction (80%) than those heard in magistrate court only (54%). The AOC
currently reports these measures as well, and does so by offense type, but only for those cases within
each year. In addition to these case processing statistics, we also calculated the proportion of
defendants who were sentenced to any incarceration versus probation only. This measure was
somewhat flawed as we could not take into account whether the entire incarceration portion of the
sentence was suspended. Among those sentenced to incarceration, future research should further
differentiate how much time is suspended and how much time must be served.

54
Pretrial detention The primary purpose of this research was to explore pretrial detention. We began by examining the
extent of pretrial detention. The vast majority of people booked were released quickly; indeed, the
volume of people flowing through our detention centers each year is somewhat astounding. However, a
small proportion of individuals spend a relatively long time detained. Among the 9% of individuals held
for the entire pretrial period, the median number of days detained was 17, compared to 1 day overall.
These differences were greatly magnified for individuals whose cases were heard in district court
compared to magistrate court only.
Length of time detained also varied by county. The median number of days detained for those booked
into the Colfax County Detention Center was higher than other detention centers overall. However,
among those detained the entire pretrial period, those booked in Colfax County were detained the
shortest period of time. Conversely, those booked into the Doña Ana Detention Center were held for
the shortest amount of time (a median of 0 days). However, among those detained the entire pretrial
period, detainees in Doña Ana were detained the longest period of time (a median of nearly 38 days).
Overall, then, most individuals are released within a short time frame. However, those who are not
quickly released tend to remain in jail for a relatively long period of time.
Factors associated with pretrial detention
The results of both the bivariate and multivariate analyses indicated that both legal and extralegal
factors predicted whether someone is detained pretrial and the length of pretrial detention. We found
significant relationships between demographic variables and pretrial detention. Although older
individuals were significantly more likely to be detained pretrial, age did not play a significant role in the
length of pretrial detention. Males were both more likely to be detained and to be detained for longer
periods of time, even after other factors including current offense and criminal history were taken into
account.
Native Americans were significantly more likely than Whites to be detained pretrial, regardless of court
venue. We did not detect any other significant differences by race or ethnicity regarding whether or not
a defendant was detained. We also found that the length of pretrial detention did not differ by race for
cases overall or for cases involving district court. On the other hand, we did find significant differences
among cases involving magistrate court only. The analyses indicated that Native Americans were likely
to spend a significantly longer period in pretrial detention relative to Whites, while Hispanic defendants
were likely to spend a significantly shorter time than Whites in pretrial detention.
Because the relationship between race and pretrial detention may reflect the racial composition of
counties and county practices rather than race itself, we calculated the models controlling for county.
We also calculated individual models for each county. When controlling for county, we found the same
results. Further, when we calculated each model by county, we found that the relationship held for
seven of the nine counties. Thus, we feel confident that these findings are not unduly influenced by one
or two jurisdictions.

55
Current offense severity and offense history variables were statistically significant in all models. These
legal variables influenced whether someone was detained pretrial and the length of detention. In
general, those accused of a violent offense were both more likely to be detained and were detained for
longer periods of time. Although property offenders were no less likely to be detained than violent
offenders overall, they were slightly more likely to be detained if the case was heard in district court.
However, violent offenders were still significantly more likely to spend a longer time in jail. Individuals
facing felony charges were both more likely to be detained and to spend a longer period in jail than
those with misdemeanor offenses.
Criminal history also played a role in both the decision to detain and the length of detainment even after
other variables were taken into account. Those with any type of prior offense measured (felony arrest,
violent crime, or prior FTA) were more likely to be detained. The length of detention was significantly
longer for those with prior felony arrests, and for those with a prior violent offense. However, the
length of detention was shorter for those with a prior FTA than those who did not have a prior FTA.
We also explored the relationship between bond amount and pretrial detention among the seven
counties for whom we had bond data. While did not find any indication that bond amount influenced
whether someone was detained, it was a significant predictor of length of detention. As would be
expected, those with a larger bond amount were more likely to remain in jail longer.
Overall, these analyses confirmed legal variables were significant predictors of whether a person was
detained pretrial, the length of pretrial detention, or both. Given that judges are required to consider
factors such as character history, the nature of the crime, and likelihood to appear in court, it is perhaps
not surprising that offense severity and offense history would be associated with pretrial detainment.
Further, the model coefficients suggest that offense severity (i.e., felony) is among the most influential
variables associated with pretrial detention. Although a prior FTA was not related to length of
detention, it did increase the odds of being detained.
Success during pretrial period
Important measures of judicial decision-making regarding pretrial release are whether those who are
released pretrial appear in court, and whether they refrain from committing new offenses while
released. We found relatively high rates of both new offenses and FTAs, particularly among defendants
tried in district court where 37% experienced an FTA and/or new offense. These rates were much lower
for those whose cases were heard only in magistrate court (15%). Among those who were arrested for a
new offense, the most common offense type was a property offense for those whose cases heard in
district court and overall (when all cases were pooled together). However, those whose cases were
heard only in magistrate court were more often arrested for public order offense during the pretrial
period.
Influence of pretrial detention on adjudication
We examined the relationship between pretrial detention and adjudication in multiple ways. First, we
assessed the proportion of cases adjudicated within two years by detention status (detained the entire
pretrial period, part of the pretrial period, or none of the pretrial period). These bivariate analyses

56
suggest that adjudication within two years is more likely for individuals detained for either the entire
pretrial period or none of the pretrial period. Conversely, a smaller proportion of cases were
adjudicated when the individual was detained, but not for the entire pretrial period. Further, the
average number of days to adjudication was shortest for those detained the entire pretrial period; this
was true regardless of court venue.
We also examined length of pretrial detention by whether the case was adjudicated within two years.
We found that the longer it takes to adjudicate someone, the longer the average time detained. These
findings may seem to contradict with the findings above, which indicate that most cases involving
individuals detained the entire pretrial period are disposed within two years. These differences are due
to several factors. First, most cases are resolved within a relatively short period of time (one year or
less). Additionally, many of those detained the entire pretrial period involve cases that are all resolved
within a short relatively short time. However, there are some individuals whose cases take a long time
to resolve and who are detained most or the entire pretrial time. Thus, this relationship is influenced by
those who both are detained for a long time and whose cases take a relatively long time to resolve.
Multivariate analysis results indicate that the length of pretrial detention was a significant predictor of
whether a case was resolved within two years, even after other variables are taken into account.
Specifically, the greater the number of days detained, the less likely it is that the case will be resolved
within two years confirming the bivariate analyses. This relationship held in the model including all
cases, as well as those by court venue. In addition to pretrial detention, we found that DWI cases were
significantly more likely to be disposed of within two years compared to cases involving a violent crime
in all three models. Other variables were significant only in specific models. For example, in the model
involving all cases and those heard in district court, cases involving Hispanic defendants were
significantly less likely to be resolved within two years. In cases involving only the magistrate court,
cases involving all offense types were significantly more likely to be resolved within two years than cases
involving violent crimes.
In the models assessing time to adjudication, we confirmed that time detained significantly increased
the time to adjudication, even after controlling for important legal variables such as current and prior
offense. Further, this variable was statistically significant in all models, though the relationship was less
strong in the model which included cases heard in district court.
Influence of pretrial detention on conviction
The influence of pretrial detention on conviction is important. The bivariate analyses indicated that
those detained the entire time were significantly more likely to be convicted. Further, in multivariate
models, we found the length of pretrial detention did increase the odds of conviction in all models.
However, we also found current offense and demographics were significantly related to odds of
conviction. In particular, individuals charged with a DWI were much more likely to be convicted than
those charged with a violent offense. Further, younger individuals and males were significantly more
likely to be convicted. Race was significant in both the model that included all cases and the magistrate
only model. These models indicated that Native Americans and Hispanics were less likely to be
convicted than Whites.

57
Discussion and recommendations One purpose of this study was to assess whether using the date of filing underestimates time in the
criminal justice system, and if so, by how much. We found that it varies by court venue. We examined
the time to case filing from offense date and from booking date. The court does not currently measure
time to case filing from either offense or booking date, but it is important to do so as there are rules that
guide how quickly a case must be filed from these dates. Our results suggest that the time to case filing
by either measure is well within the guidelines, though there are some that exceed those guidelines.
However, this could change considering that the data were not detailed enough to determine whether
those cases that exceed the guidelines are due to acceptable reasons. Thus, we recommend the AOC
explore the feasibility of constructing measures of time to case filing from offense date, and from
booking date if the booking precedes the filing date.
In addition, we assessed the time to disposition from booking date and from filing date. Currently, the
AOC examines time to disposition from case filing. Their disposition rates measure the number of
resolved cases compared to the number of filed, reopened, or cases pending at the beginning of the
year. Thus, the disposition rate can exceed 100%, which would indicate that the court caught up with
any backlog in cases over the year. They provide details describing the number of cases by offense and
other categories for each jurisdiction, at both the district and magistrate levels. They also report the
number of cases that are pending for up to six months, over six months, and that are inactive due to a
bench warrant. We tracked all cases from the date they were opened or booked to their disposition.
Thus, our methodology differs from the AOC.
For district court cases, especially those that began in magistrate court, we found that using the filing
date underestimates the amount of time that individuals spend in the criminal justice system. While the
district court clearly cannot be held accountable for the time it takes for the case to be bound over, it is
important to understand how much time people really spend awaiting disposition. This delay between
magistrate and district court case filing can be substantial for some people.
While the ideal scenario would be to use the date that is first (booking or filing), we understand that
may not be feasible at this time. The most notable difference in total time in the system is for cases that
are bound over from the magistrate court. In order to create a more representative measure of time
from the origination of a case to its disposition, we suggest that the filing date from the magistrate court
case be used if the case is bound over to district court. At the same time, it is important to understand
whether court processing times are changing, and if so, at what point. In addition to the overall time to
adjudication from first court case filing, it is important to continue monitoring time to disposition by
court venue.
Besides assessing whether the filing date is the best measure of performance, we also wanted to
understand time to disposition because of its potential impact on pretrial detention. In 2014, the New
Mexico Supreme Court passed a rule which governs how quickly cases must be processed. It was passed
in order to ameliorate the problems of overcrowding at the Bernalillo County Metropolitan Detention
Center, and applies only to Bernalillo County. One of the problems this rule is meant to address is time
to disposition. Here, we found the median time to disposition from the filing date for district-level cases

58
was 235 days, or just under eight months. Moreover, we found that for many cases, this does not
capture actual time in the system. The majority of district-level cases we found were bound over from
the magistrate court. Thus, the actual time in the system for these cases is about 35 days longer with
time in magistrate court taken into consideration. However, the mean number of days for the
magistrate portion is 109 days. This indicates that for some people, the time it takes for the case to be
disposed in magistrate court is actually much longer.
Further, though most people were not detained pretrial, some were detained for a long period of time.
Moreover, there was an association between pretrial detention and the time to disposition. While the
cases of those detained the entire pretrial period were more likely to be disposed of more quickly, the
longer a defendant was detained, the longer the time to adjudication. These results indicate that delays
in case processing result in longer pretrial detention for some individuals. This could be due to the
severity and complexity of these cases. Though we did control for offense degree and type, the
inclusion of other variables such as number of charges may reflect case complexity more completely.
We sought to understand which, if any, legal and extralegal factors predict pretrial detention decision-
making and the length of pretrial detention. The results indicate that judges do take into account, and
heavily weigh, legal variables when making decisions about pretrial detention. In particular, the severity
of the current offense was a consistent predictor of both whether someone was detained and for how
long. Further, the number of prior arrests was a significant and consistent predictor of these outcomes.
However, even after controlling for these factors in multivariate models, demographic characteristics
such as age, gender, and race still play some role in both pretrial detention and the length of pretrial
detention, though these were not consistent predictors in every model.
Concerns about ensuring appropriate bond amounts are at the forefront in New Mexico currently.
While this study focused on pretrial detention, we did consider the role the amount of bond required
plays in pretrial detention. We found that even after other variables are considered including criminal
history and prior failure to appear, a larger bond predicts longer detention. However, it is possible that
judges order larger bonds in cases where the initial evidence suggests that the person is guilty of a
serious offense. Further research is required to delve into this relationship.
We also examined failure rates among those released pretrial. We found more than one-third of those
whose cases were heard in district court ultimately failed in some way, either by committing a new
offense or by failing to appear.
Together, these findings suggest that the use of a pretrial risk assessment may help. A risk assessment
could minimize the influence of extralegal variables in pretrial decision making. Further, it could help
identify those who are unlikely to comply with pretrial conditions, particularly for those facing more
serious charges. Moreover, it may reduce the amount of time individuals spend detained pretrial,
particularly among those where the time to disposition is above average.
If a pretrial risk needs assessment were adopted, it would be important to evaluate whether the
instrument improves pretrial detention decision-making. One way to do that would be to track

59
measures of compliance (e.g., new arrests and failure to appear at court) both before the instrument
was adopted and afterwards. To our knowledge, these measures are not being tracked currently.
The influence of pretrial detention on conviction is an important one. The length of pretrial detention
significantly increased the odds of conviction. However, this does not necessarily mean that those who
are detained longer will be convicted unfairly. Instead, there may be other factors at play that we were
not able to measure. For example, it is possible that those who are detained for a longer period of time
are more likely to be guilty or there is a stronger case against them. Indeed, one of the guidelines for
judges when determining whether to detain someone is to consider the likelihood that they are guilty.
It could be, though, that those detained for a longer pretrial period are more likely to appear guilty and
are therefore convicted. Unfortunately, we cannot determine the guilt or innocence of the individual,
only whether they are detained.
Finally, while the focus of this study was on the influence of pretrial detention, it is important to point
out that demographic characteristics were significantly related to many of the outcomes we examined,
including the likelihood of detention, the length of detention, time to adjudication, and the likelihood of
conviction. In particular, the odds of conviction were significantly higher for younger people and males
in all models. It is important to consider that these were significant even after legal variables were
included. This suggests that there may be differential treatment of individuals based on their
demographic characteristics, further demonstrating the need for an objective method to assess pretrial
risk.
Study limitations and future research As with any research study, there were limitations associated with this study that should be considered
when interpreting the results. One of the objectives of this study was to determine the rate at which
prosecutors accept cases among those booked. Due to limitations matching court cases with bookings,
as well as the study bounds (i.e., following cases within jurisdictions only) particularly among cases that
involved only misdemeanors, we were unable to provide these rates with confidence. While this
measure reflects decision-making by the prosecutor, it also is a measure of police performance. One
way to improve on this measure would be to track only felony-level cases throughout all counties in
New Mexico. If municipal court data were available, misdemeanor cases could also be included. If the
state were interested in calculating this measure, one way to accurately assess it would be to ensure
each detention center record the court case number(s) related to the booking. Ideally, the case
numbers would be formatted to correspond to that used by the AOC.
It is likely that the time detained pretrial is underestimated for some people. We calculated pretrial
detention based on the time spent within a single facility for a single consecutive period of time.
Therefore, any time that people spent in other facilities during the pretrial period would not be
included. While we did observe movement from one detention center to another with the data we
received, we chose not to track people across detention centers since we did not have all detention
centers across the state. Second, some people were booked, released, and rebooked on a different day.
We did not include that time detained unless the booking dates were successive. We did not include
this because there were too many cases to determine whether subsequent bookings were related to the

60
booking included in our sample. Further, the booking data included a two-year period; some people
could have been booked after the data were pulled.
While we attempted to include variables that are likely to be related to the outcomes of interest, it is
likely that important variables were not included. One of the variables that is likely to be associated
with pretrial detention as well as case outcomes is assessed level of risk. However, New Mexico does
not currently administer Risk Needs Assessments to individuals pretrial. Although we have included
variables such as prior offenses that are likely associated with risk, we cannot differentiate between
those who are low, medium, or high risk. This is important as studies (e.g.,Subramian et al) indicate that
the impact of detention on low-risk individuals exacerbates negative outcomes, but whether this is also
true for medium to high-risk detainees is unknown. Future studies should include risk and its interaction
with pretrial detention as a factor in assessing case outcomes.
Although most detention centers provided us with information about bond, we did not receive the
amount of bond from all counties. Further, in some cases, it was not clear that the amount of bond
required was actually associated with that particular booking. Future studies should explore the impact
of bond on case outcomes and pretrial detention in greater depth.
Finally, an important predictor of pretrial detention, time to disposition, and conviction may be the
complexity of the court case. Future research should explore ways to quantify this and include it in the
analyses.
It is important to recognize that there are likely some errors in the data. As noted at the beginning of
the report, each county gathers and records race and ethnicity differently. Some counties ask the
detainee their race and ethnicity at the time of booking, thus, the race/ethnicity recorded for these
counties is self-reported. However, others rely on the perceptions of the booking agent. Two counties
do not record ethnicity at all.
While we did gather FTA information from the DPS arrest data, this measure is limited in two ways.
First, we could not tie the FTA to the court case associated with the booking. Second, it is likely that we
did not capture all of the FTAs that occurred in all of the court cases. In order to do so, we would have
to have the entire event history for each case.
This study was unique in that we were able to analyze data for a very large number of bookings.
However, given some of the limitations listed previously, future research should follow a smaller group
of people both within and across all detention centers to calculate their true pretrial detention time. In
addition, using a subsample, researchers could manually search for cases that may be related to
bookings that we did not find, search court event history to gather information about FTAs in that case,
as well as the amount of bail ordered. This would allow us to confirm the findings here.

61
References
Came, S.M. (2015). The Importance of Information Sharing for Justice Reform. Retrieved from:
http://www.search.org/files/pdf/TheImportanceofInformationSharingforJusticeReform.pdf
Freeman, L. (2012). Length of Stay in Detention Facilities: A Profile of Seven New Mexico Counties. New
Mexico Sentencing Commission. Retrieved from: http://nmsc.unm.edu/reports/2012/final-
update-length-of-stay.pdf
Green, B. A. (2011). Criminal Justice–What’s Ahead? Roadblocks and New Directions. Criminal
Justice, 25, 4.
Guerin, P. (2013). Bernalillo County Metropolitan Detention Center: Analysis of the Jail Population.
Retrieved from: http://isr.unm.edu/reports/2013/bernalillo-county-metropolitan-detention-
center-analysis-of-the-jail-population---briefing-note.pdf
Kalmanoff, A. & Delarosa, J. (2014). A call for the truth: Findings and recommendations on ending the jail crowding and ensuing lawsuit in Bernalillo County, New Mexico. Institute for Law and Policy Planning.
Laura and John Arnold Foundation. (2013). Pretrial Criminal Justice Research. Retrieved from:
http://www.arnoldfoundation.org/category/resources/?tag=the-front-end-of-the-criminal-justice-system,public-safety-assessment
LaVigne, N., Bieler, S., Cramer, L., Ho, H., Kotonias, C., Mayer, D., & Samuels, J. (2014). Justice
reinvestment initiative state assessment report.Washington, DC: Urban Institute. Lowenkamp, C. T., VanNostrand, M., & Holsinger, A. (2013). The hidden costs of pretrial
detention. Laura and John Arnold Foundation. Retrieved from: http://www.arnoldfoundation.org/wpcontent/uploads/2014/02/LJAF_Report_hidden-costs_FNL.pdf
New Mexico Administrative Office of the Courts & UNM School of Law Judicial Education Center. (2014).
New Mexico Magistrate Court Criminal Procedures Manual. Retrieved from: http://jec.unm.edu/manuals-resources/manuals/Website%20PDF%20-%20Crim%20Pro%20Manual%202014.pdf
New Mexico Sentencing Commission. (2017). New Mexico Prison Population Forecast: FY 2017- FY 2026.
Retrieved from: http://nmsc.unm.edu/reports/2016/new-mexico-prison-population-forecast-fy2017-fy2026.pdf
Ostrom, B. J., & Hanson, R. A. (1999). Efficiency, timeliness, and quality: A new perspective from nine
state criminal trial courts. Williamsburg, VA: National Center for State Courts.

62
Pretrial Justice Institute. (2014). Implementing the recommendations of the national symposium of
pretrial justice: The 2013 progress report. Retrieved from:
http://www.pretrial.org/download/infostop/Implementing%20the%20Recommendations%20of
%20the%20National%20Symposium%20on%20Pretrial%20Justice-
%20The%202013%20Progress%20Report.pdf
Sacks, M. & Ackerman, A.R., (2012). Bail and Sentencing: Does Pretrial Detention Lead to Harsher Punishment? Criminal Justice Policy Review, 25(1), 59-77.
Steelman, D.C., Griller, G.M., Farina, J.P., & Macoubrie, J. (2009). Felony Caseflow Management in
Bernalillo County, New Mexico. National Center for State Courts Subramanian, R., Delaney, R., Roberts, S., Fishman, N., & McGarry, P. (2015). Incarceration’s Front Door:
The Misuse of Jail in America. New York, New York: Vera Institute of Justice.

63
Appendices
List of Appendices
Appendix A. Map of New Mexico judicial districts
Appendix B. Description of all detainees and sample detainees
Appendix C. Time between booking and offense by court venue
Appendix D. Time between booking and filing by county
Appendix E: Days detained using point in time versus longitudinal data
Appendix F. Detention results with and without Colfax and Sandoval Counties
Appendix G. Pretrial detention and bond
Appendix H. Characteristics by adjudication and conviction status
Appendix I. Adjudication logistic regression models

64
Appendix A. Map of New Mexico judicial districts

65
Appendix B. Description of all detainees and sample detainees
Table B.1 Characteristics of Detainees
All detainees (by booking)
All detainees (by person)
Detainees with new charges
Detainees found in court
Age
Mean (s.d.) Median
33.26 (10.94) 31.00
33.68 (11.40) 31.00
33.93 (11.58) 31.00
34.10 (11.71) 32.00
N 80,379 48,643 32,320 17,930
Race
Asian/Pacific Islander 0.2% 0.3%
Black 3.1% 3.3%
Native American 19.0% 18.8% 22.1% 17.3%
Hispanic 39.5% 37.7% 34.5% 37.8%
White 37.4% 38.9% 39.3% 41.2%
Other 0.2% 0.2% 4.1% 3.7%
Unknown 0.5% 0.8% 0.0% 0.0%
N 80,470 48,643 32,357 17,930
Gender
Male 75.6% 74.4% 74.0% 75.5%
Female 24.4% 25.6% 26.0% 24.5%
N 80,466 48,639 32,357 17,930
Table B.2 County Detention Center of Detainees
All detainees
Detainees with new charges
Detainees found in
court
% found (charges filed in
this county for this case)
% of felony
bookings found
Chaves 11.5% 10.8% 9.5% 48.8% 81.4%
Colfax 2.0% 2.5% 2.5% 54.5% 64.1%
Doña Ana 13.2% 10.3% 15.3% 82.7% 90.2%
Luna 3.9% 2.8% 3.6% 71.1% 88.7%
McKinley 12.5% 14.7% 15.7% 59.1% 80.1%
Otero 8.0% 5.6% 7.8% 77.3% 91.4%
Sandoval 15.6% 21.0% 14.4% 37.9% 50.1%
Santa Fe 24.0% 19.8% 18.1% 50.7% 71.7%
Valencia 9.3% 12.5% 13.1% 58.1% 85.6%
N 80,470 32,357 17,930 17,930 6,041

66
Table B.3 Current Offense of Detainees
All detainees (N=80,470)
Detainees with new charges
(N=32,357)
Detainees found in court
(N=17,930)
Current offense (booking or arrest charges)
Violent 13.9% 22.5% 31.1%
Property 10.0% 14.0% 13.3%
Drug 6.8% 8.5% 9.6%
DWI 10.3% 19.4% 22.5%
Other 1.7% 2.1% 1.2%
Public order 32.8% 24.1% 16.9%
Probation violation only 4.5% 0.3% 0.0%
Warrant-charge unknown 7.8% 4.8% 2.6%
Serving sentence 2.3% 0% 0%
Unknown 10.0% 4.4% 2.7%
Offense severity
Felony 18.9% 25.9% 33.7%
Misdemeanor 54.4% 62.4% 59.2%
Unknown or N/A 26.7% 11.7% 7.1%
Table B.4 Prior Offense History of Detainees All detainees
Detainees with new charges
Detainees found in court
Prior criminal history
Prior arrests 23.6% 58.5% 58.3%
N 80,470 32,357 17,930
Number prior arrests Mean (std. dev) Median N
4.15 (4.10) 3.00 18,967
4.15 (4.10) 3.00 18,936
4.06 (4.02) 3.00 10,448

67
Appendix C. Time between booking and offense by court venue Table C.1: Time Between Booking and Offense
Closest Offense Date
Earliest Offense Date
Latest Offense Date
District Cases Only
Mean (Std. deviation)
210.0265 (370.4605)
233.4700 (402.8290)
210.0300 (370.4600)
Median 14 22 14
N 453 453 453
Magistrate Cases Only
Mean (Std. deviation)
18.8275 (91.9829)
20.5400 (122.3170)
18.8800 (92.1020)
Median 0 0 0
N 13,742 13,742 13,742
Both District and Magistrate
Mean (Std. deviation)
34.4466 (153.3449)
47.9600 (251.1200)
36.3900 (159.4090)
Median 0 0 0
N 3,717 3,717 3,717
Total Mean (Std. deviation)
27.3920 (127.0400)
31.6100 (172.7330)
27.3600 (127.1710)
Median 0 0 0
N 17,912 17,912 17,912
Table C.2: Time Between Booking and Offense by County
Mean (Std. Deviation) Median N
Chaves 36.6759 (156.6663) 0 1,697
Colfax 28.2295 (78.6478) 0 440
Doña Ana 13.7695 (80.9277) 0 2,742
Luna 37.2942 (267.5690) 0 639
McKinley 27.0284 (118.4035) 0 2,814
Otero 25.7455 (120.8531) 0 1,403
Sandoval 33.5545 (134.0336) 0 2,577
Santa Fe 13.1263 (87.1070) 0 3,245
Valencia 47.4947 (142.5882) 0 2,355
Total 27.3192 (127.0400) 0 17,912

68
Appendix D. Time between booking and filing by county
Table D.1: Timing of Booking Relative to Filing
Booking date prior to first filing date
Booking same as first filing date
Booked after first filing date
Total N
N % N % N %
Chaves 1,089 63.9% 252 14.80% 362 21.30% 1,703
Colfax 307 69.50% 39 8.8% 96 21.70% 442
Doña Ana 1,903 69.30% 602 21.90% 240 8.70% 2,745
Luna 417 65.10% 146 22.80% 78 12.20% 641
McKinley 2,230 79.20% 319 11.30% 266 9.40% 2,815
Otero 1,028 73.20% 226 16.10% 151 10.70% 1,405
Sandoval 1,763 68.40% 461 17.90% 354 13.70% 2,578
Santa Fe 2,383 73.40% 623 19.20% 240 7.40% 3,246
Valencia 1,710 72.60% 191 8.10% 454 19.30% 2,355
N (total) 12,830 71.60% 2,859 15.90% 2,241 12.50% 17,930
Table D.2: Time from Booking to Filing by County
Booking date prior to filing date Booked after case filing
N Mean Standard deviation
Median N Mean Standard deviation
Median
Chaves 1,089 4.11 17.11 2.00 362 60.67 125.22 15.00
Colfax 307 9.13 24.13 3.00 96 95.49 142.37 27.50
Doña Ana 1,903 3.43 9.75 2.00 240 34.97 61.31 10.00
Luna 417 2.47 4.53 2.00 78 90.26 159.18 19.50
McKinley 2,230 3.90 16.59 1.00 266 222.59 210.33 160.00
Otero 1,028 2.68 7.51 2.00 151 58.22 100.06 14.00
Sandoval 1,763 3.50 16.33 1.00 354 171.10 170.92 106.00
Santa Fe 2,383 2.35 8.04 1.00 240 70.97 115.94 28.00
Valencia 1,710 5.15 15.63 3.00 454 194.91 188.48 145.50
N (total) 12,830 3.65 13.73 2.00 2,241 125.24 168.74 57.00

69
Appendix E: Days detained using point in time versus longitudinal data As noted in Chapter IV, we used longitudinal data rather than a snapshot to determine pretrial
detention. Some stakeholders in New Mexico are familiar with the New Mexico Sentencing
Commissions studies of length of stay in detention centers (2005 and 2012). They reported a median
length of stay of 112 days in 2005 and 147 days in 2012 for those charged with a felony. Our reported
number of days detained appears quite low by comparison. The difference is due to the methodology
used.
Most people are released within a relatively short time. Using the chart in Chapter IV, we zoomed in on
the first 20 days (below). As can be seen there, most people are released within a week or so. Indeed,
77% of individuals booked between 2012 and 2013 were released within one week; 89% were released
within 20 days.
Figure E.1 Percentage of detainees released within 20 days
To illustrate the difference in the results when using a point in time method relative to a longitudinal
study, we also calculated the median number of days individuals were detained among those in a
detention center on 6/30/13. Among those arrested for a new offense and for whom we found a
corresponding court case (and therefore could determine what portion of their detention was spent
pretrial), and who were in the facilities on 6/30/13, the median number of days detained was 65. For a
felony, the median number of days was 156. This is somewhat longer than the number of days Freeman
(2012) reported for felony offenders: 147 days. Further, it is much longer than the median number of
days detained when we include everyone booked for a new offense between 2012 and 2013. Overall,
detainees spent a median of 1 day detained, and 4 days among those charged with a felony.
Table E.1 Median days detained among those detained on 6/30/13
Median # days detained N
Overall 65 341 Felony 156 249 Misdemeanor 26 91
0
20
40
1 2 3 4 5 6 7 8 9 101112131415161718192021
% of detainees released by number of days detained
(up to 20)

70
However, these results are not directly comparable to NMSC’s data because our sample is different.
First, we are only looking at those with new charges. Second, these data do not necessarily include
everyone who was detained on June 30, 2013. The detention centers provided data for everyone
booked in 2012 or 2013. Thus, if someone were booked in 2011 and was in the facility on 6/30/13, that
person’s information would not be included. Therefore, the median for 2013 is likely underestimated.

71
Appendix F. Detention results with and without Colfax and Sandoval counties
Table F.1 Demographic Characteristics by Detention Status
Detainees found in court
Booked and released
Detained one or more days
Average time detained
All counties
Without Sandoval and Colfax
All counties
Without Sandoval and Colfax
All counties
Without Sandoval and Colfax
All counties
Without Sandoval and Colfax
Native American
17.3% 17.6% 9.7% 9.2% 21.1%*** 22.1% 10.35 (38.02)***
10.85 (40.42)
Hispanic 37.8% 45.0% 42.2% 48.0% 35.7% 43.4% 13.40 (56.97)
13.49 (57.08)
White 41.2% 33.8% 44.6% 39.2% 39.5% 31.0% 14.32 (57.36)
15.51 (61.31)
Other 3.7% 3.5% 3.6% 3.6% 3.8% 3.5% 18.89 (76.11)
20.75 (84.44)
N 17,930 14,910 5,907 5,159 12,023 9.751 17,930 14,910

72
Table F.2 Logistic Regression Results: Detained or Not Final model all
counties Final model without Sandoval and Colfax
Demographics only
Age 1.009*** 1.011***
Race (white omitted)
Hispanic 0.943 1.134**
Native American 3.404*** 4.132***
Other 1.102 1.111
Gender (female omitted)
Male 1.156*** 1.144**
Current offense
Current offense (Violent omitted)
Property 1.088 1.043
Drug 0.650*** 0.643***
DWI 0.463*** 0.445***
Public order 0.474*** 0.438***
Other 0.448*** 0.465***
Degree (Misdemeanor omitted)
Felony 2.896*** 2.899***
Prior offense Number prior felony arrests 1.135*** 1.122***
Prior violent offense (no omitted)
1.319*** 1.312***
Prior FTA (no omitted) 1.259*** 1.266***
Model summary
Constant 1.037 0.842
N 17,925 14,908
-2LL model 1 (df) 20108.23 (14)*** 16898.25 (14)
Cox & Snell R square .136 .145
Nagelkerke R Square .189 .200
% correct 71.2% 70.6%
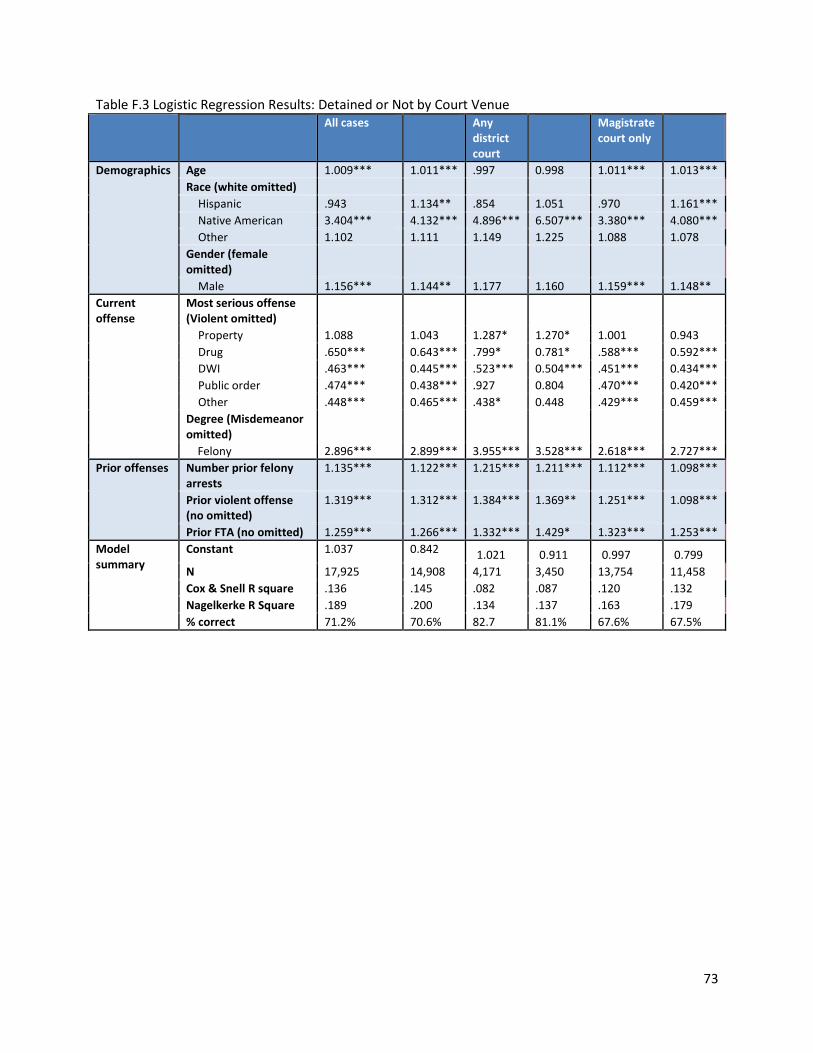
73
Table F.3 Logistic Regression Results: Detained or Not by Court Venue All cases Any
district court
Magistrate court only
Demographics Age 1.009*** 1.011*** .997 0.998 1.011*** 1.013***
Race (white omitted)
Hispanic .943 1.134** .854 1.051 .970 1.161***
Native American 3.404*** 4.132*** 4.896*** 6.507*** 3.380*** 4.080***
Other 1.102 1.111 1.149 1.225 1.088 1.078
Gender (female omitted)
Male 1.156*** 1.144** 1.177 1.160 1.159*** 1.148**
Current offense
Most serious offense (Violent omitted)
Property 1.088 1.043 1.287* 1.270* 1.001 0.943
Drug .650*** 0.643*** .799* 0.781* .588*** 0.592***
DWI .463*** 0.445*** .523*** 0.504*** .451*** 0.434***
Public order .474*** 0.438*** .927 0.804 .470*** 0.420***
Other .448*** 0.465*** .438* 0.448 .429*** 0.459***
Degree (Misdemeanor omitted)
Felony 2.896*** 2.899*** 3.955*** 3.528*** 2.618*** 2.727***
Prior offenses Number prior felony arrests
1.135*** 1.122*** 1.215*** 1.211*** 1.112*** 1.098***
Prior violent offense (no omitted)
1.319*** 1.312*** 1.384*** 1.369** 1.251*** 1.098***
Prior FTA (no omitted) 1.259*** 1.266*** 1.332*** 1.429* 1.323*** 1.253***
Model summary
Constant 1.037 0.842 1.021 0.911 0.997 0.799
N 17,925 14,908 4,171 3,450 13,754 11,458
Cox & Snell R square .136 .145 .082 .087 .120 .132
Nagelkerke R Square .189 .200 .134 .137 .163 .179
% correct 71.2% 70.6% 82.7 81.1% 67.6% 67.5%

74
Appendix G. Pretrial detention and bond
Table G.1 Logistic Regression Results of Pretrial Detention and Bond Model 1 Model 2 Model 3 Model 4
Demographics Age 1.005*** 1.012*** 1.012*** 1.012***
Race (white omitted)
Hispanic 1.007 1.026 .977 1.001
Native American 3.111*** 4.459*** 4.273*** 4.333***
Other 1.258* 1.159 1.157 1.163
Gender (female omitted)
Male 1.179*** 1.239*** 1.174*** 1.176***
Current offense
Most serious offense (violent omitted)
Property 1.095 1.0445 1.052
Drug .645*** .641*** .645***
DWI .457*** .488*** .489***
Public order .427*** .416*** .418***
Other .425*** .427*** .430***
Degree (misdemeanor omitted)
Felony 3.147*** 3.114*** 3.073***
Prior offenses Number prior felony arrests
1.102*** 1.057***
Prior violent offense (no omitted)
1.257*** 1.276***
Prior FTA (no omitted) 1.394*** 1.432***
Bond amount Minimum bond amount
1.00
Model Summary
Constant 1.082 .815 .741 .725
N 12,908 12,908 12,908 12,908
-2LL (df) 16361.407 (5) 14849.573 (6) 14712.852(14) 147019.58(15)
Cox & Snell R square .038 .144 .153 .153
Nagelkerke R Square .052 .198 .210 .210
% correct 64.1% 70.5% 70.7% 70.7%
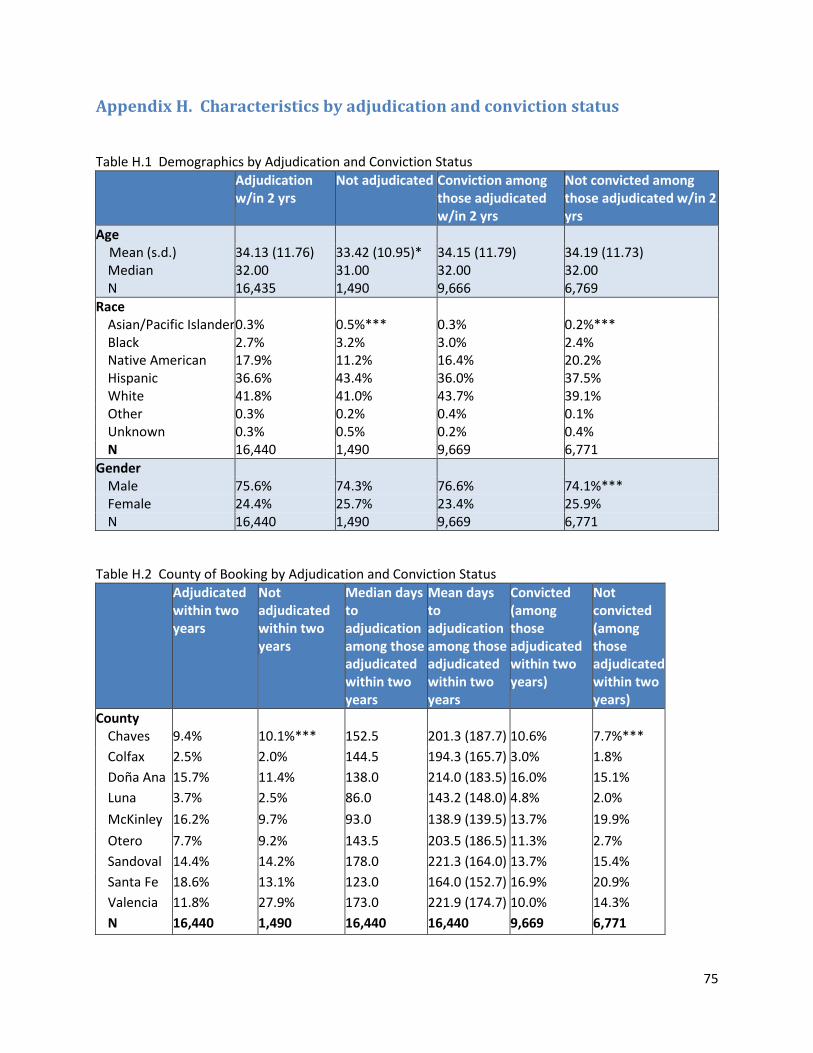
75
Appendix H. Characteristics by adjudication and conviction status
Table H.1 Demographics by Adjudication and Conviction Status
Adjudication w/in 2 yrs
Not adjudicated Conviction among those adjudicated w/in 2 yrs
Not convicted among those adjudicated w/in 2 yrs
Age Mean (s.d.)
Median 34.13 (11.76) 32.00
33.42 (10.95)* 31.00
34.15 (11.79) 32.00
34.19 (11.73) 32.00
N 16,435 1,490 9,666 6,769
Race Asian/Pacific Islander 0.3% 0.5%*** 0.3% 0.2%*** Black 2.7% 3.2% 3.0% 2.4% Native American 17.9% 11.2% 16.4% 20.2% Hispanic 36.6% 43.4% 36.0% 37.5% White 41.8% 41.0% 43.7% 39.1% Other 0.3% 0.2% 0.4% 0.1% Unknown 0.3% 0.5% 0.2% 0.4% N 16,440 1,490 9,669 6,771
Gender Male 75.6% 74.3% 76.6% 74.1%*** Female 24.4% 25.7% 23.4% 25.9% N 16,440 1,490 9,669 6,771
Table H.2 County of Booking by Adjudication and Conviction Status
Adjudicated within two years
Not adjudicated within two years
Median days to adjudication among those adjudicated within two years
Mean days to adjudication among those adjudicated within two years
Convicted (among those adjudicated within two years)
Not convicted (among those adjudicated within two years)
County Chaves 9.4% 10.1%*** 152.5 201.3 (187.7) 10.6% 7.7%***
Colfax 2.5% 2.0% 144.5 194.3 (165.7) 3.0% 1.8%
Doña Ana 15.7% 11.4% 138.0 214.0 (183.5) 16.0% 15.1%
Luna 3.7% 2.5% 86.0 143.2 (148.0) 4.8% 2.0%
McKinley 16.2% 9.7% 93.0 138.9 (139.5) 13.7% 19.9%
Otero 7.7% 9.2% 143.5 203.5 (186.5) 11.3% 2.7%
Sandoval 14.4% 14.2% 178.0 221.3 (164.0) 13.7% 15.4%
Santa Fe 18.6% 13.1% 123.0 164.0 (152.7) 16.9% 20.9%
Valencia 11.8% 27.9% 173.0 221.9 (174.7) 10.0% 14.3%
N 16,440 1,490 16,440 16,440 9,669 6,771

76
Table H.3 Current Offense by Adjudication and Conviction status
Adjudication within two years
Not adjudicated
Conviction among those adjudicated
Not convicted among those adjudicated
Current offense (Detention center or DPS) Violent 31.2% 30.1%*** 26.1% 38.5%*** Property 12.7% 20.5% 13.8% 11.2% Drug 9.2% 14.4% 10.2% 7.8% DWI 23.2% 14.3% 30.9% 12.3% Other 1.3% 0.9% 1.3% 1.3% Public order 17.5% 10.8% 13.6% 23.1% Probation violation only 0.0% 0.0% 0.0% 0.0% Warrant-charge unknown 2.3% 5.7% 2.0% 2.6% Unknown 2.6% 3.3% 2.1% 3.3% N 16,440 1,490 9,669 6,771
Offense severity Felony 32.2% 50.7%*** 35.0% 28.1%*** Misdemeanor 61.0% 38.4% 59.0% 64.0% Unknown or N/A 6.8% 10.9% 6.0% 7.9% N 16,440 1,490 9,669 6,771
Current offense (court) Violent 31.9% 31.5%*** 26.5% 39.5%*** Property 13.1% 19.6% 14.3% 11.4% Drug 9.7% 14.4% 10.5% 8.4% DWI 23.4% 14.8% 31.2% 12.4% Other 3.5% 1.8% 3.3% 3.8% Public order 17.1% 8.5% 13.2% 22.8% Unknown 1.2% 9.3% 1.0% 1.6% N 16,440 1,490 9,669 6,771
Offense severity Felony 34.3% 62.6%*** 37.7% 29.5%*** Misdemeanor 65.3% 33.8% 61.9% 70.3% Unknown or N/A 0.3% 3.6% 0.4% 0.2% N 16,440 1,490 9,669 6,771

77
Table H.4 Criminal History by Adjudication and Conviction Status
Adjudication within two years
Not adjudicated
Conviction among those adjudicated
Not convicted among those adjudicated
Prior criminal history Prior arrests N
58.4% 16,440
56.8% 1,490
57.7% 9,669
59.5% * 6,771
Number prior arrests Mean (std. dev) Median N
2.36 (3.67) 1.00 16,440
2.32 (3.62) 1.00 1,490
2.43 (3.58) 1.0 9,669
2.31 (3.60)* 1.0 6,771
MSO priors Violent Property Drug DWI Other Public order PV N
38.9% 17.6% 9.7% 20.8% 3.8% 9.0% 0.2% 9,602
38.4%*** 23.9% 12.1% 13.9% 3.0% 8.5% 0.2% 846
37.6% 19.0% 10.1% 20.0% 3.8% 9.3% 0.2% 5,575
40.6%*** 15.8% 9.2% 21.9% 3.9% 8.5% 0.2% 4,027
Any prior FTA N
12.5% 16,440
10.1%** 1,490
12.0% 9,669
13.3%** 6,771
Table H.5 Bond and Length of Pretrial Detention by Adjudication and Conviction Status
Adjudication w/in 2 yrs
Not adjudicated
Conviction among those adjudicated w/in 2 yrs
Not convicted among those adjudicated w/in 2 yrs
Has bond 83.5% 82.0% 81.7% 82.3%
Average minimum bond amount Mean (std. dev)
$2,877.42 (47,816.66)
$6,053.43 (27,654.24)
$3,521.69 (60,800.13)
$1,877.81 (9853.85)
N 12,056 857 7,331 4,725
Length of pretrial detention Mean (std. dev.) Median N
11.73(41.15) 1.00 16,440
32.52 (128.21) 2.00 1,490
14.50(43.35) 1.00 9,669
7.77 (32.04)*** 1.00 6,771

78
Appendix I. Adjudication logistic regression models
Table I.1 Adjudication with All Cases Logistic Regression Models All cases Model 1 Model 2 Model 3 Model 4
Demographics Age 1.005* 1.001 1.001 1.001
Race (white omitted)
Hispanic 0.832** 0.801*** 0.788*** 0.784***
Native American 1.580*** 1.292** 1.244* 1.230*
Other 0.818 0.852 0.852 0.864
Gender (female omitted)
Male 1.079 1.086 1.060 1.086
Current offense Most serious offense (violent omitted)
Property 1.077 1.080 1.043
Drug 1.047 1.057 1.003
DWI 1.268** 1.316** 1.274**
Public order 1.668*** 1.686*** 1.628***
Other 1.706** 1.751** 1.675*
Degree (misdemeanor omitted)
Felony 0.369*** 0.367*** 0.390***
Prior offense Number prior felony arrests 0.944 1.004
Prior violent offense (no omitted) 1.208** 1.227**
Prior FTA (no omitted) 1.26* 1.237*
Pretrial detention
Pretrial detention days .998***
Model Summary Constant 8.872*** 14.797*** 14.161*** 14.321***
N 17,925 17,925 17,925 17,925
-2LL model (df) 10199.836(5) 9748.874(11) 9731.714(14) 9687.052(15)
Cox & Snell R square .004 .028 .029 0.032
Nagelkerke R Square .008 .065 .067 0.073
% correct 91.7% 91.7% 91.7% 91.8%

79
Table I.2 Adjudication with Magistrate Court Only Logistic Regression Models
Magistrate Model 1 Model 2 Model 3 Model 4
Demographics Age 1.004 1.007 1.007 1.007
Race (white omitted)
Hispanic 1.002 0.974 0.952 0.946
Native American 0.970 0.987 0.977 0.985
Other 0.792 0.809 0.799 0.800
Gender (female omitted)
Male 0.971 0.977 0.934 0.590
Current offense Most serious offense (violent omitted)
Property 4.035*** 4.044*** 4.020***
Drug 3.287*** 3.383*** 3.337***
DWI 1.608*** 1.705*** 1.679***
Public order 1.767*** 1.814*** 1.787***
Other 1.709* 1.744* 1.713*
Degree (misdemeanor omitted)
Felony 1.504*** 1.494*** 1.555***
Prior offense Number prior felony arrests 1.088 1.098
Prior violent offense (no omitted) 1.444** 1.461***
Prior FTA (no omitted) 0.764* 0.772
Pretrial detention
Pretrial detention days 0.944***
Model Summary Constant 19.797*** 11.511*** 10.938*** 11.126***
N 13,758 13,758 13,758 13,758
-2LL (df) 4879.707(5) 4786.714(11) 4765.634(14) 4753.953(15)
Cox & Snell R square .000 .007 .008 0.009
Nagelkerke R Square .001 .023 .028 0.031
% correct 95.7% 95.7% 95.7% 95.7%

80
Table I.3 Adjudication with District Court Only Logistic Regression Models District only Model 1 Model 2 Model 3 Model 4
Demographics Age 1.000 0.997 0.997 0.997
Race (white omitted)
Hispanic 0.639*** 0.634*** 0.622*** 0.622***
Native American 1.450* 1.338 1.257 1.253
Other 0.864 0.884 0.894 0.906
Gender (female omitted)
Male 1.223* 1.207* 1.179 1.201*
Current offense Most serious offense (violent omitted)
Property 1.000 0.998 0.967
Drug 1.054 1.062 1.017
DWI 1.717*** 1.771*** 1.694***
Public order 1.459 1.461 1.406
Other 1.874 2.006 1.902
Degree (misdemeanor omitted)
Felony 1.133 1.112 1.136
Prior offense Number prior felony arrests 1.002 1.007
Prior violent offense (no omitted) 1.165 1.172
Prior FTA (no omitted) 1.626*** 1.611***
Pretrial detention
Pretrial detention days 0.999**
Model Summary Constant 3.663*** 3.447*** 3.267*** 3.324***
N 4171 4171 4171 4171
-2LL (df) 4294.57(5) 4278.438(11) 4258.056(14) 4251.268(15)
Cox & Snell R square .012 .016 .021 0.022
Nagelkerke R Square .019 .025 .032 0.034
% correct 78.5% 78.5% 78.5% 78.5%