prevalence and factors related to overweight among urban
TRANSCRIPT

PREVALENCE AND FACTORS RELATED TO OVERWEIGHT AMONG
URBAN WOMEN (19-49 YEARS) IN SALEM, TAMIL NADU.
Dr.Aarthy.R
Dissertation submitted in partial fulfilment of the requirements
for the award of the degree of Master of the Public Health
Achutha Menon Centre for Health Science Studies
Sree Chitra Tirunal Institute for Medical Sciences and Technology
Thiruvananthapuram, Kerala
October 2010

ACKNOWLEDGEMENT
My first thanks to Dr.Manju Nair,who had been a constant
source of encouragement all through the process and to Dr.T.K.Sundari Ravindran
who had been guiding me in the final stages of this work.I am greatly indebted to both
of them for understanding me and encouraging me when I had been through bad
phases, while doing this project.
I sincerely thank the Director, Registrar and all the
members of Chitra family for their constant support and encouragement throughout
the course.A special thanks to Mr Sundar Jayasingh. S, the Assistant Registrar for his
help and support throughout the course.
I show my obligation to Dr. K. R. Thankappan, Dr. V.Raman
Kutty,Dr.Mala Ramanthan and all other faculty members of AMCHSS for their help,
support, encouragement and valuable inputs throughout the course.
I am greatly indebted to my family members who helped me at
various stages of my project,especially my wonderful parents and sister who
understood me and supported during stressful times of my project.
Special thanks to Mr.Shanmugham who helped me in
identifying the different wards in Salem for carrying my project.I am greatly indebted
to all my study participants who happily consented to participate and who made it
happen.Special thanks to Mrs.Selvi who took pains in helping me.
My thanks to Dr.Santosh Kumar who had helped me when I
needed the most,Dr.Sateesh Kumar who helped me during the analysis and Dr.Anshul
Avijeet for giving suggestion through the project.I owe my sincere gratitude to
Ms.Janani,who helped with a cheerful face during the final process of the thesis.
Last but not the least I owe my gratitude to my better-half,
Karthik who had been encouraging and supporting me through thick and thin times.

DECLARATION
I hereby declare that the work embodied in this dissertation entitled
“Prevalence and factors related to overweight among urban women (19-49 years) in
Salem, Tamil Nadu” is the result of original research and has not been
submitted for any degree in any other university or institution.
Dr. Aarthy.R
Achutha Menon Centre for Health Science Studies
Sree Chitra Tirunal Institute for Medical Sciences and Technology
Thiruvananthapuram


ABBREVIATIONS
BMI Body Mass Index
FRS Figure Rating Scale
GPAQ Global Physical Activity Questionnaire.
MET Metabolic Equivalent
NFHS National Family Health Survey
SPSS Statistical package for social sciences
WHO World Health Organisation
WC Waist Circumference

TABLE OF CONTENTS
LIST OF TABLES
LIST OF FIGURES
ABSTRACT
Chapter Page No.
1. INTRODUCTION AND REVIEW OF LITERATURE
1.1. Introduction............................................................................................................ ..1
1.2. Literature review
1.2.1. Emergence of obesity in the developing countries....................................3
1.2.2. Prevalence of overweight globally and in the Asia-Pacific region...........6
1.2.3. The prevalence of Waist Circumference globally and India.....................7
1.2.4. Classifying overweight and obesity..........................................................8
1.2.5. Factors related to obesity.........................................................................12
1.3. Rationale for the study...........................................................................................15
1.4. Objectives of the study..........................................................................................16
2. METHODOLOGY
2.1 Study design............................................................................................................17
2.2. Study setting...........................................................................................................17
2.3. Study frame………………………………………………………………………17
2.4. Sampling Method……………………………………………………………...…17
2.5. Sample size…………………………………………………………………….…17
2.6. Sample Selection………………………………………………………………...18
2.7. Study Participation........................................................................................... ......18
2.8. Data Collection Techniques...................................................................................19
2.9. Data Storage...........................................................................................................19
2.10. Data Analysis and Statistical Methods.................................................................19
2.11. Introducing the variables in the study
a.Dependent variables...........................................................................20
b.Independent variables.........................................................................20
2.12. Introducing special tools in the study
a. Figure rating Scale.............................................................................21
2.13. Operationalising variables....................................................................................23
2.14. Ethical considerations...........................................................................................27
3. RESULTS
3.1. Sample Characteristics
3.1.1. Baseline Characters of the Sample Population............................28
3.2. Prevalence of overweight/ abdominal obesity among study population................42

3.3. Analysis for factors associated with overweight
3.3.1. Bivariate analysis- for overweight as an independent variable...........................44
3.3.2. Bivariate analysis- for abdominal obesity as an independent variable..............50
3.4. Multivariate analysis (Binary logistic regression)..................................................54
4. DISCUSSION AND CONCLUSION
4.1. Discussion
4.1.1. Sample characteristics.............................................................................57
4.1.2.Prevalence of overweight:........................................................................58
4.1.3. Factors related to overweight..................................................................60
4.1.4.Factors related to abdominal obesity........................................................63
4.2. Strengths of the study:……………………………………………………………63
4.3. Limitations of the study……………………………………………………..……63
4.4. Conclusion and recommendations..........................................................................64
APPENDICES
APPENDIX I : INFORMED CONSENT
APPENDIX II : QUESTIONNAIRE
APPENDIX III : CALCULATION OF METS
APPENDIX IV: PAMPHLET

LIST OF TABLES
Table Page no
1.1. The WHO classification of weight based on BMI...................................................9
1.2. The WHO alternative BMI classification for Asian population.............................11
1.3. The classification for Waist Circumference...........................................................12
2.1. Metabolic Equivalents (METS) values……………………………………..........26
3.1. Socio-economic, demographic characteristics of the sample population...............29
3.2. Physical activity of the study population...............................................................32
3.3. Mean sedentary time and total physical activity per day ......................................33
3.4. Diet pattern among the study population...............................................................34
3.5. Dietary consumption of selected food items..........................................................35
3.6. Self perception of one‟s own weight..................................................................... 36
3.7. Body Image discrepancy Score (BID Score).........................................................39
3.8. Statements on perception related to overweight.....................................................40
3.9. Knowledge about adverse health effects of overweight.........................................41
3.10. Anthropometric measurements.............................................................................42
3.11. Classification of weight using BMI.....................................................................42
3.12. Prevalence of overweight ....................................................................................43

3.13. Prevalence of abdominal obesity .........................................................................43
3.14. Stratification of Waist circumference by age group.............................................43
3.15. Socio-economic and demographic factors...........................................................44
3.16. Association of physical activity with overweight:...............................................45
3.17. Association of diet with overweight....................................................................47
3.18. Perception related to overweight as a factor........................................................49
3.19. Socio-economic and demographic factors...........................................................50
3.20. Association of diet with abdominal obesity.........................................................52
3.21. Predictors of overweight: Multivariate analysis...................................................55
3.22. Predictors of abdominal obesity: Multivariate analysis.......................................56
LIST OF FIGURES
1.1. Emergence of obesity in the developing countries...................................................5
3.1. Where would the respondents match themselves in the picture?...........................37
3.2. Where would the respondents would like to be ideally?........................................38
3.3. Where would the respondents like to be in the forthcoming year?........................38
3.4.Where would the respondents would be if they regularly exercise and have proper
diet?...............................................................................................................................39

ABSTRACT
Background Obesity is increasing at an alarming rate throughout the world, it is declared
as a global problem. Though the overweight rates in India are low when compared to
western countries, the rate of overweight is steadily increasing. Hence it is necessary to
know about the levels of overweight in cities like Salem and to know about the factors
associated with it. Apart from socio-demographic factors, perception towards overweight
is also an important factor which determines overweight.
Objective To estimate the prevalence of overweight among women (19-49 years) and
to study the factors associated with overweight in Salem, Tamil Nadu.
Methodology A cross sectional survey on a sample of 540 subjects out of which 500
participated (response rate: 92.5 percent) using a pretested questionnaire with information
related to socio-economic details, physical activity, dietary patterns, perception and
knowledge related to overweight were recorded by interview schedule. Body mass Index
(BMI) and waist circumference (WC) were taken as the outcome variables. Univariate,
bivariate and logistic regression were done using SPSS version 15.0.
Results: The prevalence of overweight is 54 percent, while the obesity level is 21.6
percent and the prevalence of abdominal obesity is 67.4 percent. It was found that women
who think themselves to thinner than what they are (OR= 9.59, 95 percent confidence
interval 6.05-15.80), age more than 35 years of age (OR= 2.60, 1.61-4.19) and husband
being self employed (OR= 1.73,1.06-2.82) were factors significantly associated with
overweight status (Body Mass Index more than 25).Similarly women from higher
socioeconomic status (OR= 4.46,1.57-12.66),middle socioeconomic class (OR= 2.93,1.70-
5.05) and age more than 35 years (OR= 2.05,1.20-3.50) were factors significantly
associated with abdominal obesity(waist circumference more than 80 cms).
Conclusion The levels of overweight, obesity and abdominal obesity are high in the urban
setting of Salem. Though factors like age, occupation and socioeconomic status cannot be
altered, the perception towards overweight can be changed by early intervention so that
weight reduction may be easier.

CHAPTER-1
INTRODUCTION AND LITERATURE REVIEW
1.1. INTRODUCTION:
Obesity is increasing at an alarming rate throughout the world and has become a
global problem. The World Health Organisation (WHO) has declared overweight as one of
the top 10 health risks in the world and one of the top five in developed
nations(WHO,2002).1 According to estimates, there are more than one billion overweight
people worldwide, and some 250 million of these are estimated to be clinically
obese(WHO,1998).2
Once related to affluence, obesity is now growing fast in many
middle and low income countries. 3,4
In countries like India, where prevalence of under
nutrition is very high , a significant proportion of overweight and obese people now co-
exist with those who are under nourished.5
The problem of overweight and obesity are caused by a chronic imbalance
between energy intake and actual energy needs of the body. In the middle and low income
countries, with increasing urbanization, mechanization of jobs and transportation,
availability of processed and fast foods, and dependence on television for leisure, people
are fast adopting less physically active lifestyles and consuming more “energy-dense,
nutrient-poor” diets.3,6-10
Urbanization and modernization have made our lives more
sedentary and less physically active than before. Urbanization involves changes in
occupation patterns, life- styles, family structures and value systems. Such changes have
an impact on dietary practices and the levels of physical activity.

The causes for obesity are multi factorial. Poor diet and physical inactivity
cause overweight and obesity. The socioeconomic context in a larger part determines the
imbalance between food intake and energy expenditure. Although obesity is affected by
interaction between multiple genes and the environment, the genetic pool is not changing
rapidly but the environmental and social context that has changed and causes this
epidemic.11
Obesity is not an lethal disease in and of itself, but is a significant risk
factor associated with a range of serious non-communicable diseases and conditions.
Overweight/obesity is considered as an intermediate risk factor for major chronic disease
conditions including Heart disease, Cancer, Stroke, Chronic respiratory diseases and
diabetes.12
Eighty percent of deaths which occurs in the low and middle income
countries is due to chronic diseases and 70-80 percent of deaths in India and China are
due to chronic diseases.13
Deaths from infectious diseases, maternal and perinatal
conditions and nutritional deficiencies are likely to decline by 3 percent but the death due
to chronic disease are projected to increase by 17 percent in the coming next ten years
(WHO,2005).12
For all the governments, HIV/AIDS, Malaria and Tuberculosis remain the
main focus, whereas common conditions remain marginalized. Chronic diseases thus
remain as one of such neglected conditions.14
The problem of overweight remains unnoticed in our society. Only
recently the chronic disease epidemiology has gained pace in India. The government is
planning for an integrated national programme for the prevention and control and for
multi-sectoral policy intervention and enhance the engagement of the health systems in
activities related to chronic disease prevention and control.15
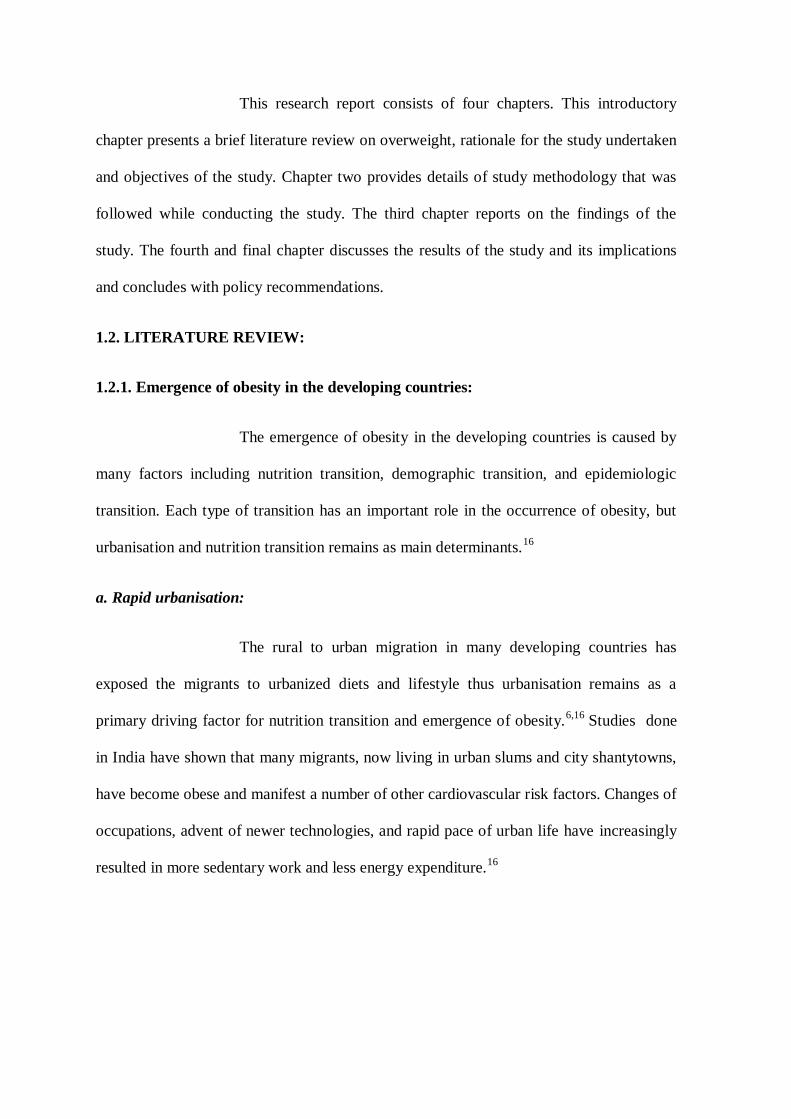
This research report consists of four chapters. This introductory
chapter presents a brief literature review on overweight, rationale for the study undertaken
and objectives of the study. Chapter two provides details of study methodology that was
followed while conducting the study. The third chapter reports on the findings of the
study. The fourth and final chapter discusses the results of the study and its implications
and concludes with policy recommendations.
1.2. LITERATURE REVIEW:
1.2.1. Emergence of obesity in the developing countries:
The emergence of obesity in the developing countries is caused by
many factors including nutrition transition, demographic transition, and epidemiologic
transition. Each type of transition has an important role in the occurrence of obesity, but
urbanisation and nutrition transition remains as main determinants.16
a. Rapid urbanisation:
The rural to urban migration in many developing countries has
exposed the migrants to urbanized diets and lifestyle thus urbanisation remains as a
primary driving factor for nutrition transition and emergence of obesity.6,16
Studies done
in India have shown that many migrants, now living in urban slums and city shantytowns,
have become obese and manifest a number of other cardiovascular risk factors. Changes of
occupations, advent of newer technologies, and rapid pace of urban life have increasingly
resulted in more sedentary work and less energy expenditure.16

b. Nutrition transition:
The pattern of nutrition transition has evolved from one stage to
another in many ethnic groups and disparate geographic locations in the developing
countries. The diet pattern is continuously changing along with human evolution. The
hunter-gatherer population‟s diets were rich in carbohydrates and fibre and low in fat,
especially saturated fat, with a high-activity profile and lean body phenotype. Later, when
individuals existed in famine-like situations later, the diet was comprised of a low calorie,
low protein and fat diets and had growth retardation and low body fat and fat-free mass.
During the later stages when famines decreased and when nutrition improved, the
consumption of fruits, vegetables and animal proteins, the physical inactivity increased.
This pattern is now seen in developed countries which is conducive for the development of
obesity. As economies improve people become more affluent and consume diets high in
saturated fats, cholesterol and refined carbohydrates and low polyunsaturated fatty acids
and fibre associated with sedentary life style. In India the intake of dairy products, sugar,
and hydrogenated vegetable oils is increasing.16
c. Epidemiologic transition
Epidemiologic transition includes transition from widely prevalent
infectious diseases to a pattern of high prevalence of chronic lifestyle related non-
communicable diseases.11
The various factors responsible for increasing NCDs include
rapid nutrition transition, rural-to-urban migration, increasingly sedentary occupations and
lifestyle. Though both genetic and environmental factors seem to contribute to it; however,
the role of environment seems to be predominant.16
This is explained in Figure.1

Figure.1.Emergence of obesity in the developing countries.
(Source: Adapted from Misra A, Khurana L. Obesity and the Metabolic Syndrome in
Developing Countries. J Clin Endocrinol Metab, November 2008, 93(11):S9–S30.)
Decrease in food scarcity
and famine, labour
intense work
Economic changes
including
urbanisation
Demographic changes
including rural-urban
migration
Improved food supply,
Increased food availability (longer shelf
life, 24-hour supermarkets),
Competitive prices of energy-dense foods
Increased intake of fat, salt and sugar
Dietary liberalization and „westernization‟
Rise of Obesity, the metabolic
syndrome and Non-communicable
diseases

1.2.2. Prevalence of overweight globally and in the Asia-Pacific region:
Obesity epidemic was first noted in the United States of America
and then crossed Europe and then spread to the developing countries.17, 18
The prevalence
rates for overweight and obesity varies across different region with the Middle East,
Central and Eastern Europe and North America having higher prevalence rates.19
Highest
obesity prevalence is found in Polynesia (76.8 percent) and Micronesia (70.3 percent).
Moderately high prevalence of obesity is found in Arab countries and other high income
nations of the world with a variable range of 24–50 percent.20
In 1998, it is found that there
was an increase in prevalence of obesity from 2.3 percent to 19.6 percent in several
developing countries.16
Higher prevalence of obesity and abdominal obesity has been seen
in women compared with men in many developing countries, consistent with the sedentary
lifestyle as discussed earlier. Women have higher rates of obesity whereas men have
higher rates of overweight (WHO, 2000)21
a. Asian and Pacific region:
In Asia-Pacific, there has been an increase in the prevalence of
overweight across the region (WHO, 1998).2 In China the incidence the overweight among
men is 10.8 percent and 16.1 percent among women. There is an increase of abdominal
obesity by 20 percent among the Indian men and women (IOTF, 2000).22
Even in low-
prevalence countries, the prevalence is significantly high (more than 20%) in urban
areas.16
b. The scenario in India and Tamil Nadu:
The prevalence of overweight among women in India is 14.8% and
among men is 12.1 percent according to the National Family Health Survey -3 (NFHS,

2005).24
This is an increase from the previous round of NFHS, which showed the rate of
overweight among ever married women to be 11 percent where 8.4 percent were
overweight and 2.3 percent were obese.25
The prevalence of overweight is high in the
states of Punjab, Kerala, Goa, Tamil Nadu and Andhra Pradesh for both men and women,
but the prevalence rate is higher among women when compared to men. Similarly the rate
of overweight is three times more in urban area (25.5 percent, NFHS, 2005) when
compared to rural area (7.98 percent, NFHS, 2005).
In 2002, a study done in Western India showed the presence of both
overweight and underweight in an urban area. 25
In 2009, a study in Gwalior showed, that
34.4 percent of males and 31.3 percent females (aged 30 years and above) to be
overweight. This study showed the increase in the prevalence of overweight more among
men which is different from other studies elsewhere mentioned.27
According to NFHS-3, (2005) the prevalence of overweight
in Tamil Nadu is 19.8 percent among men and 24.4 percent among women similar to all
India scenario where the rates are high among women when compared to men. The trend
is similar to Indian scenario where the prevalence is more among women and also the
urban more than the rural. A 2009 study done in Mecheri, a rural place in Salem District,
among 77 women aged 20 and above found 47 percent of overweight, the highest
prevalence so far in any Indian study.28
1.2.3. The prevalence of Waist Circumference globally and India:
Waist circumference data from 63 countries has shown highest
prevalence of abdominal obesity among South Asians when compared with North
Europeans and other Asian ethnic populations. Data from countries in sub-Saharan Africa,

South America, and the Middle East also showed similar high prevalence of abdominal
obesity: 67 percent of women and 18 percent of men in urban Cameroon, 43 percent in
Venezuela, and 24.6 percent in Oman. In an industrial population in India, 30.9 percent of
men and 32.8 percent of women were reported to have abdominal obesity.16
1.2.4. Classifying overweight and obesity
The classification of overweight and obesity helps us for a
meaningful comparison of weight status within and between populations and identifying
the individuals and groups at increased risk of morbidities and mortalities, which later
helps in setting priorities for intervention at the individual and community levels and helps
for further evaluation.21
1.2.4.1. Body Mass Index (BMI):
Body mass index (BMI) is a simple index of weight-for-height that
is commonly used in classifying overweight and obesity in adult populations and
individuals. It is defined as the weight in kilograms divided by the square of the height in
meters (kg/m2).2
BMI = weight (kg)/ (height metres) 2
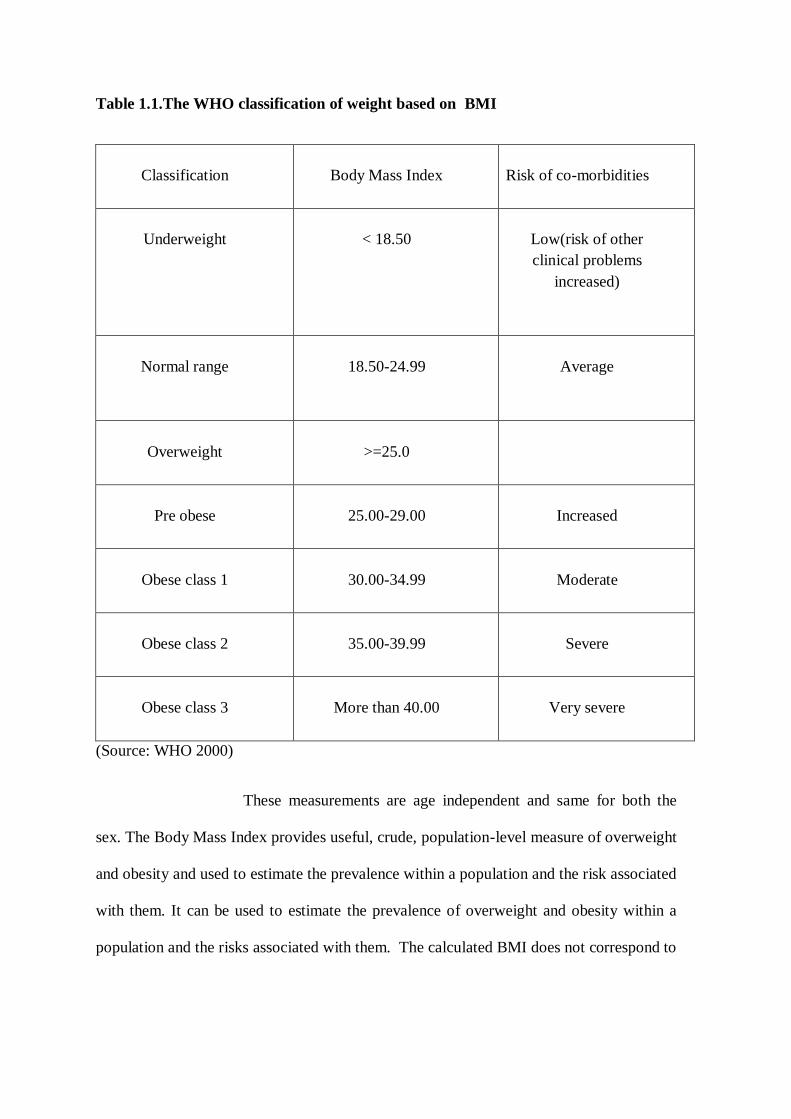
Table 1.1.The WHO classification of weight based on BMI
Classification
Body Mass Index
Risk of co-morbidities
Underweight
< 18.50
Low(risk of other
clinical problems
increased)
Normal range
18.50-24.99
Average
Overweight
>=25.0
Pre obese
25.00-29.00
Increased
Obese class 1
30.00-34.99
Moderate
Obese class 2
35.00-39.99
Severe
Obese class 3
More than 40.00
Very severe
(Source: WHO 2000)
These measurements are age independent and same for both the
sex. The Body Mass Index provides useful, crude, population-level measure of overweight
and obesity and used to estimate the prevalence within a population and the risk associated
with them. It can be used to estimate the prevalence of overweight and obesity within a
population and the risks associated with them. The calculated BMI does not correspond to

same degrees of fatness or associated health risk in individuals and populations and does
not account for wide variation in fat distribution.23
a. An alternative classification of Body Mass Index (BMI) for Asian population
In Asian subjects, the risk associated with diabetes and
cardiovascular diseases occurs at lower levels of BMI when compared with the white
population. This is attributed to body fat distribution; Asian Indians tend to have more
visceral adipose tissue, causing higher insulin resistance despite having a lean BMI. The
WHO also advocated a lower limit of normal BMI in Asian Indians (WHO, 2000). A
WHO expert consultation (2004) concluded that the proportion of Asian people with a
high risk of type-2 diabetes and cardiovascular disease is substantial at BMIs lower than
the existing WHO cut-off point for overweight ( more than 25 kg/m2).
For many Asian populations, additional trigger points for public
health action were identified as 23 kg/m2 or higher, representing increased risk, and 27.5
kg/m2 or higher as representing high risk. The suggested categories are as follows: less
than18.5 kg/m2underweight; 18.5–23 kg/m2 increasing but acceptable risk; 23–27.5
kg/m2 increased risk; and 27.5 kg/m2 or higher high risk. The consultation identified
further potential public health action points (23.0, 27.5, 32.5 and 37.5 kg/m2) along the
continuum of BMI, and proposed methods by which countries could make decisions about
the definitions of increased risk for their population (WHO Expert Consultation,
2004).9,22,23

Table 1.2.The WHO alternative BMI classification for Asian population
(Source: WHO Expert Consultation, 2004).
b. Waist circumference
The measurements of Waist Circumference (WC) and Waist Hip
Ratio (WHR) can be thought as alternatives both in research as well as clinical practices.29
Though Waist Hip Circumference can indicate abdominal fat distribution and ill health,
waist circumference is a convenient and simple measurement which is unrelated to height
and can reflect changes in the risk factors for cardiovascular diseases and other chronic
diseases in different populations, hence this alone can be used as an initial screening
tool.21
Classification BMI (kg/m2)
Underweight Less than 18.5
Normal range 18.5 to 22.9
Classification BMI (kg/m2)
Overweight More than or equal to 23
At risk 23 to 24.9
Obese I 25 to 29.9
Obese II More than or equal to 30
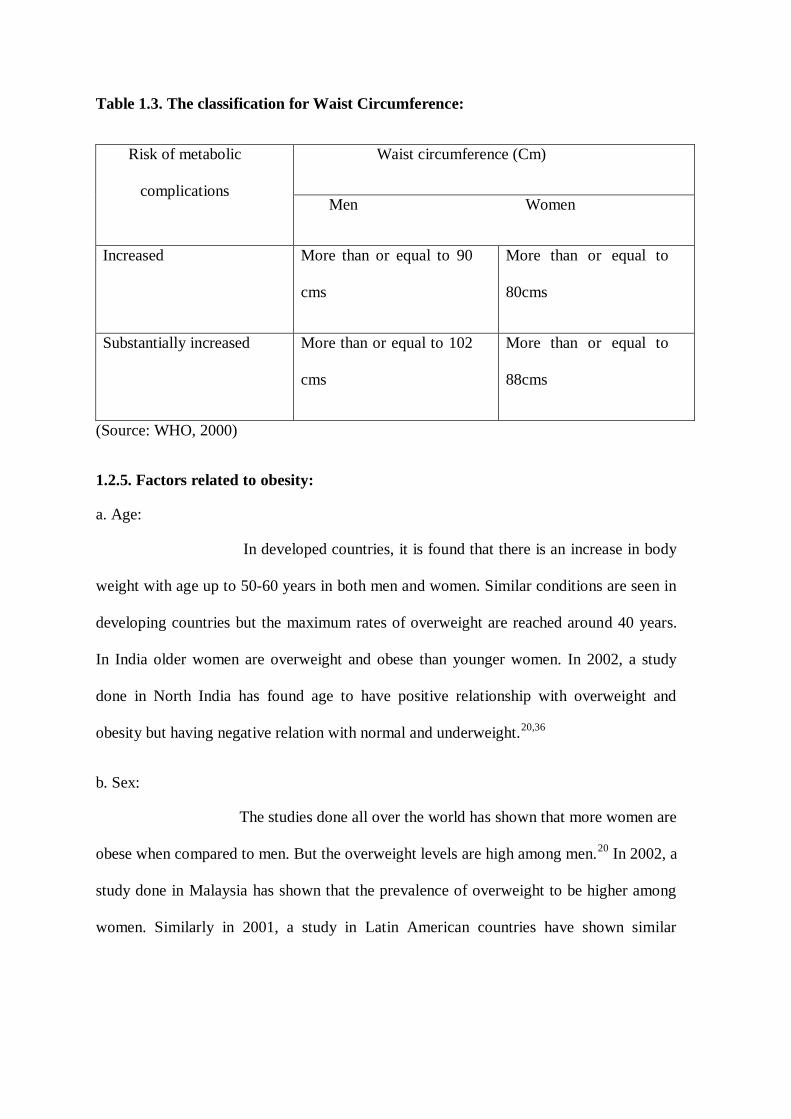
Table 1.3. The classification for Waist Circumference:
Risk of metabolic
complications
Waist circumference (Cm)
Men Women
Increased More than or equal to 90
cms
More than or equal to
80cms
Substantially increased More than or equal to 102
cms
More than or equal to
88cms
(Source: WHO, 2000)
1.2.5. Factors related to obesity:
a. Age:
In developed countries, it is found that there is an increase in body
weight with age up to 50-60 years in both men and women. Similar conditions are seen in
developing countries but the maximum rates of overweight are reached around 40 years.
In India older women are overweight and obese than younger women. In 2002, a study
done in North India has found age to have positive relationship with overweight and
obesity but having negative relation with normal and underweight.20,36
b. Sex:
The studies done all over the world has shown that more women are
obese when compared to men. But the overweight levels are high among men.20
In 2002, a
study done in Malaysia has shown that the prevalence of overweight to be higher among
women. Similarly in 2001, a study in Latin American countries have shown similar
picture.31,32
Studies done in India, have clearly shown the gender differences related to
overweight.30
c. Parity:
It is found that parity increases the risk of overweight in low and
middle socio-economic status groups (WHO, 2000).20
Parity is found to have highly
significant association with overweight especially with women who have five children or
more.36
d. Socio economic status
In 2002, a study in North India has shown that ten percent of the
women belonging to high standard of living were obese.36
A study done on women in
India, 2005 has found that prevalence of overweight to be higher among economically
better off women. Higher socio-economic status has been consistently associated with
greater risk of obesity and diabetes.30
e. Place of residence:
Studies done across the world have shown that urban residence with
increased number of overweight people.16
In 2005, a study done among Indian women
shows those urban residences have increased risk of obesity.30
A study done in 2002 shows
that overweight levels to be higher among people residing in the urban area.36
f. Religion:
In 2004 study done among women is North India has found that one
out of every two Sikh women in Delhi to be overweight or obese.36
Similarly in 2005 the
study done in Indian women has found Sikh women are 1.57 times more likely to be
overweight when compared to Hindu women.29

g. Education:
A study done in 2002 among women in North India has shown that
education of women is directly related to overweight. As education increases, the levels of
obesity are likely to increase. Similarly husband‟s education is directly related to
overweight among women.36
h. Occupation
A study done in 2002 among North Indian women shows that self-
employed women are obese followed by women employed by someone else. Women
working in family farm/business are least obese. But a good proportion of not working
women are also obese and overweight. Women whose occupation is related to
professional/technical/managerial work are mostly overweight.36
i. Diet changes:
A 2002 study among North Indian women showed that there was no
significance found among vegetarian and non vegetarian among both sexes, but
significance was found for people who like fast food and fried food. Milk and egg may be
more responsible for overweight and obesity of women. According to
another study
uncontrolled diet consumption and more sedentary life, women are becoming overweight
and obese.36
In 2005, a study among Indian women found an increase in BMI status to be
more among women who frequently consumed the food items containing relatively more
sugar and fats. Also ingredients of balanced diet like green leafy vegetables are found to
be less consumed by women who experienced relatively more increase in BMI status.30
j. Physical activity
A 2002 study among North Indian women found that household
durable goods like washing machines, cooking gas and electric ovens reduce the physical

activity leading to overweight. Decreased physical activity has been observed in urban
compared with rural groups. Less physical activity leads to an increase in the BMI status
over a period of time.36
In 2005, a study among Indian women found that female
participants were more dormant in comparison to male participants.30
k. Perception related to overweight:
Studies have shown that perception of ideal body weight varies with
culture, ethnicity, educational level and socioeconomic group and can influence the
development of obesity.37
In some developed countries, social stigma against obesity and
obsession to remain lean has helped to limit obesity to some extent. Such an attitude
towards obesity is not seen in many developing countries.16
One of the obstacles to
slowing down the increase of obesity could be its cultural desirability in some developing
societies. Studies done in Africa showed that most women do not perceive themselves as
being too fat. Most of them were not concerned with their weight and perceived
themselves being too fat and were not interested to lose weight.37
A study done in Netherlands found that, there were no differences
in preference for a larger body size among two non-western migrant populations. Most
women wished to be thinner.38
In a study done in rural Africa, many rural women were not
concerned about their weight and most overweight and obese women did not want to lose
weight.39
1.3. Rationale for the study:
According to World Health Organisation (WHO, 1998), „the growth
in the number of severely overweight adults is expected to double than under-weight
during 1995-2025‟.The mortality rates also increase with increase in Body Mass Index

(BMI). Globalisation has been inevitable and is triggered by modernisation and
urbanisation. Hence obesity is going to emerge as a challenging problem for India. Though
the levels of urbanisation in India are low when compared to Western countries it needs to
be tackled before it reaches alarming proportions.
Though the National Family Health Survey (NFHS) provides the
prevalence of overweight for the country and for all the states in India, it is also important
to know about the levels of overweight in cities like Salem and to know about the factors
associated with it. There has been only one study done in Salem related to overweight.
In India, there is no literature related to perceptions among women
related to overweight. It would be interesting to know about their perceptions and
knowledge which would help us to frame policies accordingly.
Therefore this study is undertaken with the following objectives
1.4. Objectives of the study:
a. Major objectives of the study
To estimate the prevalence of overweight among women aged 19-49 years in
Salem, Tamil Nadu.
To study the factors related to overweight among them.
b. Minor objectives of the study:
To estimate the prevalence of abdominal obesity among women aged 19-49 years
in Salem, Tamil Nadu
To study the factors associated with abdominal obesity among them.

CHAPTER 2
METHODOLOGY
2.1 Study design:
The study is a Cross-sectional study
2.2. Study setting:
The study was conducted within the limits of Salem Municipal
Corporation. Salem is the fifth largest city in Tamil Nadu and has a population of 6,
97,061(2001 Census). The literacy rate is 57.50 percent and the sex ratio is 929.Though
agriculture is the main base; it is an important textile centre and has rich mineral reserves
with rich industrial base. The Salem Corporation consists of 60 wards.
2.3. Study Frame:
Women in age group 19-49 years residing within the limits of
Salem Municipal Corporation.
2.4. Sampling Method:
The method used is Cluster sampling
2.5. Sample size:
The sample size is calculated using Epi Info (version 3.3.2).
According to NFHS-3 (National Family Health Survey, 2005-06) the prevalence of
overweight among Tamil Nadu women is 34.8 and having the worst acceptable, as 29 the
estimated sample size is 243.Sample size was multiplied by two to account for the design
effect. Considering 10 percent as non-response rate, the sample size is 534. The sample
size is rounded to 540.the number of clusters selected was 30 and the number of person
selected per cluster was 18.Here clusters refers to the number of ward in Salem Municipal
corporation
2.6. Sample Selection:
The Salem Municipal Corporation is divided into 60 wards. Each
ward is considered as a cluster.30 clusters were selected and 18 people from each cluster
were selected from 60 wards by using PPS .After identification of the cluster, a street will
be identified randomly and then the geographical centre of the street will be identified and
then a bottle will be rotated and the direction as pointed by the bottle will be chosen and
then a house will be randomly selected from that direction. That was considered as the
first household. After visiting, the first household, the nearest households were visited
until eighteen eligible participants were recruited.
2.7. Study Participation:
a. Inclusion criteria:
All women aged between 19 – 49 years on January 1st, 2010 and residing
within the limits of Salem Corporation were included.
b. Exclusion criteria:
The following categories of women were not included in the study.
1. Pregnant women.
2. Women with physical deformity.
3. Women who are acutely sick

2.8. Data Collection Techniques:
The data collection was for a period of three months from June15th
2010 to September 15th 2010. The data was collected by the principal investigator after
obtaining informed consent from each respondent interviewed.The Data was collected
using a pre-tested questionnaire (Appendix-II). Information related to socio-demographic
details, physical activity (measured using GPAQ questionnaire), dietary patterns (few
questions are taken from STEPS questionnaire), perception and knowledge statements
related to overweight were recorded. Anthropometric details related to Height, Weight and
Waist Circumference (WC) will were taken. The measurements were taken as per the
guidelines given with the WHO STEPS Instrument for Chronic Disease Risk Factor
Surveillance.
2.9. Data Storage:
Along with the data collection, the data was entered in the Windows
Excel and then imported to SPPS for window version 15.0 for analysis purpose. The hard
copies of the interview schedule were stored in a locked chamber under the vigilance of
the principal investigator. The privacy and the confidentiality were strictly maintained.
2.10. Data Analysis and Statistical Methods
The data was entered in Windows Excel and then scrutinized in the
same software. It was then imported to SPSS for window version 15.0 for analysis. The
baseline characteristics were analyzed by descriptive statistical principles, for mean age,
religion, caste, education and occupation etc. Bivariate analyses of the independent
variables with respect to the dependent variable were done by cross tabulation and testing
by Chi square test, Chi square test for linear trend as appropriate. For the adjustment of

possible interaction and confounding factors a multivariate analysis was considered for a
final model. The effective measure used in the analysis was Odds Ratio. The association
was considered statistically significant when the null value for the effect measure came
within the confidence limit or with p value less than 0.05. Results with high strength of
association and significant or near significant p value in bivariate analysis were considered
for the final modelling purpose.
2.11. Introducing the variables in the study:
a. Dependent variable:
1. Overweight (Body Mass Index (BMI) >25 kg/m2)
2. Abdominal Obesity (Waist Circumference > 80 cm)
Definition of the dependent variable:
Body Mass Index (BMI): According to WHO, BMI (Body Mass Index)
value of more than 25 is considered as overweight.20
Waist Circumference (WC): According to International Diabetic
Federation, a waist Circumference of more than or equal to 80 cms is considered to be
having metabolic complications. Hence two categories were made as waist circumference
less than 80 cms and waist circumference more than or equal to 80 cms.
b. Independent variables:
Demographic variables:
Age, Religion, Place of residence, Marital status, Number of children.

Socioeconomic variables:
Education status of respondent, Education status of respondent‟s husband,
Occupation of the respondent, Occupation of the respondent‟s husband,Socio economic
status.
Physical activity variables:
The physical activity was captured in three domains namely activity
at work, travel to and from places and recreational activities. The activities were classified
into vigorous and moderate activities.
Diet variables:
The number of consumption of items like egg, milk, sweets,
chocolates, ice-cream pastries, puffs, biscuits, cold drinks, fried chips were asked.
2.12. Introducing special tools in the study:
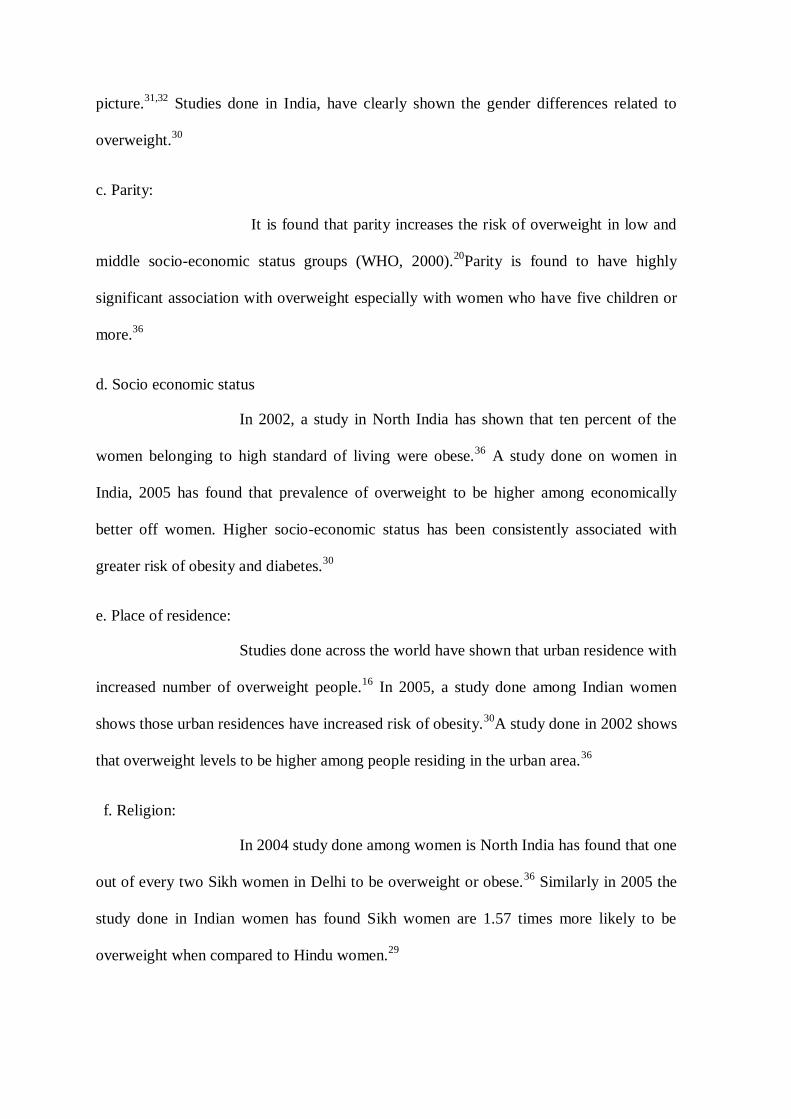
a. Figure Rating Scale:
Perceived body shape was determined from the Figure Rating Scale
adapted from a paper by Bhuiyan et al.40
Participants were asked to rate how they perceive
their current body shape by choosing an image that corresponds to heir figure on a scale
ranging from 1 to 9, with 1 being the thinnest body type and 9 being the largest, most
obese type. The numbers on the scale were later categorized into 1 and 2 as underweight, 3
and 4 as correct weight, image 5 as slightly overweight, images 6 and 7 as moderately
overweight and image 8 and 9 as very overweight. The figure is given below:
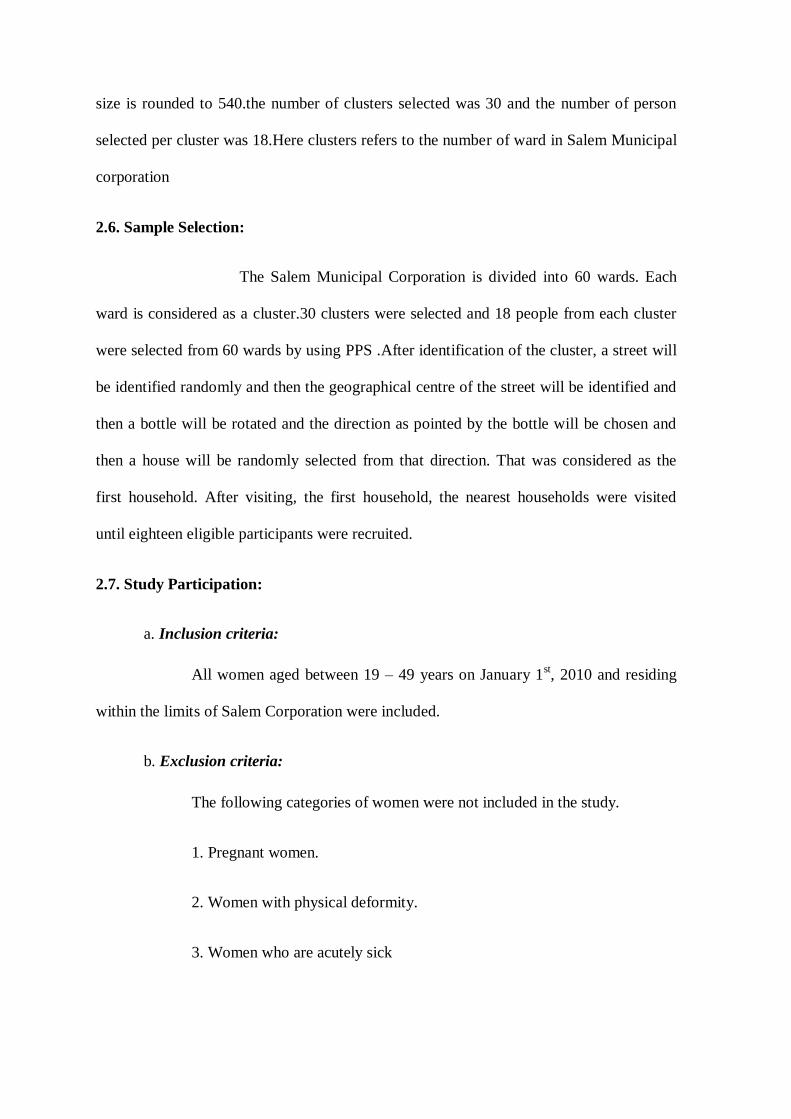
Since the above picture was found to be culturally not appropriate,
these images were then edited to Indian context. The images are given below.
Few questions were added related to the picture on where they
would like to be in the next one year and following healthy diet and exercise. Later a Body
Image Discrepancy score was calculated.
BID score = standardized body image perception - standardized Body Mass Index.

A negative score indicated that women perceive themselves being thinner than she
actually was whereas positive score indicates that the participant perceived themselves
being fatter than what it was actually.
2.13. Operationalising variables
a. Age: Since age is considered to have an important association with overweight, Data
was collected from the participants as self reported age in completed years to find out any
significant association. The age group of 19-49 was considered as it the age group where
interventions can be effectively used. The age was then classified into 3 groups for
description and then coded as less than 35 years and more than 35 years for further
analysis.
b. Religion: From the previous studies religion is found to be associated with overweight.
The participants had to select among the four religions namely Hindu, Muslim, Christian
and others which were self reported. Later it was regrouped into Hindu and non- Hindu for
further analysis.
c. Caste: From the studies done earlier caste is found to have high significance with
overweight and hence to find out the relation of caste with overweight, participants were
asked to identify themselves with one of them namely, Forward, Backward, Scheduled
Caste, Scheduled tribe and others. Later, scheduled caste and scheduled tribe were made
into one group and Forward, Backward and others were made into another group.
d. Marital Status: The marital status was asked to find out the association with
overweight since it is found as factor associated in the studies done previously.It was
categorized into currently single (unmarried, widowed, divorced) and married for further
analysis.

e. Husband’s education: Though no previous studies have shown to prove that husband‟s
education has an association with overweight, the husband‟s education was asked to find
out if any association exists. It was an open ended question and it was later categorized
into no formal education, educated till primary level, secondary and higher secondary and
graduation and above. It was also categorized into years of schooling where less than 10
years (included Upto standard 9) and then more than 10 years (included education more
than standard 9).
f. Husband’s occupation: No previous literature have shown any association of
Husband‟s occupation with overweight, however the question was asked to find out if
there existed any relationship. The husband occupation was categorized into government
employed, manual labourer, self employed and others. Government and private employed
were later categorized together.
g. Pregnancy Status: A high significance is found between parity and overweight. Hence
this question was included. The age at which the respondents were pregnant was recorded
and later the number of pregnancies were calculated and then categorized into nil
pregnancy, 1-2 pregnancies, more than 2 for further analysis.
h. Education of the women: Women‟s education is highly correlated with overweight in
the previous studied done and hence to find out association women‟s education was added
as a variable. An open ended question was asked and it was later categorized into no
formal education, educated till primary level, secondary and higher secondary and
graduation and above. It was also categorized into years of schooling where less than 10
years (included Upto standard 9) and then more than 10 years (included education more
than standard 9).
i. Occupation of the women: The current occupation of the women was asked because it
is found that women who are having sedentary job are more likely to be overweight.
Hence to find out the association the question was included. It was further classified as
home maker and others (including government employed, private employed, student and
self employed) for further analysis.
j. Wage earning among home makers: No study has been done to find out if any
association between homemakers who earn in an informal sector with overweight. To find
out an association, a question was added if homemakers are involved in such wage
earning. Then the type of wage earning was asked as an open ended questionnaire.
k. Physical Activity: The physical activity related to work, transport and recreation was
taken into account and then the corresponding time was converted into Metabolic
Equivalents (MET) values. Based on the MET values they were classified into three
categories namely low, medium and high according to GPAQ (Global Physical Activity
Questionnaire) (Annexure-II). The mean sedentary activity per day was also calculated.
The sedentary activity which includes sitting or reclining at work, getting to and from
places, with friends, playing cards or watching television but does not include time spent
on sleeping. The total activity on average per day includes the activity at work; travel to
and from places and recreational activities.

Table 2.1. Metabolic Equivalents (METS) values:
(Source: GPAQ questionnaire)
l. Diet:
The studies done in India have found that diet to be significantly associated with
overweight. Hence the variable was included. The diet pattern, type of oil used for
cooking, fruits and vegetable consumption pattern and consumption of food items were
asked. The exact number of consumption of those items
The participants answer was taken later all the consumptions were converted into
month for analysis. Further categorization was made to add chocolates and sweets
together, and bakery items together (which included bakery biscuits, fried chips, puffs,
pastries)
m. Statements related to perception related to overweight: Though no previous studies
have been done in India, to find out any association between perception and overweight,
the question was added to find out if there exists any such association. A series of ten
questions of perceptions relating to thinness, overweight, weight gain and for weight
control were asked. The participants were asked to agree, disagree to the statements. There
Domain MET value
Work
Moderate MET value = 4.0
Vigorous MET value = 8.0
Transport Cycling and walking MET value = 4.0
Recreation
Moderate MET value = 4.0
Vigorous MET value = 8.0

were open ended questions related to the participant‟s barriers to decreasing/increasing
weight, three common reasons for increase of weight.
n. Knowledge related to adverse effects of overweight: Similarly, no literature is found
in India where questions were asked on the adverse health effects of overweight. This
question was added to find out any association. An open ended question was first asked to
find out the adverse effects of overweight form the participants and five closed ended
questions were asked if overweight caused diabetes, hypertension, cancer, osteoarthritis
and heart diseases. A score was later given. If they agree then a score of 1 was given, if
they disagree or they answer no then a score of zero was given. Maximum score of five
was taken and later three was taken as cut-off. They were categorized into people who
scored less than five and person who scored more than five.
o. Others: questions on height, weight and waist circumference were taken as per the
guidelines given with the WHO STEPS Instrument for Chronic Disease Risk Factor
Surveillance.
2.14. Ethical considerations:
Ethical clearance was obtained from the Institute Ethical Committee (IEC), Sree
Chitra Tirunal Institute for Science and Technology, Trivandrum, Kerala prior to data
collection. Participants who were willing to take part in the study were given a consent
form (Appendix-I). If the participant was unwilling to sign and/or unable to sign but was
willing to participate, then her thumb impression was considered. If she declined to the
above formality, but was willing to participate, a witness signature was taken in the
consent form on her behalf.
CHAPTER 3
RESULTS
This chapter mainly describes the outcomes of the data analysis in
accordance with the objectives. After cleaning the data entered, they were analyzed using
SPSS for windows version 15.0. First, the baseline characters of the sample population
were identified, followed by the prevalence of overweight and abdominal obesity; next the
association between several independent variables taken one at a time and the outcome
variable (overweight and abdominal obesity) were examined and finally a regression
equation was fitted to identify the predictors of overweight and abdominal obesity .The
results are organised into sample characteristics, results of bivariate analysis and results
of multivariate analysis.
Of 540 samples selected, 500 women consented to participate in the
study with the response rate of 92.5 percent.
3.1. Sample Characteristics:
A detailed description of the study sample is given in this section.
The following characteristics of the sample population are presented; details of the sample
socio-economic and demographic features, physical activity, details of the dietary habits,
and perceptions among women related to overweight and anthropometric measurements of
respondents.
3.1.1. Baseline Characters of the Sample Population:
The mean age of the sample population is 33.3 ± 8.42 years. 41.2 percent of the
population belonged to 19-30 years of age group and the remaining

Table 3.1.Socio-economic, demographic characteristics of the sample population
Variable Number (Percentage)
Age (in completed years) Total number = 500
19-30 206 (41.2)
31-40 179 (35.8)
41-49 115 (23.0)
Religion Total number = 500
Hindu 384 (76.8)
Christian 61 (12.2)
Muslim 55 (11.0)
Caste Total number = 500
Forward 68 (13.6)
Backward 352 (70.4)
Scheduled caste 77 (15.4)
Scheduled tribe 3 (0.6)
Marital Status Total number = 500
Married 400 (80.0)
Unmarried 70 (14.0)
Widowed 14 (2.8)
Divorcee 16 (3.2)
Husband‟s education Total number = 420
No formal education 27 (6.4)
Primary (up to 5std) 36 (8.6)
Secondary & Higher Secondary 170 (40.5)
College education 187 (44.5)

3.1.Socio-economic, demographic characteristics Contd...
Husband‟s Occupation Total number = 414
Government employed 69 (13.8)
Unemployed 9 (1.8)
Daily labourer 122 (24.4)
Self employed 153 (30.6)
Private employed 61 (12.2)
Education of respondents Total number = 500
No formal education 34 (6.8)
Primary (up to 5std) 39 (7.8)
Secondary & Higher Secondary 259 (51.8)
College education 168 (33.6)
Occupation of respondents Total number = 500
Government employed 39 (7.8)
Home maker 324 (64.8)
Daily labourer 77 (15.4)
Student 40 (8.0)
Others* 20 (4.0)
Ever Pregnant Total number = 500
Yes 397 (79.4)
No 103 (20.6)
Socio Economic Status Total number = 500
Low 184 (36.8)
Middle 249 (49.8)
High 67 (13.4)
(Source: Primary survey, Salem, 2010) * Self employed, private employed

58.8 percent were aged between 31 and 49 years. Almost 52 percent of the women had up
to secondary and higher secondary education.64.8 percent of the sample population are
homemakers and among them 25.6 percent earn wages and belonged to the informal
sector. The common wage-earning activities performed at home included tailoring at
home, taking tuitions, anklet making and few were involved in beedi rolling ( since Salem
is known for silver jewellery, anklet making is common). 22 percent of the women have
never had any pregnancies.60.4 percent of the women had one or two children, while 17.6
percent had above 3 children. Around fifty percent belonged to the middle socio-economic
status.
a. Details of the physical activity:
Among the study population, around 50 percent of the women reported to have
high physical activity. There can be a possibility of over reporting since women consider
themselves doing moderate physical activity based on time spent doing the household
chores. The severe physical activity related to house work includes carrying water from
the street pipes to their homes. Some of the pipes are located near the houses and some are
quite far. This activity was observed among women from low and middle socio economic
status. A few women from higher socio economic status were involved in moderate sports
activity including doing yoga exercises and playing badminton. It is not surprising to get a
nil response for questions related to severe sports activity as most of the respondents are
married women and they were amused when such a question was asked.
The calculation of physical activity was into categorized into three categories
namely low, medium and high. This was calculated by using the Metabolic Equivalents
(MET). The calculation involves formulas where they take into account both the number
of days involved in physical activity as well as the time spent for each activity. An average

woman from low and middle socio economic status spends almost 7 days (average of 5
hours each day as reported by the respondents) doing household chores and also doing
severe physical activity like carrying water from the streets. Since my study population
has many women from the above mentioned socio-economic class, the physical activity
calculation rose to 86 percent, but later calculation involving only the Metabolic
Equivalents were considered (for more details see APPENDIX- III).After recalculation,
the level of high physical activity and moderate physical activity came around 50 percent
and 34 percent respectively.
Table 3.2. Physical activity of the study population
Level of physical activity: Number = 500
High 249 (49.8)
Medium 170 (34.0)
Low 81 (16.2)
(Source: Primary survey, Salem, 2010)
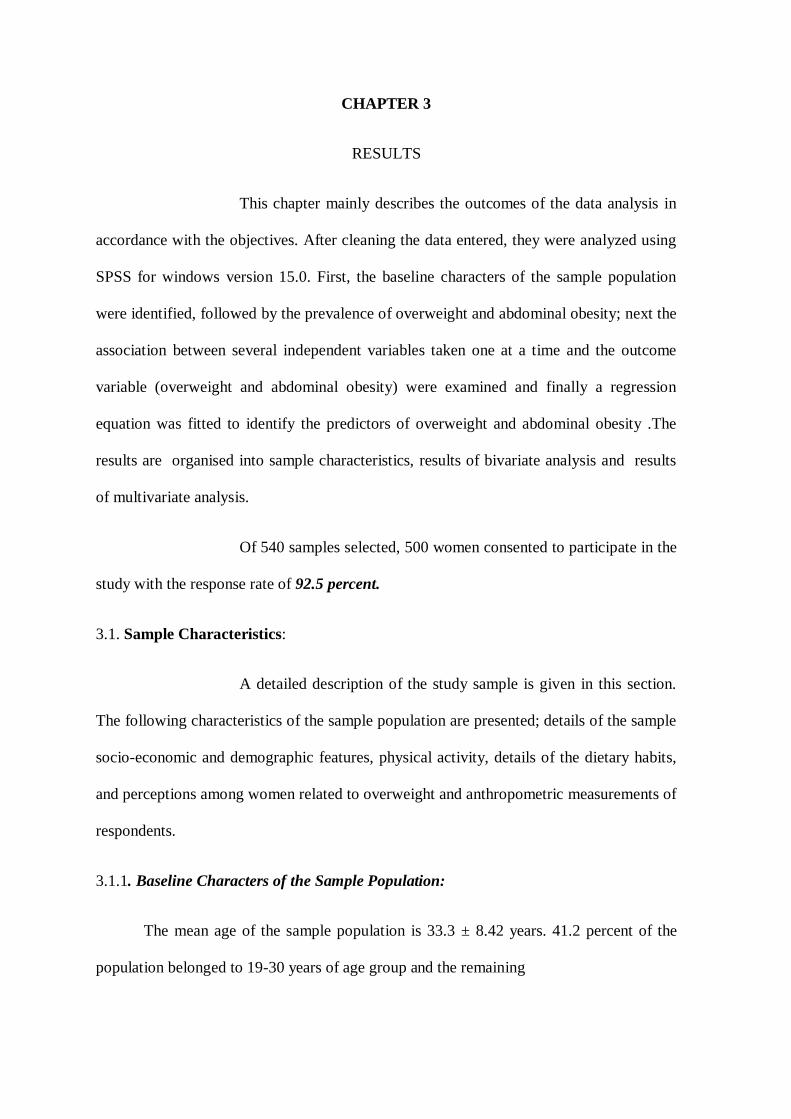
The mean sedentary time among the study population ranges from 30 minutes to
10 hours per day. The minimum time spent was reported by a woman who is a handloom
weaver who spends most of her time weaving (Salem city is known for handloom
weaving) and the maximum time spent was reported by a young girl, who is a class tenth
student who could not continue her studies. She spends most of her time watching
television. The relaxing time is usually spent by watching television. It is interesting to
note here that the free television scheme introduced by the Tamil Nadu government has
made very home possess a television. It was a common to find one such television in every
home in the lower socio-economic strata.
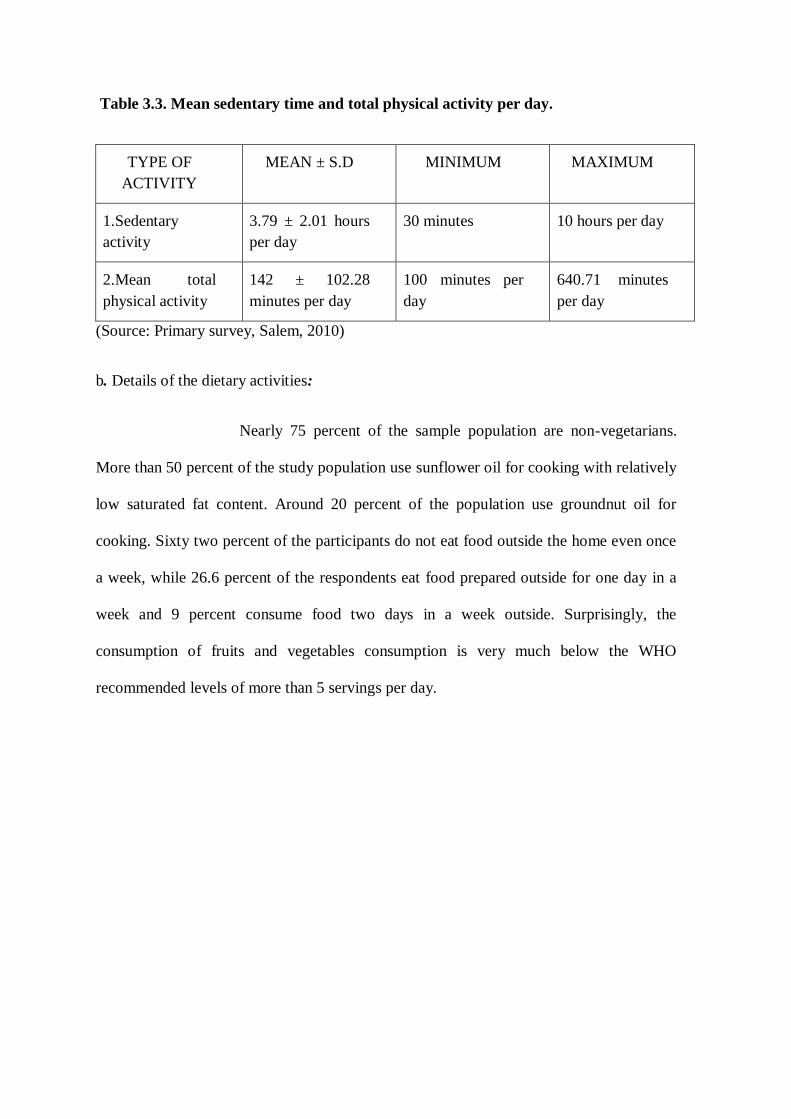
Table 3.3. Mean sedentary time and total physical activity per day.
TYPE OF
ACTIVITY
MEAN ± S.D MINIMUM MAXIMUM
1.Sedentary
activity
3.79 ± 2.01 hours
per day
30 minutes 10 hours per day
2.Mean total
physical activity
142 ± 102.28
minutes per day
100 minutes per
day
640.71 minutes
per day
(Source: Primary survey, Salem, 2010)
b. Details of the dietary activities:
Nearly 75 percent of the sample population are non-vegetarians.
More than 50 percent of the study population use sunflower oil for cooking with relatively
low saturated fat content. Around 20 percent of the population use groundnut oil for
cooking. Sixty two percent of the participants do not eat food outside the home even once
a week, while 26.6 percent of the respondents eat food prepared outside for one day in a
week and 9 percent consume food two days in a week outside. Surprisingly, the
consumption of fruits and vegetables consumption is very much below the WHO
recommended levels of more than 5 servings per day.
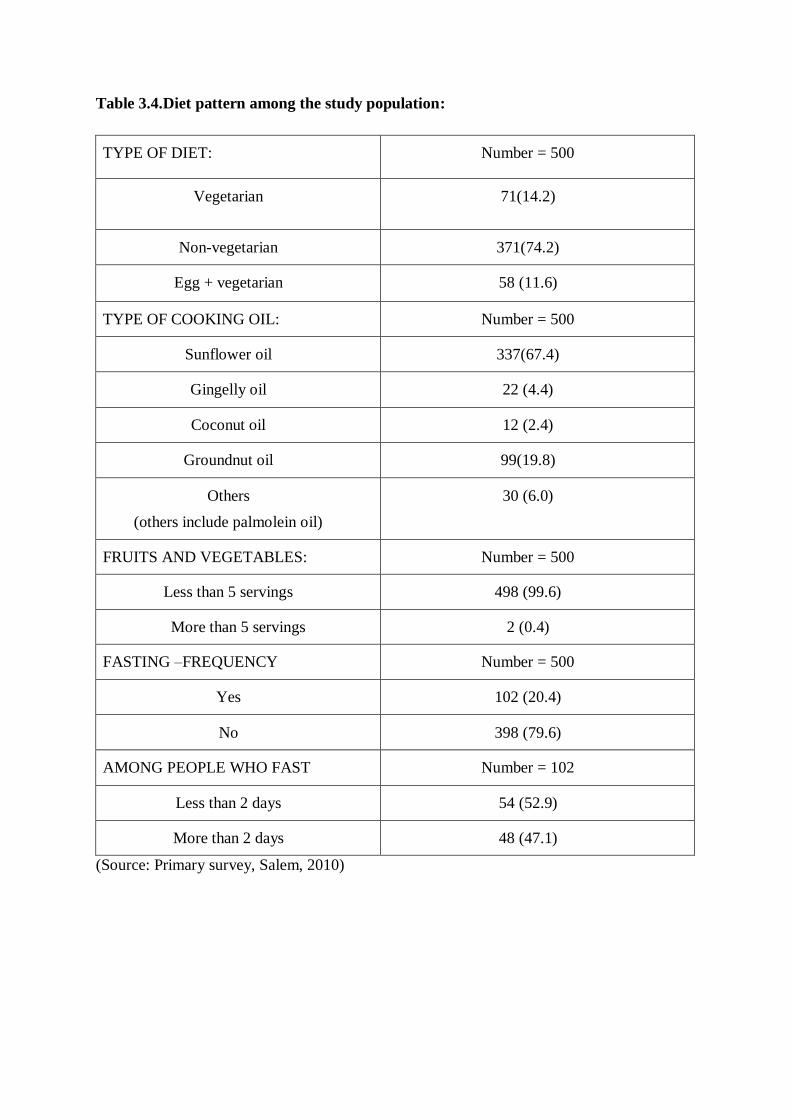
Table 3.4.Diet pattern among the study population:
TYPE OF DIET: Number = 500
Vegetarian 71(14.2)
Non-vegetarian 371(74.2)
Egg + vegetarian 58 (11.6)
TYPE OF COOKING OIL: Number = 500
Sunflower oil 337(67.4)
Gingelly oil 22 (4.4)
Coconut oil 12 (2.4)
Groundnut oil 99(19.8)
Others
(others include palmolein oil)
30 (6.0)
FRUITS AND VEGETABLES: Number = 500
Less than 5 servings 498 (99.6)
More than 5 servings 2 (0.4)
FASTING –FREQUENCY Number = 500
Yes 102 (20.4)
No 398 (79.6)
AMONG PEOPLE WHO FAST Number = 102
Less than 2 days 54 (52.9)
More than 2 days 48 (47.1)
(Source: Primary survey, Salem, 2010)

Details of the consumption pattern of selected food items:
Though the questionnaire had consumption pattern of items like
milk, biscuit and egg they were not taken for analysis because the consumption pattern of
those items were not properly recorded because of difficulty in understanding of the
question by the respondents. In case of biscuits the consumption of exact number of
biscuits were recorded rather than the exact number of consumptions. There was no proper
recording related to milk and eggs and hence excluded from analysis.
Table 3.5. Dietary consumption of selected food items
Chocolates and sweet (per month) Number = 500
0- 1 162 (32.4)
2-4 115 (23.0)
5-9 112 (22.4)
More than 9 111 (22.3
Bakery items (consumptions per month) Number = 500
0 – 4 146 (29.2)
5 – 9 108 (21.6)
10- 15 114 (22.8)
More than 15 132 (26.4)
(Source: Primary survey, Salem, 2010)
Among the other food items, chocolates and sweets were considered a separate
entity and other bakery items were clubbed together for analysis purpose. It is found there
seems to be an equal distribution of numbers across the respondents related to chocolates
and sweets consumption. But bakery items have around 30 percent of the population
having zero to four consumptions per month.

c. Perception related to overweight:
As many as 42 percent of the respondents perceived that that their
weight was normal and around 36 percent felt that they were overweight.
Table 3.6. Self perception of one’s own weight:
Self perception of one‟s own weight: Number = 500
Normal 208 (41.6)
Underweight 80 (16.0)
Overweight 179 (35.8)
Obese 33 (6.6)
(Source: Primary survey, Salem, 2010)
Figure Rating Scale(FRS):
The respondents were asked questions related to the above picture. For
details related to the question please refer ANNEXURE – II. The respondents were asked
to place themselves among the images from 1-9. As mentioned in the methodology
section, the images 1-3 correspond to underweight, 4 to normal weight, 5 to slightly

overweight and 6 and 7 correspond to moderately overweight and 8 and 9 refer to
overweight.
From the graphs given below, it is interesting to note that the 27 percent of the
respondents would like to place themselves in picture 5, followed by picture 6 which
represents slight overweight and 6 represents moderately overweight silhouettes
respectively.46
From figure 2, it can be seen that 42 percent of the respondents wanted to in
picture 5 which represents slight overweight. What is interesting is that the respondents
want themselves to be in the slightly overweight category than in the normal category.
Figure 3 states that the respondents consider picture 5 (which represents slightly
overweight) as an ideal silhouette. Figure 4 states that the respondents think that with diet
and exercise they will look like the silhouette, picture 4 (corresponds to correct weight)
which states that implies that they understand the effect of diet and food on a person‟s
weight and looks.
Figure 1: where would the respondents match themselves in the picture?

Figure 2: where would the respondents would like to be ideally?
Figure 3: where would the respondents like to be in the forthcoming year?
Body Image Discrepancy (BID) score
The negative score implies that the respondents consider themselves
thinner than their actual weight and positive score implies that, the respondents consider
themselves as heavier than their actual weight. In the current study, there seems to be an
equal distribution in both positive and negative score, which implies half the study
population consider themselves to be thinner than they are actual weight, similarly the
other half of the study population considers themselves as heavier than their actual weight
Table 3.7. Body Image discrepancy Score (BID Score)
(Source: Primary survey, Salem, 2010)
BID SCORE NUMBER
Negative score 247 (49.4)
Positive score 253 (50.6)
Figure 4: where would the respondents would be if they regularly exercise and have proper diet?

Statements on perception related to overweight
Nearly half the respondents stated that thinness is not beautiful, similarly the
respondents also agree that overweight is not a sign of prosperity, which means that
overweight is just not related to richness. Nearly 80 percent have agreed that less active
people are overweight and they are not healthy people. The interesting point here is 65
percent of the respondents feel that it is not practical for women to exercise daily. Table
3.8. Statements on perception related to overweight
Statement Agree(%) Disagree(%) Don‟t
know(%)
1.Modern clothes are worn by thin people 332(66.4) 141(28.2) 27(5.4)
2.Thin people are not beautiful 227(45.4) 241(48.2) 32(6.4)
3.Overweight reflects prosperity 213 (42.6) 220 (44.0) 67 (13.4)
4.People who are overweight are less active
than normal people
401 (80.2) 75 (15.0) 24 (4.8)
5.People who are overweight are found to be
less healthier than normal people
366 (73.2) 89 (17.8) 45 (9.0)
6.Weight gain is hereditary 261 (52.2) 190 (38.0) 49(9.8)
7.Weight gain is related to too much eating 384 (76.8) 65 (13.0) 51 (10.2)
8.One has to eat expensive food to lose
weight
79 (15.9) 292 (58.6) 127 (25.5)
9.If one exercises one feels healthy 464 (93) 20 (4.0) 15 (3.0)
10.It is not practical for a woman to exercise
daily
327 (65.5) 137 (27.5) 35 (7.0)
(Source: Primary survey, Salem, 2010)
In an open ended question, where the respondents were asked about the barriers
which prevented them from reducing weight, the most common responses included eating
more food, not eating at right time and unable to do exercise among overweight women.
Similarly when another open ended question was asked about oily common reasons for

increase in weight among women the responses included eating food, being happy and
after child birth.
Knowledge related to adverse health effects of overweight:
Most of the participants knew about obesity related health effects
including hypertension, diabetes, heart problem and osteoarthritis. Nearly 50 percent of
the respondents did not know about the obesity causing cancers. Hypertension, breathing
problems and diabetes were some of the disease conditions which the participants felt as
adverse health effects related to overweight. Other reasons given by them include
menstrual problems, thyroid problems and backache.
Table 3.9.Knowledge about adverse health effects of overweight
(Source: Primary survey, Salem, 2010)
d. Anthropometric measurements
The mean waist circumference and the Body Mass Index is high in the
study population, where the waist circumference mean is more than 80 cms and the Body
Mass Index falls in overweight category.
Statement Agree (%) Disagree
(%)
Don‟t know
(%)
1.Obesity causes hypertension 411 (82.2) 42 (8.4) 47 (9.4)
2.Obesity causes heart problem 322 (64.4) 92 (18.4) 86 (17.2)
3.Obesity causes diabetes mellitus 322 (64.4) 93 (18.6) 85 (17.0)
4.Obesity causes cancer 151 (30.2) 99 (19.8) 250 (50.0)
5.Obesity causes osteoarthritis 361 (72.2) 28 (5.6) 111 (22.2)

Table 3.10. Anthropometric measurements
(Source: Primary survey, Salem, 2010)
Classification of weight using BMI
Table 3.11. Classification of weight using BMI:
(Source: Primary survey, Salem, 2010)
Fifty four percent of the respondents are overweight, including 21.6
percent of obese women, while only 4.8 percent are underweight.
3.2. Prevalence of overweight/ abdominal obesity among study population:
The prevalence of overweight (BMI >=25 ) is 54 percent whereas
the abdominal obesity prevalence is 67.4 percent.The abdominal obesity prevalence is
higher than obesity classified using BMI.
Variable Mean ± S.D
1. Weight 60.74 ± 13.17
2. Height 152.21 ±6.53
3. Waist circumference 85.41 ± 10.99
4. Body Mass Index (BMI) 26.15 ± 5.08
BMI Number (%) classification
<18.5 kg/m2 24 (4.8) Underweight
18.5 – 24.9 kg/m 2 206 (41.2) Normal
25 – 29.9 kg/m2 162 (32.4) Overweight
>= 30 kg/m2 108 (21.6) Obese

Table 3.12. Prevalence of overweight
(Source: Primary survey, Salem, 2010)
Table 3.13. Prevalence of abdominal obesity
Waist circumference
< 80 cms 163 (32.6%)
>80 cms 337 (67.4%)
(Source: Primary survey, Salem, 2010)
a. Stratification of WC (Waist circumference) by age group:
The stratification of waist circumference by age group shows that
the prevalence of abdominal obesity is high among women aged more than 35 years.
Table 3.14. Stratification of Waist circumference by age group
Category 19-34 35-49
Waist circumference (WC < 80 cms) 109 (37.5) 54 (25.8)
Waist circumference (WC > 80 cms) 182 (62.5) 155 (74.2)
(Source: Primary survey, Salem, 2010)
3.3. Analysis for factors associated with overweight:
As a first step in identifying the factors related to overweight and
abdominal obesity, a simple bivariate analysis for each variable estimating the unadjusted
odds ratio with 95 percent confidence interval and p value were noted. Those independent
variables found to be significant (p value less than 0.05) or nearly significant (p value less
than 0.1) were considered for the multiple logistic regression analysis in a stepwise
Body Mass Index =< 24.99 230 (46.0%)
Body Mass Index >= 25 270 (54.0%)

manner. In multiple logistic regressions a forward likelihood ratio (Forward LR) method
was used.
3.3.1. Bivariate analysis- for overweight as an independent variable
a. Socio demographic factors
Table 3.15. Socio-economic and demographic factors
Variable Overweight (%) Unadjusted OR
(95 % C.I)
p value
1.Age
< 35 yrs 45.4 1
> 35 yrs 66 2.341 (1.62-3.38) < .001
2.Religion
Others 53.4 1
Hindu 54.2 1.03 (0.68-1.56) 0.98
3.Caste
SC/ST 42.5 1
Others 56.2 1.73 (1.07-2.81) 0.024
4.Marital Status
Currently single 46.0 1
Married 56 1.50( 0.96-2.32) 0.09
5.Husband‟s education
<10 years of schooling 50.8 1
>10 years of schooling 58.0 1.34 (0.88-2.03) 0.19
6.Husband‟s Occupation
Daily labourer 47.5 1
Govt/private employed 54.6 0.32 (0.81-2.18) 0.26
Self employed 63.4 1.91 (1.18-3.10) <0.001

Socio-economic and demographic factors (contd..)
Variable Overweight(%) Unadjusted OR
(95% C.I)
p value
7.Respondent‟s Education
<10 years of schooling 48 1 0 .05
>10 years of schooling 57.4 1.46 (1.00-2.11)
8.Ever Pregnant
No 43.7 1
Yes 56.7 1.68 (1.08 - 2.61) 0.02
9.Number Of Pregnancies:
0 44.5 1
1-2 56.6 1.62 ( 1.04 - 2.52) 0.03
3+ 56.8 1.63 ( 0.93 - 2.88) 0.87
9.Occupation of respondent
Others * 50.6 1
Home makers 55.9 1.237 (0.86 – 1.79) 0.29
10.Wage earning among
women
Yes 48.2 1
No 58.1 1.5 ( 0.90 – 2.46) 0.15
11. Socio-economic status
Low 46.2 1
Middle 58.6 1.65 ( 1.12 – 2.42) 0.01
High 58.2 1.62 ( 0.92 – 2.86) 0.094
(Source: Primary survey, Salem, 2010)
*Government /private employed, student and day labourer

Among the socioeconomic and demographic variables considered, husband‟s
occupation, ever having been pregnant, parity as one or two and socio economic status
were found to be significantly associated with overweight status. Women of age above 35
years have increased odds of overweight more than any other factor by as much as two
times as compared to those below 35 years. Those who had been ever pregnant, whose
husband are self employed also had slightly increased risk of being overweight.
b.Physical activity
Physical activity was not found to be significantly associated with
overweight status.
Table 3.16. Association of physical activity with overweight
Variable Overweight
(%)
Unadjusted OR
(95 % C.I)
p value
Moderate + low 55.4 1
High 52.6 0.89 (0.63 – 1.27) 0.60
(Source: Primary survey, Salem, 2010)
c. Diet as a factor for overweight:
Consumption of chocolates and sweets were not found to be
associated with overweight status. The diet pattern was classified into three types namely
good, bad and intermediate. The classification for good diet was consumption of
sunflower oil plus consumption of sweets and chocolates less than one consumption per
month and consumption of bakery items less than 4 consumptions per month. The bad
diet includes consumption of oil other than sunflower oil and consumption of chocolates
and sweets more than 10 times and consumption of bakery items more than 15 times per
month.

Table 3.17. Association of diet with overweight:
Variable Overweight
(%)
Unadjusted OR
(95 % C.I)
p
value
Eating pattern
Chocolates and sweets/month
0-1 time 55.6 1
2-4 times 60.9 1.24 ( 0.76 – 2.02) 0.38
5-9 times 49.1 0.77 ( 0.48 – 1.25) 0.29
More than 10 times 49.5 0.786 (0.48- 1.28) 0.32
Bakery items per month*
0-4 54.1 1
5-9 53.7 0.98 ( 0.60- 1.62) 0.98
10-15 60.5 1.30 (0.79 – 2.14) 1.3
More than 15 times 48.5 0.80 ( 0.5 – 1.28 ) 0.79
Diet pattern
All good 66.2 1
Intermediate 52.7 0.30 ( 0.09-0.95) 0.041
All bad 37.5 0.57 ( 0.33 – 0.98) 0.045
Fruits and vegetables
> 1.5 servings 55.7 1
<1.5servings 52.5 0.87 ( 0.61 – 1.25) 0.53
Fasting
No 55 1
yes 50 0.81 ( 0.53- 1.26) 0.42
(Source: Primary survey, Salem, 2010)* Cakes, puffs, ice creams, fried chips

The intermediate diet consists of consumption of sunflower oil and consumption of
chocolates and sweets between 4 and 10 per month and consumptions of bakery items
between 4 and 15 per month. Since the consumption pattern of fruits and vegetable
together was less than 5 servings per day the median consumption pattern was taken as 1.5
and it was not found to be significantly associated with overweight.
d. Perception towards overweight:
The body image discrepancy score was found to be very
significantly associated with overweight status. Thus women who tend to think of
themselves as thinner than they actually weigh are more likely to be overweight as
compared to those who think of themselves as normal or above normal weight. It is
difficult to know the direction of this association whether the erroneous perception
precedes becoming overweight or vice versa. The health awareness scoring is explained in
the methodology chapter. Health awareness score was not found to be significantly
associated statistically with overweight status.
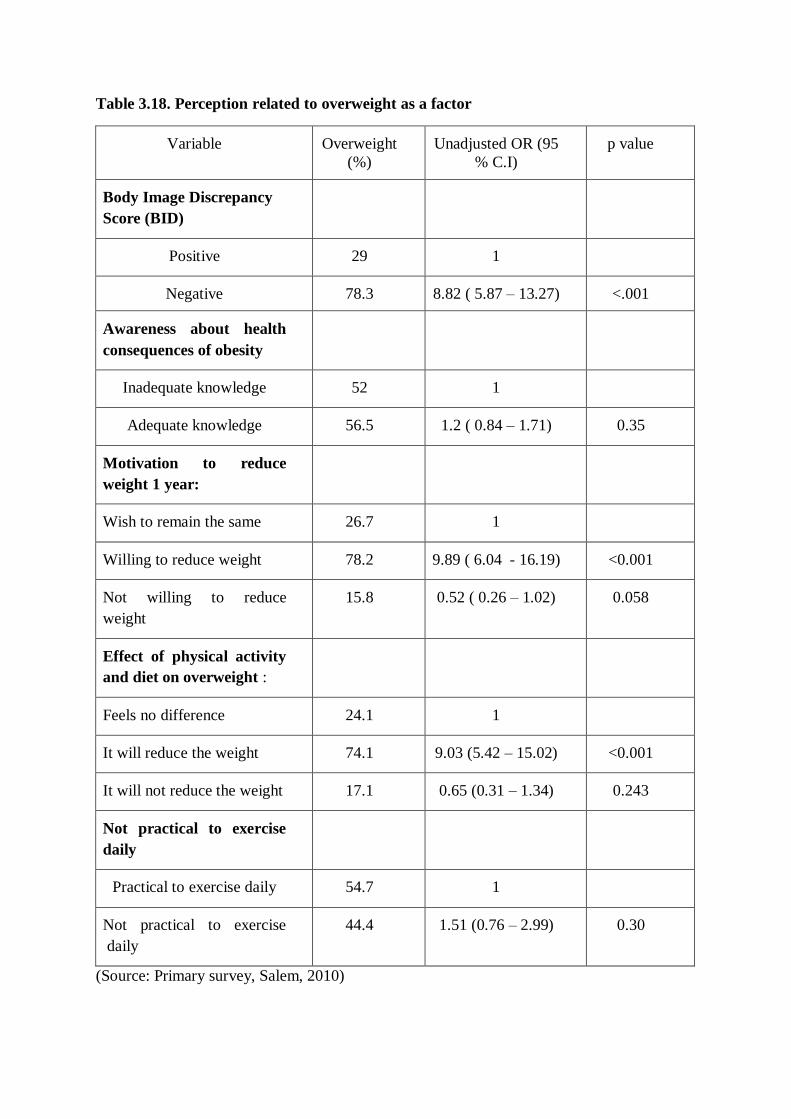
Table 3.18. Perception related to overweight as a factor
Variable Overweight
(%)
Unadjusted OR (95
% C.I)
p value
Body Image Discrepancy
Score (BID)
Positive 29 1
Negative 78.3 8.82 ( 5.87 – 13.27) <.001
Awareness about health
consequences of obesity
Inadequate knowledge 52 1
Adequate knowledge 56.5 1.2 ( 0.84 – 1.71) 0.35
Motivation to reduce
weight 1 year:
Wish to remain the same 26.7 1
Willing to reduce weight 78.2 9.89 ( 6.04 - 16.19) <0.001
Not willing to reduce
weight
15.8 0.52 ( 0.26 – 1.02) 0.058
Effect of physical activity
and diet on overweight :
Feels no difference 24.1 1
It will reduce the weight 74.1 9.03 (5.42 – 15.02) <0.001
It will not reduce the weight 17.1 0.65 (0.31 – 1.34) 0.243
Not practical to exercise
daily
Practical to exercise daily 54.7 1
Not practical to exercise
daily
44.4 1.51 (0.76 – 2.99) 0.30
(Source: Primary survey, Salem, 2010)
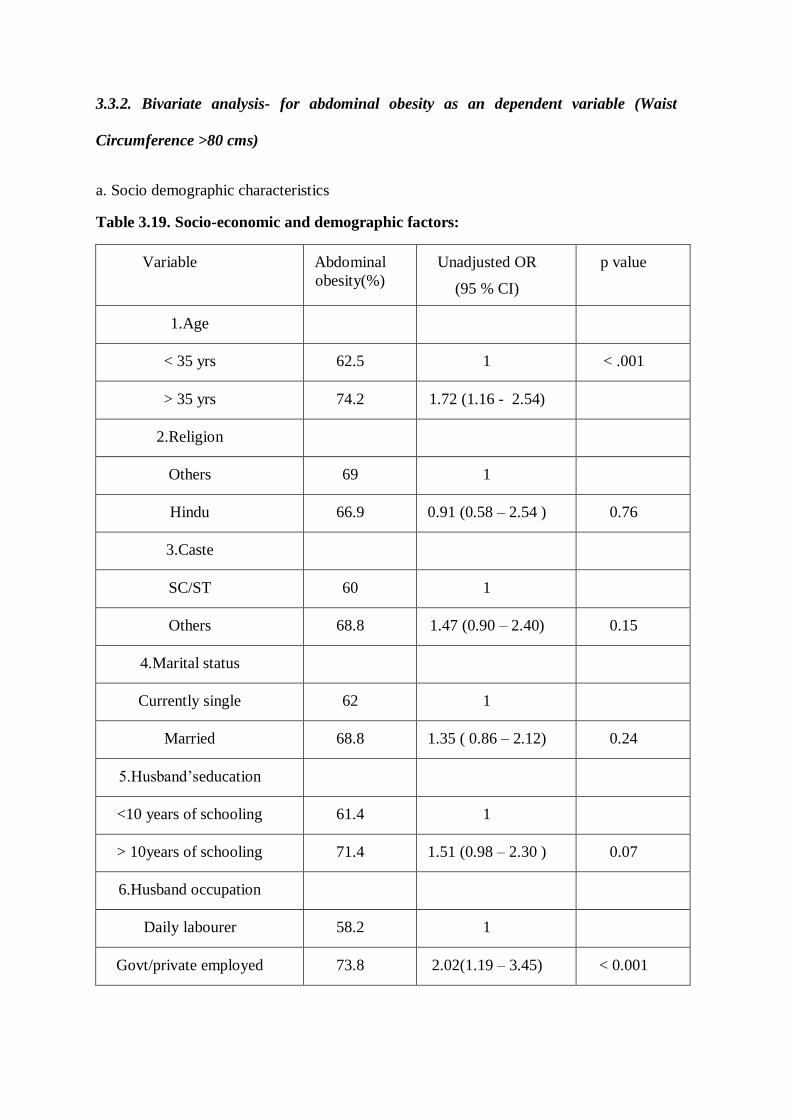
3.3.2. Bivariate analysis- for abdominal obesity as an dependent variable (Waist
Circumference >80 cms)
a. Socio demographic characteristics
Table 3.19. Socio-economic and demographic factors:
Variable Abdominal
obesity(%)
Unadjusted OR
(95 % CI)
p value
1.Age
< 35 yrs 62.5 1 < .001
> 35 yrs 74.2 1.72 (1.16 - 2.54)
2.Religion
Others 69 1
Hindu 66.9 0.91 (0.58 – 2.54 ) 0.76
3.Caste
SC/ST 60 1
Others 68.8 1.47 (0.90 – 2.40) 0.15
4.Marital status
Currently single 62 1
Married 68.8 1.35 ( 0.86 – 2.12) 0.24
5.Husband‟seducation
<10 years of schooling 61.4 1
> 10years of schooling 71.4 1.51 (0.98 – 2.30 ) 0.07
6.Husband occupation
Daily labourer 58.2 1
Govt/private employed 73.8 2.02(1.19 – 3.45) < 0.001
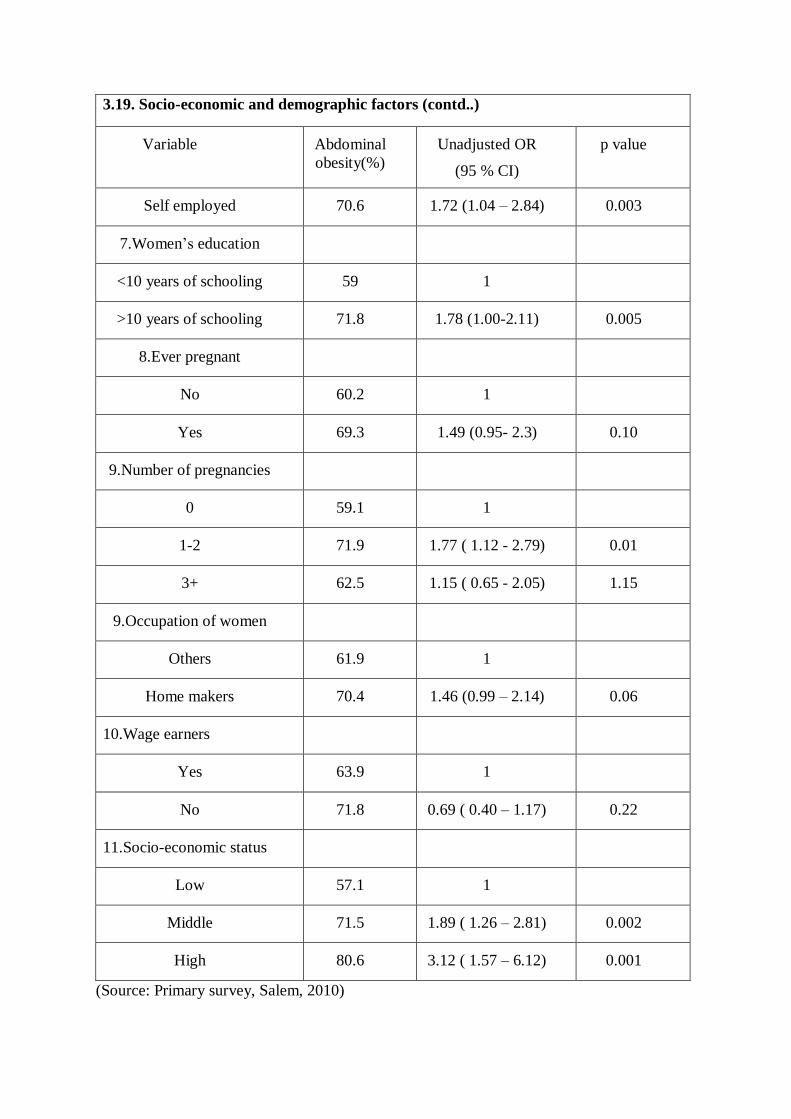
3.19. Socio-economic and demographic factors (contd..)
Variable Abdominal
obesity(%)
Unadjusted OR
(95 % CI)
p value
Self employed 70.6 1.72 (1.04 – 2.84) 0.003
7.Women‟s education
<10 years of schooling 59 1
>10 years of schooling 71.8 1.78 (1.00-2.11) 0.005
8.Ever pregnant
No 60.2 1
Yes 69.3 1.49 (0.95- 2.3) 0.10
9.Number of pregnancies
0 59.1 1
1-2 71.9 1.77 ( 1.12 - 2.79) 0.01
3+ 62.5 1.15 ( 0.65 - 2.05) 1.15
9.Occupation of women
Others 61.9 1
Home makers 70.4 1.46 (0.99 – 2.14) 0.06
10.Wage earners
Yes 63.9 1
No 71.8 0.69 ( 0.40 – 1.17) 0.22
11.Socio-economic status
Low 57.1 1
Middle 71.5 1.89 ( 1.26 – 2.81) 0.002
High 80.6 3.12 ( 1.57 – 6.12) 0.001
(Source: Primary survey, Salem, 2010)

As in case of overweight, age and husband‟s occupation had a statistically
significant association with abdominal obesity. In addition socio-economic status was also
found to have a statistically significant association with abdominal obesity. women over
35 years of age, who belonged to middle and higher socio-economic groups (Table 3.17)
and whose husbands are government employees or self-employed were at a higher risk of
abdominal obesity as compared to women below 35 years of age from the low socio-
economic group and whose husbands are labourers.
b. Diet:
Diet was not found to be significantly associated with abdominal
obesity.
Table 3.20. Association of diet with abdominal obesity
Variable Abdominal
obesity (%)
Unadjusted OR
(95 % C.I)
p value
Eating pattern
Chocolates and sweets per
month
0-1 time 67.3 1
2-4 times 72.2 1.26 ( 0.75 – 2.13) 0.38
5-9 times 63.4 0.84 ( 0.50 – 1.37) 0.50
More than 10 times 66.7 0.97 (0.58- 1.62) 0.91
Bakery items*
0-4 63.7 1
5-9 70.4 1.35 ( 0.75- 2.30) 0.26
10-15 77.2 1.93 (1.1 – 3.35) 0.02
More than 15 times 60.6 0.87 ( 0.5 – 1.42 ) 0.60
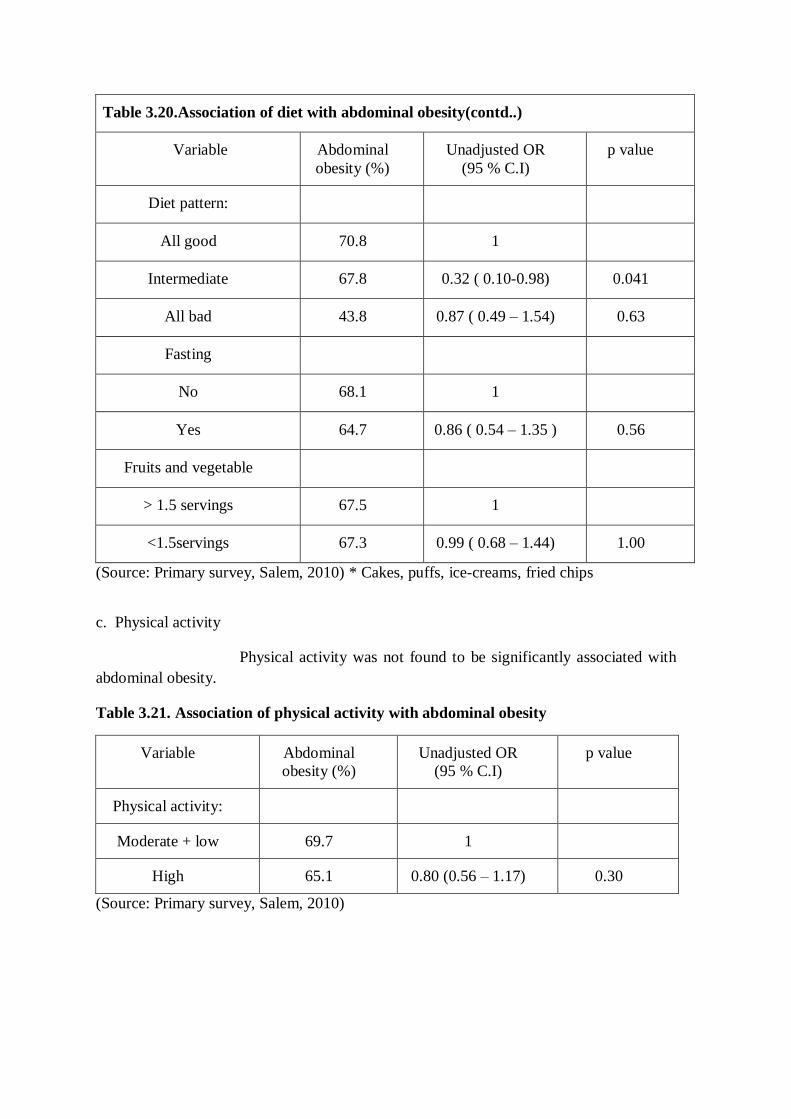
Table 3.20.Association of diet with abdominal obesity(contd..)
Variable Abdominal
obesity (%)
Unadjusted OR
(95 % C.I)
p value
Diet pattern:
All good 70.8 1
Intermediate 67.8 0.32 ( 0.10-0.98) 0.041
All bad 43.8 0.87 ( 0.49 – 1.54) 0.63
Fasting
No 68.1 1
Yes 64.7 0.86 ( 0.54 – 1.35 ) 0.56
Fruits and vegetable
> 1.5 servings 67.5 1
<1.5servings 67.3 0.99 ( 0.68 – 1.44) 1.00
(Source: Primary survey, Salem, 2010) * Cakes, puffs, ice-creams, fried chips
c. Physical activity
Physical activity was not found to be significantly associated with
abdominal obesity.
Table 3.21. Association of physical activity with abdominal obesity
Variable Abdominal
obesity (%)
Unadjusted OR
(95 % C.I)
p value
Physical activity:
Moderate + low 69.7 1
High 65.1 0.80 (0.56 – 1.17) 0.30
(Source: Primary survey, Salem, 2010)

3.4. Multivariate analysis (Binary logistic regression)
Multiple logistic regressions are carried out to estimate the
predictors related to overweight and abdominal obesity as given in the given table. The
analysis measures the effect of change in variation of one of the variable (independent) on
variation of the other variable (dependent) adjusted for the other independent variables in
the model. The purpose of the model is to understand how important both individually and
when acting together, the independent variable are for explaining the variation in the
dependent variable. The net bearing effect of the different independent variables is
explained in terms of Odds ratio (OR).
The model selected examined the changes in one outcome variable
(Overweight BMI >35kg/m2). The analysis was done by Forward stepwise (Likelihood
Ratio) model in SPSS for window version 15.0. Three variables were found to be
significantly associated with overweight.
It is found that age more than 35 years of age, husband‟s being self
employed and considering themselves as being thinner than they are, are factors
significantly associated with overweight status according to BMI.
Similarly, it is found that age more than 35 years of age, who
belong to middle or higher socio-economic groups are factors significantly associated with
abdominal obesity.

Table 3.22.Significant independent variables for overweight found in multivariate
analysis#
(Source: Primary survey, Salem, 2010)
Δ- Adjusted Odds Ratio *p value <0.05.
# Other independent variables used but not found significant are caste, marital status,
respondent‟s educations status, ever pregnant status and socio economic status.
VARIABLE ODDS RATIOΔ
ODDS RATIO (95%
C.I) P VALUE
LOWER
LIMIT
UPPER
LIMIT
1. Husband are
self employed 1.73 1.06 2.82 0.002*
2. Aged more
than 35 years 2.60 1.61 4.19 <0.001*
3. Who think
thinner than they
are actual
9.74 6.05 15.80 <.001*
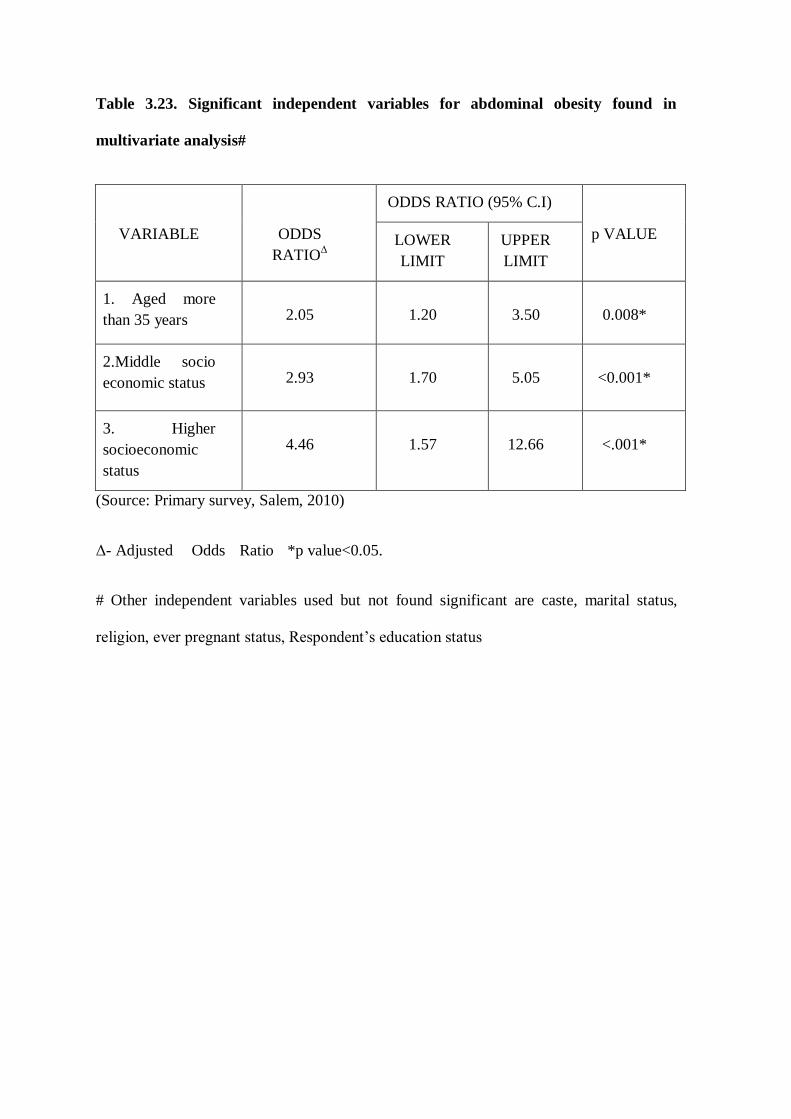
Table 3.23. Significant independent variables for abdominal obesity found in
multivariate analysis#
(Source: Primary survey, Salem, 2010)
Δ- Adjusted Odds Ratio *p value<0.05.
# Other independent variables used but not found significant are caste, marital status,
religion, ever pregnant status, Respondent‟s education status
VARIABLE ODDS
RATIOΔ
ODDS RATIO (95% C.I)
p VALUE LOWER
LIMIT
UPPER
LIMIT
1. Aged more
than 35 years 2.05 1.20 3.50 0.008*
2.Middle socio
economic status 2.93 1.70 5.05 <0.001*
3. Higher
socioeconomic
status
4.46 1.57 12.66 <.001*

CHAPTER-4
DISCUSSION AND CONCLUSION
4.1. DISCUSSION
The objective of the study was to find out the prevalence of
overweight among urban women (19-49 years) in Salem and to examine the factors
associated with overweight among them. This chapter is discusses the major findings in
the light of the existing literature. It is organised under three sections namely: sample
characteristics, prevalence of overweight and review of factors associated with
overweight.
4.1.1. Sample characteristics
Most of the respondents are married (80 percent) and 41.2 percent
of the women belonged to 19 and 30 age group. The mean age is 33.3 ± 8.42 years. Two
thirds of the sample population are home makers and among them 25.6 percent are
involved in earning wages through employment in the informal sector.
Around 50 percent of the respondents report high levels of physical
activity, but not a single person engaged in rigorous sports activity. Only two out of the
500 respondents consume the recommended levels fruits and vegetable of more than 5
servings per day. Though 75 percent of the population are consume meat and meat
products, 67.4 percent of them use sunflower oil for cooking which contains less saturated
fat. The interesting thing to note here is that overweight women tend to think that they are
thinner than their actual weight.
4.2. Prevalence of overweight:
The prevalence of overweight in the study population is 54 percent
which is four times more than the national figures (14.8 percent)(NFHS-3,2005) and more
than twice (24.4) (NFHS-3) for Tamil Nadu figures. The level of overweight among the
study population is high as compared to the prevalence of overweight among urban
Punjabi women which was found to 20 percent (2002)41
and very high when compared to
Naga tribal women of Manipur, where the prevalence is 9.8(2010).38
But when compared
to the study done in Mecheri, Salem district, where the prevalence of overweight was
found to be 47 percent (2009), the current study has shown higher levels.28
The current study has a prevalence of obesity (BMI>= 30 kg/m2)
as
21.6 percent. However this value seems to less when compared to studies among urban
Punjab women where the prevalence of obesity was 25.3(2002)41
and among Khatri
females in Uttar Pradesh where the prevalence rate was 23.1(2006)42
The rates of obesity
is also less when compared to studies from metropolitan cities like Delhi where the
prevalence of obesity is 33.4 percent (1994) and Hyderabad where prevalence was 36.3
(1995).38
It is interesting to note that while the prevalence of overweight in the present
study is many times higher than comparable Indian studies, prevalence of obesity is
actually lower. However, this also implies the potential for preventing overweight from
moving into obese category.
When compared to studies done in United Arab Emirates where
the obesity levels is around 45 percent(2010), it shows generalised prevalence rather than
concentrated in a small minority.43
When compared to countries like Senegal where the
prevalence of overweight and obesity is 22.3 percent and 8.3 percent(2010), the current
study seems to be high.44
Studies in Nigeria shows the prevalence of overweight as 17.4

percent and obesity as 8.8 percent.45
Thus the current study has prevalence rate which is
very less when compared to developed countries whereas it is higher when compared to
the other developing countries.
The prevalence of abdominal obesity (Waist Circumference >80
cms) in the current study population is around 70 percent. This is very high when
compared to study done by Deepa et al,(Chennai 2007) shows the prevalence of
abdominal obesity among South Indian urban women as 35.4 percent and study done by
Gupta et al, 2004 (waist circumference > 88cms) where the prevalence was among North
Indian urban women to be 44 percent.16
This is also very high when compared to 21.2
percent of abdominal obesity from the Senegal study.44
The present study has waist circumference mean, as 85.4 cms which
is very high when compared to a study done in Bangladesh, India, Vietnam, Indonesia
and Thailand where the mean waist circumference between 70-74 cms except Thailand
where the mean was 82.6 cms.46
With the recommendations made by the WHO expert consultation,
2004 where revised BMI cut off values were set for public health action, (that is BMI is
taken as 23.0 instead of 25and the various cut-off points set as BMI 27.5, 32.5, and 37.5
kg/m2 for the Asian population the levels of overweight and obesity are likely to increase
substantially forcing the public health professionals to work on war footing.

4.3. Factors related to overweight:
a. Socio-demographic characters:
In the current study, women of age more than 35 years are found to
be significantly associated with overweight. This finding is similar to a study done in
China and Nigeria where the rates of overweight was also higher among middle aged(45-
59) women.41,44
Similar findings are also found in India where women of age 40-49 have
12 times the risk of overweight when compared to women of age 15-1924
and similar
findings were found in a study in North India.35
From another study done in in
Bangladesh, India, Vietnam, Indonesia and Thailand Asian, where overweight increases
with age initially and then declines at the highest age group. 46
But since the study did not
involve older women (more than 49 years), this finding may not be significant in this
study.
Parity of women is found to very highly significant with
overweight especially with women who have 5 children or more35
it the current study it
was not found to be significant though women with 1-2 children were significantly
associated in the bivariate analysis. The sample size of women who have 5 children was
very less. Considering the falling fertility rates in Tamil Nadu to below replacement levels,
the questions on parity with 5 children is going to be more obsolete in the future.
The current study showed that Hindus are more likely to be
overweight but not statistically significant. In a study done in North India, the prevalence
is high among Sikh community and another study had Muslim and Sikh women to have
more tendency to gain weight.25,20
In the current study however the Muslim women were
not having increased prevalence due to small sample size.
The prevalence of overweight was high among the backward and
the forward caste when compared to Scheduled caste and Scheduled tribe in the current
study. A study done in North India(2004) found that women from backward class,
scheduled caste and scheduled tribe are less likely to gain weight.25
Such a similarity is not
the same in South India because of different social setting. In Salem, the backward caste
do not all belong to economically weaker sections and therefore only scheduled caste and
scheduled tribes had lower prevalence of underweight.
Women from higher socio economic status were found to be more
overweight among studies done in India20,25,35
In the current study the middle socio
economic status women are found to be more significantly associated in the bivariate
analysis, whereas women from higher socioeconomic status were not found to be
significant because of the smaller sample size.
By logistic regression the husband‟s occupation if self employed
remains as an important factor for overweight. However from the literature review there
are no such similar studies. Other studies have taken variables like Wealth Index and
Standard of living Index.25,20
Since there was a high correlation between the women‟s
education and the husband‟s education the variable was not used in logistic regression.
Women‟s education is correlated to overweight among studies done
in India and the in the Asian countries.25,46,35
Though it was found to significant in the
bivariate analysis, in the logistic regression it was not found to be significant. In a study
conducted in North India35
, self employed women were found to be more obese, but in the
current study most of the participants were homemakers, it was difficult to find similar
relationship

b. Physical activity
In a study done to find out the diet and physical activity among
Indian women it was found that women who were less involved in labour intensive chores
are likely to overweight.29
However in the current study it is found that the levels of
physical activity was around 50 percent which is very high which does not correlate with
overweight.
c .Dietary pattern:
The fruit and vegetable consumption among the entire study
population is below the recommended WHO levels (more than 5 servings of vegetable and
fruits). In a study done on the dietary pattern among Indian women it was found that
women who consumed daily fried food, sweets and ice cream items were found to have
higher prevalence of overweight.30
There was no reporting of ice cream or sweet
consumption daily among the study population. In the current study dietary pattern was
not found to be statistically significant.
d. Perceptions related to overweight:
Studies done in Africa45
have shown that white women tend to
perceive themselves as overweight in spite of being normal, whereas black woman tended
to think themselves as obese. In another study done in Bogalusa40
, the black women tend
to perceive themselves to be thinner than their actual weight whereas white women tend to
tend to think them heavier. In the current study, it is found that women are more likely to
resemble the African women in Bogalusa, who think they are thinner. This brings us an
interesting point whether women in Tamil Nadu tend to accept overweight as normal since
it can be culturally and socially acceptable among them.

4.4. Factors related to abdominal obesity:
A study done in China showed that abdominal obesity was higher
among middle aged women (45-59 years) when compared to younger women(19-44
years).47
Similar finding is found in the current study where waist circumference is high
among women more than 35 years of age.
4.5. Strengths of the study:
This study looks into the perspective aspects related to overweight
which are a lacking in studies done related to overweight in India. All the anthropometric
measurements were taken by the principal investigator to avoid observer bias. Since the
study is of cross- sectional type, all drawbacks of the study including temporality can be
an issue. The pamphlet given to the respondents after the interview schedule had an easy
to read BMI chart. The respondent‟s height and weight was written in the pamphlet and
were immediately told where they stood in the BMI status using the chart. This could be
later used at homes where they can monitor their weight at regular intervals and take
necessary steps. This helped many women to understand about BMI and its importance.
4.2. Limitations of the study:
Many women from higher socioeconomic status refused to
participate in the study. Information on diet was not captured in detail. The consumption
patterns of few food items were asked and few participants had difficulty in answering
them. In the physical activity section, there were questions related to severe recreational
activity which had no response from the participants.
4.3. Conclusion and recommendations
Overweight which was earlier only in the high and very high
income countries is spreading to the low and middle income countries. In countries like
India, the rates of under nutrition are decreasing along with increase in the number of
overweight and obese women. The change in our lifestyle has also health implications
including chronic disease like diabetes, hypertension and cancer. The problem of chronic
disease is largely neglected. Since lifestyle diseases are developed during the course of
one‟s life, changes in lifestyle can be made possible. The government should focus on the
changing scenario from under nutrition to overweight and should frame policies focusing
on women as the prevalence rates are high among women.
The levels of overweight, obesity and abdominal obesity among
women aged 19-49 years in urban setting of Salem is high. With increasing levels of
modernization the levels are only likely to increase. Most factors related to overweight in
the study ( age , husband‟s occupation) are not modifiable but perceptions where women
despite being fatter consider themselves to be thin can be changed. This can be a potential
intervention point wherein women are alerted to their overweight status fairly early when
weight reduction may be easier. Thus the solution is easier said than done. Measures for
lifestyle change should begin early as elderly women are more likely to increase in weight.
The fruit and vegetable consumption among the study population is
low than the WHO recommended levels (More than 5 servings per day). The reasons are
more likely to be socially related where women in the household who consume less fruits
and vegetables when compared to other family members. Another reason is that the high
cost of fruits and vegetables which are beyond the reach of lower socio economic status.

Hence the government can subsidize the prices of vegetables and fruits so that people can
consume them daily.
The current study shows that women who are overweight consider
themselves as thin. These perceptions related to overweight among women has to change
considerably. Effective use of media like newspaper, television can be used for educating
women about adverse health effects of obesity.
Since child birth is attributed as one of the reasons for increase in
weight, women should be educated about post partum exercises which should be ideally
taught before the mother is discharged from the hospital. Follow up can be done when the
mother visits the clinic with the child for immunization. Along with the immunization card
for the child a card for the mother can also be given. Doctor can advise women who are
unable to maintain their weight.
The read to use BMI chart used at the end of the interview schedule
in the study had many women to know about Body Mass Index (BMI) using height and
weight. Simple interventions such as this can be popularized among women so that they
can be readily used at home for regular monitoring of their BMI. Physicians thus have an
important role to play in alerting women about overweight status.
Since many women felt that it is practically not possible for them to
exercise daily, establishments of „women friendly spaces‟ in parks should be established.
The self help groups (SHG) in urban areas in Tamil Nadu can engage themselves in such
work by providing suitable facilities and support group.
Since very few studies related to perception about overweight is
done in India, the future studies should not concentrate not only on the quantitative aspects
but also on the qualitative methods so that people friendly policies related to overweight
can be framed.
Many participants had difficulty in answering questions related to
physical activity. Questions related to severe recreational activity had no response as most
of the Indian women are not likely to be involved in such activities. Hence a more
practical and easy tool for measuring physical activity needs to developed.
Similarly there needs to a tool developed for diet. In the present
study the consumptions of few food items were asked. Some participants found difficulty
in answering them. Hence a tool needs to be developed for Indian setting.
Waist circumference can also be used to measure abdominal obesity
as Indians also tend to have excess body fat, abdominal and truncal adiposity 20
which may
be more appropriate for measurement of obesity among Indians.
References:
1. WHO (World Health Organization).The World Health Report: Reducing Risks,
Promoting Healthy Life. Geneva: World Health Organization, 2002.
2. WHO (World Health Organization).Obesity: Preventing and Managing the Global
Epidemic. Report of WHO Consultation on Obesity, 1998.
3. WHO (World Health Organization). Diet, Nutrition and the Prevention of Chronic
Diseases. Report of a joint WHO/FAO Expert consultation, Technical Report
Series No. 916. Geneva: World Health Organization, 2003.
4. WHO (World Health Organization), International Association for the Study of
Obesity (IASO) and International Obesity Task Force (IOTF). The Asia-
Pacific Perspective: Redefining Obesity and its Treatment. Geneva: World Health
Organization, 2000.
5. Popkin B.M. The shift in stages of the nutritional transition in the developing
world differs from past experiences, Public Health Nutrition, 2002; 5 (1A): 205–
214.
6. Drewnowski A, Popkin B.M. The nutrition transition: New trends in the global
diet. Nutrition Reviews 1997; 55(2): 31–43.
7. Popkin, B.M. Nutrition in transition: The changing global nutrition challenge,
Asia Pacific Journal of Clinical Nutrition 2001; 10 (Suppl): S13–S18.
8. Popkin, B.M., Horton D, Kim S, Mahal A, Shuigao J. Trends in diet, nutritional
status, and diet-related non-communicable diseases in China and India: The

economic costs of the nutrition transition, Nutrition Review 2001;59 12: 379–
390.
9. Bell A.C, Popkin B M.The road to obesity or the path to prevention: Motorized
transportation and obesity in China, Obesity Research 2002; 10(4), 277–283.
10. Popkin B.M.The nutrition transition and its health implications in lower-income
countries,Public Health Nutrition 1998; 1: 5–21.
11. Clement, K. and P. Ferre. Genetics and patho-physiology of obesity. Pediatr Res
2003; 53(5): 721-725.
12. WHO (World Health Organization) Preventing Chronic Diseases: A vital
investment .WHO Geneva,2005.
13. 3four50 website address: http://3four50.com/ accesed on 24/03/2010
14. Horton.R. The neglected epidemic of chronic disease. The Lancet, 2005; 366:1514.
15. Reddy KS, Shah B, Varghese C, Ramadoss A. Responding to the threat of chronic
disease in India. The Lancet, 2005; 140: 6736-6743.
16. Misra A, Khurana L. Obesity and the Metabolic Syndrome in Developing
Countries. J Clin Endocrinol Metab, November 2008, 93(11):S9–S30.
17. Roth J, Qiang X, Marban S L, Redett H, Lowell C B. The Obesity pandemic:
where have we been and where are we going. Obesity research, 2004;12: 88S-
101S.
18. Prentice A M. The emerging epidemic of obesity in developing countries.
International Journal of Epidemiology,2006;35:93–99
19. James PT, Leach R, Kalamara E, Shayeghi M. The worldwide obesity epidemic.
Obes Res 2001; 9 (suppl 4): 228S-233S.
20. Garg C, Khan S A,Ansari S H, Garg M. Prevalence of obesity in Indian women.
Obesity Reviews, 2009; 11:105-108.
21. WHO (WORLD HEALTH ORGANISATION). Obesity: preventing and managing
the global epidemic. WHO Obesity Technical Report series 894,(Geneva, 2000).
22. Redefining Obesity:The Asia-Pacific perspective.World Health
Organisation.Western Pacific Region. International Association for study of
obesity. February, 2000.
23. UNITED NATIONS SYSTEM. Standing Committee on Nutrition. Overweight and
obesity. Number 29.2004-05.
24. International Institute for Population Sciences & ORC Macro. Third National
Family Health Survey. IIPS: Mumbai, 2006
25. Agarwal P, Mishra V. Covariates of overweight and obesity among women in
North India. Working paper. East-West centre. Population and health series
January, 2004. Series 116.
26. Shukla H C, Gupta P C, Mehta H C, Hebert J H. Descriptive epidemiology of body
mass index of an urban adult population in western India. J Epidemiol Community
Health 2002;56:876–880
27. Tiwari R, Srivastava D, Gour N. A Cross-sectional Study to determine Prevalence
of Obesity in High Income Group Colonies of Gwalior City. Indian Journal of
Community Medicine, 2009;34 :218-222.
28. Parimalavalli R, Vijayalakshmi A, RadhaiSri S. Anthropometric Profile and
Nutrient Intake of Overweight/Obese Women. J Hum Ecol 2009; 26(2): 131-135.
29. Dalton M, Cameron A J ,Zimmet P Z ,Shaw J E ,Jolley D, Dunstan D W,Welborn
T A. Waist circumference, waist–hip ratio and body mass index and their
correlation with cardiovascular disease risk factors in Australian adults. Journal of
Internal Medicine 2003; 254: 555–563.
30. Agrawal P. Role of Lifestyle and Diet in Emerging Obesity among Indian Women
and its Impact upon their Health Status. Paper for the Oral Presentation in
INTERNATIONAL POPULATION CONFERENCE Tours, France 18-23 July
2005.
31. Ismail, M.N, Chee S S, Nawawi H, Yusoff K, Lim T O, James W P.Obesity in
Malaysia”, Obesity Review,2002. 3(3): 203-8.
32. Filizof C,Gonzalez C, Sereday M, Mazza J and Braguinsky J.Obesity prevalence
and trends in Latin American countries. Obesity Research, 2001. 2(2): 99-106.
33. Gopinath, N, Chadha S L,Jain P, Shekhawat S, Tandon R. An epidemiological
study of obesity in adults in the urban population of Delhi. The Journal of the
Association of Physicians of India, 1994. 42 (3): 212–215.
34. Misra, A, Pandey R.M,Devi J.R , Sharma R, Vikram N.K., and Khanna N. High
prevalence of diabetes, obesity and dyslipidaemia in urban slum population in
northern India, International Journal of Obesity and Related Metabolic Disorders
,2001.25 (11): 1722–1729.

35. Reddy K.S, Prabhakaran D, Shah P, Shah B. Differences in body mass index and
waist:hip ratio in North Indian rural and urban populations. Obesity reviews 2002;
3:197–202.
36. Agrawal P K. Emerging Obesity in Northern Indian States: A Serious threat for
Health. Paper for presentation at the IUSSP Conference on Bangkok, June 10-12,
2002
37. Holdsworth M,Gartner A,Landais E,Maire B,Delpeuch F. Perceptions of healthy
and desirable body size in urban Senegalese women. International Journal of
Obesity, 2004; 28:1561–1568.
38. Nicolaou M, Doak C, Dam R, Hosper K, Seidell J. Body size preference and body
weight perception among two migrant groups of non-Western origin. Public Health
Nutrition, 2008; 11(12): 1332–1341.
39. Faber M, Salome Kruger H. Dietary Intake,Perceptions regarding weight and
attitudes toward weight control of normal weight,overweight and obese black
females in rural village in South Africa. Ethnicity & Disease 2005; 240-245.
40. Bhuiyan,J. Gustat, S, Srinivasan R, Berenson G S. Differences in Body Shape
Representations among Young Adults from a Biracial (Black-White), Semirural
Community. Am J Epidemiol ,2003;158:792–797
41. Sidhu S, Tatla H K. Prevalence of Overweight and Obesity among Adult Urban
Females of Punjab: A Cross-Sectional Study. Anthropologist Special Issue, 2002;
1: 101-103.

42. Mungreiphy N K, Kapoor S. Socio economic changes as covariates of overweight
and obesity among Tanghkul Naga Tribal Women of Manipur,North-East India. J.
Biosoc. Sci, 2010; 42; 289–305.
43. Trainer S S.Body Image, Health, and Modernity: Women‟s Perspectives and
Experiences in the United Arab Emirates. Asia-Pacific Journal of Public Health,
2010; 22(3):60S-67S.
44. Macia E, Duboz P and Gueye L Prevalence of obesity in Dakar. Obesity reviews,
2010; 11:691–694.
45. Olatunbosun S T, Kaufman J S, Bella A F.Prevalence of obesity and overweight in
urban adult Nigerians. Obesity reviews, 2010; 1467-789.
46. Razzaque A, Nahar L, Minh H V, Nawi N G,Juvenkar S,Ashraf A,Ahmed S M,
Soonthornthada K et al. Social factors and overweight: evidence from nine Asian
INDEPTH Network sites. Global Health Action, 2009; 54-59.
47. Xin Ying X, Song Z, Zhao C, Jiang Y. Body mass index, waist circumference, and
cardiometabolic risk factors in young and middle-aged Chinese women. J Zhejiang
Univ-Sci B (Biomed & Biotechnol), 2010;11(9):639-646.
48. Ard J D, Greene L F, Malped C Z, Jefferson W K. Association between body
image disparity and culturally specific factorsthat affect the weight in Black and
White women. Ethnicity & Disease,Spring 2007;17:34S-39S.
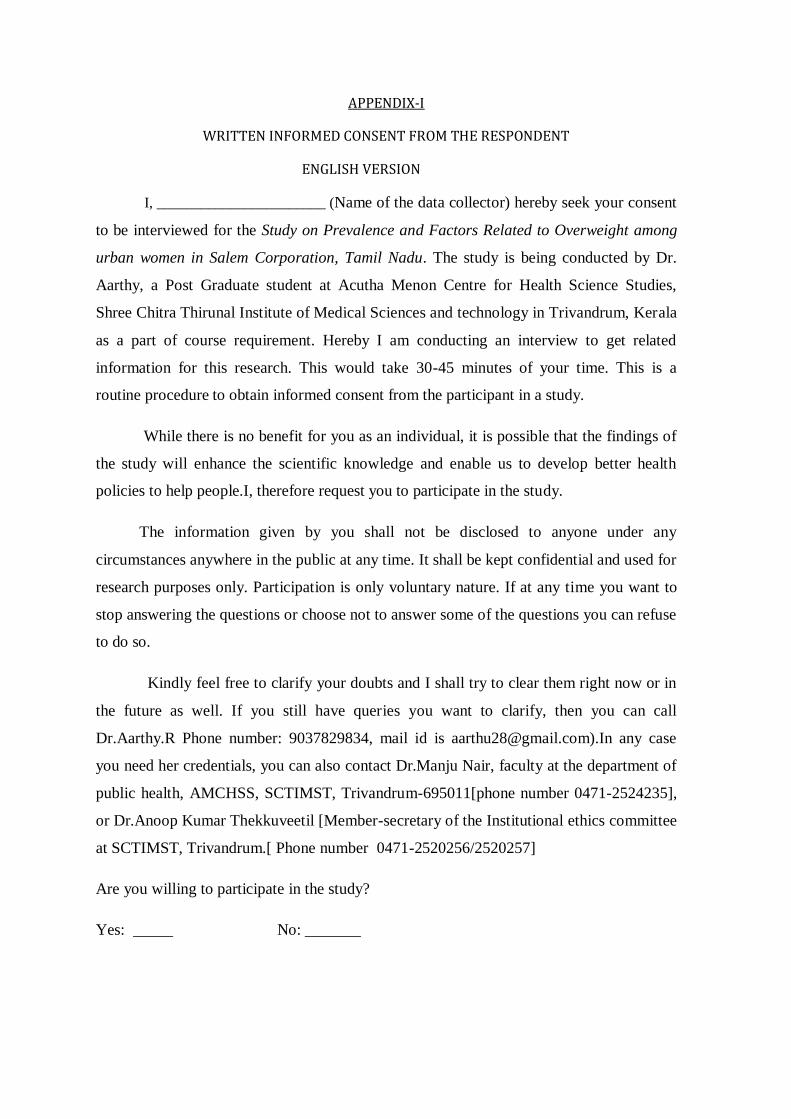
APPENDIX-I
WRITTEN INFORMED CONSENT FROM THE RESPONDENT
ENGLISH VERSION
I, _______________________ (Name of the data collector) hereby seek your consent
to be interviewed for the Study on Prevalence and Factors Related to Overweight among
urban women in Salem Corporation, Tamil Nadu. The study is being conducted by Dr.
Aarthy, a Post Graduate student at Acutha Menon Centre for Health Science Studies,
Shree Chitra Thirunal Institute of Medical Sciences and technology in Trivandrum, Kerala
as a part of course requirement. Hereby I am conducting an interview to get related
information for this research. This would take 30-45 minutes of your time. This is a
routine procedure to obtain informed consent from the participant in a study.
While there is no benefit for you as an individual, it is possible that the findings of
the study will enhance the scientific knowledge and enable us to develop better health
policies to help people.I, therefore request you to participate in the study.
The information given by you shall not be disclosed to anyone under any
circumstances anywhere in the public at any time. It shall be kept confidential and used for
research purposes only. Participation is only voluntary nature. If at any time you want to
stop answering the questions or choose not to answer some of the questions you can refuse
to do so.
Kindly feel free to clarify your doubts and I shall try to clear them right now or in
the future as well. If you still have queries you want to clarify, then you can call
Dr.Aarthy.R Phone number: 9037829834, mail id is [email protected]).In any case
you need her credentials, you can also contact Dr.Manju Nair, faculty at the department of
public health, AMCHSS, SCTIMST, Trivandrum-695011[phone number 0471-2524235],
or Dr.Anoop Kumar Thekkuveetil [Member-secretary of the Institutional ethics committee
at SCTIMST, Trivandrum.[ Phone number 0471-2520256/2520257]
Are you willing to participate in the study?
Yes: _____ No: _______
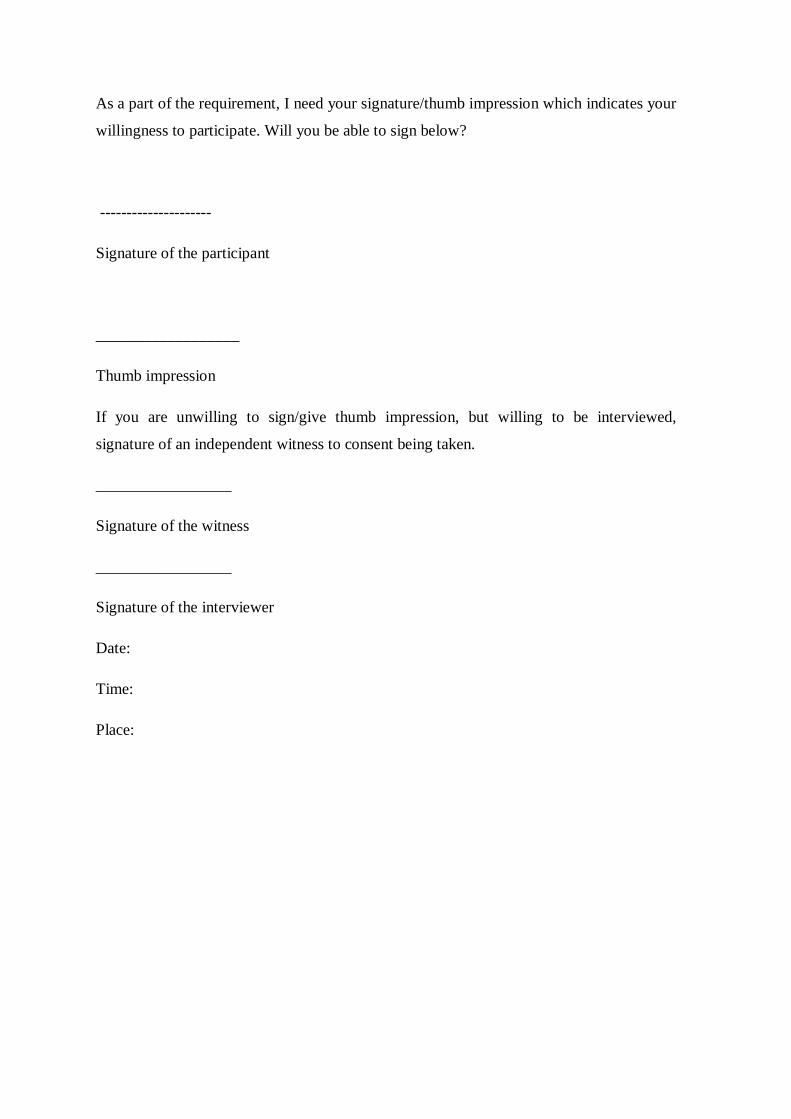
As a part of the requirement, I need your signature/thumb impression which indicates your
willingness to participate. Will you be able to sign below?
---------------------
Signature of the participant
__________________
Thumb impression
If you are unwilling to sign/give thumb impression, but willing to be interviewed,
signature of an independent witness to consent being taken.
_________________
Signature of the witness
_________________
Signature of the interviewer
Date:
Time:
Place:

A STUDY ON THE PREVALANCE AND FACTORS RELATED TO OVERWEIGHT
AMONG URBAN WOMEN (19-49 years) IN SALEM ,TAMILNADU.
WARD NO HOUSE NUMBER DATE
COLLECTED BY _________________
SECTION.1 : SOCIO-DEMOGRAPHIC DETAILS
INFORMATION CODE COMMENTS
1. IDENTITY NUMBER
2. AGE ( in completed years) _________ (years)
3. RELIGION 1.HINDU
2.CHRISTIAN
3.MUSLIM
4.OTHERS (SPECIFY) ______
4. CASTE 1.FORWARD
2.BACKWARD
3.SCHEDULED CASTE
4.SCHEDULED TRIBE
5. MARITAL STATUS 1.UNMARRIED
2.MARRIED
3.WIDOWED
4.DIVORCED/SEPARATED
IF 1
THEN
SKIP TO
10
6. What is your husband‟s education?
__________________(specify)
7. What is your husband‟s occupation?
1..GOVERNMENT EMPLOYED
20
10
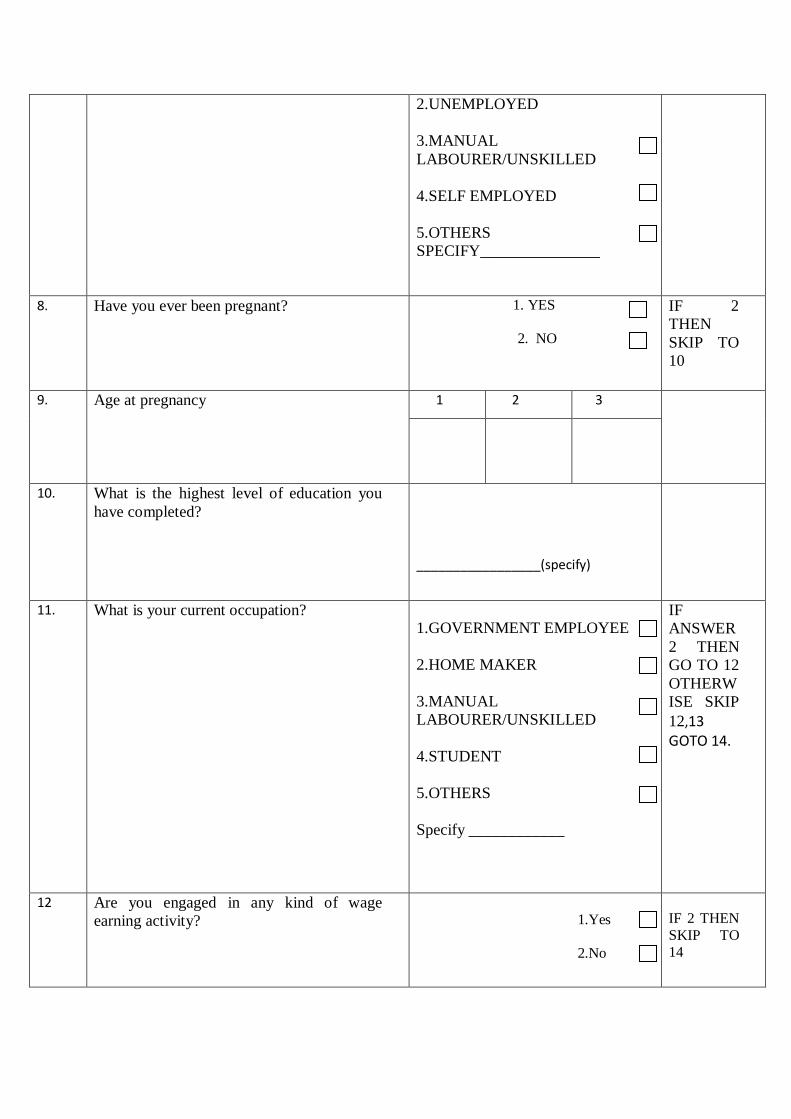
2.UNEMPLOYED
3.MANUAL
LABOURER/UNSKILLED
4.SELF EMPLOYED
5.OTHERS
SPECIFY_______________
8. Have you ever been pregnant? 1. YES
2. NO
IF 2
THEN
SKIP TO
10
9. Age at pregnancy 1 2 3
10. What is the highest level of education you
have completed?
_________________(specify)
11. What is your current occupation?
1.GOVERNMENT EMPLOYEE
2.HOME MAKER
3.MANUAL
LABOURER/UNSKILLED
4.STUDENT
5.OTHERS
Specify ____________
IF
ANSWER
2 THEN
GO TO 12
OTHERW
ISE SKIP
12,13 GOTO 14.
12 Are you engaged in any kind of wage
earning activity?
1.Yes
2.No
IF 2 THEN
SKIP TO
14

13 What types of wage earning activity are you
engaged?
____________(specify)
14 Economic status (subjective assessment)
1.Low
2. Medium
3.High
SECTION 2: PHYSICAL ACTIVITY
PART 1: Job /house work –related physical activity. Next I am going to ask you about the time you spend
doing different types of physical activity in a typical week. Please answer these questions even if you do not
consider yourself to be a physically active person.
Think first about the time you spend doing work. Think of work as the things that you have to do
such as paid or unpaid work, study/training, household chores, harvesting food/crops, seeking employment.
In answering the following questions 'vigorous-intensity activities' are activities that require hard
physical effort and cause large increases in breathing or heart rate, 'moderate-intensity activities' are activities
that require moderate physical effort and cause small increases in breathing or heart rate.
P1 Does your work involve vigorous-intensity
activity that causes large increases in
breathing or heart rate like [carrying or
lifting heavy loads, digging or construction
work] for at least
10 minutes continuously?
1. YES
2. NO
Source: GPAQ
questionnai
re.
IF 2 THEN GO
TO P4
P2 In a typical week, on how many days do you
do vigorous-intensity activities as part of
your work?
Number of days
P3 (a-b)
How much time do you spend doing
vigorous-intensity activities at work on a
typical day?
Hours : minutes
└─┴─┘: └─┴─┘
hrs mins
P4 Does your work involve moderate-intensity
activity that causes small increases in
breathing or heart rate such as brisk walking
[or carrying light loads] for at least 10
minutes continuously?
1. YES
2. NO
IF 2
THEN
GOTO P7

P5 In a typical week, on how many days do you
do moderate-intensity activities as part of
your work?
Number of days
P6 (a-b)
How much time do you spend doing
moderate-intensity activities at work on a
typical day?
Hours : minutes
└─┴─┘: └─┴─┘
hrs mins
Travel to and from places: The next questions exclude the physical activities at work that you have already
mentioned.
Now I would like to ask you about the usual way you travel to and from places. For example to work, for
shopping, to market, to place of worship. [insert other examples if needed]
P7 Do you walk or use a bicycle (pedal cycle)
for at least 10 minutes continuously to get to
and from places?
1. YES
2. NO
IF 2
THEN
GOTO
P10
P8 In a typical week, on how many days do you
walk or bicycle for at least 10 minutes
continuously to get to and from places?
Number of days
P9 (a-b)
How much time do you spend walking or
bicycling for travel on a typical day?
Hours : minutes
└─┴─┘: └─┴─┘
hrs mins
Recreational activities The next questions exclude the work and transport activities that you have already
mentioned.
Now I would like to ask you about sports, fitness and recreational activities (leisure), [insert relevant terms].
P10 Do you do any vigorous-intensity sports,
fitness or recreational (leisure) activities
that cause large increases in breathing or
heart rate like [running or football,] for at
least 10 minutes
Continuously?
1. YES
2. NO
IF 2
THEN
GOTO
P13
P11 In a typical week, on how many days do
you do vigorous-intensity sports, fitness or
recreational (leisure) activities?
Number of days
P12
(a-b)
How much time do you spend doing
vigorous-intensity sports, fitness or
recreational activities on a typical day?
Hours : minutes
└─┴─┘: └─┴─┘
hrs mins
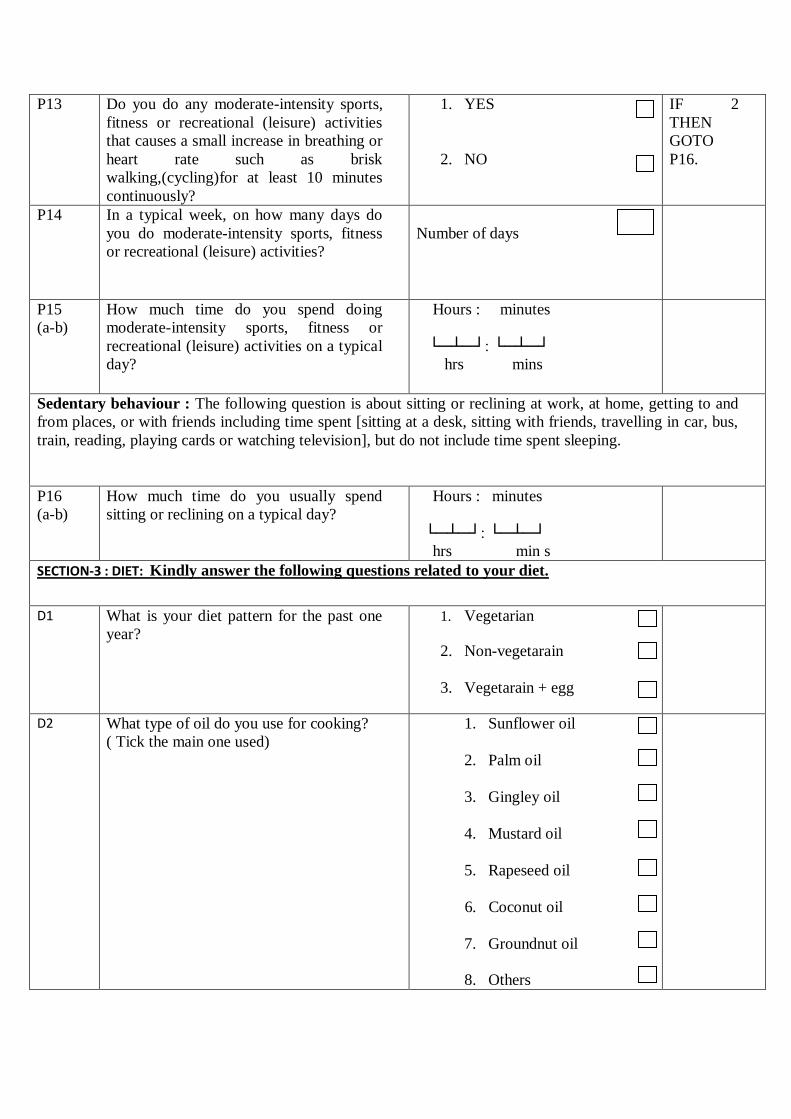
P13 Do you do any moderate-intensity sports,
fitness or recreational (leisure) activities
that causes a small increase in breathing or
heart rate such as brisk
walking,(cycling)for at least 10 minutes
continuously?
1. YES
2. NO
IF 2
THEN
GOTO
P16.
P14 In a typical week, on how many days do
you do moderate-intensity sports, fitness
or recreational (leisure) activities?
Number of days
P15
(a-b)
How much time do you spend doing
moderate-intensity sports, fitness or
recreational (leisure) activities on a typical
day?
Hours : minutes
└─┴─┘: └─┴─┘
hrs mins
Sedentary behaviour : The following question is about sitting or reclining at work, at home, getting to and
from places, or with friends including time spent [sitting at a desk, sitting with friends, travelling in car, bus,
train, reading, playing cards or watching television], but do not include time spent sleeping.
P16
(a-b)
How much time do you usually spend
sitting or reclining on a typical day?
Hours : minutes
└─┴─┘: └─┴─┘
hrs min s
SECTION-3 : DIET: Kindly answer the following questions related to your diet.
D1 What is your diet pattern for the past one
year?
1. Vegetarian
2. Non-vegetarain
3. Vegetarain + egg
D2 What type of oil do you use for cooking?
( Tick the main one used)
1. Sunflower oil
2. Palm oil
3. Gingley oil
4. Mustard oil
5. Rapeseed oil
6. Coconut oil
7. Groundnut oil
8. Others

________(specify)
D3 In a typical week, on how many days do
you eat fruit?
Number of days
IF ZERO
THEN
GOTO D5
D4 How many servings of fruit do you eat on
one of those days?
Number of servings
D5 In a typical week, on how many days do
you
eat vegetables?
Number of days
IF ZERO
THEN
GOTO D7
D6
How many servings of vegetables do you
eat on one of those days?
Number of servings
D7 On average, how many meals per week do
you eat that were not prepared at a home?
By meal, I mean breakfast, lunch and
dinner.
Number of days
In a typical month how often do you consume the following (actual number of consumption). Mark according
to the actual number of the consumptions.
D8
Food item
Daily
weekly
Monthly
Never
More Comments
1.Milk
2.Eggs
3.sweets

4.cold drinks
5.Bakery
bicuits/biscui
ts
6.puffs/burge
rs/pizzas
7.Ice cream
8.sweets
9.chocolates
10.Any fried
Chips
11.cakes/past
ries/ jams
D9
Do you usually fast?
1. YES
2. NO
IF 2
THEN GO
TO
SECTION
4
D.10
How often do you fast?
a.______ days/month
SECTION 4: KNOWLEDGE, ATTITUDE AND PERCEPTION: The following are questions related to your perception,
knowledge and attitude related to overweight. Answer the following question below.
4a. FIGURE RATING SCALE:

(Adapted from the paper by A. R. Bhuiyan, J. Gustat, S. R. Srinivasan, and G. S. Berenson,
Differences in Body shape representations among Young adults from a biracial (Black-
white),semirural community, American Journal of Epidemiology, 2003)
C.1 How do you perceive your body weight
at present?
1.Normal weight
2.Under weight
3.Overweight
4.Obese
C2 In the picture given below select the
number/figure that matches most closely
with you? (select any of the nine
pictures)
C3 How would you ideally like to look?
(select any of the nine pictures)
C4 How would you like to be in the next 1
year?
(select any one of the pictures)

C5 What would you look like if you
exercised regularly? (select any one of
the pictures)
C6 What would you look like if you
followed a healthy diet? (select any one
of the nine pictures)
C7 What would you look if you exercised
and followed a healthy diet? (select any
of the nine pictures)
C8 According to you, what would be the
major barriers in trying to achieve this?
1._____________ 2._____________ 3.______________
4 b. Perception related to thinness
C9 Modern clothes are worn by thin people
1.Agree
2.Disagree
3.Dont know
C10 Thin people are not beautiful
1.Agree
2.Disagree
3.Dont know
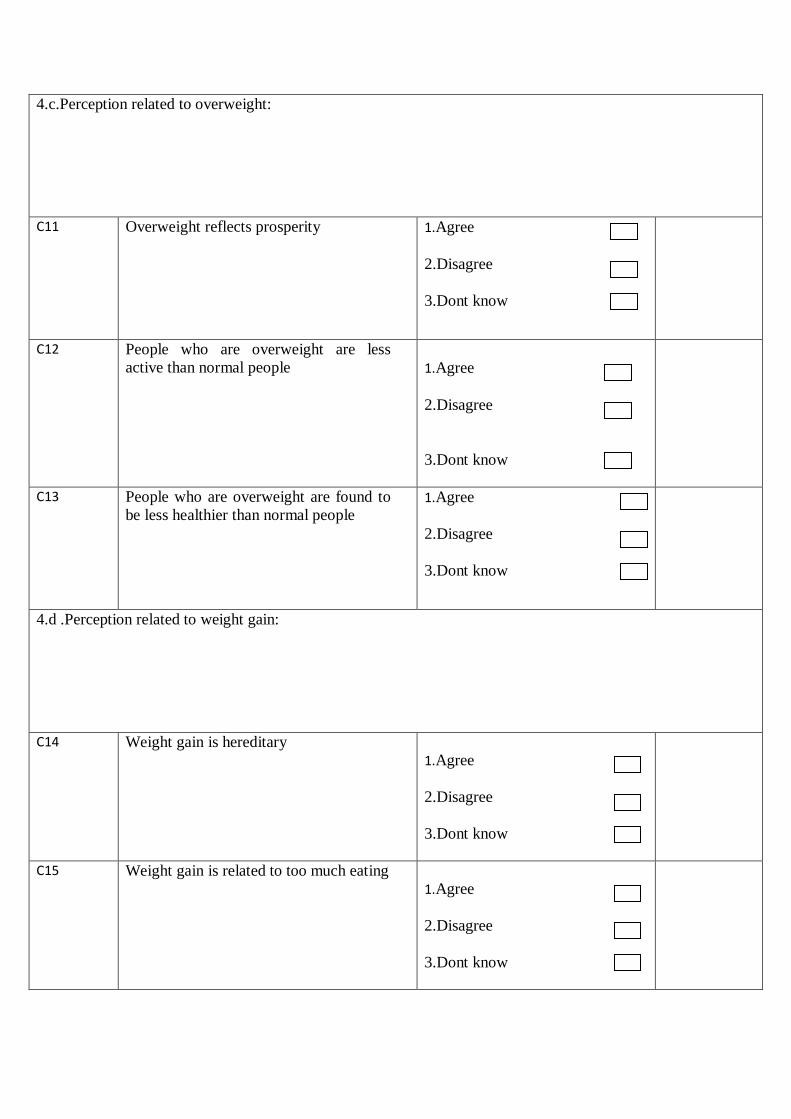
4.c.Perception related to overweight:
C11 Overweight reflects prosperity
1.Agree
2.Disagree
3.Dont know
C12 People who are overweight are less
active than normal people
1.Agree
2.Disagree
3.Dont know
C13 People who are overweight are found to
be less healthier than normal people
1.Agree
2.Disagree
3.Dont know
4.d .Perception related to weight gain:
C14 Weight gain is hereditary
1.Agree
2.Disagree
3.Dont know
C15 Weight gain is related to too much eating
1.Agree
2.Disagree
3.Dont know

C16 What according to you are the three main
reasons for increase in weight?
1.___________ 2.___________ 3.___________
4 e. Perceptions related to weight control
C17 One has to eat expensive food to lose
weight
1.Agree
2.Disagree
3.Dont know
C18 If one exercises daily, one feels healthy
1.Agree
2.Disagree
3.Dont know
C19 It is not practical for a woman to exercise
daily
1.Agree
2.Disagree
3.Dont know
4.f. Knowledge related to overweight
C20 What according to you are the three
adverse health conditions related to
overweight
1.________ 2.________ 3.________
C21 Does overweight causes

a. Hypertension
b. Heart diseases
c. Diabetes
mellitus
d. Cancer
SECTION 5: Anthropometric measurement
1. Height (in cms)
2. Weight (kgs)
3. Waist circumference

APPENDIX -III