prevalence of chronic constipation in general population dr. vicente garrigues gastroenterology unit...
TRANSCRIPT

Prevalence of chronic constipation in general
population
Dr. Vicente Garrigues Gastroenterology Unit Hospital Universitario LA FE Valencia - Spain

• Gastroenterologist since 1985.
• Working in a 1.500-bed University Hospital.
• Interested in Digestive Functional Disorders and in Epidemiology & Statistics.
• At present, Head of Education of the Hospital

Learning objectives
1.To know current definitions of chronic constipation.
2. To find out the prevalence of constipation.
3. To know which variables are associated to constipation.

Performance objectives1.To select a sample for a
prevalence study.
2. To perform statistics in a prevalence study.
3. To understand the meaning of likelihood ratios.
Evaluate the prevalence of chronic constipation in the general population.
Assess agreement among several diagnostic criteria of constipation
Aims
Evaluate the diagnostic accuracy of self-reported definition of constipation; and of symptoms included in Rome II criteria.
Identify factors associated to chronic constipation
Aims

Definition of constipation
•Self-reported by subject
•Rome criteria
•Rome II criteria
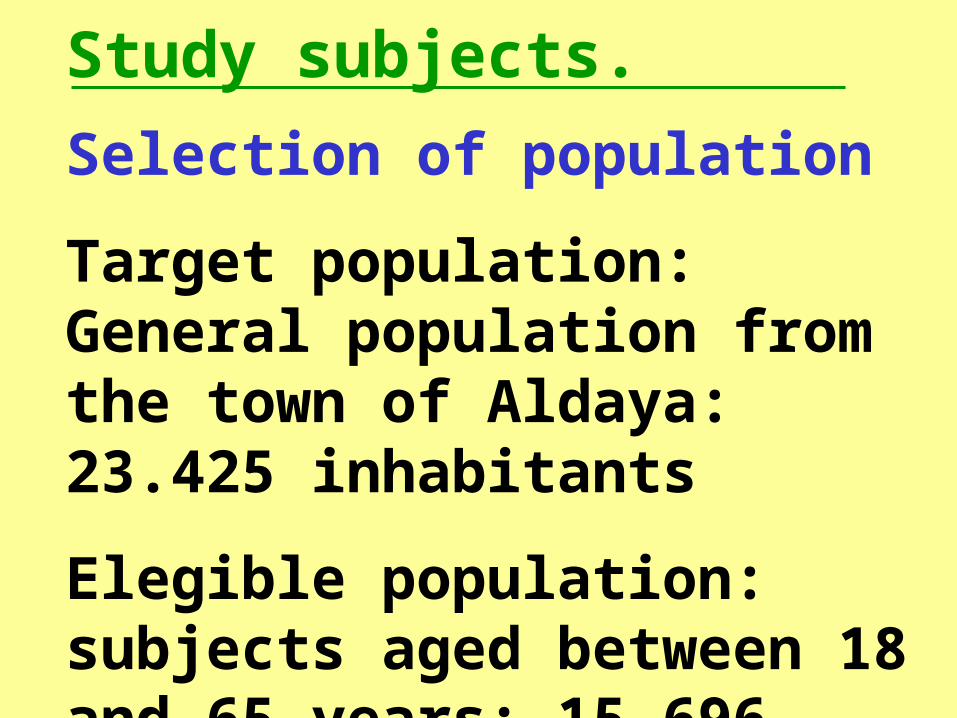
Study subjects.
Selection of population
Target population: General population from the town of Aldaya: 23.425 inhabitants
Elegible population: subjects aged between 18 and 65 years: 15.696 subjects

Study subjects.
Selection of sample. For an expected prevalence of 20 + 4% (95% C.I.): 375 subjects were needed. Sampling procedure. Systematic, age-stratified sampling was performed, selecting 506 subjects.

Questionnaire
A validated questionnaire with 21 items was mailed –up to 6 times- to sampled subjects.
Items allowed diagnosis of constipation and evaluated associated variables.
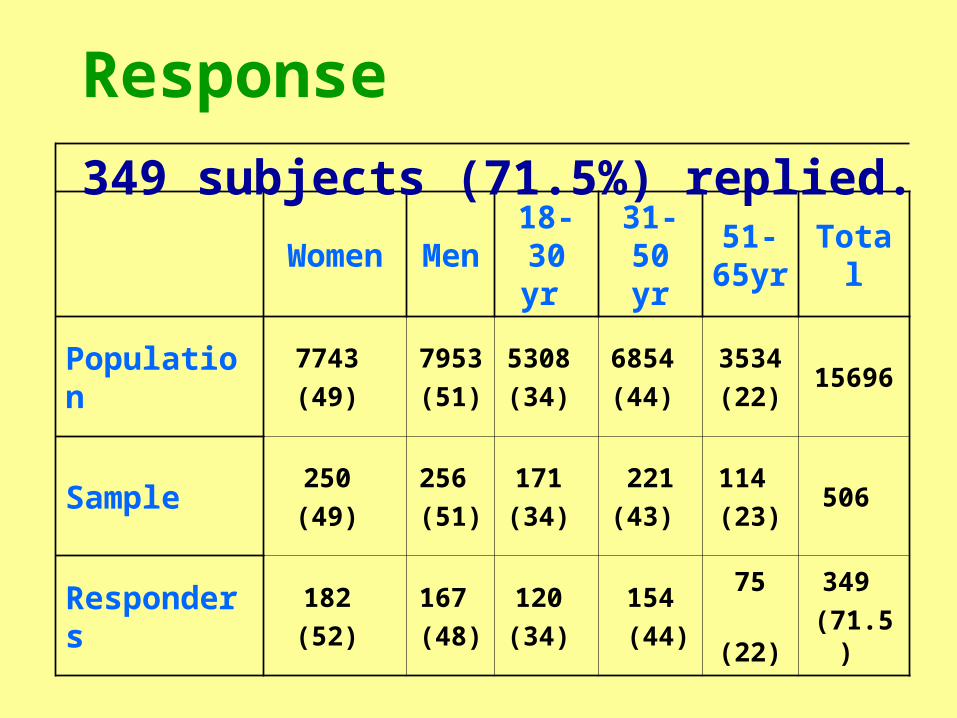
Response
Women
Men
18-30 yr
31-50 yr
51-65yr
Total
Population
7743 (49)
7953
(51)
5308 (34)
6854 (44)
3534 (22)
15696
Sample250 (49)
256 (51)
171 (34)
221(43)
114 (23)
506
Responders
182 (52)
167 (48)
120 (34)
154 (44)
75 (22)
349 (71.5)
349 subjects (71.5%) replied.
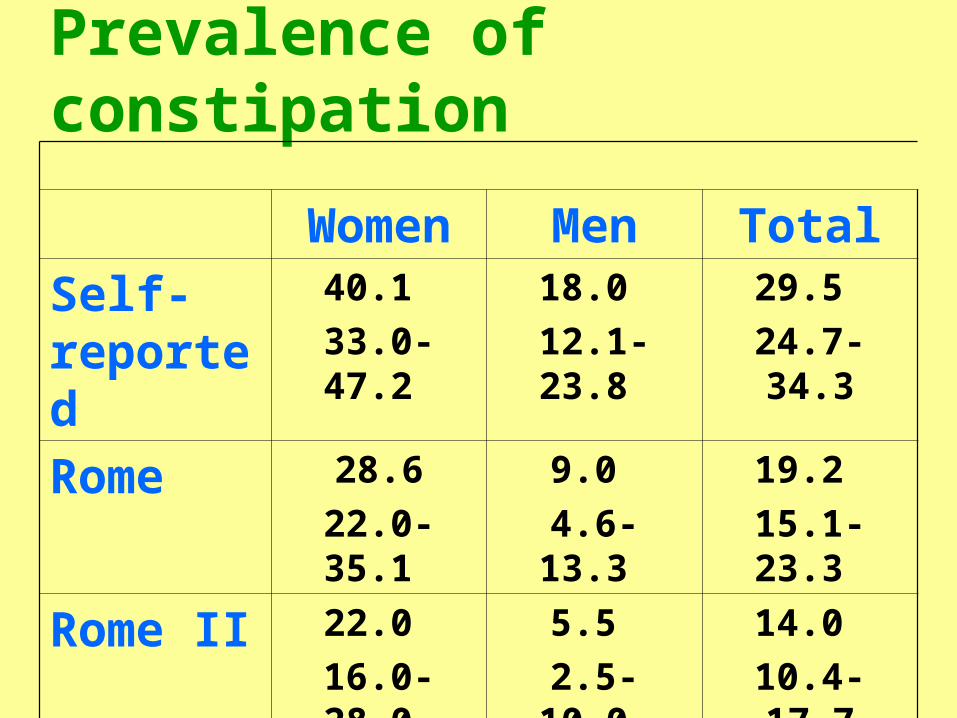
Prevalence of constipation
Women
Men Total
Self-reported
40.1 33.0- 47.2
18.0 12.1- 23.8
29.5 24.7- 34.3
Rome 28.622.0- 35.1
9.0 4.6- 13.3
19.2 15.1- 23.3
Rome II 22.0 16.0- 28.0
5.5 2.5- 10.0
14.0 10.4- 17.7
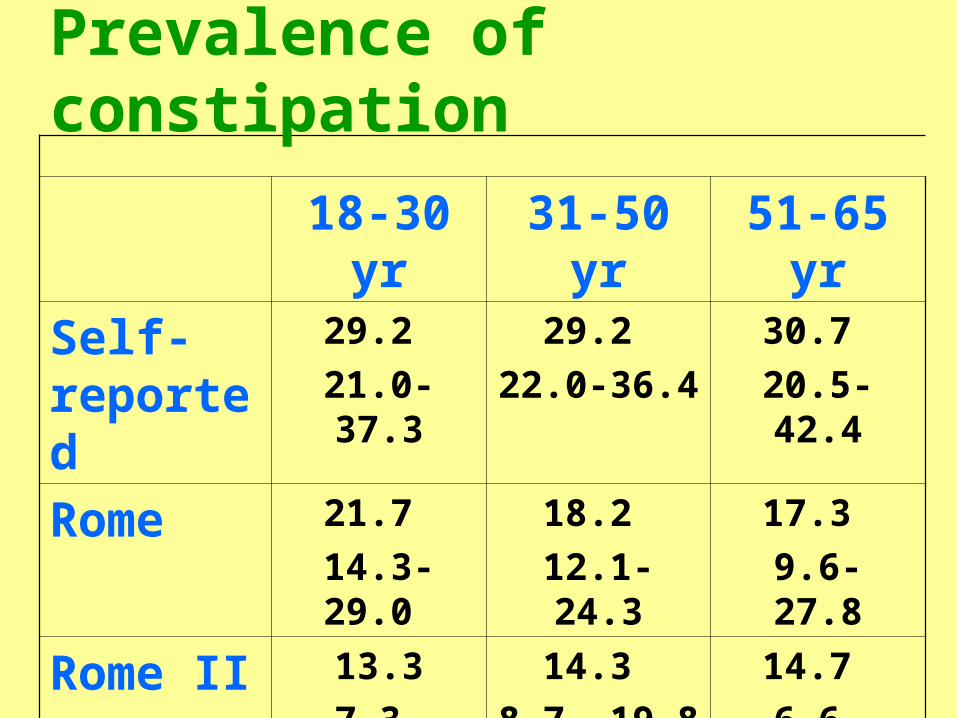
18-30 yr
31-50 yr
51-65 yr
Self-reported
29.2 21.0- 37.3
29.2 22.0-36.4
30.7 20.5- 42.4
Rome 21.7 14.3- 29.0
18.2 12.1- 24.3
17.3 9.6- 27.8
Rome II 13.37.3- 19.4
14.3 8.7- 19.8
14.7 6.6- 22.7
Prevalence of constipation
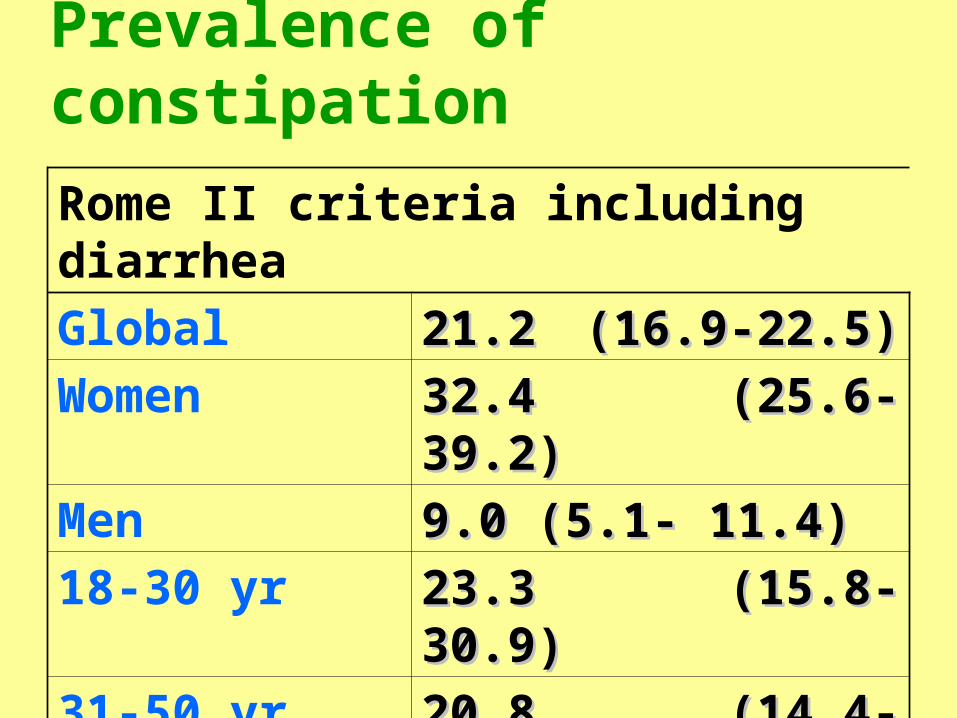
Rome II criteria including diarrheaGlobal 21.2 (16.9-22.5)21.2 (16.9-22.5) Women 32.4 (25.6- 39.2)32.4 (25.6- 39.2)Men 9.0 (5.1- 11.4)9.0 (5.1- 11.4)18-30 yr 23.3 (15.8- 30.9)23.3 (15.8- 30.9)31-50 yr 20.8 (14.4- 27.2)20.8 (14.4- 27.2)51-65 yr 18.7 (10.6- 29.3)18.7 (10.6- 29.3)
Prevalence of constipation
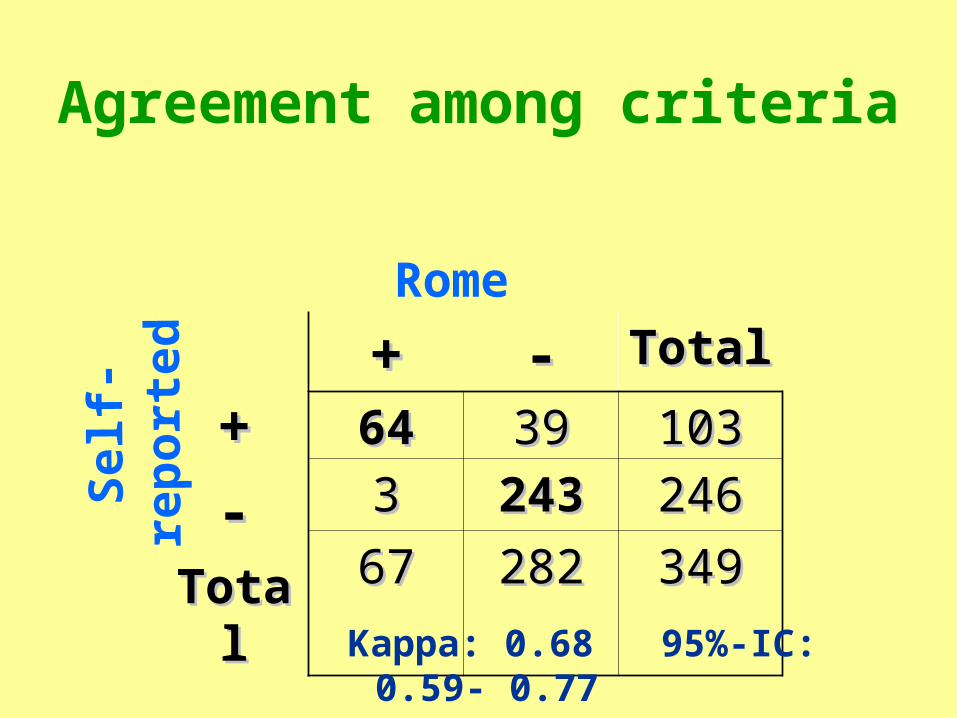
Agreement among criteria
Rome
++
--TotaTota
ll
++ -- TotalTotal
6464 3939 10310333 243243 246246
6767 282282 349349
Kappa: 0.68 95%-IC: 0.59- 0.77
Self
-re
port
ed
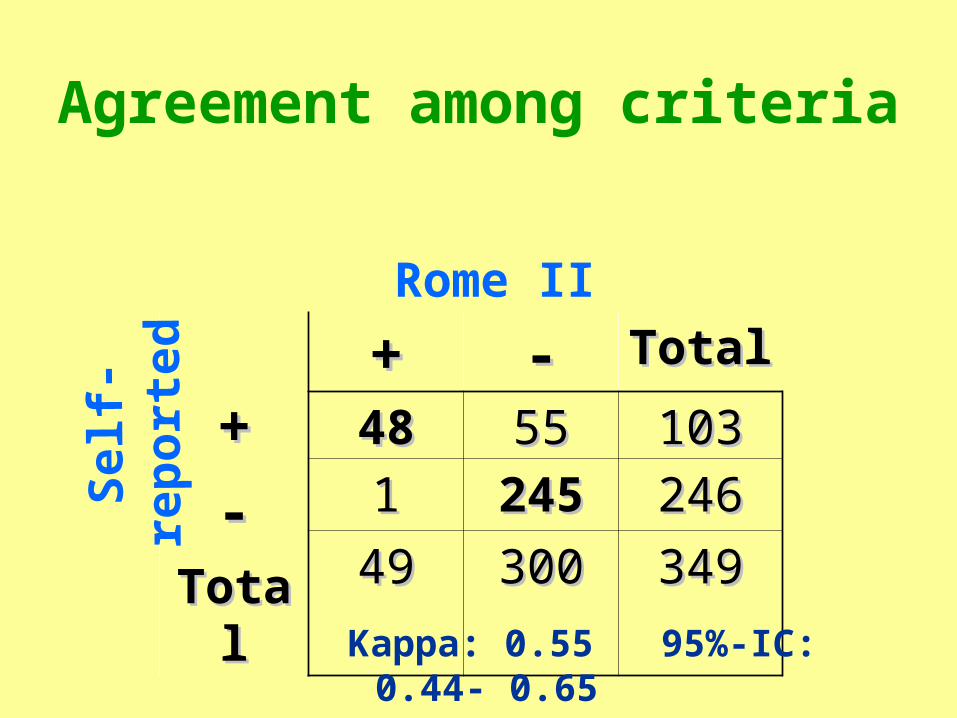
Agreement among criteria
Rome II
++
--TotaTota
ll
++ -- TotalTotal
4848 5555 10310311 245245 246246
4949 300300 349349
Kappa: 0.55 95%-IC: 0.44- 0.65
Self
-re
port
ed
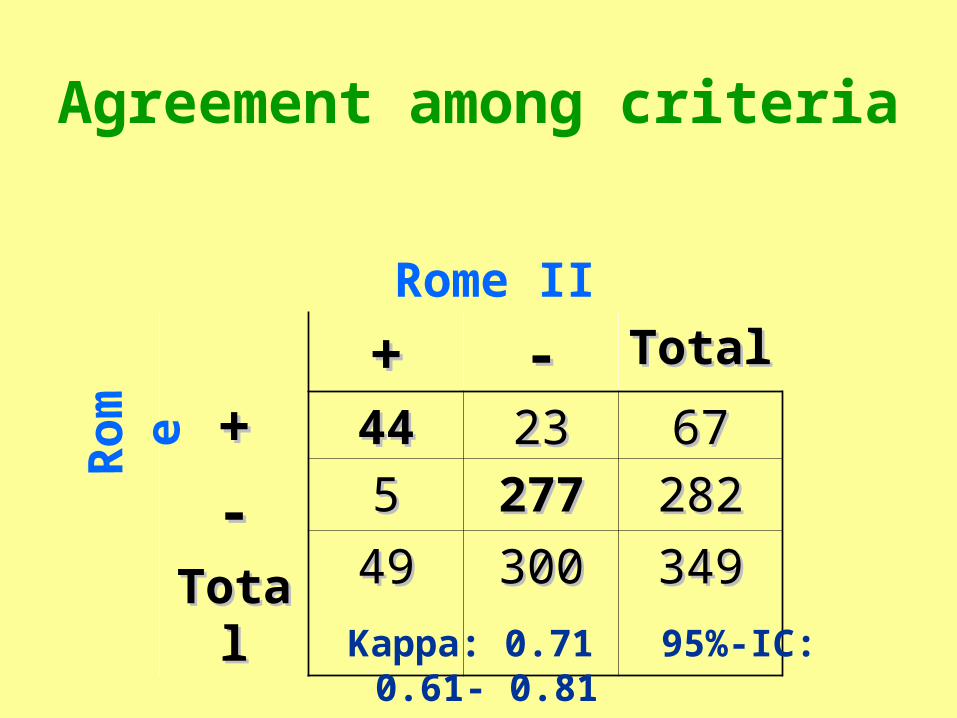
Agreement among criteria
Rome II
++
--TotaTota
ll
++ -- TotalTotal
4444 2323 676755 277277 282282
4949 300300 349349
Kappa: 0.71 95%-IC: 0.61- 0.81
Rom e
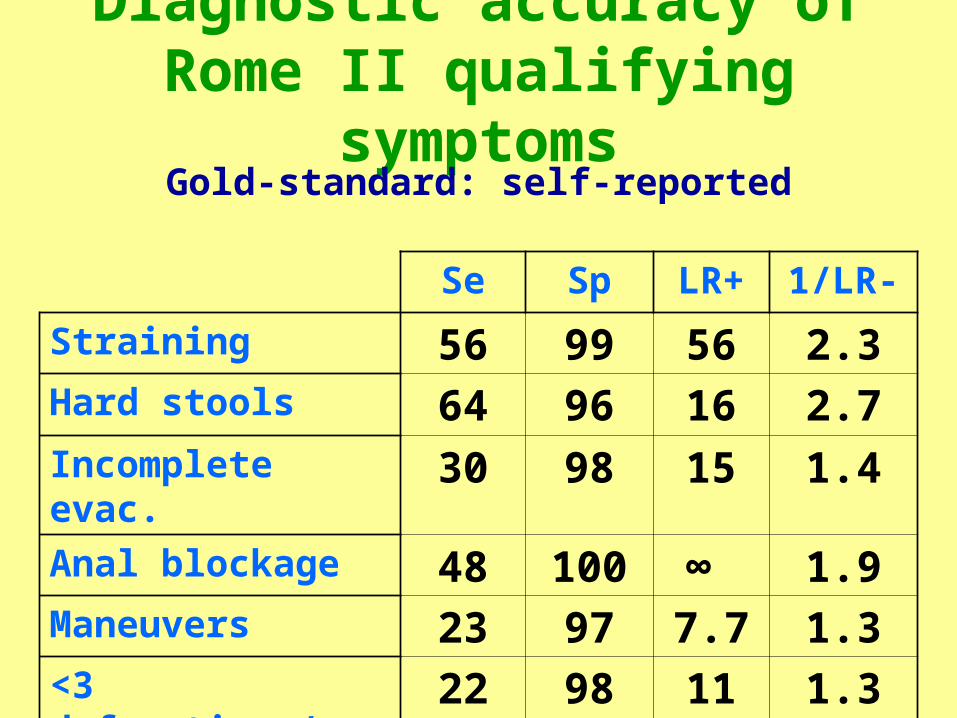
Diagnostic accuracy of Rome II qualifying
symptoms
Se Sp LR+ 1/LR-
Straining 56 99 56 2.3Hard stools 64 96 16 2.7Incomplete evac.
30 98 15 1.4
Anal blockage 48 100 ∞ 1.9Maneuvers 23 97 7.7 1.3<3 defecations/w
22 98 11 1.3
Gold-standard: self-reported
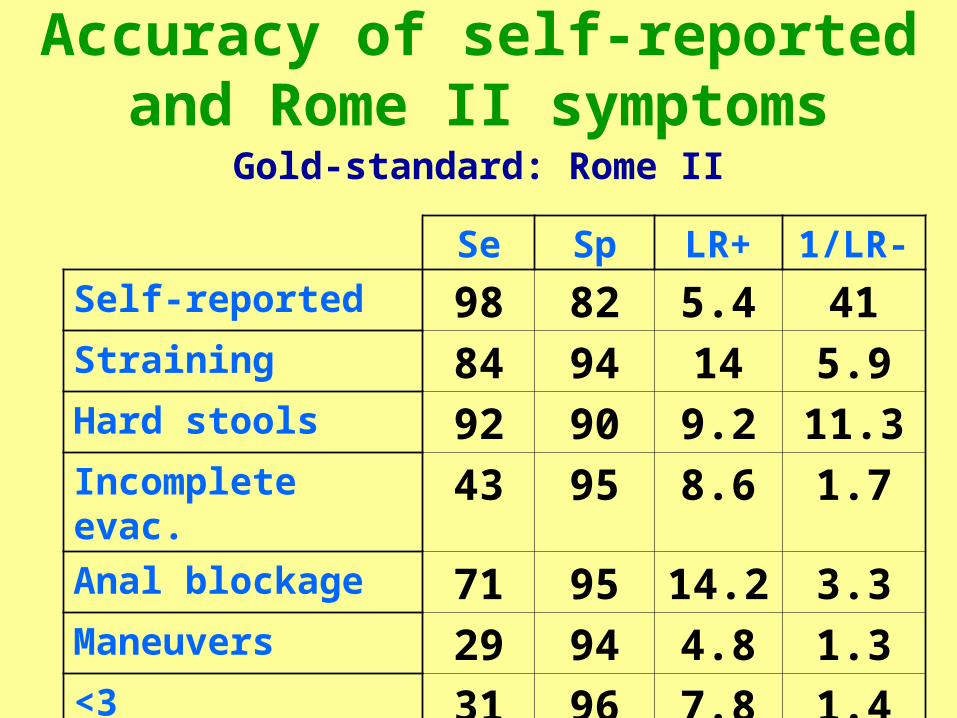
Se Sp LR+ 1/LR-
Self-reported 98 82 5.4 41Straining 84 94 14 5.9Hard stools 92 90 9.2 11.3Incomplete evac.
43 95 8.6 1.7
Anal blockage 71 95 14.2 3.3Maneuvers 29 94 4.8 1.3<3 defecations/w
31 96 7.8 1.4
Accuracy of self-reported and Rome II symptoms
Gold-standard: Rome II
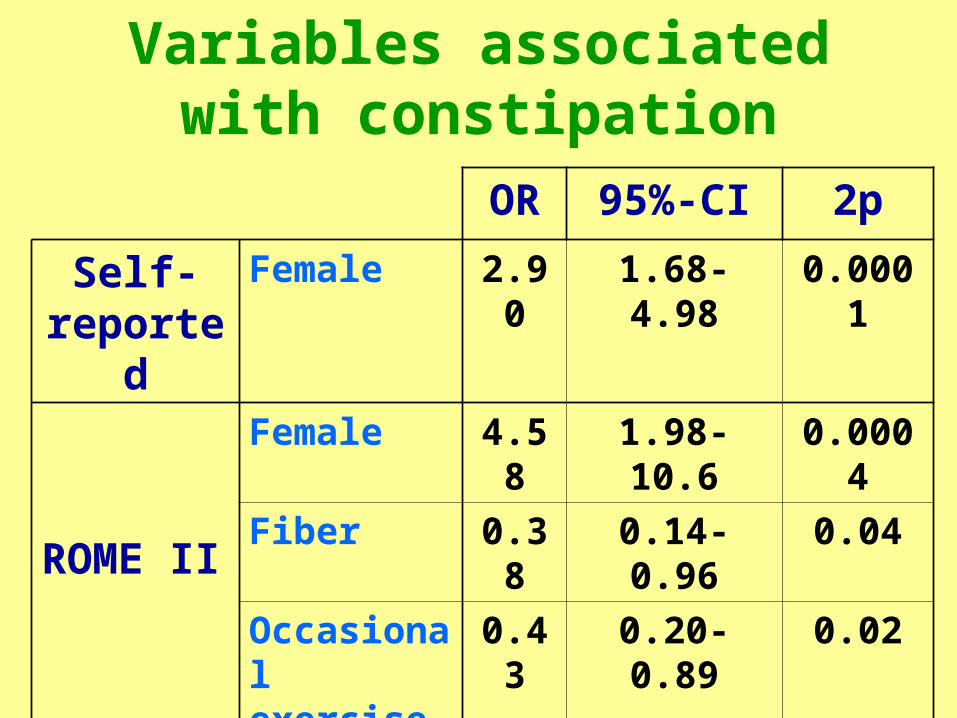
Variables associated with constipation
OR 95%-CI 2pSelf-
reported
Female 2.90
1.68-4.98
0.0001
ROME II
Female 4.58
1.98-10.6
0.0004
Fiber 0.38
0.14-0.96
0.04
Occasional exercise
0.43
0.20-0.89
0.02
Habitual exercise
0.31
0.11-0.87
0.03

Conclusions
Constipation is highly prevalent, especially in women. Different prevalence rates are observed using different criteria,although agreement is acceptable. Anal blockage, straining and hard stools show the greatest diagnostic accuracy.