prevalence of musculoskeletal disorders among farmers: a
TRANSCRIPT
AMERICAN JOURNAL OF INDUSTRIAL MEDICINE 55:143–158 (2012)
Review Article
Prevalence of Musculoskeletal Disorders AmongFarmers: A Systematic Review
Aoife Osborne,1� Catherine Blake,2 Brona M. Fullen,2 David Meredith,3
James Phelan,4 John McNamara,5 and Caitriona Cunningham2
Objective To determine the prevalence of musculoskeletal disorders (MSDs) amongfarmers and to establish the most common regional MSDs reported.Methods Comprehensive electronic searches of Pubmed, Web of Science, CINAHL,SCOPUS, EMBASE, Agris Database, and Cochrane Library were carried out usingkeywords for MSDs and farmers. Pooled estimates of prevalence with 95% confidenceintervals were calculated for overall MSD prevalence and the most common regionalMSDs reported.Results Twenty-four studies fulfilled the inclusion criteria and were incorporated intothis review. From these studies, life-time prevalence of any form of MSD among farm-ers was 90.6% while 1-year MSD prevalence was 76.9% (95% CI 69.8–82.7). Themajority of studies focused on spinal MSDs with low back pain (LBP) the most fre-quently investigated. Life-time LBP prevalence was 75% (95% CI 67–81.5) while1-year LBP prevalence was 47.8% (95% CI 40.2–55.5). The next most common region-al MSDs reported were upper (range 3.6–71.4%) and lower extremities (range 10.4–41%).Conclusions The systematic review identified the prevalence of MSDs by body regionin farmers and established that LBP was the most common MSD, followed by upperand then lower extremity MSDs. Reported trends suggest that the prevalence of MSDsin farmers is greater than in non-farmer populations. Case-definition uniformityamong MSD researchers is warranted. More studies are needed regarding upperand lower extremity MSDs, gender, workplace, and task context of MSDs. Am. J. Ind.Med. 55:143–158, 2012. � 2011 Wiley Periodicals, Inc.
KEY WORDS: systematic review; musculoskeletal disorders; farmers; prevalence
1Rural Economy Development Programme,Teagasc,Oak Park, Carlow, Ireland2School of Public Health,Physiotherapy and Population Science,Health Science Complex,Belfield Campus,University College Dublin,Dublin 4, Ireland3Rural EconomyDevelopment Programme,Teagasc, Ashtown Research Centre,Dublin15, Ireland4School ofAgriculture, Food Science & VeterinaryMedicine, Agriculture & FoodScience Centre,Belfield Campus,University College Dublin,Dublin 4, Ireland5Teagasc,Health & Safety Officer,Kildalton College, Piltown,Kilkenny, IrelandContract grant sponsor:Health and SafetyAuthority.Contract grant sponsor: Teagasc the Irish Agricultural FoodDevelopment Authority.Disclosure Statement: The authors report no conflicts of interests.*Correspondence to: Aoife Osborne,Rural EconomyDevelopment Programme,Teagasc,Oak Park,Carlow, Ireland. E-mail: [email protected]
Accepted12 October 2011DOI10.1002/ajim.21033.Published online 8November 2011inWiley Online Library
(wileyonlinelibrary.com).
�2011WileyPeriodicals,Inc.

INTRODUCTION
Musculoskeletal disorders (MSDs) are defined as a
group of disorders that affect the musculoskeletal system
including the nerves, tendons, muscles, and supporting
structures such as intervertebral discs [NIOSH, 1997].
MSDs affect millions of people around the world and are
the most common cause of severe long-term pain and
physical disability [Woolf and Pfleger, 2003]. Although
MSDs can occur as a consequence of intrinsic pathologi-
cal processes or as a result of acute injuries from a one-
time trauma, they are most commonly a result of cumula-
tive trauma, that is, repetitive minor traumas and bio-
mechanical stresses [Kolstrup, 2008]. Work-related
musculoskeletal disorders (WMSDs) describe disorders
and diseases of the musculoskeletal system that are associ-
ated with cumulative traumas such as repetitive motion,
excessive force, awkward and/or sustained postures, pro-
longed sitting and standing in the course of work [Da Cos-
ta and Vieira, 2010].
Due to the nature of farm work, which involves
strenuous physical activities and high levels of manual
labor, farmers and farm workers are at particular risk of
developing WMSDs [Walker-Bone and Palmer, 2002;
Rosecrance et al., 2006; Health and Safety Executive,
2007]. Examples of some of the work exposures that
farmers face include lifting and carrying heavy loads,
working with the trunk frequently flexed, risk of accidents
caused by the unpredictable actions of livestock and
exposure to vibration from farm vehicles and powered
hand tools [Walker-Bone and Palmer, 2002]. A number
of studies have reported that MSDs are the most common
of all occupational non-fatal injuries and illnesses for
farm workers [Hartman et al., 2006, Whelan et al.,
2009]. The UK Health and Safety Executive [2007]
established that workers in skilled agricultural trades
had a higher prevalence of MSDs compared to all
other industries, with back problems being the most
common MSD. Other studies have reported an associa-
tion between farming and the development of MSDs,
while several highlight the association between the
occupation and the prevalence of MSDs [Walker-Bone
and Palmer, 2002; Hartman et al., 2006; Rosecrance et al.,
2006].
Farmers are vulnerable to a range of MSDs including:
osteoarthritis of the hip and knee, low back pain (LBP),
upper limb disorders, and hand/arm vibration syndrome,
as well as to the consequences of trauma such as sprains,
fractures, and dislocations [Walker-Bone and Palmer,
2002]. Almost 60% of Southeast Kansas farmers reported
that they experienced a farm work-related MSD symptom
during the previous 12 months [Rosecrance et al., 2006].
A survey of self-reported work-related illness in Britain
during 1995 found that 43,000 agricultural workers
ascribed musculoskeletal symptoms to their occupation
[Walker-Bone and Palmer, 2002].
MSDs can result in severe long-term pain and suffer-
ing for individuals. In addition to their physical effects,
they can also lead to further negative consequences such
as reduced work ability, lower farm income, poor quality
of life, and the onset of other health problems such as
stress or depression. In the Netherlands MSDs were found
to be the main reason for sick leave among self-employed
farmers [Hartman et al., 2006]. A study investigating dis-
ability among farmers in the Republic of Ireland found
arthritis (31.4%) and back problems (17%) to be the most
frequent illness/disease reported and farm income was
lower on farms where the operator had a MSD-related dis-
ability [Whelan et al., 2009].
Although a number of epidemiological studies report-
ing on the prevalence of MSDs among farmers have been
published, there has been no systematic review of the
prevalence literature. A systematic review is required as
study methods vary greatly across nation and in terms of
type of farming, methodological quality, case definitions,
or data extraction and analysis. Heterogeneity of this na-
ture gives rise to a wide range of prevalence results and
makes it difficult to identify a single prevalence for a spe-
cific body region. This review will be an important re-
source document for future researchers who study MSDs
among farmers. The primary aim of this review was to
systematically appraise peer-reviewed publications con-
ducted with farmers to establish MSD prevalence trends
among farmers for different body regions.
METHODOLOGY
Overview
The review comprised three phases. Phase 1 involved
a systematic search of the literature using devised criteria
and a search strategy based on key words. Phase 2 in-
volved the initial screening of appropriate abstracts and
subsequently, of full articles by two reviewers. Phase 3
involved classifying the internal validity of the included
articles, and grading the strength of the evidence using
established and validated tools.
Phase 1: Search Strategy
Comprehensive electronic searches of Pubmed, Web
of Science, CINAHL, SCOPUS, EMBASE, Agris Data-
base, and Cochrane Library were carried out covering the
period January 1990 to February 2009. Relevant keywords
were chosen with advice from two librarians, one in
Health Sciences and the second in Veterinary Medicine
and Agriculture. Two concepts of search terms (MeSH
144 Osborne et al.
headings and text words) were combined describing
MSDs and farmers. This review took a broad definition of
both MSDs and farmers in order to capture all relevant
information within the electronic databases. The MSD
keywords included: shoulder pain, elbow pain, hand pain,
wrist pain, back pain, neck pain, cervical spine pain, hip
pain, knee pain, ankle pain, foot pain, arthritis, bone/joint/
muscle problem problems/pain pains/dysfunction dysfunc-
tions, musculoskeletal problem problems/pain pains/dys-
function dysfunctions, orthopedic problem problems/pain
pains/dysfunction dysfunctions, muscle strain, MSDs.
Farmer keywords included: farmers, farmer, agriculture
worker, farm worker, farming, breeder, cultivator, grower,
harvester, plowman, sower, tiller, agronomist, stockman,
granger, herdsman, agriculturalists, and shepherd. The
farmer keywords focused on those who carry out similar
work practices, that is, livestock and tillage farmers.
Therefore, farmers such as aquaculture and forestry work-
ers were excluded. All titles identified were merged into
the reference management software package, Endnote
(Version X1, Thomson Reuters, New York, NY).
Phase 2: Screening Process
Following elimination of duplicates, the potentially
relevant studies were assessed against initial inclusion cri-
teria (Table I). The abstracts of all studies meeting the
initial inclusion criteria were then further scrutinized, by
two researchers using more detailed inclusion criteria
(Table I). If no abstract was available, or if it was unclear
from the abstract whether a study should be included, the
whole article was retrieved and read. The full text of all
the remaining potentially relevant articles was evaluated
by two researchers to ensure the eligibility of the article
for inclusion in the review. Disagreements regarding study
eligibility were resolved through focused discussions, and
involvement of a third researcher until consensus was
reached. A detailed pro-forma was developed and imple-
mented by two researchers to extract and subsequently
categorize the study design and results of each included
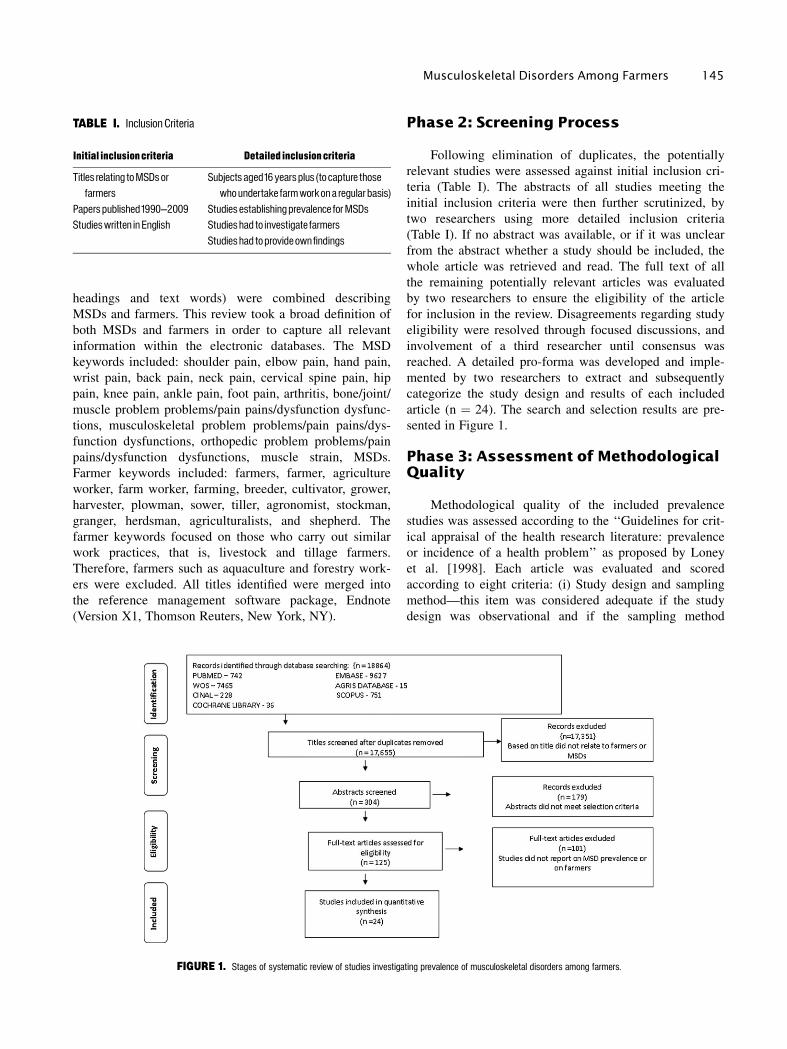
article (n ¼ 24). The search and selection results are pre-
sented in Figure 1.
Phase 3: Assessment of MethodologicalQuality
Methodological quality of the included prevalence
studies was assessed according to the ‘‘Guidelines for crit-
ical appraisal of the health research literature: prevalence
or incidence of a health problem’’ as proposed by Loney
et al. [1998]. Each article was evaluated and scored
according to eight criteria: (i) Study design and sampling
method—this item was considered adequate if the study
design was observational and if the sampling method
TABLE I. Inclusion Criteria
Initial inclusioncriteria Detailed inclusioncriteria
Titles relatingtoMSDsorfarmers
Subjects aged16yearsplus (to capture thosewhoundertake farmworkon a regularbasis)
Paperspublished1990^2009 Studies establishingprevalence forMSDsStudieswritten inEnglish Studieshad to investigate farmers
Studieshad toprovideownfindings
FIGURE 1. Stages of systematic review of studies investigating prevalence of musculoskeletal disorders among farmers.
Musculoskeletal Disorders Among Farmers 145

included either the whole population or a random sample;
(ii) sampling frame—considered adequate if the sampling
frame was considered to have minimal bias (e.g., derived
from census data); (iii) sample size—adequate if sample
size was >300 subjects; (iv) appropriate measurement—
adequate if objective was suitable and if standard criteria
were used for measurement of the health outcome; (v) out-
comes measured by independent assessors—considered
adequate when the health outcome was measured objec-
tively in an unbiased fashion, that the trained assessors
were independent and not aware of the subjects’ clinical
status and that the farmers under assessment included
those with and without the health problem; (vi) response
rate—accepted if the response rate was 70% or greater
and if an attempt was made to obtain information about
reasons for non-participation and characteristics of the
group of non-responders; (vii) results—accepted if the
estimates of prevalence were given with confidence inter-
vals and in detail by subgroup, if appropriate; and (viii)
study subjects—accepted if the study subjects and the set-
ting described in detail are similar to those of interest to
this review.
Having applied these criteria, the findings were classi-
fied according to main body regions reported. Meta-analy-
sis was carried out to statistically pool MSD and LBP
prevalence results using standardized prevalence estimates
from the studies. The analysis was performed using Meta-
Analyst software [Wallace et al., 2009]. A random effects
model was used as it makes the assumption that there is
heterogeneity present among the studies that cannot be
readily explained [Higgins and Green, 2011]. The number
of cases of LBP/MSD, and total sample size were entered
for individual studies and a pooled prevalence was calcu-
lated. Where the number of LBP/MSD cases was pre-
sented in relation to specific subgroups (e.g., gender) data
were combined to provide total number of cases in the
overall sample. This was necessary in the case of three
studies [Manninen et al., 1996; Xiang et al., 1999; Park
et al., 2001]. Forest plots were constructed for 1-year
MSD prevalence and both lifetime and 1-year LBP preva-
lence for all studies.
RESULTS
Given the combined health science and agriculture
theme, the electronic search resulted in the identification
of a large number of titles (n ¼ 18,864). The search func-
tions of several of the databases, in particular Web of Sci-
ence (n ¼ 7,465) and EMBASE (n ¼ 9,627) did not allow
advanced search strings, thus these searches returned a
high volume of titles. Following elimination of duplicates
(n ¼ 1,209), the potentially relevant articles (n ¼ 17,655)
were assessed against initial inclusion and exclusion crite-
ria. Over-representation of irrelevant agricultural and
health terms in titles resulted in many of the articles being
excluded (n ¼ 17,351). The abstracts of all studies meet-
ing the initial inclusion criteria (n ¼ 304) were then fur-
ther scrutinized and the full text of all potentially relevant
articles (n ¼ 125) was evaluated, resulting in the final
articles for inclusion (n ¼ 24). The search and selection
results are presented in Figure 1.
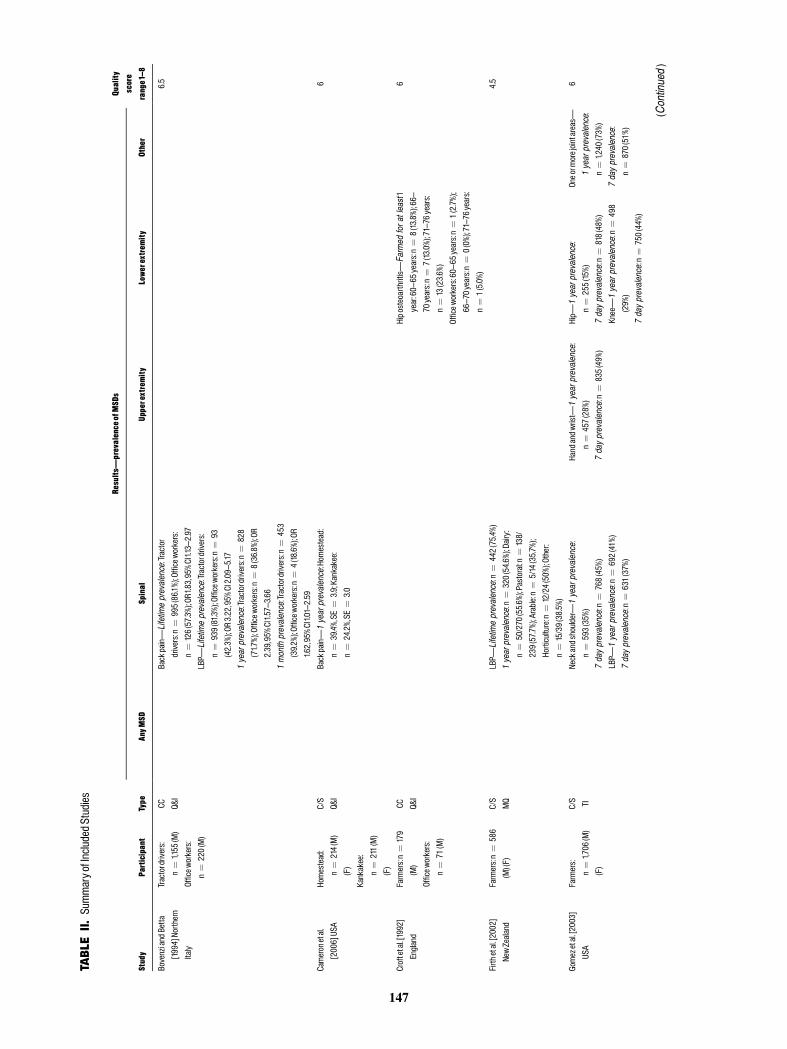
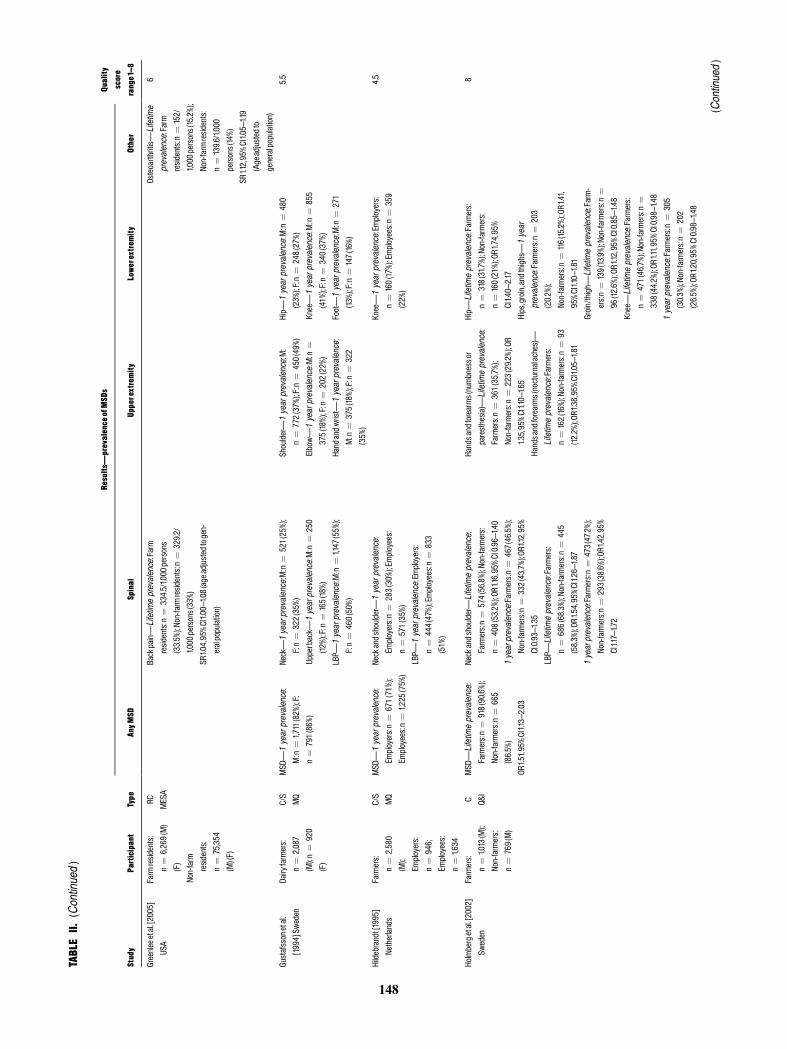
In total, 24 articles using four distinctive methodolo-
gies were included in the review (Table II): cross-sectional
(n ¼ 17), case-controlled (n ¼ 3), prospective cohort
(n ¼ 2), and retrospective cohort (n ¼ 2) studies. All
studies dealt with the prevalence of MSDs among farmers.
The studies yielded a range of prevalence estimates: point
(n ¼ 3), period (n ¼ 7), 1-year (n ¼ 21), and lifetime
(n ¼ 4). MSDs were classified using a range of validated
measures: modified version of the Standardized Nordic
Questionnaire (n ¼ 10) [Bovenzi and Betta, 1994; Gus-
tafsson et al., 1994; Hildebrandt, 1995; Stal et al., 1996;
Toren et al., 2002; Gomez et al., 2003; Stal and Englund,
2005; Kolstrup et al., 2006; Rosecrance et al., 2006; Non-
nenmann et al., 2008], the International Classification of
Diseases code (n ¼ 4) [Holmberg et al., 2002; Greenlee
et al., 2005; Thelin and Holmberg, 2007; Thelin et al.,
2009], 1988 National Health Interview Survey (n ¼ 3)
[Xiang et al., 1999; Park et al., 2001; Shipp et al., 2009],
non-validated definitions (n ¼ 4) [Croft et al., 1992; Man-
ninen et al., 1996; Firth et al., 2002; Cameron et al.,
2006]. A small number did not provide any definition
(n ¼ 3) [Scutter et al., 1997; McNeill and O’Neill, 1998;
O’Sullivan et al., 2009]. The study sample sizes ranged
from 79 to 11,368 farmers. The response rate varied from
41.9% to 96%.
Methodological Quality
The 24 eligible studies were assessed using guidelines
for critical appraisal described by Loney et al. [1998]. The
quality scores ranged from 2 to 8 points. Studies were
classified as high quality (>6 points), moderated quality
(>4 points), or low quality (<4 points). The critical
appraisal results and overall methodological quality scores
are summarized in Table II. In total 10 studies were rated
as high quality [Croft et al., 1992; Bovenzi and Betta,
1994; Xiang et al., 1999; Holmberg et al., 2002; Gomez
et al., 2003; Greenlee et al., 2005; Stal and Englund,
2005; Cameron et al., 2006; Thelin and Holmberg, 2007;
Thelin et al., 2009], 11 studies as moderate quality [Gus-
tafsson et al., 1994; Hildebrandt, 1995; Manninen et al.,
1996; Stal et al., 1996; Park et al., 2001; Firth et al., 2002;
Toren et al., 2002; Kolstrup et al., 2006; Rosecrance et al.,
2006; Nonnenmann et al., 2008; Shipp et al., 2009], and
three recorded low methodological quality [Scutter et al.,
1997; McNeill and O’Neill, 1998; O’Sullivan et al.,
2009]. Articles generally scored well in areas of clearly
146 Osborne et al.
147
TABLE
II.SummaryofIncludedStudies
Study
Participant
Type
Results�prevalence
ofMSDs
Quality
score
range1^8
AnyM
SDSpinal
Upperextremity
Lowerextrem
ityOther
BovenziandBetta
[1994]Northern
Italy
Tractordrivers:
n¼
1,155
(M)
Officew
orkers:
CC Q&I
Backpain�Lifetim
eprevalence:Tractor
drivers:n
¼995(86.1%);Officeworkers:
n¼
126(57.3%);O
R1.83,95%CI1.13^2.97
6.5
n¼
220(M)
LBP�
Lifetim
eprevalence:Tractordrivers:
n¼
939(81.3%);Officeworkers:n
¼93
(42.3%);O
R3.22,95%
CI2.09^5.17
1yearprevalence:Tractordrivers:n
¼828
(71.7%);Officeworkers:n
¼8(36.8%);O
R
2.39,95%
CI1.57^3.66
1monthprevalence:Tractordrivers:n¼
453
(39.2%);O
fficeworkers:n
¼4(18.6%);OR
1.62,95%CI1.012.59
Cameronetal.
[2006]USA
Homestead:
n¼
214(M)
(F)
C/S
Q&I
Backpain�1yearprevalence:Hom
estead:
n¼
39.4%,SE
¼3.9;Kankakee:
n¼
24.2%,SE
¼3.0
6
Kankakee:
n¼
211(M)
(F)
Croftetal.[1992]
England
Farmers:n¼
179
(M)
Officew
orkers:
n¼
71(M)
CC Q&I
Hiposteoarthritis�
Farmed
foratleast1
year:60^65
years:n¼
8(13.8%);66^
70years:n¼
7(13.0%);7176
years:
n¼
13(23.6%)
6
Officew
orkers:60^65
years:n¼
1(2.7%);
66^70years:n¼
0(0%);7176years:
n¼
1(5.0%)
Firth
etal.[2002]
Farmers:n¼
586
C/S
LBP�
Lifetim
eprevalence:n
¼442(75.4
%)4.5
NewZealand
(M)(F)
MQ
1yearprevalence:n
¼320(54.6%);D
airy:
n¼
50/270
(55.6%);P
astoral:n
¼138/
239(57.7
%);Arable:n¼
5/14(35.7%);
Horticulture:n
¼12/24(50%);O
ther:
n¼
15/39(38.5%)
Gomezetal.[2003]
USA
Farmers:
n¼
1,706
(M)
(F)
C/S TI
Neckandshoulder�
1year
prevalence:
n¼
593(35%)
7dayprevalence:n
¼768(45%)
LBP�
1year
prevalence:n
¼692(41%)
7dayprevalence:n
¼631(37%)
Handandwrist�
1year
prevalence:
n¼
457(28%)
7dayprevalence:n
¼835(49%)
Hip�
1yearprevalence:
n¼
255(15
%)
7dayprevalence:n
¼818(48%)
Knee�1year
prevalence:n
¼498
(29%)
7dayprevalence:n
¼750(44%)
Oneorm
orejointareas�
1year
prevalence:
n¼
1,240
(73%)
7dayprevalence:
n¼
870(51%)
6
(Continued)
148
TABLEII.
(Continued)
Study
Participant
Type
Results�
prevalence
ofMSDs
Quality
score
range1^8
AnyM
SDSpinal
Upperextremity
Lowerextrem
ityOther
Greenleeetal.[2005]
USA
Farm
residents:
n¼
6,269(M)
(F)
Non-farm
residents:
n¼
75,354
(M)(F)
RC MESA
Backpain�Lifetim
eprevalence:Farm
residents:n
¼334.5/1,000
persons
(33.5%);N
on-farm
residents:n
¼329.2/
1,000
persons(33%)
SR1.04,95%CI1.00^1.08(ageadjustedtogen-
eralpopulation)
Osteoarthritis�
Lifetim
e
prevalence:Farm
residents:n
¼152/
1,000
persons(15.2%);
Non-farm
residents:
n¼
139.6/1,000
persons(14%)
6
SR1.12,95%CI1.05^1.19
(Ageadjustedto
generalpopulation)
Gustafssonetal.
[1994]Sw
eden
Dairyfarmers:
n¼
2,087
(M);n
¼920
(F)
C/S
MQ
MSD�
1yearprevalence:
M:n
¼1,711(82%);F:
n¼
791(86%)
Neck�1yearprevalence:M:n
¼521(25%);
F:n¼
322(35%)
Upperback�
1yearprevalence:M:n
¼250
(12%);F:n
¼165(18
%)
Shoulder�1yearprevalence:M:
n¼
772(37%);F:n
¼450(49%)
Elbow�1yearprevalence:M:n
¼375(18
%);F:n
¼202(22%)
Hip�
1yearprevalence:M:n
¼480
(23%);F:n
¼248(27%)
Knee�
1year
prevalence:M:n
¼855
(41%);F:n
¼340(37%)
5.5
LBP�
1yearprevalence:M:n
¼1,147
(55%);
F:n¼
460(50%)
Handandwrist�
1year
prevalence:
M:n
¼375(18
%);F:n
¼322
(35%)
Foot�1yearprevalence:M:n
¼271
(13%);F:n
¼147(16
%)
Hildebrandt[1995]
Netherlands
Farmers:
n¼
2,580
(M);
Employers:
n¼
946;
Employees:
n¼
1,634
C/S
MQ
MSD�
1yearprevalence:
Employers:n¼
671(71%);
Employees:n¼
1,225
(75%)
Neckandshoulder�1year
prevalence:
Employers:n¼
283(30%);E
mployees:
n¼
571(35%)
LBP�
1year
prevalence:Employers:
n¼
444(47%);Employees:n¼
833
(51%)
Knee�
1year
prevalence:Employers:
n¼
160(17
%);Employees:n¼
359
(22%)
4.5
Holmbergetal.[2002]
Sweden
Farmers:
n¼
1,013(M);
Non-farmers:
n¼
769(M)
C Q&I
MSD�
Lifetim
eprevalence:
Farmers:n¼
918(90.6%);
Non-farmers:n¼
665
(86.5%)
OR1.51,95%CI1.13^2.03
Neckandshoulder�Lifetim
eprevalence:
Farmers:n¼
574(56.8%);N
on-farmers:
n¼
408(53.2%);O
R1.16,95%
CI0.9
6^1.40
1yearprevalence:Farmers:n¼
467(46.5%);
Non-farmers:n¼
332(43.7%);O
R1.12,95%
CI0.93^1.35
LBP�
Lifetim
eprevalence:Farmers:
n¼
686(68.3%);N
on-farmers:n¼
445
(58.3%);O
R1.54,95%CI1.26^1.87
1yearprevalence:Farmers:n¼
473(47.2%);
Non-farmers:n¼
293(38.6%);OR1.42,95%
CI1.17^1.72
Handsandforearms(numbnessor
paresthesia)�
Lifetim
eprevalence:
Farmers:n¼
361(35.7%);
Non-farmers:n¼
223(29.2%);O
R
1.35,95%CI1.10^1.65
Handsandforearms(nocturnalaches)�
Lifetim
eprevalence:Farmers:
n¼
162(16
%);Non-farmers:n¼
93
(12.2%);OR1.38,95%CI1.05^1.81
Hip�
Lifetim
eprevalence:Farmers:
n¼
318(31.7%);Non-farmers:
n¼
160(21%);O
R1.74
,95%
CI1.40^2.17
Hips,groin,andthighs�
1year
prevalence:Farmers:n¼
203
(20.2%);
Non-farmers:n¼
116(15.2%);OR1.41,
95%CI1.10^1.81
Groin/thigh�
Lifetim
eprevalence:Farm-
ers:n¼
139(13.9%);Non-farmers:n¼
96(12.6%);OR1.12,95%
CI0.85^1.48
Knee�
Lifetim
eprevalence:Farmers:
n¼
471(46.7%);N
on-farmers:n¼
338(44.2%);O
R1.11,95%
CI0.9
8^1.48
8
1year
prevalence:Farmers:n¼
305
(30.3%);N
on-farmers:n¼
202
(26.5%);O
R1.20,95%CI0.9
8^1.48
(Continued)

149
TABLEII.
(Continued)
Study
Participant
Type
Results�
prevalence
ofMSDs
Quality
score
range1^8
AnyM
SDSpinal
Upperextremity
Lowerextrem
ityOther
Kolstrupetal.[2006]
Sweden
Dairyfarmers:
n¼
10farms,
42workers;(M
:
n¼
28);(F:
n¼
14)
Pigfarmers:
n¼
10farms,
37workers;(M
:
n¼
19);(F:
n¼
18)
C/S
PQ&I
MSD�
1yearprevalence:Dairy
farmers:n¼
36(85.7%)(M)
(F);n
¼23
(82.1
%)(M);
n¼
13(92.9%)(F)
Pigfarmers:n¼
29(78.4%)(M)
(F);n
¼14(73.7%)(M);
n¼
15(83.3%)(F)
Neck�1year
prevalence:Dairyfarmers:
n¼
14(33.3%)(M)(F);n
¼7(25%)(M);
n¼
7(50%)(F)
Pigfarmers:n¼
12(32.4%)(M)(F);n
¼3
(15.8%)(M);n
¼9(50%)(F)
Back�1year
prevalence:Dairyfarmers:
n¼
25(59.5%)(M)(F);n
¼15(53.6%)(M);
n¼
10(71.4%)(F)
Pigfarmers:n¼
21(56.8%)(M)(F);n
¼9
(47.4%)(M);n
¼12(66.7%)(F)
Shoulders�
1year
prevalence:Dairy
farmers:n¼
20(47.6
%)(M)(F);
n¼
10(35.7%)(M);n
¼10(71.4%)
(F)
Pigfarmers:n¼
16(43.2%)(M)(F);
n¼
6(31.6%)(M);n
¼10(55.6%)
(F)
Elbows�
1year
prevalence:Dairy
farmers:n¼
4(9.5%)(M)(F);
n¼
1(3.6%)(M);n
¼3(21.4%)(F)
Hips�
1yearprevalence:Dairyfarmers:
n¼
6(14.3%)(M)(F);n
¼3(10.7%)
(M);n
¼3(21.4%)(F)
Pigfarmers:n¼
4(10.8%)(M)(F);n
¼2
(10.5%)(M);n
¼2(11.1%)(F)
Knees�
1yearprevalence:Dairy
farmers:n¼
10(23.8%)(M)(F);n
¼6
(21.4%)(M);n
¼4(28.6%)(F)
4.5
Upperback�
1year
prevalence:Dairy
farmers:n¼
11(26.2%)(M)(F);n
¼5
(17.9%)(M);n
¼6(42.9%)(F)
Pigfarmers:n¼
8(21.6%)(M)(F);n
¼3
(15.8%)(M);n
¼5(27.8
%)(F)
LBP�
1year
prevalence:Dairyfarmers:
n¼
17(40.5%)(M)(F);n
¼10(35.7%)(M);
n¼
7(50%)(F)
Pigfarmers:n¼
18(48.6%)(M)(F);n
¼8
(42.1
%)(M);n
¼10(55.6%)(F)
Pigfarmers:n¼
6(16.2%)(M)(F);
n¼
0(0%)(M);n
¼6(33.3%)(F)
Handsandwrists�
1year
prevalence:
Dairyfarmers:n¼
11(26.2%)(M)
(F);n
¼3(10.7%)(M);n
¼8(57.1%)
(F)
Pigfarmers:n¼
14(37.8%)(M)(F);
n¼
8(42.1%)(M);n
¼6(33.3%)
(F)
Pigfarmers:n¼
11(29.7%)(M)(F);n
¼5
(26.3%)(M);n
¼6(33.3%)(F)
Feet�1yearprevalence:Dairyfarmers:
n¼
6(14.3%)(M)(F);n
¼4(14.3%)
(M);n
¼2(14.3%)(F)
Pigfarmers:n¼
5(13.5%)(M)(F);n
¼2
(10.5%)(M);n
¼3(16.7%)(F)
Manninenetal.
[1996]Finland
Farmers(1979):
n¼
11,368(M)
C/S
1979:PQ
Neckandshoulder
1yearprevalence
(1979):
5.5
(F)
1992:TI
All(M
):62.3%
All(F):6
8.4%
Farmers(1992):(M)
18^34yrs:42.9%
18^34yrs:44.9%
n¼
3,237
35^44yrs:58.9%
35^44yrs:64.9%
(F)
45^54yrs:67.9%
45^54yrs:75.9%
55^64yrs:69.9%
55^64yrs:75%
Total(M
)(F):65.1
%,95%CI67.9^71.2
1yearprevalence
(1992):
All(M
):54.7%
All(F):66.6%
18^34yrs:49.6%
18^34yrs:58.6%
35^44yrs:55.7%
35^44yrs:68.6%
45^54yrs:54.4%
45^54yrs:69.5%
55^64yrs:57.5%
55^64yrs:69%
Total(M
)(F):59.7%,95%
CI54.3^64.2
LBP
1yearprevalence
(1979):
All(M
):71.3%
All(F):69.8%
18^34yrs:56.9%
18^34yrs:57.9%
35^44yrs:68.9%
35^44yrs:68.9%
45^54yrs:75.9%
45^54yrs:74.9%
(Continued)

150
TABLEII.
(Continued)
Study
Participant
Type
Results�
prevalenceofMSDs
Quality
score
range1^8
AnyM
SDSpinal
Upperextremity
Lowerextrem
ityOther
55^64yrs:73.9%
55^64yrs:72.9%
Total(M
)(F):70.4
%,95%CI69.172.2
1year
prevalence(1992):
All(M
):60.4
%All(F):56.9%
18^34yrs:54.8%
18^34yrs:50.8%
35^44yrs:61.9%
35^44yrs:59.9%
45^54yrs:59.8%
45^54yrs:58.8%
55^64yrs:62.6%
55^64yrs:56.8%
Total(M
)(F):58.2%,95%
CI56.2^61.5
McNeillandO’Neill
[1998]Ghana,Africa
Farmers:n¼
100
(M)
C/S Q
Backpain
1year
prevalence:n
¼76
(76%)
2
LBP
Pointprevalence:n
¼48
(48%);1
year
prevalence:n
¼77
(77%)
Nonnenmannetal.
[2008]USA
DairyFarmers:
n¼
341(M)
(F)
C/S
MQ
MSD
1year
prevalence:n
¼255
(75%)
Neck
1year
prevalence:n
¼148(43%)
Shoulder
1year
prevalence:n
¼183(54%)
Elbow
1year
prevalence:n
¼82
(24%)
Handandwrist
MSD
symptom
sintwoor
moresites
1yearprevalence:
n¼
155(45%)
5
1year
prevalence:n
¼137(40%)
O’Sullivanetal.[2009]
Ireland
Farmers:n¼
104
(M)(F)
C/S Q
LBP
Lifetim
eprevalence:n
¼77
(74%);1
Year
prevalence:n
¼56
(54%);P
oint
prevalence:n
¼28
(27%);E
verydayfor
aweekor
moreintheprevious
year:
n¼
42(40%)
3
Parketal.[2001]Iowa,
USA
Iowafarmers
(1995):
n¼
287(M)
C/S
Backpain�1yearprevalence:Iowafarmer:
n¼
89(31%);U
.S.farmer:n
¼81(19.9%);
OR1.78,95%CI1.23^2.58
5.5
U.S.farmers(1988):
n¼
408(M)
MQ
Upperandmiddleback�
1yearprevalence:
Iowafarmer:n
¼14(4.9%);U.S.farmer:
n¼
20(4.9%);OR0.4
4,95%CI0.18^1.11
LBP�
1year
prevalence:Iowafarmer:
n¼
73(25.4
%);U.S.farmer:n
¼58
(14.2%)
Rosecranceetal.
[2006]Kansas,USA
Farmers:n¼
266
(M)(F)
C/S
MQ
MSD�
1yearprevalence:
n¼
160(60%)
Neck�
1year
prevalence:n
¼58
(22.4%)
Backpain�Everydayforaweek:n¼
92
(36.4
%)(respondents¼
253)
Shoulder�1year
prevalence:
n¼
66(25.9%)
Elbow�
1year
prevalence:
n¼
15(5.8%)
Hip/thigh�
1year
prevalence:
n¼
27(10.4%)
Knee�
1yearprevalence:
n¼
61(23.6%)
Farm-relatedinjury�
1
yearprevalence:
n¼
42(15.9%)
4.5
(Continued)

151
TABLEII.
(Continued)
Study
Participant
Type
Results�prevalence
ofMSDs
Quality
score
range1^8
AnyM
SDSpinal
Upperextremity
Lowerextrem
ityOther
Upperback�
Iyear
prevalence:n
¼43
(16.7%)
Handandwrist�
1yearprevalence:
n¼
31(12
%)
Foot�1year
prevalence:
n¼
39(15.1%)
LBP�
1year
prevalence:n
¼97
(37.5%)
Scutteretal.[1997]
SouthA
ustralia
Farmers:n¼
179
(M)
C/S Q
Neckpain�
Allday,everyday:n
¼9(5%);
Atleastonce
perday:n¼
22(12
.3%);
Atleastonce
perweek:n¼
29(16.2%);
Less
than
once
perweek:n¼
79
(44.1
%);Never:n
¼40
(22.3%)
Headache�
Allday,
everyday:n
¼2
(1.3%);A
tleastonce
perday:n¼
5
(2.7%);Atleastonce
perweek:n¼
31
(17.3%);Lessthan
once
perweek:
n¼
104(58.2%);
Never:n
¼37
(20.8%)
3
Shippetal.[2009]
Texas,USA
Migrantfarm
workers:year1:
n¼
390;Year
2:n¼
265(M)
(F)
C/S QI
Backpain�1year
prevalence(Year1):
Mother:3
3.3%,95%
CI24.9^42.6%;Father:
23.8%,95%CI15.9^33.3%;Oldestchild:
15.7%,95%CI8.1
26.4%;Youngestchild:
9.5%,95%
CI1.1
30.3%
5.5
1yearprevalence(year2):M
other:28.2%,95%
CI19.7^37.9
%;Father:21.1%,95%CI13.4^
30.6%;Oldestchild:15.6%,95%
CI7.8^26.9%
Staletal.[1996]
Sweden
Milkers:n¼
161
(F)
Non-milkers:
n¼
108(F)
Ex-milkers:
n¼
62(F)
Nurseassistants:
n¼
166(F)
CC MQ
MSD�
1year
prevalence:
Milkers:n¼
136(84%);
Non-milkers:n¼
92(85%);
Ex-milkers:n¼
54(87%);
Nurseassistants:n
¼125
(75%)
Neckandshouldersandelbows/wrists/
handsa�1yearprevalence:M
ilkers:
n¼
35(21%);N
on-milkers:n¼
22
(20%);E
x-milkers:n¼
12(19
%);Nurse
assistants:n¼
20(12
%);Milkerand
Nurseassistant:O
R1.92,CI95%
1.06^3.47
Shouldersandelbows/wrists/hands�
1
yearprevalence:M
ilkers:n¼
54
(33%);N
on-milkers:n¼
33(30%);
Ex-milkers:n¼
22(34%);N
urse
assistants:n¼
28(16
%);Milkerand
Nurseassistant:O
R2.49,CI95%
1.48^4.19
4.5
Staletal.[2005]Sw
eden
Pigfarmers:
n¼
288(M)
(F);n
¼202
C/S
MQ
Neck�1yearprevalence:<
34yrs:50%(M)
86%(F);34^42
yrs:30%(M)50%(F);43^50
yrs:47%(M)43%(F);>
50yrs:40%(M)
Shoulder�
1year
prevalence:<
34:
26%(M)56%(F);34^42:38%(M)65%(F);
43^50:45%(M)71%(F);>
50:52%(M)
6
(Continued)

152
TABLEII.
(Continued)
Study
Participant
Type
Results�prevalence
ofMSDs
Quality
score
range1^8
AnyM
SDSpinal
Upperextremity
Lowerextrem
ityOther
(M);n
¼86
(F)
30%(F);All:39%(M)43%(F);R
R1.08,95%CI
0.79^1.47
70%(F);All:38%(M)60%(F);R
R1.72,95%
CI1.33^2.22
Elbow�
1yearprevalence:<
34:22%(M)
13%(F);34^42:27%(M)27%(F);43^50:
33%(M)21%(F);>
50:23%(M)50%(F);
All:26%(M)22%(F);R
R0.9
6,95%CI
0.61
1.50
Wrist/hand�
1year
prevalence:<
34:
50%(M)52%(F);34^42:29%(M)65%(F);
43^50:33%(M)33%(F);>
50:31%(M)
90%(F);All:33%(M)53%(F);R
R1.61,
95%CI1.23^2.11
Thelinetal.[2007]
Sweden
Farmers:
n¼
1,220
(M)
Non-farmers(rural
men):
n¼
1,130
(M)
Urbancontrols:
n¼
1,087
(M)
PC R
Osteoarthritisanysite�
13year
period:
Farmers:n¼
72
(5.9%);Non-farmers:
n¼
38(3.4%);Urban
controls:n¼
30(2.8%)
6
Hiposteoarthritis�
13
year
period:Farm-
ers:n¼
51(4.2%);
Non-farmers:n¼
22
(1.9%);U
rbancontrols:
n¼
15(1.4%)
Thelinetal.[2009]
Sweden
Farmers:
n¼
1,220
(M)
Non-farmers(rural
men):
n¼
1,130
(M)
Urbancontrols:
n¼
1,087
(M)
PC R
MSD
basedonhospital
admissionsand
deaths�
13year
period:Farmers:
n¼
135rate¼
111;
OR1.47,95%CI1.10^
1.95;Ow
n
Calculation¼
11%
6
Torenetal.[2002]
Sweden
Tractordrivers:
n¼
1,075
(M)
(F)
C/S
MQ
LBP�
1yearprevalence:(Total(F);n
¼103);
n¼
75(73%);(Total(M
);n¼
874);
n¼
517(59%);(Total(M
)(F);n
¼977);
n¼
595(61%)
Hips�
1year
prevalence:(Total(F);
n¼
97);n
¼32
(33%);(Total(M
);
n¼
843);n
¼278(33%);(Total(M
)
(F);n
¼940);n
¼311(33%)
5 7.5
(Continued)
153
TABLEII.
(Continued)
Study
Participant
Type
Results�prevalence
ofMSDs
Quality
score
range1^8
AnyM
SDSpinal
Upperextremity
Lowerextrem
ityOther
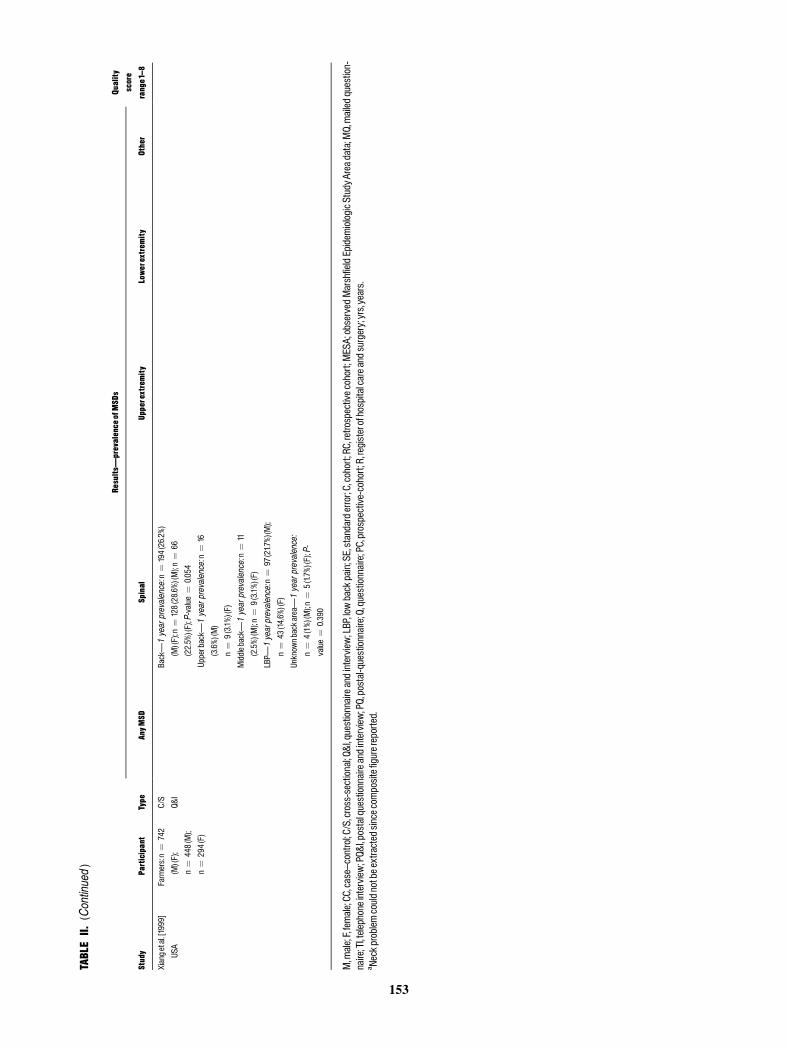
Xiangetal.[1999]
USA
Farmers:n¼
742
(M)(F);
n¼
448(M);
n¼
294(F)
C/S
Q&I
Back�1year
prevalence:n
¼194(26.2%)
(M)(F);n
¼128(28.6%)(M);n
¼66
(22.5%)(F);P-value¼
0.054
Upperback�
1yearprevalence:n
¼16
(3.6%)(M)
n¼
9(3.1%)(F)
Middleback�
1year
prevalence:n
¼11
(2.5%)(M);n
¼9(3.1%)(F)
LBP�
1yearprevalence:n
¼97(21.7%)(M);
n¼
43(14.6%)(F)
Unknownbackarea�
1year
prevalence:
n¼
4(1%)(M);n
¼5(1.7%)(F);P-
value¼
0.390
M,male;F,female;CC,case^control;C/S,cross-sectional;Q&I,questionnaireandinterview
;LBP,lowbackpain;SE,standarderror;C,cohort;RC,retrospectivecohort;MESA;observedMarshfieldEpidem
iologicS
tudyAreadata;M
Q,mailedquestion-
naire;TI,telephoneinterview
;PQ&I,postalquestionnaireandinterview
;PQ,postal-questionnaire;Q,questionnaire;PC,prospective-cohort;R,registerofhospitalcareandsurgery;yrs,years.
a Neckproblem
couldnotbeextractedsincecompositefigurereported.

stating study objectives, appropriate study design and sam-
pling methods, with study subjects and setting described
of interest. Methodological limitations identified in a ma-
jority of articles were inappropriate sampling frame, inad-
equate sample size, bias in measurement of health
outcome, and estimates of prevalence not given with con-
fidence intervals and in detail by subgroup.
MSD Prevalence
The findings were classified into three regions: spinal,
upper extremities, lower extremities, and other. The stud-
ies yielded a range of prevalence estimates including
point, period, 1-year, and lifetime. Table II summarizes
information regarding study characteristics and prevalence
results. The majority of studies (n ¼ 11) focused only on
the prevalence of spinal MSDs [Bovenzi and Betta, 1994;
Manninen et al., 1996; Scutter et al., 1997; McNeill and
O’Neill, 1998; Xiang et al., 1999; Park et al., 2001; Firth
et al., 2002; Greenlee et al., 2005; Cameron et al., 2006;
O’Sullivan et al., 2009; Shipp et al., 2009]. Five studies
[Gustafsson et al., 1994; Holmberg et al., 2002; Gomez
et al., 2003; Kolstrup et al., 2006; Rosecrance et al., 2006]
examined MSDs of the entire body categorized into the
three body regions: spinal, upper extremities, lower ex-
tremities, and the remaining studies investigated MSDs in-
volving a range of body part combinations [Croft et al.,
1992; Hildebrandt, 1995; Stal et al., 1996; Toren et al.,
2002; Stal and Englund, 2005; Thelin and Holmberg,
2007; Nonnenmann et al., 2008; Thelin et al., 2009].
Only one of the 24 studies [Holmberg et al., 2002]
investigated farmers’ lifetime prevalence of experiencing
any MSDs (90.6%). Six studies [Gustafsson et al., 1994;
Hildebrandt, 1995; Stal et al., 1996; Kolstrup et al., 2006;
Rosecrance et al., 2006; Nonnenmann et al., 2008]
reported 1-year prevalence of experiencing any MSDs
(range 60–92.9%) with overall pooled result of 76.9%
(95% CI 69.8–82.7) Figure 2. The 1-year MSD prevalence
range reported for females, when considered separately
ranged from 83.3% to 92.9% [Gustafsson et al., 1994; Stal
et al., 1996; Kolstrup et al., 2006], approximately 10%
higher than that recorded when compared to the male co-
hort (prevalence range 71–82.1%) [Gustafsson et al.,
1994; Hildebrandt, 1995; Kolstrup, 2008].
MSD Diagnosis
LBP was the most commonly studied MSD [Bovenzi
and Betta, 1994; Gustafsson et al., 1994; Hildebrandt,
1995; Manninen et al., 1996; McNeill and O’Neill, 1998;
Xiang et al., 1999; Park et al., 2001; Firth et al., 2002;
Holmberg et al., 2002; Toren et al., 2002; Gomez et al.,
2003; Kolstrup et al., 2006; Rosecrance et al., 2006;
O’Sullivan et al., 2009]. Life-time LBP prevalence ranged
from 68.3% to 81.3% [Bovenzi and Betta, 1994; Firth
et al., 2002; Holmberg et al., 2002; O’Sullivan et al.,
2009] with an overall pooled estimate of 75% (95% CI
67.0–81.5) Figure 2. One-year LBP prevalence ranged
from 14.2% to 77% [Bovenzi and Betta, 1994; Gustafsson
et al., 1994; Hildebrandt, 1995; Manninen et al., 1996;
McNeill and O’Neill, 1998; Xiang et al., 1999; Park et al.,
2001; Firth et al., 2002; Holmberg et al., 2002; Toren
et al., 2002; Gomez et al., 2003; Kolstrup et al., 2006;
Rosecrance et al., 2006; O’Sullivan et al., 2009] with
overall pooled prevalence of 47.8% (95% CI 40.2–55.5)
Figure 2. The 1-year LBP prevalence range reported for
female farmers was 14.6–73% [Gustafsson et al., 1994;
Manninen et al., 1996; Xiang et al., 1999; Toren et al.,
2002; Kolstrup et al., 2006] while the 1-year LBP preva-
lence range for male farmers was 14.2–71.7% [Bovenzi
and Betta, 1994; Gustafsson et al., 1994; Hildebrandt,
1995; Manninen et al., 1996; McNeill and O’Neill, 1998;
Xiang et al., 1999; Park et al., 2001; Holmberg et al.,
2002; Toren et al., 2002; Kolstrup et al., 2006].
DISCUSSION
This is the first systematic review of epidemiological
literature considering the prevalence of MSDs among
farmers. In order to ensure all relevant studies were in-
cluded in this review, multiple search terms were used for
the word farmer including farm workers, migrant farm
workers, farm employees, farm employers, farm residents.
Table II includes the descriptions of participants provided
by the primary authors of the studies included in this re-
view. While the search strategy developed for this review
did not constrain itself to WMSDs, the results established
that most MSD research concerning farmers and farm
workers relates to WMSDs. Twenty-four research studies
were identified for inclusion in this review. Using accepted
critical appraisal criteria, 10 of these articles were consid-
ered of high methodological quality, 11 of moderate quali-
ty, and 3 of poor quality.
The review found substantial heterogeneity between
countries, type of farming, methodological quality, case
definitions, and data extraction and analysis. The high lev-
el of heterogeneity made it difficult to establish single
prevalence results for specific body regions. In drawing
attention to these issues, it is hoped that this review will
be helpful in focusing the efforts of researchers and there-
by avoiding these problems in the future.
Of the various approaches to estimating prevalence of
MSDs among farmers, 1-year prevalence is the most wide-
ly applied. When reporting MSDs for the same body part,
variations were noted in the range of prevalence rates. Ex-
planation for this might be due to the varied methodologi-
cal quality of the studies, particularly the difference in
MSD case definition. The prevalence rates in the 10 higher
154 Osborne et al.
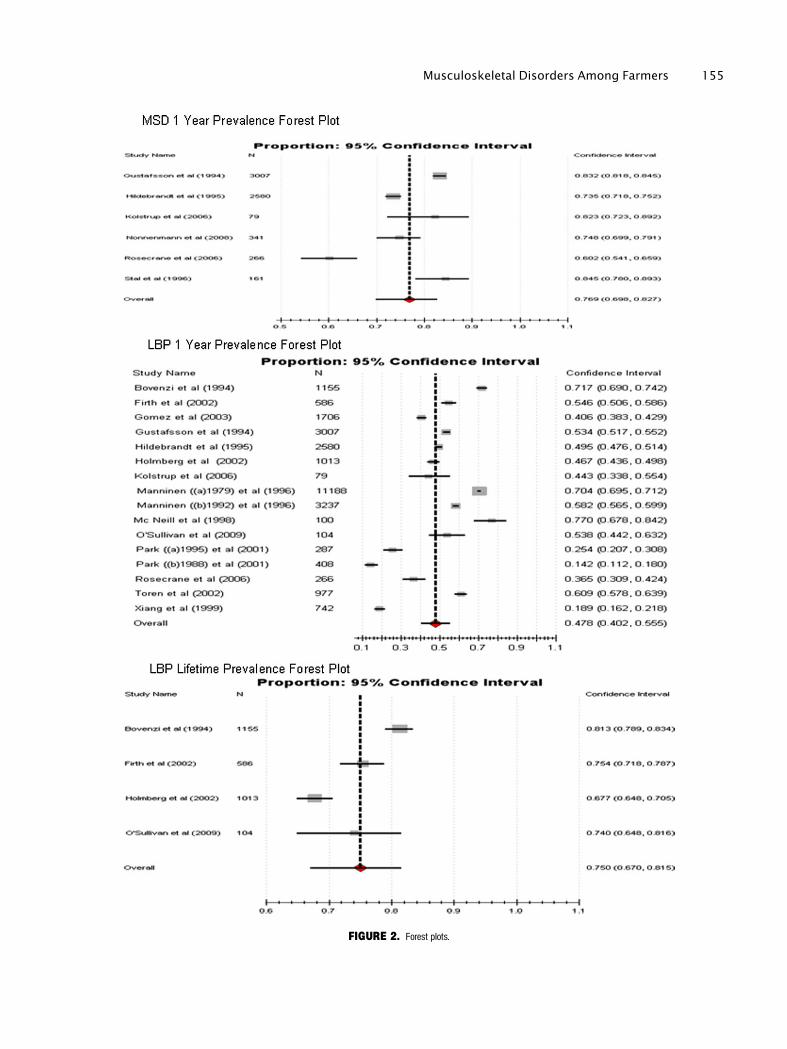
FIGURE 2. Forest plots.
Musculoskeletal Disorders Among Farmers 155

methodological quality studies [Croft et al., 1992; Bovenzi
and Betta, 1994; Xiang et al., 1999; Holmberg et al.,
2002; Gomez et al., 2003; Greenlee et al., 2005; Stal and
Englund, 2005; Cameron et al., 2006; Thelin and Holm-
berg, 2007; Thelin et al., 2009] should portray more accu-
rate findings. Greater standardization of methodologies in
particular case definition uniformity among MSD
researchers is warranted to improve research practices and
comparative analysis of findings.
Only one study [Holmberg et al., 2002] reported on
the lifetime prevalence of musculoskeletal symptoms
(90.6%). The reported high prevalence is unsurprising, as,
farming is a physically demanding job. The 1-year preva-
lence of MSDs ranged from 60% to 92% with an overall
pooled result of 76.9%. This prevalence is similar to that
recorded for other physical occupations such as veterinar-
ians (96%) [Scuffham et al., 2010] and horse riding
instructors (91%) [Lofqvist et al., 2009], where the roles
or tasks are somewhat comparable to those of farmers.
This suggests that similar occupational tasks and work-
place contexts or environments may be contributing fac-
tors to developing MSDs. These results suggest that
further research into the workplace and task contexts of
MSDs is required.
In all case–control and cohort studies farmers had
higher MSD prevalence rates than the non-farmer controls
[Croft et al., 1992; Bovenzi and Betta, 1994; Stal et al.,
1996; Holmberg et al., 2002; Greenlee et al., 2005; Thelin
and Holmberg, 2007; Thelin et al., 2009] thus, suggesting
that farmers are at particular risk of developing MSDs
compared with other occupational groups. A study of Brit-
ish male farmers suggested that several physical risk fac-
tors for MSDs were present more frequently among
farmers compared to blue-collar or white-collar workers
[Walker-Bone and Palmer, 2002]. The European Agency
for Safety and Health at Work [2010] reported skilled ag-
ricultural workers and those working in the fishing indus-
try having the highest prevalence of both backache
(59.7%) and muscular pains (57.6%) compared with nine
other occupations.
Female farmers reported approximately 10% higher
1-year prevalence of ‘‘any MSD’’ (83.3–92.9%) than their
male counterparts (73.7–82.1%). They also reported
higher prevalence of neck, neck/shoulder, upper back,
shoulder, elbow, hands/wrist, and foot MSDs. In more re-
cent literature, females also reported higher 1-year preva-
lence of LBP [Taechasubamorn et al., 2011] and back
pain [Liu et al., 2011] than men. The literature suggests
that women experience MSDs more frequently than men.
However, the accuracy of this observation may be in ques-
tion as the proportion of women included in the study
samples has been limited. A previous study, established
that women typically report physical symptoms 50% more
often than men [Kroenke and Spitzer, 1998]. Additional
research is required to establish whether the physical
natures of farming occupations are more detrimental to
the health of female workers.
Overall the spinal region was the most commonly af-
fected region reported in the studies (1-year prevalence
ranged from 8.6% to 81.3%), followed by the upper ex-
tremity (1-year prevalence ranged from 3.6% to 71.4%)
and then the lower extremity (1-year prevalence ranged
from 10.4% to 41%). Of the 24 studies, 14 reported on 1-
year LBP prevalence, suggesting that LBP among farmers
was the most frequent body part investigated. Also, LBP
had the highest prevalence figure compared with the other
body parts, which is consistent with the high LBP preva-
lence reported in recent farmer studies [Osborne et al.,
2010; Stocks et al., 2010; Taechasubamorn et al., 2011]. A
systematic review [Da Costa and Vieira, 2010] investigat-
ing risk factors of WMSDs identified heavy physical
work, awkward static and dynamic working postures, and
lifting as the main biomechanical risk factors for the de-
velopment of LBP. These findings might help explain why
LBP is so common among farmers, as their work environ-
ment may expose them to these risk factors on a regular,
if not daily basis. Other studies have shown that many
years of farming [Xiang et al., 1999], tractor work [Toren
et al., 2002; Gomez et al., 2003], and milking four or
more hours per day [Park et al., 2010] are associated with
greater prevalence of LBP. Unlike most occupations, farm-
ers usually start working on farms at a young age and
carry on farming well after the normal retirement age.
These factors may also contribute to the higher than aver-
age MSD prevalence rates. Given this occupational con-
text it may be useful for researchers to consider reporting
both 1-year and lifetime prevalence rates of LBP.
Fewer studies exist regarding the prevalence of upper
and lower extremity MSDs and, of these, most only pro-
vided 1-year prevalence results. This limited perspective
fails to capture more chronic symptoms such as osteoar-
thritis of the hip or knee. Findings from previous studies
indicate that farmers may have higher rates of hip osteoar-
thritis compared with other occupational groups [Holm-
berg et al., 2002; Walker-Bone and Palmer, 2002]
especially if they have farmed for over 10 years [Croft
et al., 1992]. A previous study reported, that as many as
one in five farmers may eventually require hip replace-
ment [Croft et al., 1992], highlighting the need to provide
interventions to avoid this. Research on upper extremity
MSDs such as the shoulder area had a 1-year prevalence
range of 25.9–71.4%. Four [Gustafsson et al., 1994; Stal
and Englund, 2005; Kolstrup et al., 2006; Nonnenmann
et al., 2008] out of the five studies investigating shoulder
problems related to pig or dairy farmers with the fifth
study [Rosecrance et al., 2006] including all farmer types.
Roscreance’s article found that farmers had a much lower
annual prevalence of shoulder disorders (25.9%),
156 Osborne et al.

compared with pig (43.2%), and dairy (47.6–54%) farm-
ers. These data indicate that there may be distinctive occu-
pational MSD profiles based on the type of farm work
regularly undertaken which warrants consideration in fu-
ture research.
Methodological Short Comings ofPrevalence Studies
Given the combined health science and agriculture
theme, the various terms for farmers, diversity of literature
sources and problems with certain databases, the electron-
ic search resulted in the identification of a very large num-
ber of articles that needed to be examined for this review.
However, when screened for inclusion criteria, this left a
substantially lower amount of studies available for inclu-
sion. This review found substantial heterogeneity across
the studies which made reporting single prevalence results
difficult.
While undertaking this systematic review of the MSD
prevalence literature several methodological limitations
were identified. The most common methodological short-
comings were lack of common case definition, lack of ap-
propriate sampling frame, inadequate sample size, and
bias in the measurement of health outcome. These short-
comings have consequences for the validity of the study
findings. Inappropriate sampling frames result in the possi-
bility of under representation of certain groups such as the
elderly, people who are retired or perhaps no longer work-
ing due to MSD-related disability (‘‘healthy worker ef-
fect’’). While census data provide one of the few datasets
that are thought to have minimal bias these are costly and
tend to be separated by a period measured in years thereby
limiting their utility in monitoring and evaluation studies.
Telephone interviews and self-administered questionnaires
are more feasible than personal interviews, but may not be
the most accurate [Loney et al., 1998]. Previous studies
[Rockwood and Stadnyk, 1994; Loney et al., 1998] indi-
cated that the sample size should be at least 300 subjects,
thus, a sample size of >300 was considered satisfactory
for this review. Finally, self-reported health outcomes can
include recall bias as farmers may not remember or may
be inaccurate in recall. On the basis of this review future
researchers need to carefully consider and clearly specify
their methodology.
CONCLUSION
The results from this systematic found a high preva-
lence of MSDs among farmers. The review established
that the spinal region is the most commonly investigated
region with LBP reported as the most frequent MSD, fol-
lowed by the upper and then the lower extremities. Also,
it confirmed that farmers have higher prevalence rates of
MSDs than non-farmer controls, suggesting farmers are at
a particular risk of developing MSDs compared with other
occupations. The prevalence ranges for many body parts
varied considerably between studies due to substantial het-
erogeneity across the studies. Improvements in methodo-
logical quality and homogeneity are required among
researchers to improve future research practices and allow
meaningful comparison of results. A number of potential
avenues of research were identified including, gender,
workplace, and task context of MSDs, and more research
regarding upper and lower extremity MSDs.
ACKNOWLEDGMENTS
The authors would like to acknowledge the Health
and Safety Authority and Teagasc the Irish Agricultural
Food Development Authority for research funding. We
would also like to acknowledge Kathryn Smith, University
College Dublin Deputy Head of Library Academic Ser-
vices, who assisted with search strategy and technical
help.
REFERENCES
Bovenzi M, Betta A. 1994. Low-back disorders in agricultural tractordrivers exposed to whole-body vibration and postural stress. ApplErgon 25:231–241.
Cameron L, Lalich N, Bauer S, Booker V, Bogue HO, Samuels S,Steege AL. 2006. Occupational health survey of farm workers byCamp Health Aides. J Agric Saf Health 12:139–153.
Croft P, Coggon D, Cruddas M, Cooper C. 1992. Osteoarthritis ofthe hip: An occupational disease in farmers. BMJ 304:1269–1272.
Da Costa BR, Vieira ER. 2010. Risk factors for work-related muscu-loskeletal disorders: A systematic review of recent longitudinal stud-ies. Am J Ind Med 53:285–323.
Firth H, Herbison P, McBride D, Feyer A-M. 2002. Low back painamong farmers in Southland, NZ. J Occup Health Saf 18:167–171.
Gomez MI, Hwang S, Stark AD, May JJ, Hallman EM, Pantea CI.2003. An analysis of self-reported joint pain among New York farm-ers. J Agric Saf Health 9:143–157.
Greenlee RT, Zentner J, Kieke B, Jr., Elliott J, Marlenga B. 2005.Farm health surveillance in the Marshfield Epidemiologic StudyArea: A pilot study. J Agric Saf Health 11:211–218.
Gustafsson B, Pinzke S, Isberg PE. 1994. Musculoskeletal symptomsin Swedish dairy farmers. Swed J Agric Res 24:177–188.
Hartman E, Oude Vrielink HH, Huirne RB, Metz JH. 2006. Riskfactors for sick leave due to musculoskeletal disorders among self-employed Dutch farmers: A case–control study. Am J Ind Med 49:204–214.
Health and Safety Executive H. 2007. Self-reported work-related ill-ness and workplace injuries in 2005/06. Results from the labourForce Survey 2007.
Higgins JPT, Green S, editors. 2011. Cochrane Handbook for Sys-tematic Reviews of Interventions Version 5.1.0 [updated March2011]: The Cochrane Collaboration, 2011. Available from www.cochrane-handbook.org
Musculoskeletal Disorders Among Farmers 157
Hildebrandt VH. 1995. Musculoskeletal symptoms and workload in12 branches of Dutch agriculture. Ergonomics 38:2576–2587.
Holmberg S, Stiernstrom EL, Thelin A, Svardsudd K. 2002. Muscu-loskeletal symptoms among farmers and non-farmers: A population-based study. Int J Occup Environ Health 8:339–345.
Kolstrup C. 2008. Work environment and health among Swedishlivestock workers. Doctoral Thesis Swedish University of Agricultur-al Sciences Thesis No: 2008: 43.
Kolstrup C, Stal M, Pinzke S, Lundqvist P. 2006. Ache, pain, anddiscomfort: The reward for working with many cows and sows?J Agromedicine 11:45–55.
Kroenke K, Spitzer RL. 1998. Gender differences in the reportingof physical and somatoform symptoms. Psychosom Med 60:150–155.
Liu X, Wang L, Stallones L, Wheeler KK, Zhao W, Smith GA,Xiang H. 2011. Back Pain among Farmers in a Northern Area ofChina. Spine (May 2011) 1528–1159.
Lofqvist L, Pinzke S, Stal M, Lundqvist P. 2009. Riding instructors,their musculoskeletal health and working conditions. J Agric SafHealth 15:241–254.
Loney PL, Chambers LW, Bennett KJ, Roberts JG, Stratford PW.1998. Critical appraisal of the health research literature: Prevalenceor incidence of a health problem. Chronic Dis Can 19:170–176.
Manninen P, Riihimaki H, Heliovaara M. 1996. Has musculoskeletalpain become less prevalent? Scand J Rheumatol 25:37–41.
McNeill M, O’Neill D. 1998. Occupational disorders in Ghanaiansubsistence farmers. In: Hanson MA, editor. Annual Conference ofthe Ergonomics-Society Royal-Agricultural-College Cirencester,England. pp 592–597.
NIOSH. 1997. Musculoskeletal disorders and workplace factors. Acritical review of epidemiologic evidence for work-related musculo-skeletal disorders of the neck, upper extremity, and low back. Publi-cation no. 97-141.
Nonnenmann MW, Anton D, Gerr F, Merlino L, Donham K. 2008.Musculoskeletal symptoms of the neck and upper extremities amongIowa dairy farmers. Am J Ind Med 51:443–451.
Osborne A, Blake C, McNamara J, Meredith D, Phelan J, Cunning-ham C. 2010. Musculoskeletal disorders among Irish farmers. OccupMed (Lond) 60:598–603.
O’Sullivan D, Cunningham C, Blake C. 2009. Low back pain amongIrish farmers. Occup Med 59:59–61.
Park H, Sprince NL, Whitten PS, Burmeister LF, Zwerling C. 2001.Risk factors for back pain among male farmers: Analysis of Iowafarm family health and hazard surveillance study. Am J Ind Med40:646–654.
Park JH, Lim HS, Lee K. 2010. Work-related musculoskeletal symp-toms among dairy farmers in Gyeonggi Province, Korea. J Prev MedPublic Health 43(3):205–212.
Rockwood K, Stadnyk K. 1994. The prevalence of dementia in theelderly: A review. Can J Psychiatry 39:253–257.
Rosecrance J, Rodgers G, Merlino L. 2006. Low back pain and mus-culoskeletal symptoms among Kansas farmers. Am J Ind Med49:547–556.
Scuffham AM, Legg SJ, Firth EC, Stevenson MA. 2010. Prevalenceand risk factors associated with musculoskeletal discomfort in NewZealand veterinarians. Appl Ergon 41:444–453.
Scutter S, Turker KS, Hall R. 1997. Headaches and neck pain infarmers. Aust J Rural Health 5:2–5.
Shipp EM, Cooper SP, del Junco DJ, Delclos GL, Burau KD, Torto-lero S, Whitworth RE. 2009. Chronic back pain and associated workand non-work variables among farmworkers from Starr County,Texas. J Agromedicine 14:22–32.
Stal MV, Englund JE. 2005. Gender difference in prevalence of up-per extremity musculoskeletal symptoms among Swedish pig farm-ers. J Agric Saf Health 11:7–17.
Stal M, Moritz U, Gustafsson B, Johnsson B. 1996. Milking is ahigh-risk job for young females. Scand J Rehabil Med 28:95–104.
Stocks SJ, Turner S, Carder M, Hussey L, McNamee R, Agius RM.2010. Medically reported work-related ill-health in the UK agricul-tural sector. Occup Med (Lond) 60:340–347.
Taechasubamorn P, Nopkesorn T, Pannarunothai S. 2011. Prevalenceof low back pain among rice farmers in a rural community inThailand. J Med Assoc Thai 94:616–621.
Thelin A, Holmberg S. 2007. Hip osteoarthritis in a rural male popu-lation: A prospective population-based register study. Am J Ind Med50:604–607.
Thelin N, Holmberg S, Nettelbladt P, Thelin A. 2009. Mortality andmorbidity among farmers, nonfarming rural men, and urban refer-ents: A prospective population-based study. Int J Occup EnvironHealth 15:21–28.
Toren A, Oberg K, Lembke B, Enlund K, Rask-Andersen A. 2002.Tractor-driving hours and their relation to self-reported low-back andhip symptoms. Appl Ergon 33:139–146.
Walker-Bone K, Palmer KT. 2002. Musculoskeletal disorders infarmers and farm workers. Occup Med (Lond) 52:441–450.
Wallace B, Schmid C, Lau J, Trikalinos T. 2009. Meta-Analyst: Soft-ware for meta-analysis of binary, continuous and diagnostic data.BMC Med Res Methodol 9:80.
Whelan S, Ruane DJ, McNamara J, Kinsella A, McNamara A. 2009.Disability on Irish farms—A real concern. J Agromedicine 14:157–163.
Woolf AD, Pfleger B. 2003. Burden of major musculoskeletal condi-tions. Bull World Health Organ 81:646–656.
Xiang H, Stallones L, Keefe TJ. 1999. Back pain and agriculturalwork among farmers: An analysis of the Colorado Farm FamilyHealth and Hazard Surveillance Survey. Am J Ind Med 35:310–316.
158 Osborne et al.