prevalence of prostate cancer metastases after intravenous ... · prevalence of prostate cancer...
TRANSCRIPT

Prevalence of Prostate CancerMetastases after IntravenousInoculation Provides Cluesinto the Molecular Basisof Dormancy in the BoneMarrow Microenvironment1
Younghun Jung*,2, Yusuke Shiozawa*,2,Jingcheng Wang*, Natalie McGregor†, Jinlu Dai†,Serk In Park*, Janice E. Berry*, Aaron M. Havens*,‡,Jeena Joseph*, Jin Koo Kim*, Lalit Patel†,Peter Carmeliet§, Stephanie Daignault¶,Evan T. Keller†, Laurie K. McCauley*,#,Kenneth J. Pienta†,3 and Russell S. Taichman*,3
*Department of Periodontics and Oral Medicine,University of Michigan School of Dentistry, Ann Arbor, MI;†Departments of Urology and Internal Medicine, Universityof Michigan Medical School, Ann Arbor, MI; ‡Departmentof Orthodontics and Pedodontics, University of MichiganSchool of Dentistry, Ann Arbor, MI; §Laboratory ofAngiogenesis & Neurovascular Link, Vesalius ResearchCenter (VRC), VIB, K.U. Leuven, Belgium; ¶BiostatisticsCore Facility, University of Michigan Cancer Center,Ann Arbor, MI; #Department of Pathology, Universityof Michigan School of Medicine, Ann Arbor, MI
AbstractBone is the preferredmetastasis site of advanced prostate cancer (PCa). Using an in vivomurinemodel of humanPCacell metastasis to bone, we noted that the majority of animals that develop skeletal metastasis have either spinallesions or lesions in the bones of the hindlimb. Much less frequently, lesions develop in the bones of the forelimb.We therefore speculated whether the environment of the forelimb bones is not permissive for the growth of PCa.Consequently, data on tumor prevalence were normalized to account for the number of PCa cells arriving after intra-vascular injection,marrowcellularity, and number of hematopoietic stemcell niches. None of these factorswere ableto account for the observed differences in tumor prevalence. An analysis of differential gene and protein levels iden-tified that growth arrest specific-6 (GAS6) levels were significantly greater in the forelimb versus hindlimb bone mar-row. When murine RM1 cells were implanted into subcutaneous spaces in immune competent animals, tumorgrowth in the GAS6−/− animals was greater than in GAS6+/+ wild-type animals. In an osseous environment, thehuman PC3 cell line grew significantly better in vertebral body transplants (vossicles) derived from GAS6−/− animalsthan in vossicles derived from GAS6+/+ animals. Together, these data suggest that the differences in tumor preva-lence after intravascular inoculation are a useful model to study the molecular basis of tumor dormancy. Importantly,these data suggest that therapeuticmanipulation of GAS6 levels may prove useful as a therapy for metastatic disease.
Neoplasia (2012) 14, 429–439
Address all correspondence to: Russell S. Taichman, DMD, DMSc, Department of Periodontics and Oral Medicine, University of Michigan School of Dentistry, 1011 NUniversity Ave, Ann Arbor, MI 48109-1078. E-mail: [email protected] work is directly supported by the National Cancer Institute (CA163124, CA093900, L.K.M., E.T.K., K.J.P., and R.S.T.), the Fund for Cancer Research (R.T.), the De-partment of Defense (L.K.M., E.T.K., K.J.P., Y.S., S.I.P., and R.S.T.), and the Prostate Cancer Foundation (K.J.P. and R.S.T.). K.J.P. receives support as an American CancerSociety Clinical Research Professor, National Institutes of Health SPORE in prostate cancer grant P50 CA69568, and the Cancer Center support grant P30 CA46592.2These authors contributed equally as first authors.3These authors contributed equally as senior authors.Received 12 December 2011; Revised 27 February 2012; Accepted 5 April 2012
Copyright © 2012 Neoplasia Press, Inc. All rights reserved 1522-8002/12/$25.00DOI 10.1596/neo.111740
www.neoplasia.com
Volume 14 Number 5 May 2012 pp. 429–439 429

IntroductionProstate cancer (PCa) is the most commonly diagnosed malignancy inUS men [1]. Bone is the preferred site of metastasis in advanced PCaand the only clinically evident site of metastasis at the time of deathin many individuals [2]. Therefore, there is great need for the de-velopment of therapeutic strategies that target advanced PCa and itsinteractions with bone. A prerequisite for the development of newtherapeutics is an improved understanding of the fundamental mecha-nisms that regulate the metastatic process, including dormancy andgrowth of tumor cells in bone.
To study bone metastases using human tumor cells, many investi-gators have turned to an intracardiac injection model in immunodefi-cient animals [3]. Since the introduction of the model [4], a growingunderstanding of the initial events that lead to metastases has occurred.The identification of several homing factors [3,5,6], host and tumor-derived factors that are essential for tumor growth in bone [7,8], hasbeen achieved. Hematopoietic stem cells (HSCs) “home” to the bonemarrow, as do PCa cells, and compete for occupancy of the HSC niche[9]. One of the molecular determinants for these events, the CXC che-mokine stromal–derived factor 1 (SDF-1 or CXCL12) and its recep-tors, CXCR4 and CXCR7, seem to play pivotal roles in nichecompetition [5,10]. Once in the marrow, tumor cells engage in crosstalk with microenvironmental cells including hematopoietic cells andmesenchymal-derived cells, which activate signaling pathways to estab-lish a vicious cycle of tumor growth and bone remodeling [6].
Whereas intracardiac injection of PCa cells into immune-deficientmice has lead to significant advances in our understanding of the hom-ing and tumor-stromal cross talk, slower progress has been made inunderstanding themolecular basis of dormancy. Using the intracardiacmodel, we have noted that most animals that develop skeletal metastasishave either spinal or mandibular lesions or lesions in the bones of thehindlimb. Rarely do lesions develop in the bones of the forelimb. Wespeculated that there is something unique about these tissues that isnot permissive for tumor growth. We used the observed differencesin tumor prevalence in the forelimbs versus hindlimbs as a model toexplore the molecular basis of dormancy from the perspective ofthe microenvironment.
Materials and Methods
Intracardiac InjectionsThe PC3 (CRL-1435) PCa cell line was obtained from the Ameri-
can Type Culture Collection (Rockville, MD). Intracardiac injec-tions of luciferase-labeled PC3 cells, PC3Luc, were performed in6- to 8-week-old male Hsd:Athymic Nude-Foxn1nu (Harlan, Haslett,MI), CB.17. SCID, NOD.CB17-Prkdcscid/J, or NOD/SCID/IL-2Rγnull mice ( Jackson Laboratory, Bar Harbor, ME) under 3% iso-flurane anesthesia (Abbott Laboratories, North Chicago, IL). All theanimal experimental procedures were approved by the University ofMichigan Committee for the Use and Care of Animals. Left ventric-ular cardiac injections were performed with 1 × 10⁵ cells suspended in100 μl of phosphate-buffered saline (PBS) using a 27-gauge needle.
GAS6−/− MiceHomozygous GAS6−/− mice were originally generated by homolo-
gous recombination in the laboratory of Dr Carmeliet (University inLeuven) as described [11]. Five- to seven-week-oldGAS6−/−mice wereused for experimental tumor growth. All experimental procedures
were approved by the University of Michigan Committee for the Useand Care of Animals.
In Vivo Assay of GAS6−/− Effect on SubcutaneousTumor Development
To evaluate tumor growth, subcutaneous tumors were established.RM1 cells (1 × 10⁴ cells) were mixed in growth factor–reducedMatrigel(Collagen type 1 Rat Tail; BD Biosciences, Bedford, MA). Five- toseven-week-old male C57BL6 background wild-type (GAS6+/+) orGAS6−/− mice were anesthetized with isoflurane inhalation. After shav-ing and cleaning the skin, subcutaneous injections using a 25-gaugeneedle were used to establish the tumors. The animals were monitoreddaily, and tumor volumes were evaluated every 3 days, from day 13 to23. Tumor volumes were calculated using the formula V = the shortestdiameter × the longest diameter × height.
BioluminescenceTumor incidence was evaluated by bioluminescence imaging (BLI)
4 to 6 weeks after tumor inoculation. Mice were injected intraperitone-ally with luciferin (100 μl at 40 mg/ml in PBS) before imaging. Micewere anesthetized with 1.5% isoflurane/air and a Xenogen IVIS (CaliperLife Sciences, Hopkinton, MA) cryogenically cooled imaging system wasused. Bioluminescence generated by the luciferin/luciferase reaction servedas a locator for cancer growth and was used for quantification using theLivingImage software (Caliper Life Sciences) on a red (high intensity/cellnumber) to blue (low intensity/cell number) visual scale. A digital grayscaleanimal imagewas acquired followed by acquisition and overlay of a pseudo-color image representing the spatial distribution of detected photon countsemerging from active luciferase within the animal. Signal intensity wasquantified as the sum of all detected photons within the region of interestduring a 1-minute luminescent integration time. Tumor incidence wasscored on a dichotomous scale as being either positive or negative if animalshad at least one lesion detected in either the humeri or tibial/femur region.
For evaluating of tumor growth of PCa cells in an osseous environ-ment devoid ofGAS6, the lumbar vertebrae were isolated fromGAS6+/+
or GAS6 −/− mice 7 days after birth. The vertebrae were sectioned intosingle vertebral bodies (vossicles). Severe combined immunodeficient(SCID) mice were used as transplant recipients. Four vossicles permouse were implanted into subcutaneous space. Before implantation,luciferase-labeled PC3 cells (PC3Luc ) were introduced into vossicles(20,000 cells/10 μl of PBS). Mice were imaged at 2 weeks by BLI.
Disseminated Tumor Cell Quantification by Real-timePolymerase Chain Reaction
The number of disseminated tumor cells (DTCs) in bone was iden-tified using real-time polymerase chain reaction (PCR) [12]. Here, ge-nomic DNA from the designated tissues was isolated using a DNeasyBlood and Tissue Kit (Qiagen, Valencia, CA). Sample concentrationswere standardized in each reaction to exclude false-positive results.Real-time PCRs were performed using 15 μl of TaqMan PCR Mastermix, 100 nM human Alu TaqMan primers (F – 5′-CAT GGT GAAACC CCG TCT CTA-3′, R – 5′-GCC TCA GCC TCC CGA GTAG-3′), TaqMan probe (5′-FAM-ATT AGC CGG GCG TGG TGGCG-TAMRA-3′) (Applied Biosystems, Foster City, CA) [13], and2 μg of isolated tissue DNA in a total volume of 30 μl. The level ofexpression was detected as an increase in fluorescence using an ABIPRISM 7700 instrument (Applied Biosystems). The DNA levels wereexpressed as relative copies (% control) normalized against murineβ-actin (catalog no. 4331182; Applied Biosystems), and a standard
430 GAS6 Regulates Metastatic Dormancy Jung et al. Neoplasia Vol. 14, No. 5, 2012

curve was constructed from serial dilutions of a purified Alu comple-mentary DNA fragment cloned by classic PCR. Numerical data weredetermined against a standard curve established using murine bonemarrow containing log-fold dilutions of human PCa cells. Positiveand negative controls included tissues obtained from non–PCa-injected mice or DNA derived directly from PCa cells.
Flow CytometryFor analyzing HSCs from forelimbs and hindlimbs of SCID mice,
the bone marrow cells were flushed from the humerus, femur, andtibia. Cells were incubated first with a biotinylated anti-Lineage(CD5, CD45R [B220], CD11b, Gr-1 [Ly- 6G/C], and Ter-119)antibody cocktail (Miltenyi Biotec, Auburn, CA) for 10 minutes at4°C, then rinsed and stained with an antibody cocktail of APC-anti–stem cell antigen 1 (Sca-1) (clone D7; eBioscience, San Diego, CA),PE/Cy7–anti–c-Kit (clone 2B8; BioLedge, San Diego, CA), PE–anti-CD150 (clone TC15-12F12.2; BioLegend), fluorescein isothiocyanate(FITC)–anti-CD41 (clone MWReg30; BD Biosciences), FITC–anti-CD48 (clone BCM-1; BD Biosciences), and FITC–anti-Biotin anti-bodies (Miltenyi Biotec) for another 30 minutes at 4°C. HSCs wereanalyzed on a FACS Vantage dual laser flow cytometer (BectonDickinson, Franklin Lakes, NJ) by gating on cells that wereCD150+CD41−CD48− Lin−Sca-1+cKit+ (termed SLAM HSCs).For the cell surface expression of AXL, SKY, and MER, RM1 cells
were stained with anti-mouse AXL, SKY, andMER antibodies (catalognos.MAB8541,MAB759, andMAB591; R&DSystems,Minneapolis,MN) or isotype-matched IgG control for 30 minutes at 4°C, and then
stained with PE–anti-rat-IgG antibody (catalog no. F0105B; R&DSystems) for another 30 minutes at 4°C. The cell surface expressionof AXL, SKY, and MER on RM1 cells were analyzed on a FACSVantage dual-laser flow cytometer (Becton Dickinson).
RNA Extraction and Real-time PCRTotal RNA was isolated using the RNeasy Mini Kit (Qiagen). First-
strand complementary DNA was synthesized in a 20-μl reaction vol-ume using 0.4 μg of total RNA. Reverse transcriptase products wereanalyzed by real-time PCR in TaqMan Gene Expression Assays (Ap-plied Biosystems). TaqMan gene expression assays were used for detec-tion of SDF-1, Annexin II (anxa2), TGF-β1, IL15, CCL2, GAS6,AXL, SKY, MER, and β-actin (FAM/MGB probes; Applied Bio-systems). The second-step PCRs were run for 40 cycles (95°C for15 seconds and 60°C for 1 minute) after an initial single cycle of50°C for 2 minutes and 95°C for 10 minutes. The PCR product wasdetected using an ABI PRISM 7700 instrument (Applied Biosystems).RNA quantity (CR) was normalized to the housekeeping gene β-actincontrol by using the formula CR = 2(40 − Ct of sample) − (40 − Ct of control).The threshold cycle (C t) is the cycle at which a significant increase influorescence occurs.
HistologyThe humeri and femora of SCIDmice that were used for immunos-
taining were fixed and then decalcified and paraffin embedded. Tissuesections were dewaxed and rehydrated, then blocked with Image-iTFX signal enhancer for 30 minutes, and incubated for 2 hours at room
Table 1. Prevalence of Bone Lesions after Intracardiac Injection.
Tumor Model Animal Model n No. Animals with BLI Evidenceof Bone Lesions
Tumor Prevalence (%)
Forelimb Hindlimb Forelimb Hindlimb
PC3Luc Hsd:Athymic Nude-Foxn1nu 8 1 2 13 25PC3Luc Hsd:Athymic Nude-Foxn1nu 19 1 2 5 11PC3Luc Hsd:Athymic Nude-Foxn1nu 11 1 2 5 9PC3Luc Hsd:Athymic Nude-Foxn1nu 10 3 5 15 25PC3Luc Hsd:Athymic Nude-Foxn1nu 10 1 3 10 30PC3Luc Hsd:Athymic Nude-Foxn1nu 18 0 9 0 50
Predicted Prevalence (95% Confidence Interval) 9 (04-18) 30 (21-41)*PC3Luc CB.17 SCID 26 0 5 0 19PC3Luc CB.17 SCID 29 1 11 0 38PC3Luc CB.17 SCID 54 2 16 4 30PC3Luc CB.17 SCID 54 4 16 7 30PC3Luc CB.17 SCID 10 0 1 0 10PC3Luc CB.17 SCID 10 0 1 0 10PC3Luc CB.17 SCID 19 0 4 0 21PC3Luc CB.17 SCID 10 1 0 10 0PC3Luc CB.17 SCID 10 1 10 10 100PC3Luc CB.17 SCID 35 0 4 0 11
Predicted Prevalence (95% Confidence Interval) 6 (03-10) 26 (20-32)*PC3Luc NOD/SCID 50 4 22 8 44PC3Luc NOD/SCID 50 3 23 6 46
Predicted Prevalence (95% Confidence Interval) 7 (03-14) 45 (36-55)*PC3Luc NOD/SCID/IL-2Rγnull 29 2 21 7 72PC3Luc NOD/SCID/IL-2Rγnull 10 2 10 20 100PC3Luc NOD/SCID/IL-2Rγnull 10 0 1 0 10
Predicted Prevalence (95% Confidence Interval) 10 (03-33) 55 (34-75)*Predicted Probability of Tumor Across all Animal Models† 7 (5-10) 33 (28-38)†
Luciferase-labeled human PC3 cells (PC3Luc) were injected into the left heart ventricle of immunodeficient mice, and the development of metastases was tracked by BLI imaging up to 6 weeks. Lesions inthe forelimb (humerus, radius, and ulna) or hindlimb (femur, tibia, and fibula) regions were scored as either present or absent. Predicted prevalence, 95% confidence intervals, and associated P valueswere generated from the repeated measures logistic model for forelimb and hindlimb prevalence.*Compare forelimb and hindlimb prevalence within animal model, P < .05.†Overall test of prevalence of tumor compared between forelimb and hindlimb, P < .0001.
Neoplasia Vol. 14, No. 5, 2012 GAS6 Regulates Metastatic Dormancy Jung et al. 431

temperature in the dark with 10 μg/ml primary antibodies combinedwith reagents of Zenon Alexa Fluor 555(red) labeling kit. Anti-GAS6antibody (R&D Systems, Minneapolis, MN) or rabbit polyclonalanti–Ki-67 (Abcam) was applied to sections. The antibodies were di-luted in PBS plus 0.2% Triton X-100. Sections were postfixed with10% formalin for 10 minutes followed by processing with ProLongGold antifade reagent with 4′,6-diamidino-2-phenylindole (DAPI)medium and covered with cover glass. Images were taken with anOlympus FV500 confocal microscope (Olympus, Center Valley, PA).
Apoptosis was evaluated using FragEL DNA Fragmentation De-tection Kit (Calbiochem, San Diego, CA). Here tissue slides weredeparaffinized and rehydrated and then processed following the man-ufacturer’s instructions. After developing in 3,3′-diaminobenzidinetetrahydrochloride solution, slides were rinsed in water and counterstainedwith methyl green. Slides were then dehydrated in ethanols, dipped inxylene, and mounted in Permount (Sigma-Aldrich, St Louis, MO).
ELISAAn antibody sandwich ELISAwas used to evaluate GAS6 expression
in the marrow from the forelimbs and hindlimbs of SCID mice and
WT mice or GAS6KO mice as a negative control by following the di-rections of the manufacturer (catalog no. DY986; R&D Systems).Bone marrow extracellular fluids were obtained by flushing humeri,femora, and tibiae with 500 μl of ice-cold PBS, and the supernatantwas harvested by centrifugation at 400g for 5 minutes. GAS6 levelswere normalized to the total cell number.
Statistical MethodsA repeated-measures logistic model was used to find the predicted
probabilities of having an arm tumor or a leg tumor. Tumor prevalenceis the binary outcome, with limb type and animal model type includedas independent covariates. An unstructured correlation was used toaccount for the repeated measures within the model (i.e., each mousehas tumor incidence for the hindlimb and tumor incidence for theforelimb in the model).
Numerical data are expressed as mean ± standard deviation unlessspecified otherwise. The prevalence of tumor lesions was also evaluatedagainst the differences in the immunodeficiency of the animal mod-els using a Mantel-Haenszel χ2 test. For the real-time PCR assays, a
Figure 1. Prevalence of DTCs in murine marrow and relationship to HSC niches. Luciferase-labeled human PC3 cells were injected intothe left heart ventricle of immunodeficient mice. (A) At 24 hours later, the number of PCa cells present in the bones was identified usingreal-time PCR by detecting human Alu sequences and normalized with murine β-actin. Numerical data were established against a stan-dard curve. (B) Total nucleated cells in SCID marrow. (C) Data presented in A normalized by total marrow present in each of the bones(B). Data are presented as mean ± standard deviation. (D) HSC numbers were used to establish an indirect reflection of HSC niche num-bers. HSCs were quantified by FACS based on the expression of the SLAM family of receptors CD150+CD48−CD41−Lin−Sca1+C-kit+).Data are presented as mean ± standard deviation.
432 GAS6 Regulates Metastatic Dormancy Jung et al. Neoplasia Vol. 14, No. 5, 2012
Kruskal-Wallis test and Dunn multiple comparisons tests were usedwith the level of significance set at P < .05.Vossicle outcomes of bioluminescence, volume, and weight were
analyzed using generalized estimating equations to account for thepaired experimental design. The correlation structure was assumedto be unstructured and was designed with location of vossicle nestedwithin the mouse. The independent covariate in the model was grouptype, and comparisons were made between GAS6 KO versuswild type.Unpaired two-tailed Student’s t tests were used for all other contin-
uous covariate analyses. The t tests and nonparametric tests were per-formed using the GraphPad Instat statistical program (GraphPadSoftware, San Diego, CA). SAS 9.3 (SAS Institute, Cary, NC) wasused for all modeling. Statistical significance was set at P < .05.
Results
Prevalence of Bone LesionsBone is the preferred metastatic site of advanced PCa. To create
bone metastasis, luciferase-labeled human PCa cells (PC3Luc ) were in-jected into the left heart ventricle of immunodeficient mice, and themetastases of these cells were followed by BLI imaging over time. In-triguingly, we noticed that the prevalence of lesions in the long boneswas not equally distributed; with fewer lesions in the arms (humeri,radius, and ulna) versus those observed in the hindlimb region (femur,tibia, and fibula). To formally examine which long bones are the targetsof metastases, a retrospective examination across different experimentsand murine strains was performed in which we scored as either presentor absent animals with lesions in the forelimb or hindlimb region(Table 1). Predicted prevalence and associated P values were generatedfrom the repeated measures logistic model for forelimb and hindlimbprevalence. The prevalence of lesions identified in the hindlimb was sig-nificantly greater than that observed in the forelimb (Table 1). Thesedata indicate the probability that 7% of the mice would develop a fore-limb tumor (95% confidence interval, 5%-10%) and 33% of themice would develop a hindlimb tumor (95% confidence interval,28%-38%). The predicted probability of a forearm tumor is signifi-cantly less than that of a leg tumor (P < .0001).Our studies were performed in immunodeficient mouse models, in-
cluding single-gene mutation models such as nude (Hsd:AthymicNude-Foxn1nu), severe combined immunodeficient (CB.17. SCID),nonobese diabetic (NOD.CB17-Prkdcscid/J), and strains with targeteddeletion of IL-2Rγnull on the NOD/SCID background (NOD/SCID/IL-2Rγnull). These models of increasing immunodeficiency affordedthe opportunity to examine differences in tumor prevalence betweenthe different animal models. We observed that the proportion of micewith hindlimb lesions increases with increasing immunodeficiency ofthe animal (Mantel-Haenszel χ2, P = .0018; Table 1). However, theanimal model type did not demonstrate different probabilities ofdeveloping tumors in the forelimb.
Prevalence of DTCsA possible reason for the noted differences in tumor prevalence be-
tween the bones of the forelimb versus those of the hindlimb may bedue to the differences in the ability of the tumor cells to traffic in thevasculature. To explore this possibility, intracardiac injection ofPC3Luc cells was performed, and 24 hours later, the number of PCacells present in the bones was identified using real-time PCR.Figure 1A demonstrates that within 24 hours, the number of DTCsin the humerus was approximately 25% of the total found in the
femur. Because this difference could in part explain the observed dif-ferences in tumor incidence reported in Table 1, we next normalizedthe results against total nucleated marrow cells present in each of thebones (Figure 1B). As shown in Figure 1C , when normalized to totalnucleated marrow cells, the number of DTCs in the hindlimb bones(femur + tibia) was only 1.4-fold greater in number than that in thehumerus. Using 1.4-fold to normalize for the differences in cells arriv-ing into the forelimb versus the hindlimb bones, the observed incidencein osseous lesions, we would therefore expect ∼9% of the animals tohave lesions located in their arm. These data suggest that the dif-ferences in the prevalence of tumors in the limbs of the animals arenot likely due to the differences in tumor cell trafficking or homingto the marrow.
Prevalence of Tumors in Relationship to HSC NichesPreviously, we reported that PCametastases usurp theHSC homing
pathways to establish footholds in the marrow [5]. More recently, wedemonstrated that disseminated PCa cells directly compete withHSCsfor occupancy of the HSC niche and that increasing/decreasing nichesize alters dissemination [9]. Therefore, a second possibility that mayexplain the observed tumor prevalence could be the number of avail-able HSC niches in the humerus versus the femur. Because there is nodirect method to identify the number of niches present in any tissue,and bone marrow transplant data suggest that only 1% to 5% of HSCniches are unoccupied at any single time [14], we chose to examine
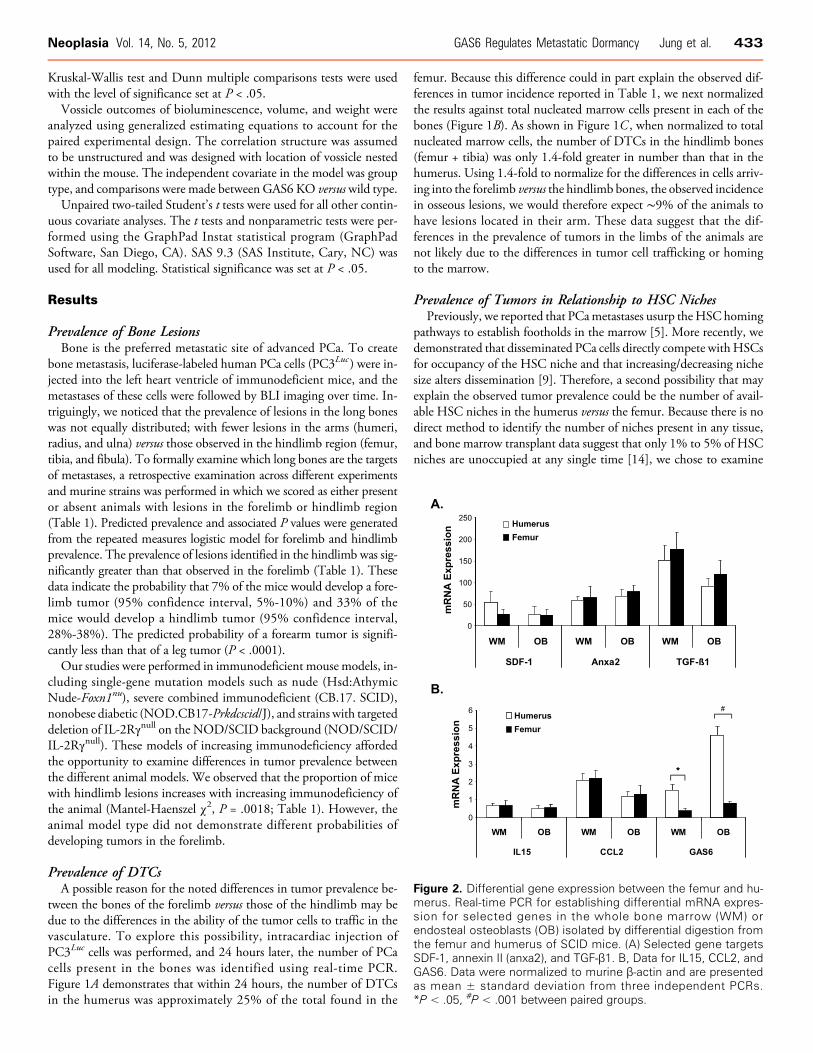
Figure 2. Differential gene expression between the femur and hu-merus. Real-time PCR for establishing differential mRNA expres-sion for selected genes in the whole bone marrow (WM) orendosteal osteoblasts (OB) isolated by differential digestion fromthe femur and humerus of SCID mice. (A) Selected gene targetsSDF-1, annexin II (anxa2), and TGF-β1. B, Data for IL15, CCL2, andGAS6. Data were normalized to murine β-actin and are presentedas mean ± standard deviation from three independent PCRs.*P < .05, #P < .001 between paired groups.
Neoplasia Vol. 14, No. 5, 2012 GAS6 Regulates Metastatic Dormancy Jung et al. 433

HSC numbers as an indirect reflection of HSC niche numbers. Here,FACS was used to quantify HSCs using the expression of the SLAMfamily of receptors as previously demonstrated (CD150+CD48−CD41−
Lin−Sca1+C-kit+) [15]. On the basis of this analysis, it was noted thatthe total number of HSCs in the humerus was ∼3.5 times larger thanin the femur (Figure 1D). Therefore, if the number of HSCs reflects thenumber of HSC niches, one would expect to observe a greater prev-alence of tumors in the forelimbs than in the hindlimbs. Based on thisanalysis, it seems unlikely that the number of HSC niches aloneexplains the observed differences in tumor prevalence.
Differential Gene Expression in the Forelimband Hindlimb Bones
Previous work from our group has demonstrated that endostealosteoblasts play a significant role in establishing the HSC niche[16–19]. Moreover, it is this niche that is targeted by PCa dur-ing metastasis [9]. To explore the molecular mechanisms in tumorprevalence in different bones, whole bone marrow or endosteal
osteoblasts were isolated from the humeri, femora, and tibiae of SCIDmice, and real-time PCR was performed for selective gene targets. Pre-viously, we have shown that SDF-1 serves a chemoattractant andgrowth factor for PCa in bone [5,10,20–25], and annexin II (anxa2)serves as an adhesion factor for PCa [26]. Therefore, our initial screenincluded examinations for SDF-1 and anxa2. There were no differ-ences in messenger RNA (mRNA) expression for SDF-1 or anxa2 be-tween the whole marrow or osteoblasts isolated from the forelimb andhindlimb bones (Figure 2A). Similarly, no differences were observed inthe expression of TGF-β1, IL15 and CCL2, which were examinedowing to their known roles in metastasis and dormancy [7,27–30](Figure 2, A and B). In previous studies, we reported that GAS6 inhi-bits proliferation of PCa cell lines and provides protection fromchemotherapy [31]. In addition, GAS6 is a protein known to play arole in suppressing HSC proliferation [32]. Surprisingly, the expres-sion of GAS6 mRNA was significantly greater in both the wholemarrow and the osteoblast fractions isolated from the forelimb versusthose isolated from the hindlimb bones (Figure 2B ).
Figure 3. GAS6 protein levels differs between the humerus and femur. (A-L) Representative tissue samples immunostained with anti-GAS6 antibody and counterstained with DAPI nuclear of paired samples from three mice (A-D, E-H, I-L). Original magnification, ×40(A, C, E, G, I, K) or ×20 (B, D, F, H, J, L). Scale bar, 100 μm. (M) Levels of GAS6 in the extracellular marrow fluids were determined byELISA normalized by total cell numbers. Data are presented as mean ± standard deviation from triplicate determinations. *P < .05between paired groups.
434 GAS6 Regulates Metastatic Dormancy Jung et al. Neoplasia Vol. 14, No. 5, 2012

GAS6 Expression Differences between Forelimband Hindlimb BonesTo validate and extend our mRNA expression studies, we explored
further if indeed GAS6 protein levels in the humeri were greater thanthose in the femora and tibiae at the protein level. Here, immuno-histochemical staining for GAS6 was performed. We observed that,indeed GAS6 levels were higher in the humeri versus the femur bones(Figure 3). Moreover, the staining was localized to the bone surfaceseither at trabeculae or at the endosteal surfaces compared to its expression
in more central marrow locations (Figure 3, A-L). Examinationof GAS6 levels in extracellular marrow supernatants further demon-strated that the levels of GAS6 in humerus were greater than thosefound in the femur (Figure 3M ).
Growth of PCa Cells in a GAS6-Deficient EnvironmentIf GAS6 limits PCa growth, then PCa cells implanted intoGAS6−/−
animals would be expected to result in the growth of larger tumors
Figure 4. Growth of PCa cells in a GAS6-deficient environment. Expression of GAS6 receptors AXL, SKY, and MER in murine RM1 PCacells by (A) real-time PCR and (B) FACS. (C) Murine RM1 PCa cells were implanted into GAS6+/+ or GAS6−/− animals, and tumor volumewas measured over time by caliper measurements. Data are presented as mean ± standard deviation from triplicate determinations.Differences in growth were noted on days 21 and 23 (*P < .05 between paired groups).
Neoplasia Vol. 14, No. 5, 2012 GAS6 Regulates Metastatic Dormancy Jung et al. 435

compared to tumors grown in wild-type control animals. To test this,murine RM1 PCa cells were first evaluated for their expression of theGAS6 receptors including AXL, SKY, and MER to ensure that GAS6signaling could occur. Using real-time PCR, AXL expression was sig-nificantly higher thanMER and SKY, and GAS6 levels were extremelylow (Figure 4A). At the protein level, AXL expression was also signif-icantly higher than SKY andMER. (Figure 4B). RecentlyGAS6 −/− ani-mals were generated and made available for experimentation [11].After validating that these animals do not express GAS6 (Figure 3M),we used thismodel in conjunctionwith RM1 cells to determinewhetherGAS6 regulates PCa growth in vivo. Critically, when RM1 cells wereimplanted into the subcutaneous spaces of immune-competent animals,tumor growth in theGAS6−/− animals was greater than that inGAS6+/+
control animals (Figure 4C).
Growth of PCa Cells in an Osseous EnvironmentDevoid of GAS6
Our group has developed an osteogenic assay in which neonatalskeletal elements from bone in vivo (e.g., vertebral bodies or “vossicles”)are used to create an ectopic bone marrow environment where boneniches are generated and can be studied [33]. Here, vossicles fromwild-type or GAS6−/− neonates were seeded with luciferase expressingcells (PC3luc) and implanted into SCIDmice. Over time, tumor growthwas evaluated by BLI and by measuring tumor volume and weight.PC3luc cells grew significantly better in vossicles derived fromGAS6 −/− animals compared to tumor cells implanted into vossicles de-rived from wild-type animals (Figure 5, A-C ). Ki-67– stained tissuesidentified more proliferating cells in tumors grown on GAS6−/− vossi-cles versus GAS6+/+ vossicles (Figure 5D). At the same time, there was
Figure 5. PCa cells grow more rapidly in an osseous environment devoid of GAS6. Paired vossicles from GAS6+/+ or GAS6−/− neonateswere seeded with luciferase-expressing cells (PC3luc) and implanted into the backs of SCIDmice. (A) Over time, the growth of tumors wasevaluated by BLI imaging (left), which was quantified (right). (B) Gross examination of tissues on resection. (C) Tumor volume and weight.Representative tissue samples immunostained for (D) Ki-67 and (E) TUNEL staining. Data are presented as mean ± standard deviation.
436 GAS6 Regulates Metastatic Dormancy Jung et al. Neoplasia Vol. 14, No. 5, 2012

no significant difference in apoptotic cells in tumor grown in GAS6 −/−
vossicles versus GAS6+/+ vossicles, as determined by TUNEL staining(Figure 5E ). These observations suggest that the differences in tumorgrowth arose mostly from an alteration of proliferation rather thanchanges in apoptosis and further suggest that GAS6 limits tumor cellgrowth within an osseous environment.
DiscussionThe development of PCa disease and its spread to bone remain a majorcause of morbidity and mortality in males. Considerable progress hasbeen made in early diagnosis, but once the tumor spreads to distanttissues, survival drastically declines. In 1889, Stephen Paget proposed
a “seed-and-soil” metaphor to explain the marked affinity of cancercells for different tissues: “when a plant goes to seed, its seeds are carriedin all directions; but they can only grow if they fall on congenial soil”[34]. More than a century later, the molecular basis for Paget’s obser-vations remains unclear. The present work explores the seed-and-soilhypothesis using an animal model of human PCa bone metastasis.Collectively, our group has performed many metastatic assays, andthe differences betweenmetastatic lesions found in the forelimbs versusthe hindlimbs are striking. These differences do not seem to dependon the animal model used. Moreover, the difference seems to be re-flected in human disease [35–38]. These observations led us to a moreformalized study to determine the molecular basis of the seed andsoil hypothesis.
A possible explanation for the observations that fewer lesions are ob-served in the arms than in the hindlimb regions of mice is based on car-diac output to these regions. This view centers on the “hydrodynamic”or “mechanical” theory that was first proposed by Ewing, which sug-gested that arterial blood flow was a major determining factor in the fre-quency of tumor incidence in any given site [39]. Yet surprisingly verylittle has been published in the context of cardiac output for the appen-dicular skeleton of amouse, and even less has been reported in immuno-deficient animals. What has been reported has been from studies inrats, where the total cardiac output to the radius, ulna, and humerusis 0.32% ± 0.19% versus 0.363%± 0.27% for the femur and tibia [40].If these relationships hold for the mouse, then cardiac output is unlikelyto account for the prevalence of tumors observed in the present study.
Hematogenousmetastases of PCa are known to involve the adhesiveinteractions between blood-borne tumor cells and the vessel wall. Asecond possibility therefore is that there may be significant differencesin the vasculatures of these regions that permit differential localizationof PCa cells. Previous work with intravital microscopy has shown thatthe microvessels in murine bone marrow including the sinusoids andvenules, but not adjacent bone vessels, support rolling interactions ofhematopoietic progenitor cells. However, few if any bone-specific dif-ferences have been reported [41]. We have shown that PCa cells pref-erentially bind to bone marrow endothelial cells more than to aortic,umbilical vein, or dermal vascular endothelial cells [42]. Furthermore,PCa cells adhere preferentially to bone endothelial cells and not to ex-tracellular cell matrix proteins present in the bone [43]. Whether thesedifferences can be translated into specific vascular addresses to accountfor our observations in the forelimb versus hindlimb bones remains un-clear but seems doubtful because the differences in metastatic lesionsare not reflected in the number of PCa cells that actually arrive in themarrow 24 hours after injection [42,44].Moreover, the possibility thattumor prevalence reflects differences in the number of available HSCniches in the humerus versus the femur and tibia seems unlikely. Re-cently, we demonstrated that disseminated PCa cells directly competewith HSCs for occupancy of the HSC niche and that increasing/decreasing niche size alters dissemination [9]. Although there is no di-rect method to assess the number of niches present in any tissue, thenumber of HSCs did not differ significantly between the forelimband hindlimbs.
Another mechanism that may explain the differences in metastaticprevalence between the forelimb versus hindlimb bones is that a factorexists in the bone marrow microenvironment of the hindlimb bonesthat stimulates growth of the PCa cells compared to the forelimbbones. Conversely, the levels of a suppressive growth factor may be rel-atively high in the bones of the forelimb versus the hindlimb bones.Our search for a stimulatory factor resulted in the identification of
Figure 5. (continued).
Neoplasia Vol. 14, No. 5, 2012 GAS6 Regulates Metastatic Dormancy Jung et al. 437

no factor, which was differentially expressed in the hindlimb versus theforelimb bones (Pienta et al., unpublished observations). Recently, weshowed that GAS6, the ligand for the AXL family RTKs, enhances in-vasion, inhibits proliferation, prevents apoptosis induced by chemo-therapy, and alters cell cycling state of PCa cells [31]. In addition,we demonstrated that activation of AXL by GAS6 on PCa cells in abone marrow niche environment plays a critical role as a molecularswitch to establish dormancy of PCa cells [31]. Surprisingly, we notedthat the levels of GAS6mRNA and protein were significantly higher inthe forelimb versus hindlimb bones. The reason for this is not clear;however, subcutaneous and intraosseous studies in a GAS6-deficientanimal model strongly suggest that GAS6 does limit tumor growth.
The role of GAS6 in PCa is controversial and may reflect activitiesthat are dose and cell maturation dependent, as has been shown forseveral other ligands including TGF-β1 and PTHrP. Previous reportssuggest that GAS6 may be a stimulator of PCa growth [45]. Wehave made several attempts to replicate these data without success[31], and our more recent in vivo data are consistent with a role forGAS6 in limiting PCa growth. However, it is important to keep inmind that the activity of GAS6 is highly dependent on glycosylationand on the cellular context in which the cells find themselves [45,46].Importantly, there is indeed precedence linking GAS6 or its receptorsto tumor promotion [47–50]. It is also important to recognize that theeffects of regulatory molecules are often organ and/or dose dependent.For example, parathyroid hormone, although classically reported to bea bone-resorbing hormone, also has anabolic actions in bone by signal-ing through the same receptor [5]. Likewise, GAS6 may well havegrowth inhibitory and stimulatory activities in PCa. Further studiesusing similar models, dosing and protocols are needed before drawingdefinitive conclusions as to the ultimate effects of GAS6 on skeletalmetastases in vivo.
AcknowledgmentsThe authors thank Chris Strayhorn for assistance with the histology.The authors also thank the University of Michigan Flow CytometryCore and the Imaging Core for their expertise.
References[1] Walczak JR and Carducci MA (2007). Prostate cancer: a practical approach to
current management of recurrent disease. Mayo Clin Proc 82, 243–249.[2] Taichman RS, Loberg RD, Mehra R, and Pienta KJ (2007). The evolving
biology and treatment of prostate cancer. J Clin Invest 117, 2351–2361.[3] Park SI, Kim SJ, McCauley LK, and Gallick GE (2010). Pre-clinical mouse
models of human prostate cancer and their utility in drug discovery. Curr ProtocPharmacol 51, 14.
[4] Fidler IJ and Nicolson GL (1976). Organ selectivity for implantation sur-vival and growth of B16 melanoma variant tumor lines. J Natl Cancer Inst 57,1199–1202.
[5] Taichman RS, Cooper C, Keller ET, Pienta KJ, Taichman N, and McCauleyLK (2002). Use of the stromal cell–derived factor-1/CXCR4 pathway in pros-tate cancer metastasis to bone. Cancer Res 62, 1832–1837.
[6] Weilbaecher KN, Guise TA, and McCauley LK (2011). Cancer to bone: a fatalattraction. Nat Rev Cancer 11, 411–425.
[7] Li X, Loberg R, Liao J, Ying C, Snyder LA, Pienta KJ, and McCauley LK(2009). A destructive cascade mediated by CCL2 facilitates prostate cancergrowth in bone. Cancer Res 69, 1685–1692.
[8] Thudi NK, Martin CK, Murahari S, Shu ST, Lanigan LG, Werbeck JL, KellerET, McCauley LK, Pinzone JJ, and Rosol TJ (2011). Dickkopf-1 (DKK-1)stimulated prostate cancer growth and metastasis and inhibited bone formationin osteoblastic bone metastases. Prostate 71, 615–625.
[9] Shiozawa Y, Pedersen EA, Havens AM, Jung Y, Mishra A, Joseph J, Kim JK,Patel LR, Ying C, Ziegler AM, et al. (2011). Human prostate cancer metastases
target the hematopoietic stem cell niche to establish footholds in mouse bonemarrow. J Clin Invest 121, 1298–1312.
[10] Wang J, Wang J, Dai J, Jung Y, Wei CL, Wang Y, Havens AM, Hogg PJ, KellerET, Pienta KJ, et al. (2007). A glycolytic mechanism regulating an angiogenicswitch in prostate cancer. Cancer Res 67, 149–159.
[11] Angelillo-Scherrer A, de Frutos P, Aparicio C, Melis E, Savi P, Lupu F, Arnout J,Dewerchin M, Hoylaerts M, Herbert J, et al. (2001). Deficiency or inhibitionof Gas6 causes platelet dysfunction and protects mice against thrombosis.Nat Med 7, 215–221.
[12] Havens AM, Pedersen EA, Shiozawa Y, Ying C, Jung Y, Sun Y, Neeley C,Wang J, Mehra R, Keller ET, et al. (2008). An in vivo mouse model for humanprostate cancer metastasis. Neoplasia 10, 371–380.
[13] Lee RH, Hsu SC, Munoz J, Jung JS, Lee NR, Pochampally R, and Prockop DJ(2006). A subset of human rapidly self-renewing marrow stromal cells preferen-tially engraft in mice. Blood 107, 2153–2161.
[14] Bhattacharya D, Czechowicz A, Ooi AG, Rossi DJ, Bryder D, and Weissman IL(2009). Niche recycling through division-independent egress of hematopoieticstem cells. J Exp Med 206, 2837–2850.
[15] Kiel MJ, Yilmaz OH, Iwashita T, Yilmaz OH, Terhorst C, and Morrison SJ(2005). SLAM family receptors distinguish hematopoietic stem and progenitorcells and reveal endothelial niches for stem cells. Cell 121(7), 1109–1121.
[16] Taichman RS and Emerson SG (1994). Human osteoblasts support hematopoi-esis through the production of granulocyte colony-stimulating factor. J Exp Med179, 1677–1682.
[17] Song J, Kiel MJ, Wang Z, Wang J, Taichman RS, Morrison SJ, and KrebsbachPH (2010). An in vivo model to study and manipulate the hematopoietic stemcell niche. Blood 115, 2592–2600.
[18] Taichman RS (2005). Blood and bone: two tissues whose fates are intertwinedto create the hematopoietic stem cell niche. Blood 105(7), 2631–2639.
[19] Zhu J, Garrett R, Jung Y, Zhang Y, Kim N, Wang J, Joe GJ, Hexner E, Choi Y,Taichman RS, et al. (2007). Osteoblasts support B-lymphocyte commitmentand differentiation from hematopoietic stem cells. Blood 109, 3706–3712.
[20] Wang J, Ying G, Wang J, Jung Y, Lu J, Zhu J, Pienta KJ, and Taichman RS(2010). Characterization of phosphoglycerate kinase-1 expression of stromalcells derived from tumor microenvironment in prostate cancer progression.Cancer Res 70, 471–480.
[21] Wang J, Shiozawa Y, Wang J, Wang Y, Jung Y, Pienta KJ, Mehra R, Loberg R,and Taichman RS (2008). The role of CXCR7/RDC1 as a chemokine receptorfor CXCL12/SDF-1 in prostate cancer. J Biol Chem 283, 4283–4294.
[22] Sun YX, Pedersen EA, Shiozawa Y, Havens AM, Jung Y, Wang J, Pienta KJ, andTaichman RS (2008). CD26/dipeptidyl peptidase IV regulates prostate cancermetastasis by degrading SDF-1/CXCL12. Clin Exp Metastasis 25(7), 765–776.
[23] Sun YX, Fang M, Wang J, Cooper CR, Pienta KJ, and Taichman RS (2007).Expression and activation of αvβ3 integrins by SDF-1/CXC12 increases theaggressiveness of prostate cancer cells. Prostate 67, 61–73.
[24] Sun YX, Schneider A, Jung Y, Wang J, Dai J, Wang J, Cook K, Osman NI,Koh-Paige AJ, Shim H, et al. (2005). Skeletal localization and neutralization ofthe SDF-1(CXCL12)/CXCR4 axis blocks prostate cancer metastasis and growthin osseous sites in vivo. J Bone Miner Res 20(2), 318–329.
[25] Sun Y-X, Wang J, Shelburne CE, Lopatin DE, Chinnaiyan AM, Pienta KJ,Rubin MA, and Taichman RS (2003). The expression of CXCR4 andCXCL12 (SDF-1) in human prostate cancers (PCa) in vivo. J Cell Biochem89, 462–473.
[26] Shiozawa Y, Havens AM, Jung Y, Ziegler AM, Pedersen EA, Wang J, Wang J,Lu G, Roodman GD, Loberg RD, et al. (2008). Annexin II /annexin II receptoraxis regulates adhesion, migration, homing, and growth of prostate cancer. J CellBiochem 105, 370–380.
[27] Blum DL, Koyama T, M’Koma AE, Iturregui JM, Martinez-Ferrer M,Uwamariya C, Smith JA Jr, Clark PE, and Bhowmick NA (2008). Chemokinemarkers predict biochemical recurrence of prostate cancer following prostatectomy.Clin Cancer Res 14, 7790–7797.
[28] Wu TG, Perdigao JR, Umhoefer TK, Cao J, Ansari DA, Albrecht TB, KnutsonEP, Rose WA, Jorgensen AJ, Ryan LM, et al. (2009). Heterogeneous interleu-kin-15 inducibilities in murine B16 melanoma and RM-1 prostate carcinomaby interferon-alpha treatment. J Interferon Cytokine Res 29, 719–728.
[29] Salm SN, Burger PE, Coetzee S, Goto K, Moscatelli D, and Wilson EL (2005).TGF-{beta} maintains dormancy of prostatic stem cells in the proximal region ofducts. J Cell Biol 170, 81–90.
[30] Buijs JT, Henriquez NV, van Overveld PG, van der Horst G, ten Dijke P, andvan der Pluijm G (2007). TGF-β and BMP7 interactions in tumour progressionand bone metastasis. Clin Exp Metastasis 24, 609–617.
438 GAS6 Regulates Metastatic Dormancy Jung et al. Neoplasia Vol. 14, No. 5, 2012

[31] Shiozawa Y, Pedersen EA, Patel LR, Ziegler AM, Havens AM, Jung Y, Wang J,Zalucha S, Loberg RD, Pienta KJ, et al. (2010). GAS6/AXL axis regulatesprostate cancer invasion, proliferation, and survival in the bone marrow niche.Neoplasia 12, 116–127.
[32] Dormady SP, Zhang XM, and Basch RS (2000). Hematopoietic progenitor cellsgrow on 3T3 fibroblast monolayers that overexpress growth arrest–specificgene-6 (GAS6). Proc Natl Acad Sci USA 97, 12260–12265.
[33] Koh AJ, Demiralp B, Neiva KG, Hooten J, Nohutcu RM, Shim H, Datta NS,Taichman RS, and McCauley LK (2005). Cells of the osteoclast lineage as medi-ators of the anabolic actions of parathyroid hormone in bone. Endocrinology146(11), 4584–4596.
[34] Paget S (1889). The distribution of secondary growths in cancer of the breast.Lancet 1, 571–573.
[35] Rana A, Chisholm GD, Khan M, Sekharjit SS, Merrick MV, and Elton RA(1993). Patterns of bone metastasis and their prognostic significance in patientswith carcinoma of the prostate. Br J Urol 72, 933–936.
[36] Ulmert D, Kaboteh R, Fox JJ, Savage C, Evans MJ, Lilja H, Abrahamsson PA,Bjork T, Gerdtsson A, Bjartell A, et al. (2012). A novel automated platform forquantifying the extent of skeletal tumour involvement in prostate cancer patientsusing the bone scan index. Eur Urol. E-pub ahead of print 2012 Jan 27.
[37] Dennis ER, Jia X, Mezheritskiy IS, Stephenson RD, Schoder H, Fox JJ, HellerG, Scher HI, Larson SM, and Morris MJ (2012). Bone scan index: a quantita-tive treatment response biomarker for castration-resistant metastatic prostatecancer. J Clin Oncol 30, 519–524.
[38] Larson SM, Morris M, Gunther I, Beattie B, Humm JL, Akhurst TA, Finn RD,Erdi Y, Pentlow K, Dyke J, et al. (2004). Tumor localization of 16β-18F-fluoro-5α-dihydrotestosterone versus 18F-FDG in patients with progressive, metastaticprostate cancer. J Nucl Med 45, 366–373.
[39] Chambers AF, Groom AC, and MacDonald IC (2002). Dissemination andgrowth of cancer cells in metastatic sites. Nat Rev Cancer 2, 563–572.
[40] Tothill P (1984). Bone blood flow measurement. J Biomed Eng 6, 251–256.[41] Mazo IB, Gutierrez-Ramos JC, Frenette PS, Hynes RO, Wagner DD, and
von Andrian UH (1998). Hematopoietic progenitor cell rolling in bone marrow
microvessels: parallel contributions by endothelial selectins and vascular celladhesion molecule 1. J Exp Med 188, 465–474.
[42] Lehr JE and Pienta KJ (1998). Preferential adhesion of prostate cancer cells to ahuman bone marrow endothelial cell line. J Natl Cancer Inst 90, 118–123.
[43] Cooper CR, McLean L, Walsh M, Taylor J, Hayasaka S, Bhatia J, and Pienta KJ(2000). Preferential adhesion of prostate cancer cells to bone is mediated bybinding to bone marrow endothelial cells as compared to extracellular matrixcomponents in vitro. Clin Cancer Res 6, 4839–4847.
[44] Cooper CR, McLean L, Mucci NR, Poncza P, and Pienta KJ (2000). Prostatecancer cell adhesion to quiescent endothelial cells is not mediated by β-1 integrinsubunit. Anticancer Res 20, 4159–4162.
[45] Sainaghi PP, Castello L, Bergamasco L, Galletti M, Bellosta P, and Avanzi GC(2005). Gas6 induces proliferation in prostate carcinoma cell lines expressingthe Axl receptor. J Cell Physiol 204(1), 36–44.
[46] Shain SA (2004). Exogenous fibroblast growth factors maintain viability, pro-mote proliferation, and suppress GADD45α and GAS6 transcript content ofprostate cancer cells genetically modified to lack endogenous FGF-2. MolCancer Res 2(11), 653–661.
[47] van Ginkel PR, Gee RL, Shearer RL, Subramanian L, Walker TM, Albert DM,Meisner LF, Varnum BC, and Polans AS (2004). Expression of the receptortyrosine kinase Axl promotes ocular melanoma cell survival. Cancer Res 64,128–134.
[48] Wu YM, Robinson DR, and Kung HJ (2004). Signal pathways in up-regulationof chemokines by tyrosine kinase MER/NYK in prostate cancer cells. Cancer Res64(20), 7311–7320.
[49] Loges S, Schmidt T, Tjwa M, van Geyte K, Lievens D, Lutgens E, VanhoutteD, Borgel D, Plaisance S, Hoylaerts M, et al. (2010). Malignant cells fuel tumorgrowth by educating infiltrating leukocytes to produce the mitogen Gas6. Blood115, 2264–2273.
[50] Ye X, Li Y, Stawicki S, Couto S, Eastham-Anderson J, Kallop D, Weimer R,Wu Y, and Pei L (2010). An anti-Axl monoclonal antibody attenuates xenografttumor growth and enhances the effect of multiple anticancer therapies. Oncogene29, 5254–5264.
Neoplasia Vol. 14, No. 5, 2012 GAS6 Regulates Metastatic Dormancy Jung et al. 439