preventing chronic disease - cdc stacks | welcome
TRANSCRIPT

VOLUME 1: NO. 1 JANUARY 2004
Nonadherence to Breast and CervicalCancer Screening: What Are the Linkages
to Chronic Disease Risk?
ORIGINAL RESEARCH
Suggested citation for this article: Coughlin SS, Uhler RJ,Hall HI, Briss PA. Nonadherence to breast and cervicalcancer screening: what are the linkages to chronic diseaserisk? Preventing Chronic Disease [serial online] 2004 Jan[date cited]. Available from: URL: http://www.cdc.gov/pcd/issues/2004/jan/03_0015.htm
PEER REVIEWED
Abstract
BackgroundSeveral preventive practices that reduce chronic disease
risk have been associated with breast and cervical cancerscreening, including maintenance of normal weight andavoidance of cigarette smoking. A history of certain chron-ic illnesses such as diabetes and cardiovascular diseasehas also been related to cancer screening. Nevertheless,studies that have attempted to identify women who areless likely to have had a recent breast or cervical cancerscreening test have infrequently examined the associa-tions of breast and cervical cancer screening with multiplehealth factors that influence chronic disease risk.
MethodsTo clarify relationships between cancer screening and
health behaviors and other factors that influence chronicdisease risk, we examined the self-reported breast and cer-vical cancer screening practices of women in the UnitedStates by using data from the 1999 Behavioral Risk FactorSurveillance System. The women were described accord-ing to their recent use of mammography and thePapanicolaou test, physician visits within the past year,health insurance coverage, and preventive practices thatreduce chronic disease risk.
ResultsOverall, 74.5% (95% CI, 73.9%-75.1%) of the women in
this sample aged 40 years or older (n = 56,528) hadreceived a mammogram within the past 2 years. The per-centage of women who had been screened for breast can-cer, however, varied widely by factors associated withreducing the risk of chronic disease (e.g., cholesterol checkin the past 2 years, blood pressure check in the past 2years, normal weight, avoidance of cigarette smoking) andhaving access to health care (e.g., health insurance cover-age, recent physician visit). Similarly, 84.4% (95% CI,83.9%-84.9%) of all women aged 18 years or older who hadnot undergone a hysterectomy (n = 69,113) had received aPapanicolaou test in the past 3 years, and factors associ-ated with reduced chronic disease risk and health careaccess were related to having had a recent Papanicolaoutest.
ConclusionThe results of this study suggest that underscreened
women who are at risk for breast and cervical cancer arelikely to benefit from programs that identify and addresscoexisting prevention needs. The identification of coexist-ing prevention needs might assist in developing interven-tions that address multiple risks for chronic diseaseamong women and might subsequently help improve theefficiency and effectiveness of prevention programs.
Background
Several preventive practices that reduce chronic diseaserisk have been associated with breast and cervical cancerscreening in previous studies. These practices includemaintaining a normal weight (1-3), avoiding cigarettesmoking (4-6), and testing for cholesterol level (7).
The opinions expressed by authors contributing to this journal do not necessarily reflect the opinions of the U.S. Department of Health and Human Services,the Public Health Service, Centers for Disease Control and Prevention, or the authors’ affiliated institutions. Use of trade names is for identification only and
does not imply endorsement by any of the groups named above.
www.cdc.gov/pcd/issues/2004/jan/03_0015.htm • Centers for Disease Control and Prevention 1
Steven S. Coughlin, PhD, Robert J. Uhler, MA, H. Irene Hall, PhD, Peter A. Briss, MD

VOLUME 1: NO. 1JANUARY 2004
In addition to preventive practices, a history of certainchronic illnesses such as diabetes, obesity, and cardiovas-cular disease has been associated with cancer screeningbehaviors (8). For example, recent studies have found thatobese women in the United States are less likely to adhereto cancer screening recommendations than normal weightwomen (2,3). In addition, obesity is associated withincreased risks of several chronic diseases, including coro-nary heart disease, diabetes, and breast cancer (9-12).
Studies that have linked a history of chronic illness withcancer screening behavior (for example, women who areobese or who have had a prior cardiovascular event areless likely to have had a recent breast or cervical cancerscreening test) frequently have not examined the associa-tion of cancer screening behavior with health-relatedbehaviors that affect the risk of cardiovascular diseasesuch as cholesterol and blood pressure checks, level ofphysical activity, and avoidance of cigarette smoking(7,13). Thus, researchers and clinicians do not completelyunderstand the relationships between cancer screeningand factors associated with chronic disease risk.Cardiovascular disease and cancer are the 2 most commoncauses of death among women in the United States (14).
Interrelationships between preventive health behaviorsare partly due to individual contact with the medical caresystem. For example, women are more likely to have hada recent Papanicolaou (Pap) test if they have seen a physi-cian in the past year or if a health care provider has rec-ommended that they undergo the procedure (15,16).Engaging in regular health care has been shown to be apredictor of cancer screening among women. Additionally,physician visits for other chronic diseases may be relatedto an increased likelihood of cancer screening (8). Amongolder women who were studied as part of the Women'sHealth Initiative, breast and cervical cancer screening wasinversely related to having diabetes and cardiovasculardisease (8).
To clarify the relationships between cancer screeningand health-related behaviors and other factors that influ-ence chronic disease risk, we examined the self-reportedbreast and cervical cancer screening practices of women inthe United States using data from the 1999 BehavioralRisk Factor Surveillance System (BRFSS). The preventivepractices examined included screening mammography,Pap test, and other health-related behaviors. We exam-ined possible correlates of screening among the women,
including whether they had received a cholesterol or bloodpressure check in the past 2 years, had maintained normalweight, were physically active, or avoided cigarette smok-ing.
Methods
The data used in this study were from women who wereinterviewed as part of the 1999 BRFSS, a state-based tele-phone survey of adults aged 18 years or older (17). Weused data from 1999 rather than more recent data becauseduring that year the survey collected information aboutadditional preventive health practices.
The BRFSS uses a random-digit-dialing technique andmultistage cluster sampling in each participating state tosample noninstitutionalized adults who have telephones(18). Trained interviewers administered a computer-assisted interview. The interviews included questionsabout general health status, demographic and socioeco-nomic characteristics, height and weight, mammography,use of Pap tests, and other health-related behaviors,including alcohol use, cigarette smoking, testing for occultblood in the stool, and cholesterol or blood pressure checks.We asked each adult female respondent whether she hadever had a mammogram; we then asked those whoresponded positively how long it had been since their lastmammogram. Next we asked similar questions about thePap test. We also asked women whether they had under-gone a hysterectomy.
We limited analyses of mammogram use to women aged40 years or older (n = 56,528), whereas we limited analy-ses of Pap test use to women aged 18 years or older (n =69,113). Women who reported that they had undergone ahysterectomy, and therefore did not have an intact uterinecervix, were excluded from the analyses of Pap test use.Data on physical activity were only available for respon-dents in Georgia, Hawaii, Illinois, Michigan, Nebraska,New Mexico, Ohio, Oklahoma, Tennessee, Utah, andVirginia (n = 10,381 for analyses of mammography and n= 12,600 for analyses of Pap test use in relation to physi-cal activity).
Physical activity levels were categorized as physicallyinactive (no reported activity), irregular activity (anyreported physical activity engaged in for either less than20 minutes or less than 3 times per week), regular activi-ty (any physical activity engaged in for 20 or more minutes
2 Centers for Disease Control and Prevention • www.cdc.gov/pcd/issues/2004/jan/03_0015.htm
The opinions expressed by authors contributing to this journal do not necessarily reflect the opinions of the U.S. Department of Health and Human Services,the Public Health Service, Centers for Disease Control and Prevention, or the authors’ affiliated institutions. Use of trade names is for identification only and
does not imply endorsement by any of the groups named above.

3 or more times per week), and regular and vigorous activ-ity (any physical activity that likely required rhythmiccontraction of large muscle groups at 50% of functionalcapacity for 20 or more minutes 3 or more times per week).Body mass index (BMI) was calculated using weight andheight [weight (kg)/height squared(m)2] (14) and was cat-egorized as underweight (BMI < 18.5), normal weight(BMI > 18.5 and < 25), overweight (BMI 25 to 29), andobese (BMI > 30) according to the International ObesityTask Force classification (19).
We examined the percentage of women who had had arecent mammogram or Pap test in relation to combina-tions of selected preventive health behaviors, based on theframework proposed by Langlie (Figure) (20). Selected pre-ventive health behaviors included detecting disease orreducing the possibility of future disease (checking choles-terol level, checking blood pressure, and avoiding cigarettesmoking) and health maintenance behaviors (maintainingnormal weight and engaging in physical activity).
Figure.Categories of Health Behaviors Associated With Chronic Disease Risk ThatWere Examined in Relation to Mammography and Pap Testing. Adaptedfrom Langlie JK (20).
Age-adjusted rates of screening test use were estimatedusing the direct method and the overall age distribution ofU.S. women who responded to the 1999 BRFSS. In exam-ining bivariate associations, levels of statistical signifi-cance were obtained using Cochran-Mantel-Haenszel chi-square tests. All analyses used SAS and SUDAAN to cal-culate 95% confidence intervals (CIs) and to allow forweighting of the estimates (21). The samples were weight-ed to compensate for the following 3 factors: 1) unequalsampling probability resulting from the unique number oftelephones per household; 2) number of unique telephonenumbers per primary sampling unit; and 3) poststratifica-tion by age, sex, and race. Using logistic regression tech-
niques and SUDAAN, we carried out a multivariate analy-sis of predictors of screening test use (21, 22). We used thelogistic model to obtain point estimates of the predictedmarginals, which were the multivariate-adjusted screen-ing rates expressed as a percentage (22). Each covariateand explanatory variable in the model was tested for asso-ciation with the response variable using a Wald chi-squaretest. All pairwise comparisons were performed using gen-eral linear contrasts (22).
Results
The overall response rates (Council of American SurveyResearch Organizations [23]) for the 1999 BRFSS amonghouseholds of all races and ethnicities was 55.2%.
MammographyOverall, 86.9% (95% CI, 86.4%-87.4%) of women aged 40
years or older reported receiving a mammogram at leastonce, after adjusting for age. In addition, 74.5% (95% CI,73.9%-75.1%) of women aged 40 years or older reportedreceiving a mammogram within the past 2 years, afteradjusting for age. Not having a mammogram within thepast 2 years was associated with not being currently mar-ried, lower education level, lower household income, beingcurrently unemployed, larger number of children or per-sons in household, poorer general health status, not hav-ing seen a physician within the past year, lack of healthinsurance coverage, lack of use of other screening testsincluding recent cholesterol or blood pressure check, obesi-ty, physical inactivity, and current alcohol or cigarette con-sumption (Table 1). We found similar results in multivari-ate analysis, although a smaller sample of women wasused because of missing data. However, the associationsbetween recent mammography and blood pressure or cho-lesterol checks were less pronounced after adjusting formultiple factors associated with screening.
Pap testingApproximately 94.2% (95% CI, 93.9%-94.5%) of all
women aged 18 years or older without a history of hys-terectomy reported having received a Pap test at leastonce, after adjusting for age. In addition, 84.4% (95% CI,83.9% to 84.9%) of women aged 18 years or older hadreceived a Pap test within the past 3 years, after adjustingfor age. Not having had a Pap test within the past 3 yearswas associated with race/ethnicity, not being currentlymarried, lower education level, lower household income,number of children or persons in household, not being cur-
VOLUME 1: NO. 1JANUARY 2004
www.cdc.gov/pcd/issues/2004/jan/03_0015.htm • Centers for Disease Control and Prevention 3
The opinions expressed by authors contributing to this journal do not necessarily reflect the opinions of the U.S. Department of Health and Human Services,the Public Health Service, Centers for Disease Control and Prevention, or the authors’ affiliated institutions. Use of trade names is for identification only and
does not imply endorsement by any of the groups named above.
Behaviors That Serve to Detect Disease or Reduce the Possibilityof Future Disease
Cholesterol check
Blood pressure check
Avoidance of cigarette smoking
Health Maintenance Behavior
Maintenance of normal weight
Physical activity

VOLUME 1: NO. 1JANUARY 2004
rently employed, poorer general health, not having seen aphysician within the past year, lack of health insurancecoverage, lack of use of other screening tests includingrecent cholesterol and blood pressure check, obesity, phys-ical inactivity, and current alcohol or cigarette consump-tion (Table 2). Similar results were seen in multivariateanalysis (in a somewhat smaller sample of women).However, the associations between a recent Pap test and ablood pressure check, a cholesterol check, and weight wereless pronounced after adjusting for multiple factors associ-ated with screening, and the association with employmentstatus disappeared.
Breast and cervical cancer screening and factorsassociated with chronic disease risk
The percentage of women who had undergone a recentmammogram was examined in relation to combinations ofselected behaviors associated with chronic disease risk.After adjusting for multiple factors associated with screen-ing, only 22.5% (95% CI, 12.9%-32.1%) of the women whoreported not having a cholesterol or blood pressure checkwithin the past 2 years and who were current cigarettesmokers had had a recent mammogram (Table 3). By com-parison, 81.7% (95% CI, 80.9%-82.4%; P < .001) of thewomen who had had recent cholesterol and blood pressurechecks and who were non-smokers had had a recent mam-mogram (Table 3). Because of missing data, the samplesize available for multivariate analysis was smaller thanthe sample size available for age-adjusted results.Differences in the percentage of women who had had arecent mammogram were less pronounced across com-bined categories of weight and physical activity. For exam-ple, after adjusting for multiple factors associated withscreening, similar proportions of women who were obeseand physically inactive and women who had a normalweight and were physically active had had a recent mam-mogram [73.7% (95% CI, 69.2%-78.1%) vs. 75.5% (95% CI,72.6%-78.5%), P = .49].
After adjusting for multiple factors associated withscreening, only 54.5% (95% CI, 48.6%-60.5%) of the womenwho reported not having a cholesterol or blood pressurecheck within the past 2 years and who were current ciga-rette smokers had had a recent Pap test (Table 4). By com-parison, 90.7% (95% CI, 90.1%-91.3%; P < .001) of thewomen who had had recent cholesterol and blood pressurechecks and who were nonsmokers had had a recent Paptest (Table 4). Differences in the percentage of women whohad had a recent Pap test were similar or less pronounced
across combined categories of weight and physical activity.For example, after adjusting for multiple factors associat-ed with screening, 86.5% (95% CI, 83.4%-89.5%) of thewomen who were obese and physically inactive had had arecent Pap test (Table 4). Similarly, 86.4% (95% CI, 84.4%-88.4%; P = .964) of the women who had a normal weightand were physically active had had a recent Pap test(Table 4).
Discussion
The present analysis of relationships between breastand cervical cancer screening and other factors associatedwith chronic disease risk was guided by the frameworkproposed by Langlie for categorizing preventive healthbehaviors (20). Similar frameworks for understanding therelationships between cancer screening tests and otherpreventive health behaviors have been proposed by otherauthors (24-26). Preventive health behaviors includebehaviors that serve to detect disease (e.g., mammo-grams), behaviors that reduce the possibility of future dis-ease (e.g., cholesterol checks, maintenance of normalweight, avoidance of cigarette smoking), and behaviorsthat maintain health (e.g., exercise, diet) (20,24). Thesecategories are not mutually exclusive. Simpler models orcategorizations (e.g., primary and secondary prevention)have also been used.
Nonadherence to breast and cervical cancer screeningwas positively related to chronic disease risk factors, espe-cially cigarette smoking and not participating in choles-terol and blood pressure checks. Associations with diseasereduction and health maintenance behaviors, such asphysical activity and maintenance of normal weight, weresmall and much weaker. (Data on physical activity wereonly available for respondents in 11 states.) Current ciga-rette smokers who had not had a recent cholesterol orblood pressure check were particularly unlikely to havehad a recent mammogram or Pap test. These findingsprobably reflect, in part, individual factors — knowledgeand attitudes, lack of contact with physicians, poor accessto routine health care — although differences in cancerscreening practices persisted in multivariate analysis afteradjusting for such factors as recently seeing a physicianand having health insurance coverage. The findings mayalso be partly explained by errors in self-reported medicaltesting. Individuals who under-report one test might bemore likely to under-report other tests; conversely, anyincrease in reported screening (due, for example, to social
4 Centers for Disease Control and Prevention • www.cdc.gov/pcd/issues/2004/jan/03_0015.htm
The opinions expressed by authors contributing to this journal do not necessarily reflect the opinions of the U.S. Department of Health and Human Services,the Public Health Service, Centers for Disease Control and Prevention, or the authors’ affiliated institutions. Use of trade names is for identification only and
does not imply endorsement by any of the groups named above.

desirability bias) might act across screening tests.
These results agree with those of other studies that havefound a relationship between having Pap tests and havingmedical checkups, other cancer screening tests, and cho-lesterol tests (7,8,24). For example, in a factor analysis ofBRFSS data from Maryland, Liang et al observed a clus-tering of Pap tests, clinical breast examinations, and med-ical checkups among women of all ages (27). Amongwomen older than 40 years, mammograms and cholesterolcheckups were clustered (27).
In addition to lack of access to health services, possibleexplanations for clusters of health factors associated withchronic disease risk include socioeconomic factors thatmake a healthy lifestyle difficult to establish and main-tain. Factors such as poverty, unemployment, and lowereducational level have consistently been found to pose bar-riers to cancer screening (8). Consistent with other studies,age, higher education level, having health insurance cov-erage, and seeing a physician within the past year werepositively associated with cancer screening in the currentanalysis (8,28). Healthy lifestyle behaviors and bettersocioeconomic status were also related to the likelihood ofhaving had a recent medical checkup (28). In the currentstudy, however, the associations between nonadherence tobreast and cervical cancer screening and chronic diseaserisk factors persisted after adjusting for education level,number of children, number of persons in household, andother demographic and socioeconomic factors. Controllingfor education, unemployment, and other factors reduced,but did not eliminate, the associations with cancer screen-ing.
Prior studies have found that obese women are less like-ly to undergo breast and cervical cancer screening (1-3,29).Obese women may be more reluctant to undergo proce-dures such as pelvic examinations and clinical breastexaminations that involve disrobing or the physical exam-ination of their bodies (1-3). Obesity may also deter physi-cians from recommending procedures such as pelvic exam-inations because of potential technical difficulties (30).Although the results of the current study may agree sta-tistically with results from prior studies (1-3,29) the mag-nitude of the associations with obesity are small, especial-ly after physical activity and other factors are taken intoaccount (< 1 percentage point difference between obeseand normal weight women for Pap test and < 2 percentagepoint difference between obese and normal-weight women
for mammography).
Limitations of the current study include a low responserate and the fact that the telephone survey excluded indi-viduals living in households without a telephone.Individuals without a household telephone may be morelikely to have a lower income, to engage in unhealthylifestyle practices, or to not adhere to recommendations forroutine breast and cervical cancer screening (31). As aresult, the estimates of breast and cervical cancer screen-ing in the present study may be biased upwards.Information bias is also a possibility, because of the use ofself-reported information about height, weight, cancerscreening practices, and other factors. Nonetheless, stud-ies of the reliability of cancer screening information col-lected as part of BRFSS have shown that self-reportedinformation about screening mammography and Pap testsis reliable (32,33). Studies based on self-reporting havefound that overweight participants underestimate theirweight and all participants overestimate their height(34,35). However, self-reported weight has been found tobe highly correlated with measured weight (34,35). (Aspreviously mentioned, data on physical activity were onlyavailable for respondents in 11 states.)
The results of the current study are important becauseof the increasing prevalence of physical inactivity and obe-sity in the United States, which increase the risk of cancerand other chronic diseases, and because of the need toidentify women who are rarely screened for breast and cer-vical cancer (36-38). Although the majority of women inthe United States have received a mammogram and Paptest, innovative approaches for identifying and reachingunderscreened populations are needed. The observationthat women who have not received a recent mammogramor Pap test may also lack a recent cholesterol or blood pres-sure check suggests that underscreened women who are atrisk for breast and cervical cancer are likely to benefit fromprograms that identify and address coexisting preventionneeds. The identification of coexisting prevention needsmight help to improve the efficiency and cost-effectivenessof prevention programs. One example of this approach isthe Centers for Disease Control and Prevention's WISE-WOMAN program, which provides low-income, underin-sured and uninsured women aged 40 to 64 years withchronic disease risk factor screening, lifestyle intervention,and referral services to prevent cardiovascular disease(39). Currently funded projects provide preventive servic-es including blood pressure and cholesterol testing as well
VOLUME 1: NO. 1JANUARY 2004
www.cdc.gov/pcd/issues/2004/jan/03_0015.htm • Centers for Disease Control and Prevention 5
The opinions expressed by authors contributing to this journal do not necessarily reflect the opinions of the U.S. Department of Health and Human Services,the Public Health Service, Centers for Disease Control and Prevention, or the authors’ affiliated institutions. Use of trade names is for identification only and
does not imply endorsement by any of the groups named above.

VOLUME 1: NO. 1JANUARY 2004
as interventions to help women increase physical activityand improve nutrition.
Acknowledgments
The authors thank Dr. Rosalind Breslow and Dr. MonaSaraiya for their helpful comments during the planningstages of this manuscript.
Author Information
Corresponding Author: Steven S. Coughlin, PhD,Epidemiology and Applied Research Branch, Division ofCancer Prevention and Control, National Center forChronic Disease Prevention and Health Promotion,Centers for Disease Control and Prevention, 4770 BufordHwy. NE (K-55), Atlanta, GA 30341. Phone: 770-488-4776.E-mail: [email protected]
Robert J. Uhler, MA, Division of Cancer Prevention andControl, National Center for Chronic Disease Preventionand Health Promotion, Centers for Disease Control andPrevention, Atlanta, Ga; H. Irene Hall, PhD, Division ofHIV/AIDS Prevention, Centers for Disease Control andPrevention, Atlanta, Ga (work performed at Division ofCancer Prevention and Control, National Center forChronic Disease Prevention and Health Promotion,Centers for Disease Control and Prevention, Atlanta, Ga);Peter A. Briss, MD, Division of Prevention Research andAnalytic Methods, Epidemiology Program Office, Centersfor Disease Control and Prevention, Atlanta, Ga.
References
1. Fontaine KR, Faith MS, Allison DB, Cheskin LJ.Body weight and health care among women in thegeneral population. Arch Family Med 1998 Jul-Aug;7 (4):381-4.
2. Wee CC, McCarthy EP, Davis RB, Phillips RS.Screening for cervical and breast cancer: is obesity anunrecognized barrier to preventive care? Ann InternMed 2000;132:697-704.
3. Fontaine KR, Heo M, Allison DB. Body weight andcancer screening among women. J Womens HealthGender-based Medicine 2001;10 (5):463-70.
4. Fredman L, Sexton M, Cui Y, Althuis M, Wehren L,Hornbeck P, et al. Cigarette smoking, alcohol con-sumption, and screening mammography amongwomen ages 50 and older. Prev Med 1999 Apr;28
(4):407-17.5. Rakowski W, Clark MA, Ehrich B. Smoking and can-
cer screening for women ages 42-75: associations inthe 1990–1994 National Health Interview Surveys.Prev Med 1999 Dec;29 (6 Pt 1):487-95.
6. Pearlman DN, Rakowski W, Ehrich B, Clark MA.Breast cancer screening practices among black,Hispanic, and white women: reassessing differences.Am J Prev Med 1996 Sep-Oct;12 (5):327-37.
7. Hueston WJ, Stiles MA. The Papanicolaou smear as asentinel screening test for health screening in women.Arch Intern Med 1994 Jul;154:1473-7.
8. Hsia J, Kemper E, Kiefe C, Zapka J, Sofaer S,Pettinger M, et al. The importance of health insuranceas a determinant of cancer screening: evidence fromthe Women's Health Initiative. Prev Med 2000 Sep;31(3):261-70.
9. Kelsey JL, Bernstein L. Epidemiology and preven-tion of breast cancer. Annu Rev Public Health1996;17:47-67.
10. Hunter DJ, Willet WC. Diet, body size, and breast can-cer. Epidemiol Rev 1993;15:110-32.
11. Colditz GA. Economic costs of obesity and inactivity.Med Sci Sports Exerc 1999 Nov;31 (11 Suppl):S663-7.
12. Garfinkel L. Overweight and cancer. Ann Intern Med1985 Dec;103 (6 Pt 2):1034-6.
13. Ramsey SD, Cheadle AD, Neighbor WE, Gore E,Temple P, Staiger T, et al. Relative impact of patientand clinic factors on adherence to primary care pre-ventive service guidelines: an exploratory study. MedCare 2001 Sep;39 (9):979-89.
14. Centers for Disease Control and Prevention, NationalCenter for Health Statistics. Web site [homepage onthe Internet]. Atlanta: Health, United States, 2001[date cited]. Available from: URL: http://www.cdc.gov/nchs/products/pubs/pubd/hus/hus.htm
15. Simoes EJ, Newschaffer CJ, Hagdrup N, Ali-Abarghoui F, Tao X, Mack N, et al. Predictors of com-pliance with recommended cervical cancer screeningschedule: a population-based study. J CommunityHealth 1999 Apr;24 (2):115-30.
16. Burack R, Liang J. The early detection of cancer in theprimary care setting: factors associated with theacceptance and completion of recommended proce-dures. Prev Med 1987 Nov;16 (6):739-51.
17. Frazier EL, Franks AI, Sanderson LM. Behavioralrisk factor data. In: Using chronic disease data: ahandbook for public health practitioners. Atlanta(GA): US Dept of Health and Human Services, Public
6 Centers for Disease Control and Prevention • www.cdc.gov/pcd/issues/2004/jan/03_0015.htm
The opinions expressed by authors contributing to this journal do not necessarily reflect the opinions of the U.S. Department of Health and Human Services,the Public Health Service, Centers for Disease Control and Prevention, or the authors’ affiliated institutions. Use of trade names is for identification only and
does not imply endorsement by any of the groups named above.

Health Service, Centers for Disease Control andPrevention; 1992. Behavioral risk factor data; p.4-17.
18. Waksberg J. Sampling methods for random digit dial-ing. J Am Stat Assoc 1978;73:40-6.
19. Stevens J, Cai J, Juhaer I, Juhaeri, Thun MJ, WoodJL. Evaluation of WHO and NHANES II standards foroverweight using mortality rates. J Am Diet Assoc2000 Jul;100 (7):825-7.
20. Langlie JK. Interrelationships among preventivehealth behaviors: a test of competing hypotheses.Public Health Rep 1979 Jun;94 (3):216-25.
21. Shah BV, Barnwell BG, Bieler GS. SUDAAN User'sManual: Software for Analysis of Correlated Data,Release 6.40. Research Triangle Park (NC): ResearchTriangle Institute; 1995.
22. Korn EL, Graubard BI. Analysis of health surveys.New York: John Wiley & Sons, Inc.; 1999. p.126-40.
23. Frankel LR. The report of the CASRO task force onresponse rates. In: Wiseman F, ed. Improving dataquality in a sample survey. Cambridge (MA):Marketing Science Institute, 1983.
24. Norman SA, Talbott EO, Kuller LH, et al.Demographic, psychosocial, and medical correlates ofPap testing: a literature review. Am J Prev Med 1991Jul-Aug;7 (4):219-26.
25. Williams AF, Wechsler H. Interrelationship of preven-tive actions in health and other areas. Health ServRep 1972 Dec;87 (10):969-76.
26. Rosenstock IM. Prevention of illness and maintenanceof health. In: Losa J et al., editors. Poverty and health.Cambridge (MA): Harvard University Press, 1969.
27. Liang W, Shediac-Rizkallah MC, Celentano DD,Rohde C. A population-based study of age and genderdifferences in patterns of health-related behaviors. AmJ Prev Med 1999 Jul;17 (1):8-17.
28. Culica D, Rohrer J, Ward M, Hilsenrath P, PomrehnP. Medical checkups: who does not get them? Am JPublic Health 2002 Jan;92 (1):88-91.
29. Lubitz RM, Litzelman DK, Dittus RS, Tierney WM. Isobesity a barrier to physician screening for cervicalcancer? Am J Med 1995 May;98 (5):491-6.
30. Adams CH, Smith NJ, Wilbur DC, Grady KE. Therelationship of obesity to the frequency of pelvic exam-inations: do physician and patient attitudes make adifference? Women Health 1993;20 (2):45-57.
31. Hahn RA, Teutsch SM, Franks AL, Chang MH, LloydEE. The prevalence of risk factors among women inthe United States by race and age, 1992-1994: oppor-tunities for primary and secondary prevention. J Am
Med Womens Assoc 1998 Spring;53 (2):96-104,107.32. Stein AD, Lederman RI, Shea S. Reproducibility of the
women's module of the Behavioral Risk FactorSurveillance System questionnaire. Ann Epidemiol1996 Jan;6 (1):47-52.
33. Vacek PM, Mickey RM, Worden JK. Reliability of self-reported breast screening information in a survey oflower income women. Prev Med 1997 May-Jun;26(3):287-91.
34. Palta M, Prineas RJ, Berman R, Hannan P.Comparison of self-reported and measured height andweight. Am J Epidemiol 1982 Feb;115 (2):223-30.
35. Rowland ML. Self-reported weight and height. Am JClin Nutr 1990 Dec;52 (6):1125-33.
36. Mokdad AH, Serdula MK, Dietz WH, Bowman BA,Marks JS, Koplan JP. The spread of the obesity epi-demic in the United States, 1991-1998. JAMA 1999Oct;282 (16);1519-22.
37. Flegal KM, Carroll MD, Kuczmarski RJ, Johnson CL.Overweight and obesity in the United States: preva-lence and trends, 1960-1994. Int J Obes Relat MetabDisord 1998 Jan;22 (1):39-47.
38. Nelson DE, Bland S, Powell-Griner E, Klein R, WellsHE, Hogelin G, et al. State trends in health risk fac-tors and receipt of clinical preventive services amongUS adults during the 1990s. JAMA 2002 May 22-29;287 (20):2659-67.
39. WISEWOMAN. Well-integrated Screening andEvaluation for Women Across the Nation[http://www.cdc.gov/wisewoman/] (accessed onSeptember 25, 2002).
VOLUME 1: NO. 1JANUARY 2004
www.cdc.gov/pcd/issues/2004/jan/03_0015.htm • Centers for Disease Control and Prevention 7
The opinions expressed by authors contributing to this journal do not necessarily reflect the opinions of the U.S. Department of Health and Human Services,the Public Health Service, Centers for Disease Control and Prevention, or the authors’ affiliated institutions. Use of trade names is for identification only and
does not imply endorsement by any of the groups named above.

VOLUME 1: NO. 1JANUARY 2004
Tables
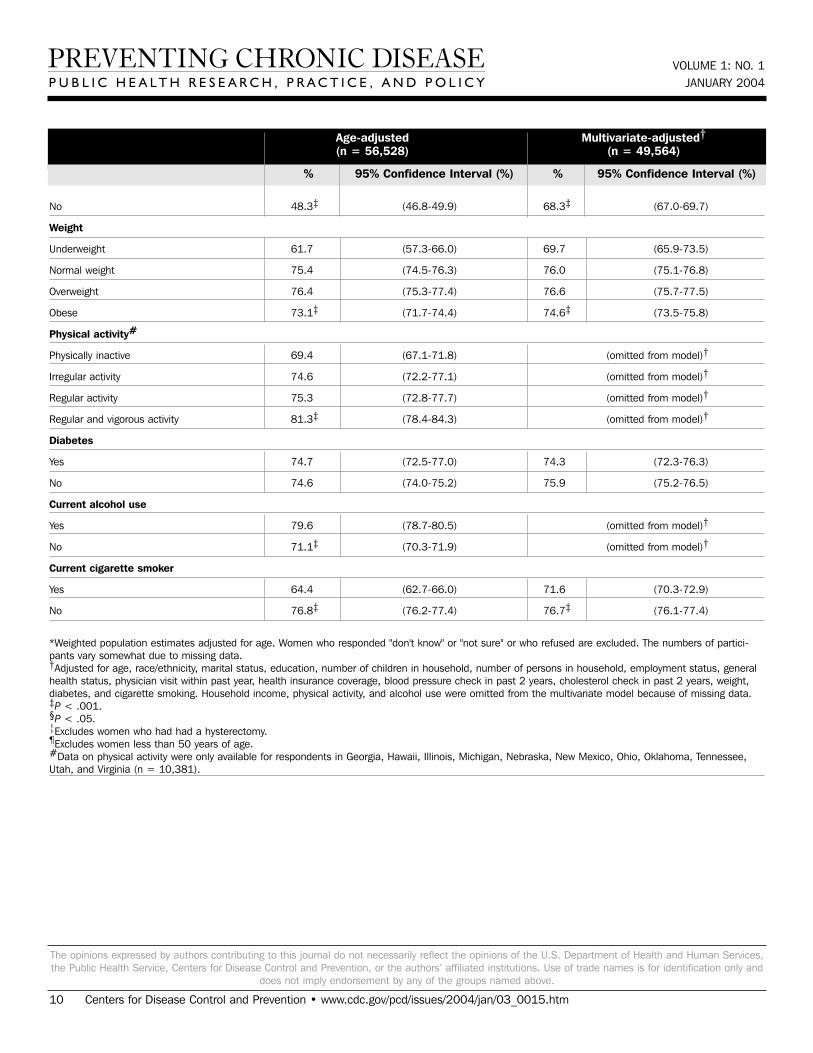
Table 1. Percentage of Women Aged 40 years or Older Who Had Received a Mammogram in the Past 2 Years, According to SelectedDemographic Characteristics and Screening Practices, Behavioral Risk Factor Surveillance System, 1999*
Age (years)
40-49 68.1 (67.0-69.2) 70.9 (69.6-72.1)
50-64 80.2 (79.3-81.1) 78.9 (78.0-79.9)
> 65 75.1 (74.0-76.1) 77.7‡ (76.5-78.9)
Race/ethnicity
White 75.0 (74.3-75.6) 74.8 (74.1-75.4)
Black 74.3 (72.3-76.3) 78.1 (76.5-79.8)
Hispanic 72.2 (69.1-75.3) 80.5 (78.5-82.5)
Asian and Pacific Islander 76.8 (71.1-82.5) 79.0 (74.7-83.3)
American Indian and Alaska Native 68.2 (61.6-74.9) 76.2 (71.6-80.8)
Other 65.7 (55.6-75.8) 72.2‡ (63.3-81.2)
Marital status
Married 78.4 (77.6-79.1) 77.4 (76.6-78.3)
Divorced or separated 70.9 (69.2-72.5) 74.7 (73.3-76.1)
Widowed 69.5 (67.1-72.0) 72.6 (70.9-74.2)
Never married 67.4‡ (64.5-70.3) 71.7‡ (69.5-73.9)
Educational attainment
< High school graduate 63.2 (61.1-65.2) 72.9 (71.4-74.5)
High school graduate/GED 73.0 (72.0-74.0) 75.2 (74.3-76.1)
Some college/tech school 76.5 (75.4-77.6) 75.7 (74.7-76.8)
College graduate 82.7‡ (81.6-83.7) 78.6‡ (77.5-79.7)
Household income
< $15,000 60.5 (58.4-62.6) (omitted from model)†
$15,000-$34,999 70.7 (69.5-71.8) (omitted from model)†
> $35,000 82.5 (81.5-83.5) (omitted from model)†
Missing data 74.8‡ (73.4-76.2) (omitted from model)†
Employment status
Currently employed 76.7 (75.5-78.0) 76.0 (75.1-76.9)
Homemaker or retired 73.3 (72.1-74.6) 75.3 (74.2-76.3)
Unemployed 65.7 (60.6-70.8) 75.0 (72.0-78.0)
8 Centers for Disease Control and Prevention • www.cdc.gov/pcd/issues/2004/jan/03_0015.htm
The opinions expressed by authors contributing to this journal do not necessarily reflect the opinions of the U.S. Department of Health and Human Services,the Public Health Service, Centers for Disease Control and Prevention, or the authors’ affiliated institutions. Use of trade names is for identification only and
does not imply endorsement by any of the groups named above.
Age-adjusted Multivariate-adjusted†(n = 56,528) (n = 49,564)
% 95% Confidence Interval (%) % 95% Confidence Interval (%)

Unable to work 69.2‡ (66.0-72.4) 77.0 (74.8-79.2)
Number of children in household
0 76.2 (75.5-76.9) 77.2 (76.3-78.0)
1 68.7 (64.9-72.5) 73.6 (71.8-75.4)
2 67.7 (62.5-72.8) 71.2 (68.7-73.8)
3 or more 60.9‡ (52.7-69.2) 67.5‡ (63.9-71.1)
Number of persons in household
1 73.0 (71.9-74.0) 75.7 (74.4-77.1)
2 77.6 (76.8-78.5) 75.7 (74.7-76.7)
3 73.6 (71.5-75.6) 74.4 (72.8-76.1)
4 or more 69.3‡ (66.3-72.4) 76.8 (74.9-78.6)
General health status
Good to excellent 75.8 (75.1-76.4) 76.0 (75.3-76.7)
Fair or poor 69.8‡ (68.3-71.2) 74.6§ 73.3-75.9)
Saw physician within past year
Yes 81.6 (81.0-82.2) 77.8 (77.1-78.5)
No 46.2‡ (44.5-47.9) 67.9‡ (66.4-69.4)
Health insurance coverage
Yes 77.1 (76.5-77.6) 76.2 (75.6-76.9)
No 52.1‡ (48.1-56.1) 70.9‡ (68.8-73.0)
Clinical breast exam in past 2 years
Yes 87.1 (86.6-87.6) 84.9 (84.2-85.5)
No 29.8‡ (28.4-31.2) 41.6‡ (39.8-43.4)
Pap test in past 3 years¦
Yes 83.0 (82.3-83.7) (omitted from model)†
No 20.1‡ (18.5-21.8) (omitted from model)†
Blood stool test in past year¶
Yes 93.2 (92.3-94.1) (omitted from model)†
No 72.9‡ (72.0-73.8) (omitted from model)†
Blood pressure check past 2 years
Yes 76.9 (76.3-77.4) 76.1 (75.5-76.7)
No 11.4‡ (8.1-14.7) 62.7‡ (58.1-67.3)
Cholesterol check in past 2 years
Yes 82.2 (81.6-82.8) 78.1 (77.4-78.8)
VOLUME 1: NO. 1JANUARY 2004
www.cdc.gov/pcd/issues/2004/jan/03_0015.htm • Centers for Disease Control and Prevention 9
The opinions expressed by authors contributing to this journal do not necessarily reflect the opinions of the U.S. Department of Health and Human Services,the Public Health Service, Centers for Disease Control and Prevention, or the authors’ affiliated institutions. Use of trade names is for identification only and
does not imply endorsement by any of the groups named above.
Age-adjusted Multivariate-adjusted†(n = 56,528) (n = 49,564)
% 95% Confidence Interval (%) % 95% Confidence Interval (%)
VOLUME 1: NO. 1JANUARY 2004
No 48.3‡ (46.8-49.9) 68.3‡ (67.0-69.7)
Weight
Underweight 61.7 (57.3-66.0) 69.7 (65.9-73.5)
Normal weight 75.4 (74.5-76.3) 76.0 (75.1-76.8)
Overweight 76.4 (75.3-77.4) 76.6 (75.7-77.5)
Obese 73.1‡ (71.7-74.4) 74.6‡ (73.5-75.8)
Physical activity#
Physically inactive 69.4 (67.1-71.8) (omitted from model)†
Irregular activity 74.6 (72.2-77.1) (omitted from model)†
Regular activity 75.3 (72.8-77.7) (omitted from model)†
Regular and vigorous activity 81.3‡ (78.4-84.3) (omitted from model)†
Diabetes
Yes 74.7 (72.5-77.0) 74.3 (72.3-76.3)
No 74.6 (74.0-75.2) 75.9 (75.2-76.5)
Current alcohol use
Yes 79.6 (78.7-80.5) (omitted from model)†
No 71.1‡ (70.3-71.9) (omitted from model)†
Current cigarette smoker
Yes 64.4 (62.7-66.0) 71.6 (70.3-72.9)
No 76.8‡ (76.2-77.4) 76.7‡ (76.1-77.4)
10 Centers for Disease Control and Prevention • www.cdc.gov/pcd/issues/2004/jan/03_0015.htm
The opinions expressed by authors contributing to this journal do not necessarily reflect the opinions of the U.S. Department of Health and Human Services,the Public Health Service, Centers for Disease Control and Prevention, or the authors’ affiliated institutions. Use of trade names is for identification only and
does not imply endorsement by any of the groups named above.
Age-adjusted Multivariate-adjusted†(n = 56,528) (n = 49,564)
% 95% Confidence Interval (%) % 95% Confidence Interval (%)
*Weighted population estimates adjusted for age. Women who responded "don't know" or "not sure" or who refused are excluded. The numbers of partici-pants vary somewhat due to missing data.†Adjusted for age, race/ethnicity, marital status, education, number of children in household, number of persons in household, employment status, generalhealth status, physician visit within past year, health insurance coverage, blood pressure check in past 2 years, cholesterol check in past 2 years, weight,diabetes, and cigarette smoking. Household income, physical activity, and alcohol use were omitted from the multivariate model because of missing data.‡P < .001.§P < .05.¦Excludes women who had had a hysterectomy.¶Excludes women less than 50 years of age.#Data on physical activity were only available for respondents in Georgia, Hawaii, Illinois, Michigan, Nebraska, New Mexico, Ohio, Oklahoma, Tennessee,Utah, and Virginia (n = 10,381).

VOLUME 1: NO. 1JANUARY 2004
www.cdc.gov/pcd/issues/2004/jan/03_0015.htm • Centers for Disease Control and Prevention 11
The opinions expressed by authors contributing to this journal do not necessarily reflect the opinions of the U.S. Department of Health and Human Services,the Public Health Service, Centers for Disease Control and Prevention, or the authors’ affiliated institutions. Use of trade names is for identification only and
does not imply endorsement by any of the groups named above.
Table 2. Percentage of Women Aged 18 Years or Older Who Had Received a Pap Test in the Past 3 Years, According to SelectedDemographic Characteristics and Screening Practices, Behavioral Risk Factor Surveillance System, 1999*
Age (years)
18-29 85.3 (84.3-86.3) 89.3 (88.5-90.1)
30-39 90.0 (89.3-90.8) 88.7 (87.9-89.6)
40-49 88.5 (87.7-89.4) 87.4 (86.5-88.4)
50-64 86.2 (85.1-87.2) 85.4 (84.3-86.5)
> 65 72.2 (70.7-73.7) 77.0‡ (74.9-79.1)
Race/ethnicity
White 85.0 (84.5-85.5) 85.7 (85.2-86.2)
Black 86.1 (84.6-87.7) 88.8 (87.7-90.0)
Hispanic 81.5 (79.3-83.8) 88.8 (87.6-89.9)
Asian and Pacific Islander 78.3 (73.5-83.0) 83.2 (80.4-86.0)
American Indian and Alaska Native 76.3 (69.6-83.0) 83.6 (80.0-87.2)
Other 73.4‡ (66.0-80.8) 79.2‡ (72.2-86.2)
Marital Status
Currently married 88.7 (88.1-89.3) 89.2 (88.6-89.3)
Divorced or separated 83.6 (82.1-85.1) 86.7 (85.6-87.8)
Widowed 82.1 (79.8-84.4) 84.1 (82.6-85.5)
Never married 77.2‡ (75.2-79.3) 81.7‡ (80.0-82.3)
Educational attainment
< High school graduate 74.5 (72.7-76.2) 84.5 (83.4-85.6)
High school graduate/GED 83.3 (82.5-84.1) 86.0 (85.3-86.7)
Some college or technical school 86.1 (85.2-87.0) 86.6 (85.8-87.4)
College graduate 89.7‡ (88.8-90.5) 88.1‡ (87.3-88.9)
Household income
< $15,000 75.1 (73.5-76.8) (omitted from model)†
$15,000-$34,999 82.3 (81.4-83.2) (omitted from model)†
> $35,000 89.9 (89.0-90.7) (omitted from model)†
Missing data 81.7‡ (80.6-82.9) (omitted from model)†
Employment status
Currently employed 85.5 (84.4-86.6) 86.2 (85.6-86.9)
Homemaker or retired 85.1 (84.2-85.9) 86.4 (85.6-87.3)
Unemployed 79.2 (74.9-83.5) 87.5 (85.8-89.2)
Age-adjusted Multivariate-adjusted†(n = 69,113) (n = 60,479)
% 95% Confidence Interval (%) % 95% Confidence Interval (%)

VOLUME 1: NO. 1JANUARY 2004
12 Centers for Disease Control and Prevention • www.cdc.gov/pcd/issues/2004/jan/03_0015.htm
The opinions expressed by authors contributing to this journal do not necessarily reflect the opinions of the U.S. Department of Health and Human Services,the Public Health Service, Centers for Disease Control and Prevention, or the authors’ affiliated institutions. Use of trade names is for identification only and
does not imply endorsement by any of the groups named above.
Unable to work 79.0‡ (76.0-82.0) 86.5 (84.3-88.7)
Number of children in household
0 83.2 (82.5-83.8) 84.4 (83.5-85.3)
1 83.1 (80.1-86.2) 88.3 (87.3-89.3)
2 84.8 (81.3-88.4) 88.8 (87.6-90.0)
3 or more 79.9‡ (72.5-87.4) 89.4‡ (88.0-90.7)
Number of persons in household
1 82.7 (81.7-83.7) 88.8 (87.9-89.7)
2 86.1 (85.3-86.8) 87.2 (74.7-76.7)
3 85.2 (83.6-86.7) 86.4 (85.4-87.4)
4 or more 81.3‡ (78.9-83.7) 83.9‡ (74.9-78.6)
General health status
Good to excellent 85.2 (84.7-85.7) 86.5 (86.0-87.0)
Fair or poor 79.8‡ (78.3-81.3) 85.7 (84.7-86.8)
Saw physician within past year
Yes 90.4 (89.9-90.8) 88.5 (87.9-89.0)
No 64.6‡ (63.2-66.0) 82.6‡ (81.7-83.4)
Health insurance coverage
Yes 86.6 (86.2-87.1) 86.7 (86.2-87.2)
No 66.8‡ (64.0-69.7) 85.0§ (84.0-86.0)
Mammogram in past 2 years¦
Yes 94.4 (93.9-94.8) (omitted from model)†
No 49.4‡ (47.8-51.0) (omitted from model)†
Clinical breast exam in past 2 years¦
Yes 95.4 (95.1-95.7) 95.2 (94.8-95.5)
No 48.2‡ (46.8-49.6) 63.4‡ (62.0-64.9)
Blood stool test in past year¶
Yes 93.8 (92.7-94.9) (omitted from model)†
No 74.8‡ (73.7-75.9) (omitted from model)†
Blood pressure check in past 2 years
Yes 86.9 (86.4-87.3) 87.1 (86.6-87.6)
No 30.2‡ (27.2-33.2) 78.3‡ (76.3-80.3)
Cholesterol check in past 2 years
Yes 90.5 (90.0-90.9) 87.9 (87.3-88.6)
Age-adjusted Multivariate-adjusted†(n = 56,528) (n = 49,564)
% 95% Confidence Interval (%) % 95% Confidence Interval (%)

VOLUME 1: NO. 1JANUARY 2004
www.cdc.gov/pcd/issues/2004/jan/03_0015.htm • Centers for Disease Control and Prevention 13
The opinions expressed by authors contributing to this journal do not necessarily reflect the opinions of the U.S. Department of Health and Human Services,the Public Health Service, Centers for Disease Control and Prevention, or the authors’ affiliated institutions. Use of trade names is for identification only and
does not imply endorsement by any of the groups named above.
No 69.2‡ (68.0-70.4) 84.6‡ (83.9-85.3)
Weight
Underweight 77.7 (74.7-80.8) 83.7 (81.8-85.7)
Normal weight 85.4 (84.7-86.0) 86.7 (86.1-87.3)
Overweight 85.5 (84.6-86.4) 86.5 (85.7-87.2)
Obese 83.9‡ (82.7-85.1) 85.9# (84.9-86.8)
Physical activity**
Physically inactive 80.8 (78.7-82.8) (omitted from model)†
Irregular activity 86.5 (84.7-88.3) (omitted from model)†
Regular activity 85.6 (83.6-87.5) (omitted from model)†
Regular and vigorous activity 87.6‡ (85.1-90.0) (omitted from model)†
Diabetes
Yes 82.6 (79.7-85.6) 84.9 (83.0-86.8)
No 84.5 (84.0-85.0) 86.4 (86.0-86.9)
Current alcohol use
Yes 87.6 (86.9-88.3) (omitted from model)†
No 81.8‡ (81.1-82.5) (omitted from model)†
Current cigarette smoker
Yes 79.6 (78.3-81.0) 86.7 (85.8-87.5)
No 85.4‡ (84.8-85.9) 86.3 (85.7-86.8)
Age-adjusted Multivariate-adjusted†(n = 56,528) (n = 49,564)
% 95% Confidence Interval (%) % 95% Confidence Interval (%)
*Weighted population estimates adjusted for age; women who responded "don't know" or "not sure" or who refused are excluded along with those who hadhad a hysterectomy.†Adjusted for age, weight, race/ethnicity, marital status, education, number of children in household, employment status, general health status, physicianvisit within past year, health insurance coverage, blood pressure check in past 2 years, cholesterol check in past 2 years, diabetes, and cigarette smoking.Household income, physical activity, and alcohol use were omitted from the multivariate model because of missing data. Number of children in householdwas included in the model instead of number of persons in household to avoid problems with colinearity.‡P < .001.§P < .01.¦Excludes women less than 40 years of age.¶Excludes women less than 50 years of age.#P < .05.**Data on physical activity were only available for respondents in Georgia, Hawaii, Illinois, Michigan, Nebraska, New Mexico, Ohio, Oklahoma, Tennessee,Utah, and Virginia (n = 12,600).

VOLUME 1: NO. 1JANUARY 2004
Table 3. Percentage of Women Aged 40 Years or Older Who Had Received a Mammogram in the Past 2 Years, According to HealthBehaviors Associated With Chronic Disease Risk, Behavioral Risk Factor Surveillance System, 1999*
Behaviors That Serve to Detect Disease or Reduce the (n = 53,814) (n = 50,041) Possibility of Future Disease
Cholesterol check in past 2 years, blood pressure 83.6 (82.9-84.2) 81.7 (80.9-82.4)check in past 2 years, and no current cigarette smoking
Cholesterol check in past 2 years, blood pressure check 76.0 (74.3-77.7) 75.8 (74.1-77.4)in past 2 years, but current cigarette smoker
No cholesterol check in past 2 years, no blood pressure 6.5 (2.6-10.5) 22.5 (12.9-32.1) check in past 2 years, and current cigarette smoker
Health Maintenance Behavior‡ (n = 9831) (n = 8796)
Normal weight and physically active 77.6 (74.9-80.3) 75.5 (72.6-78.5)
Normal weight but physically inactive 68.8 (64.8-72.8) 75.1 (71.4-78.8)
Physically active but obese 70.0 (64.6-75.4) 72.2 (67.5-76.8)
Obese and physically inactive 69.0 (64.5-73.5) 73.7 (69.2-78.1)
14 Centers for Disease Control and Prevention • www.cdc.gov/pcd/issues/2004/jan/03_0015.htm
The opinions expressed by authors contributing to this journal do not necessarily reflect the opinions of the U.S. Department of Health and Human Services,the Public Health Service, Centers for Disease Control and Prevention, or the authors’ affiliated institutions. Use of trade names is for identification only and
does not imply endorsement by any of the groups named above.
Age-adjusted Multivariate-adjusted†
% 95% Confidence % 95% ConfidenceInterval (%) Interval (%)
*Weighted population estimates adjusted for age; women who responded "don't know" or "not sure" or who refused are excluded.†Adjusted for age, race/ethnicity, marital status, education, number of children in household, number of persons in household, employment status, generalhealth status, physician visit within past year, health insurance coverage, weight, and diabetes. Household income, physical activity, and alcohol use wereomitted from the multivariate model because of missing data.‡Data on physical activity were only available for respondents in Georgia, Hawaii, Illinois, Michigan, Nebraska, New Mexico, Ohio, Oklahoma, Tennessee,Utah, and Virginia.

Table 4. Percentage of Women Aged 18 Years or Older Who Had Received a Pap Test in the Past 3 Years, According to HealthBehaviors Associated With Chronic Disease Risk, Behavioral Risk Factor Surveillance System, 1999*
Behaviors That Serve to Detect Disease or Reduce the (n = 65,193) (n = 60,761) Possibility of Future Disease
Cholesterol check in past 2 years, blood pressure 90.8 (90.3-91.4) 90.7 (90.1-91.3)†
check in past 2 years, and no current cigarette smoking
Cholesterol check in past 2 years, blood pressure check 89.0 (87.6-90.5) 89.8 (88.6-91.1)†
in past 2 years, but current cigarette smoker
No cholesterol check in past 2 years, no blood pressure 25.1 (19.2-31.0) 54.5 (48.6-60.5)†
check in past 2 years, and current cigarette smoker
Health Maintenance Behavior‡ (n = 12,004) (n = 10,547)
Normal weight and physically active 87.0 (84.9-89.0) 86.4 (84.4-88.4)§
Normal weight but physically inactive 80.0 (76.6-83.4) 86.5 (83.7-89.4)§
Physically active but obese 83.9 (79.5-88.3) 85.5 (81.9-89.2)§
Obese and physically inactive 83.6 (79.8-87.4) 86.5 (83.4-89.5)§
VOLUME 1: NO. 1JANUARY 2004
www.cdc.gov/pcd/issues/2004/jan/03_0015.htm • Centers for Disease Control and Prevention 15
The opinions expressed by authors contributing to this journal do not necessarily reflect the opinions of the U.S. Department of Health and Human Services,the Public Health Service, Centers for Disease Control and Prevention, or the authors’ affiliated institutions. Use of trade names is for identification only and
does not imply endorsement by any of the groups named above.
Age-adjusted Multivariate-adjusted
% 95% Confidence % 95% ConfidenceInterval (%) Interval (%)
*Weighted population estimates adjusted for age; women who responded "don't know" or "not sure" or who refused are excluded.†Adjusted for age, race/ethnicity, marital status, education, number of children in household, number of persons in household, employment status, generalhealth status, physician visit within past year, health insurance coverage, weight, and diabetes. Household income, physical activity, and alcohol use wereomitted from the multivariate model because of missing data.‡Data on physical activity were only available for respondents in Georgia, Hawaii, Illinois, Michigan, Nebraska, New Mexico, Ohio, Oklahoma, Tennessee,Utah, and Virginia.§Adjusted for age, race/ethnicity, marital status, education, number of children in household, number of persons in household, employment status, generalhealth status, physician visit within past year, health insurance coverage, blood pressure check in past 2 years, cholesterol check in past 2 years, diabetes,and cigarette smoking. Household income and alcohol use were omitted from the multivariate model because of missing data.