preventing stroke: uneven progress · preventing stroke: uneven progress is a report by the...
TRANSCRIPT
PREVENTING STROKE: UNEVEN PROGRESSA global policy research programme
Sponsored by
2
Preventing Stroke: Uneven progress is a report by The Economist Intelligence Unit, sponsored by The Bristol-Myers Squibb–Pfizer Alliance. It considers policy efforts to assess and reduce risks of stroke in 20 countries globally based on a scorecard rating each country’s performance across different aspects, including awareness, screening practices and policies among others.
The scorecard and the related research programme whose findings form the basis for this report were informed by the insights of a panel of experts on cardiovascular health and stroke that we convened in November 2016.
The following individuals (listed alphabetically) have also generously contributed their views and insights to this report; The Economist Intelligence Unit extends its gratitude:
• Dr Valeria Caso, President, European Stroke Organisation, stroke neurologist at University of Perugia Stroke Unit, Italy
• Dr Ben Freedman, Deputy Director of Cardiovascular Research and Strategy, Heart Research Institute and Charles Perkins Centre, professor of cardiology at University of Sydney, Australia
• Mellanie True Hills, Founder and CEO, StopAfib.org and the American Foundation for Women’s Health, US • Dr Patrice Lindsay, Director of Stroke, Heart and Stroke Foundation of Canada • Trudie Lobban, MBE, Founder and CEO, Arrhythmia Alliance International, UK• Dr Marten Rosenqvist, Professor, senior physician, Karolinska Institutet, Sweden• Raymond Wimmers, Knowledge and trend manager, Dutch Heart Foundation, European Heart
Network, Netherlands
The Economist Intelligence Unit bears sole responsibility for the content of this report. The findings and views expressed in the report do not necessarily reflect the views of the sponsor. This report was written by Justinian Habner and edited by Becca Lipman of The Economist Intelligence Unit. July 2017
About this report 2
Executive Summary 3
Introduction—The global stroke challenge 4
Chapter 1—Putting the right systems and plans in place 6
Chapter 2—Where the gaps emerge 12
Chapter 3—Future directions 19
Conclusion 20
Appendix I: Methodology 21
Appendix II: Detailed indicator definitions 23
Appendix III: Scorecard 25
Appendix IV: References 26
PREVENTING STROKE: UNEVEN PROGRESS | A global policy research programme
About this report
Contents

3
The burden of stroke on countries, communities and individuals is well-documented, with stroke survivors being troubled by a greater range of disabilities than those with any other condition.1 Fortunately, the risk factors for stroke are relatively well-understood by medical professionals, and opportunities have been identified to implement effective prevention and management strategies. However, these best practices are not consistently implemented around the world.
This report is based on the findings of a scorecard assessing 20 countries across a number of criteria, as well as seven in-depth interviews with experts. It aims to shed some light on the best strategies to tackle stroke risk and discover which countries are taking steps towards better prevention. The report concludes with a look at future policy options.
Executive summary
PREVENTING STROKE: UNEVEN PROGRESS | A global policy research programme
The key findings of the research are:
While stroke has multiple risk factors, many of them are largely addressable. Because a number of other non-communicable diseases (NCD) such as heart disease tend to share the same risk factors as stroke, any policy to lower stroke incidence should be closely linked with other NCD strategies and should address as many factors as possible.
Healthy living policies are well-addressed. Nearly all countries studied have a national healthy diet policy, a physical activity policy, alcohol controls and a tobacco use policy in place. However, implementation of such polices and changes in the behaviour of individuals are far more challenging to measure.
Levels of screening for hypertension and atrial fibrillation (AF), both known risk factors for stroke, are low. If high blood pressure or AF is detected, treatment can be envisaged to reduce the risk of stroke. Given that stroke often presents as the first sign of AF, it is discouraging that at-risk populations are not receiving more screening.
Healthcare systems are the foundation of risk prevention. Healthcare systems play an important role in managing at-risk populations and training and motivating the wider population to take care of their own health. The countries studied score well in this domain. All exceed WHO recommendations for medical staff. However it is unclear if medical professionals are properly trained to identify and treat stroke risks. Several countries show room for improvement in providing affordable access to medications.
Guidelines tell us little about real-world practice. Although guidelines typically make evidence-based recommendations, there are no guarantees that these will filter down to the patient level. The application of clinical guidelines and best practices on the ground is where the scorecard finds the greatest divergence amongst countries and the greatest unmet need.
Future policy should focus on comprehensive and coordinated approaches. The challenge of pulling together both population-based health promotion strategies with effective clinical care is immense. Coordinated initiatives across the elements of the scorecard suggest, however, a potential for greater reduction in stroke incidence and mortality.

4
Chart 1: Disability-adjusted life years (DALY) caused by stroke type (million)
DALY
(mill
ion)
Source: Global Health Data Exchange. http://ghdx.healthdata.org/gbd-results-tool, 2015
Up to 80% of strokes can be avoided, yet across the globe, someone will have a stroke every two seconds; every five seconds someone will die from its effects.2,3 Although more people are surviving stroke than ever before, it is still the second most common cause of death globally after ischaemic heart disease.4,5 The global burden of stroke, in terms of disability-adjusted life years (DALY), a measure of years lost due to poor health, disability or early death, has risen markedly since the 1990s (see chart 1).
Where stroke does not result in death, survivors can experience visual problems, limb weakness, difficulty in speaking, loss of bladder and bowel control, fatigue and problems controlling emotional responses. Comprehensive care is often needed as part of a slow recovery. With nearly half of all stroke survivors having some form of physical or cognitive impairment, it often falls to families and loved ones to support survivors in undertaking common daily activities for a substantial time after leaving hospital.6
The economic impact of stroke, felt by countries and by individuals, is startling. Karolinska Institute, a medical university in Sweden, calculates that if the patient survives with a functional disability, they will, on average, incur an estimated cost of €76,000 (US$85,000) in the first two years post-stroke.7 Stroke patients with more severe disability have even higher costs. Stroke also has great impact on the wider economy through indirect costs such as productivity losses due to morbidity and mortality. In the US, stroke is estimated to cost US$33bn annually, including the cost of healthcare services, medicines and absence from work. In Europe, the healthcare and non-healthcare costs were estimated at €45bn (US$50.37bn) in 2015 and are expected to rise.8
120
110
100
90
80
70
60
50
40
30
201990 1995 2000 2005 2010 2015
Ischaemic stroke
Haemorrhagic stroke
Total stroke
INTRODUCTION: the global stroke challenge
Due to ageing populations combined with the rising prevalence of risk factors, the incidence of stroke is predicted to continue to increase.
PREVENTING STROKE: UNEVEN PROGRESS | A global policy research programme
5
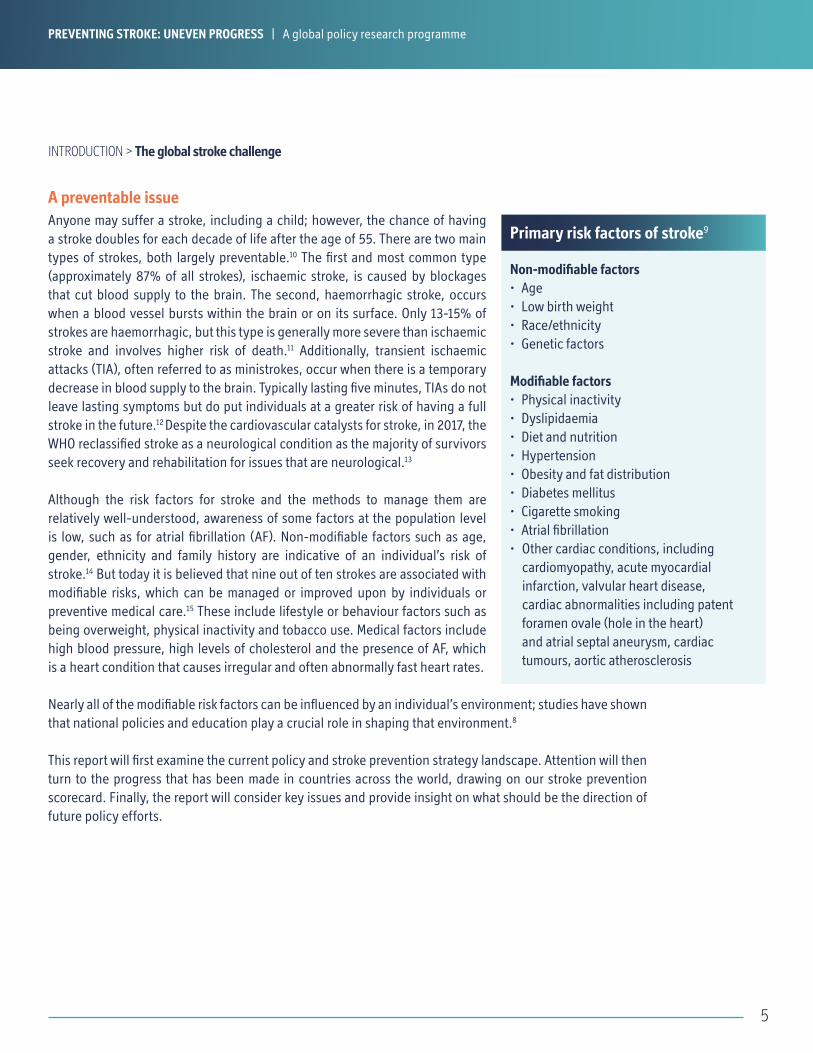
Anyone may suffer a stroke, including a child; however, the chance of having a stroke doubles for each decade of life after the age of 55. There are two main types of strokes, both largely preventable.10 The first and most common type (approximately 87% of all strokes), ischaemic stroke, is caused by blockages that cut blood supply to the brain. The second, haemorrhagic stroke, occurs when a blood vessel bursts within the brain or on its surface. Only 13-15% of strokes are haemorrhagic, but this type is generally more severe than ischaemic stroke and involves higher risk of death.11 Additionally, transient ischaemic attacks (TIA), often referred to as ministrokes, occur when there is a temporary decrease in blood supply to the brain. Typically lasting five minutes, TIAs do not leave lasting symptoms but do put individuals at a greater risk of having a full stroke in the future.12 Despite the cardiovascular catalysts for stroke, in 2017, the WHO reclassified stroke as a neurological condition as the majority of survivors seek recovery and rehabilitation for issues that are neurological.13
Although the risk factors for stroke and the methods to manage them are relatively well-understood, awareness of some factors at the population level is low, such as for atrial fibrillation (AF). Non-modifiable factors such as age, gender, ethnicity and family history are indicative of an individual’s risk of stroke.14 But today it is believed that nine out of ten strokes are associated with modifiable risks, which can be managed or improved upon by individuals or preventive medical care.15 These include lifestyle or behaviour factors such as being overweight, physical inactivity and tobacco use. Medical factors include high blood pressure, high levels of cholesterol and the presence of AF, which is a heart condition that causes irregular and often abnormally fast heart rates.
Nearly all of the modifiable risk factors can be influenced by an individual’s environment; studies have shown that national policies and education play a crucial role in shaping that environment.8
This report will first examine the current policy and stroke prevention strategy landscape. Attention will then turn to the progress that has been made in countries across the world, drawing on our stroke prevention scorecard. Finally, the report will consider key issues and provide insight on what should be the direction of future policy efforts.
INTRODUCTION > The global stroke challenge
A preventable issue
Non-modifiable factors• Age• Low birth weight• Race/ethnicity• Genetic factors
Modifiable factors• Physical inactivity• Dyslipidaemia• Diet and nutrition• Hypertension• Obesity and fat distribution• Diabetes mellitus• Cigarette smoking• Atrial fibrillation• Other cardiac conditions, including
cardiomyopathy, acute myocardial infarction, valvular heart disease, cardiac abnormalities including patent foramen ovale (hole in the heart) and atrial septal aneurysm, cardiac tumours, aortic atherosclerosis
PREVENTING STROKE: UNEVEN PROGRESS | A global policy research programme
Primary risk factors of stroke9

6
The risk factors for stroke are relatively well-understood, but awareness—and action—is inconsistent among policymakers, health professionals and individuals. With so many interrelated variables, they are confronted with a potentially confusing picture of what to do.
To identify best practices for stroke prevention and countries’ weaknesses and strengths on this issue, The Economist Intelligence Unit has developed a scorecard that examines the performance of 20 countries globally across four categories—for a total 16 indicators.
The four categories around which the scorecard is built are: 1) healthcare system(s) and infrastructure; 2) national non-communicable disease (NCD) plans; 3) measures and policies addressing CVD and stroke prevention; and 4) measures and policies to discourage smoking.
The indicators covered include population-based approaches to prevention, such as smoking cessation policies and interventions (eg screening for high blood pressure and AF) designed to target high risk individuals.
The scorecard covers the following countries: Australia, Belgium, Brazil, Canada, China, France, Germany, Italy, Japan, Mexico, the Netherlands, Norway, Russia, Saudi Arabia, South Africa, Spain, Sweden, Turkey, the UK and US. These were selected based on a series of criteria, including geographic region, level of development and wealth, combined with data availability and our expert panel’s opinion.
The scorecard review of healthcare systems, infrastructure and national NCD plans shows a promising foundation. In most of these areas, the countries studied scored well. However, these indicators are broad, and their score may conceal implementation challenges and measures of success. In the scorecard domain that reviews the measuring and tracking of CVD and stroke prevention (eg awareness campaigns, screening of risk factors, stroke registries), it becomes clear that important challenges remain in putting optimal stroke prevention policy into practice.
CHAPTER 1Putting the right systems and plans in place: infrastructure, policies and plans
PREVENTING STROKE: UNEVEN PROGRESS | A global policy research programme
7
CHAPTER 1 > Putting the right systems and plans in place: infrastructure, policies and plans
At the foundation of stroke prevention efforts is the healthcare infrastructure that provides primary and secondary care. Health systems play an important role in screening individuals for risk factors, which, in turn, guide clinical decisions. These services are particularly important for at-risk groups; however, their influence extends to the wider population through training and motivating people to be mindful of their health.
One of the key indicators of a strong, sustainable healthcare system is the number of medical professionals, relative to the population, who are qualified to screen for risks, educate patients and prescribe treatments.
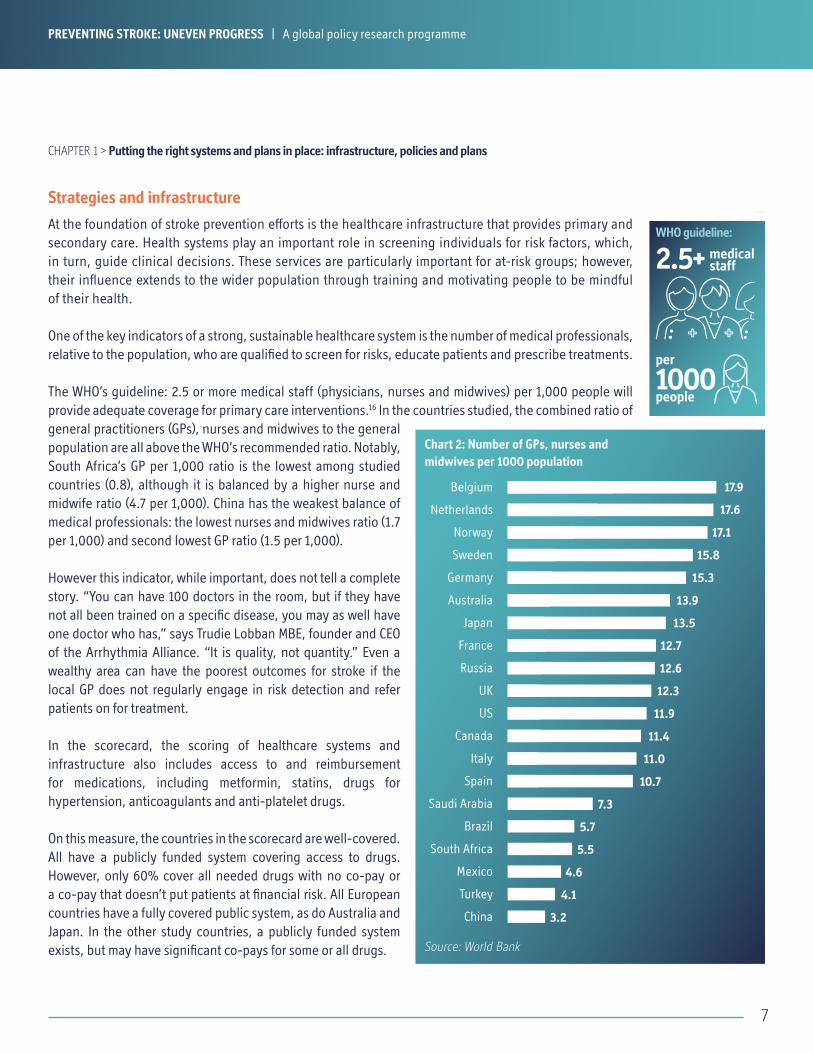
The WHO’s guideline: 2.5 or more medical staff (physicians, nurses and midwives) per 1,000 people will provide adequate coverage for primary care interventions.16 In the countries studied, the combined ratio of general practitioners (GPs), nurses and midwives to the general population are all above the WHO’s recommended ratio. Notably, South Africa’s GP per 1,000 ratio is the lowest among studied countries (0.8), although it is balanced by a higher nurse and midwife ratio (4.7 per 1,000). China has the weakest balance of medical professionals: the lowest nurses and midwives ratio (1.7 per 1,000) and second lowest GP ratio (1.5 per 1,000).
However this indicator, while important, does not tell a complete story. “You can have 100 doctors in the room, but if they have not all been trained on a specific disease, you may as well have one doctor who has,” says Trudie Lobban MBE, founder and CEO of the Arrhythmia Alliance. “It is quality, not quantity.” Even a wealthy area can have the poorest outcomes for stroke if the local GP does not regularly engage in risk detection and refer patients on for treatment.
In the scorecard, the scoring of healthcare systems and infrastructure also includes access to and reimbursement for medications, including metformin, statins, drugs for hypertension, anticoagulants and anti-platelet drugs.
On this measure, the countries in the scorecard are well-covered. All have a publicly funded system covering access to drugs. However, only 60% cover all needed drugs with no co-pay or a co-pay that doesn’t put patients at financial risk. All European countries have a fully covered public system, as do Australia and Japan. In the other study countries, a publicly funded system exists, but may have significant co-pays for some or all drugs.
Strategies and infrastructure
PREVENTING STROKE: UNEVEN PROGRESS | A global policy research programme
Source: World Bank
Chart 2: Number of GPs, nurses and midwives per 1000 population
Belgium
Netherlands
Norway
Sweden
Germany
Australia
Japan
France
Russia
UK
US
Canada
Italy
Spain
Saudi Arabia
Brazil
South Africa
Mexico
Turkey
China
4.6
5.7
5.5
4.1
3.2
17.6
17.1
15.8
15.3
13.9
13.5
12.7
12.6
12.3
11.9
11.4
11.0
10.7
7.3
17.9
per 1000people
WHO guideline:
2.5+ medical staff
8
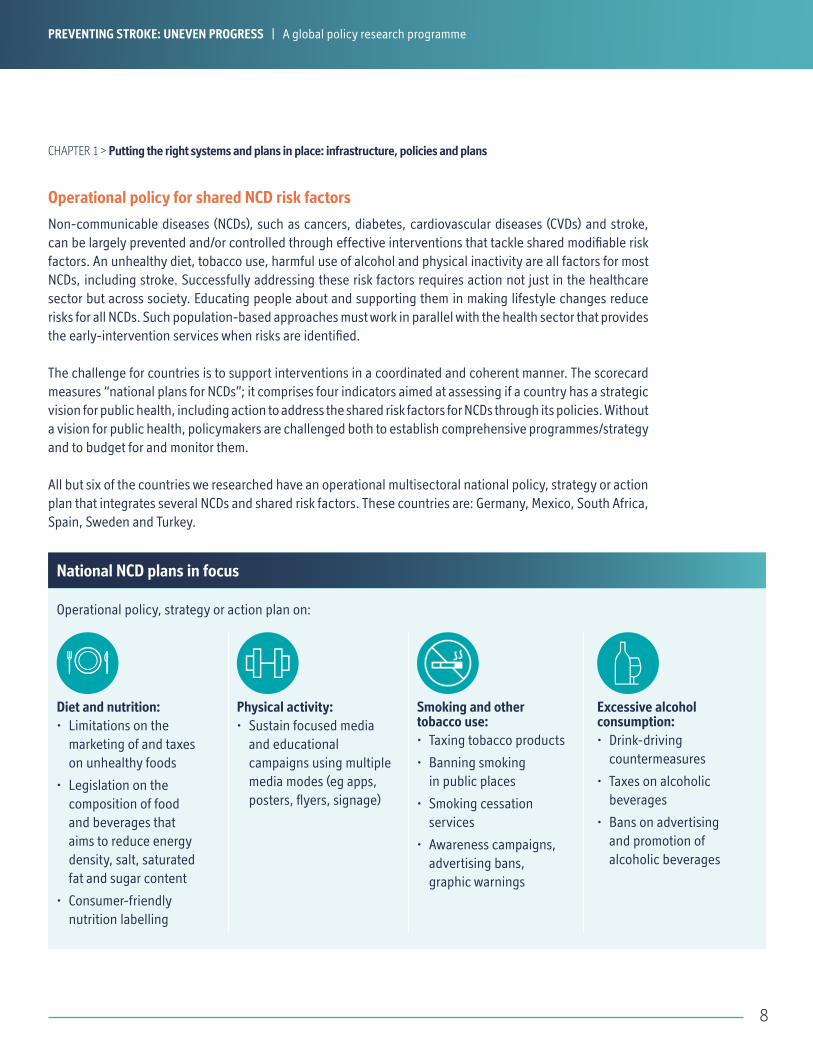
Non-communicable diseases (NCDs), such as cancers, diabetes, cardiovascular diseases (CVDs) and stroke, can be largely prevented and/or controlled through effective interventions that tackle shared modifiable risk factors. An unhealthy diet, tobacco use, harmful use of alcohol and physical inactivity are all factors for most NCDs, including stroke. Successfully addressing these risk factors requires action not just in the healthcare sector but across society. Educating people about and supporting them in making lifestyle changes reduce risks for all NCDs. Such population-based approaches must work in parallel with the health sector that provides the early-intervention services when risks are identified.
The challenge for countries is to support interventions in a coordinated and coherent manner. The scorecard measures “national plans for NCDs”; it comprises four indicators aimed at assessing if a country has a strategic vision for public health, including action to address the shared risk factors for NCDs through its policies. Without a vision for public health, policymakers are challenged both to establish comprehensive programmes/strategy and to budget for and monitor them.
All but six of the countries we researched have an operational multisectoral national policy, strategy or action plan that integrates several NCDs and shared risk factors. These countries are: Germany, Mexico, South Africa, Spain, Sweden and Turkey.
Operational policy for shared NCD risk factors
CHAPTER 1 > Putting the right systems and plans in place: infrastructure, policies and plans
Diet and nutrition:• Limitations on the
marketing of and taxes on unhealthy foods
• Legislation on the composition of food and beverages that aims to reduce energy density, salt, saturated fat and sugar content
• Consumer-friendly nutrition labelling
Physical activity:• Sustain focused media
and educational campaigns using multiple media modes (eg apps, posters, flyers, signage)
Smoking and other tobacco use:• Taxing tobacco products
• Banning smoking in public places
• Smoking cessation services
• Awareness campaigns, advertising bans, graphic warnings
Excessive alcohol consumption:• Drink-driving
countermeasures
• Taxes on alcoholic beverages
• Bans on advertising and promotion of alcoholic beverages
Operational policy, strategy or action plan on:
PREVENTING STROKE: UNEVEN PROGRESS | A global policy research programme
National NCD plans in focus

9
Among the countries studied, national policies that address modifiable risk factors appear to be well-established. According to the WHO, population-wide strategies that target individual behaviour can reduce the number of deaths and improve quality of life. Even small changes in the distribution of risk can lead to major reductions in CVD and stroke incidence across populations.17,18
All of the countries studied have a national healthy diet policy, a physical activity policy and a tobacco use policy in place. Eighteen of the 20 have a strategy to reduce harmful alcohol consumption, the exceptions being Saudi Arabia and Turkey. Both countries present their exceptions as driven by cultural norms that forbid the drinking of alcohol.
While this is a promising foundation for stroke prevention policy, there is often discrepancy in the local implementation of the policies. “You need to have local champions,” says Ms Lobban. “Governments and healthcare services can promise anything, but if no services or resources are delivered on the ground, it is not going to happen.” She adds that in many countries, there will be pockets where implementation is excellent and others not at all.
Healthy living policies are widespread
Chart 3: Existence of National NCD plansNumber of countries studied with the following in place
Source: World Health Organisation
NCD plan Healthy diets policy
Physical activity policy
Tobacco use policy
Alcohol consumption policy
14
20 20
CHAPTER 1 > Putting the right systems and plans in place: infrastructure, policies and plans
1820
PREVENTING STROKE: UNEVEN PROGRESS | A global policy research programme

10
CHAPTER 1 > Putting the right systems and plans in place: infrastructure, policies and plans
Tobacco smoking is a well-established risk factor for stroke as well as a large number of other harmful health conditions.19 According to the WHO, tobacco kills more than 7 million people each year, around 890,000 of those deaths are of non-smokers exposed to second-hand smoke.20 For the WHO, smoking cessation programmes are central to stroke prevention efforts. This is based on both the prevalence of smoking and the evidence that tobacco smokers have at least a two- to fourfold increased risk of stroke compared with lifelong non-smokers or those who have stopped smoking for ten or more years.19
Tobacco use is on the decline in the US21 and in Western Europe22, even though the overall rates remain high in some countries, including France and Germany.23 In Eastern Europe and Asia, rates are still high, with tobacco smoking responsible for 12% of stroke mortality in developing countries.24
To support governments in reducing tobacco use, the WHO developed MPOWER, a package of six proven interventions for tobacco control: monitoring tobacco use and prevention policies; protecting people from tobacco use; offering help to quit tobacco use; warning about the dangers of tobacco use; enforcing bans on tobacco advertising, promotion and sponsorship; raising taxes on tobacco.25 These have proven success in reducing tobacco use in many countries.26
To capture tobacco control initiatives in the scorecard, we grouped four indicators together: a tobacco use policy; national taxation on tobacco products; bans on smoking in public places; and smoking cessation programmes.
Although all countries in the sample have a plan to control the use of tobacco, not all have fully implemented their policies.
For example, the WHO finds taxing tobacco at least 75% of the retail price of the most popular brands of cigarettes has been the most effective prevention technique. Only 60% of the sample has a national tax rate that meets or exceeds the optimal rate promoted by the WHO. The US is among the countries with the lowest score, as tax rates vary widely from state to state and are levied on top of a low federal rate.27
To account for the detrimental effects of exposure to second-hand smoke,28 the scorecard found 10 of the 20 countries surveyed have banned smoking nationwide in indoor offices, cafes, pubs and bars and have established fines for smoking in any of those places. Moreover, six countries (Australia, Canada, Germany, Netherlands, Norway, and South Africa) have partial bans on smoking in public places. All provinces in Canada have public smoking bans in place.29
Tobacco policies in place, but not supported at scale
Source: World Health Organisation, Tobacco taxes and prices report, 201429
3
2
3
12
Chart 4: Tax rate on the most sold brand of cigarettesNumber of countries with rates different from optimal 75% tax rate
Within 10% of optimal
10-20% lower than optimal
20-30% lower than optimal
30%+ lower than optimal
PREVENTING STROKE: UNEVEN PROGRESS | A global policy research programme
11
CHAPTER 1 > Putting the right systems and plans in place: infrastructure, policies and plans
Regardless of the preventive efforts, and the consequent reduction in young adults taking up smoking, unless current smokers quit, deaths will rise dramatically in the next 50 years.30 Thus, WHO considers smoking cessation programmes to be crucial to improving public health.31
The scorecard shows South Africa as the only studied country that has failed to put a smoking cessation programme in place. All of the other countries have some or all of critical tools in place, including a toll-free helpline, smoking cessation clinics and at least some level of coverage for nicotine replacement therapy or other medication to support smoking cessation.
However, these findings mask issues of implementation. Smoking cessation infrastructure is still relatively poor in Europe and elsewhere. Article 14 of the WHO’s Framework Convention on Tobacco Control (FCTC) outlines recommendations, including tobacco treatment infrastructure and cessation support systems. A recent survey found that less than half the 142 countries surveyed,32 and only 16% of countries in Europe,33 have implemented cessation services in line with the FCTC Article 14 policy. More work is needed on smoking cessation programmes and services.
Unless current smokers quit, deaths will rise dramatically in the next 50 years. Thus, WHO considers smoking cessation programmes to be crucial to improving public health.
PREVENTING STROKE: UNEVEN PROGRESS | A global policy research programme
12
As we have seen in Chapter 1, NCD policies are an area of focus for policymakers in all countries studied. However, effective implementation is not always accomplished and is far more challenging to measure.
This chapter focuses on how countries approach the implementation of best practices to help prevent cardiovascular diseases and stroke and how they work to create awareness of the risks and the prevention strategies they use. We found major disparities in the collection of data on stroke and in initiatives to raise awareness. Most troubling is the low incidence of recommended screenings in a clinical setting for high risk patients.
CHAPTER 2 Where the gaps emerge: best practices in CVD and stroke prevention
Despite the success of policies around NCDs, Mellanie True Hills, founder and CEO of StopAfib.org and the American Foundation for Women’s Health, says “the biggest improvement so far in my mind comes from clinical guidelines”. Clinical guidelines help inform clinicians’ decisions on appropriate interventions; they also offer the opportunity for creating more formalised systems to conduct comparative effectiveness research and ongoing evaluation, which, in turn, can inform policies and improve patient care. Only 13 of the 20 countries have evidence-based national guidelines/protocols/standards for the management of major NCDs through a primary care approach.
For Ms Hills, guidelines based on clinical evidence are a critical measure for preventing stroke. For example, the CHA
2DS
2-VASc score,34 which comprises clinical prediction rules for estimating the risk of stroke in patients
with AF, determines whether or not treatment, such as anticoagulants, is recommended. Ms Hills sees such clinical guidelines as central to identifying and treating most high risk individuals.
However, the publishing of national guidelines is not a solution on its own. To be successful, implementation in clinical practice requires education, time and resources. “They are, after all, guidelines, not a law,” says Ms Lobban. Many GPs cannot read all the guidelines published on all diseases and likely lack incentive and time to review them.
Patrice Lindsay, director of Stroke, Heart and Stroke Foundation in Canada, agrees that doctors do not have time to read every guideline. “Stroke is one of 400 diseases they see a day”, and too often different patient groups are subject to different guidelines, despite the presence of overlapping issues. To be effective, and to help reinforce best practices, developers of stroke risk guidelines should work collaboratively with experts in related areas, such as hypertension, diabetes and heart disease. “They have a responsibility to provide that consistency,” says Dr Lindsay.
Problems with evidence-based NCD guidelines
The publishing of national guidelines is not a solution on its own. To be successful, implementation in clinical practice requires education, time and resources.
PREVENTING STROKE: UNEVEN PROGRESS | A global policy research programme
13
CHAPTER 2 > Where the gaps emerge: best practices in CVD and stroke prevention
Public education is a key thread through many of the policies, strategies and campaigns to prevent stroke. Patients should know what lifestyle changes lower their risk of stroke. And in the event of stroke, patients should know what symptoms to look for, what medical services to seek and what treatments they’re getting, explains Ms Lobban. “They need to understand what services are available to them.”
Valeria Caso, stroke neurologist at the University of Perugia Stroke Unit and Executive Committee, president of the European Stroke Organisation, says there remains an “image problem” for stroke, with the condition considered to be a natural part of ageing and not a preventable and treatable disease. Stroke is not a hot topic in the healthcare agenda for many countries, she explains.
Dr Lindsay adds that before a clot treatment drug, tissue plasminogen activator (tPA), was approved as a treatment in the late 90’s (approved in 1996 in the USA35, 1999 in Canada36), the attitude was there’s nothing you can do about stroke except to make a patient comfortable. Great medical advances have been made since then, but too few patients get to the hospital in time to be eligible for some of the treatments.
Only about one-third of stoke patients are getting to the hospital in the 3.5-hour window (recently increased to 4.5 hours37) required for tPA treatment to be effective. “We have to get everyone in that emergency mindset,” Dr Lindsay says. “The public needs to learn to address signs of stroke and understand the urgency of treatment options. Every minute counts.”
Information and awareness are crucial for the general population to recognise stroke symptoms and act quickly to mitigate them.
The WHO has endorsed the FAST campaign to teach people at the population level about the common symptoms of stroke (face: drooping on one side; arms: can arms be raised; speech: may be slurred; time: act quickly) and encourages timely intervention to ensure a better recovery. The number of countries implementing NCD guidelines and plans that include FAST continues to grow.
The scorecard clearly shows that more could be done to raise awareness around stroke. Awareness was scored on the basis of a country having a support group affiliated with the World Stroke Organisation and if it observed World Stroke Day in 2016 (October 29). This global organisation and campaign help raise awareness of stroke risk factors and prevention, treatment and support resources. While these are prominent organisations, there are others, and they all have a role to play. “It is all like pieces of a jigsaw,” says Ms Lobban. “There is no right or wrong way of this. You need all manner of initiatives to bring everything together, such as the global Know Your Pulse campaign. And ultimately governments, policymakers, patients, caregivers, healthcare
Initiatives to raise stroke awareness
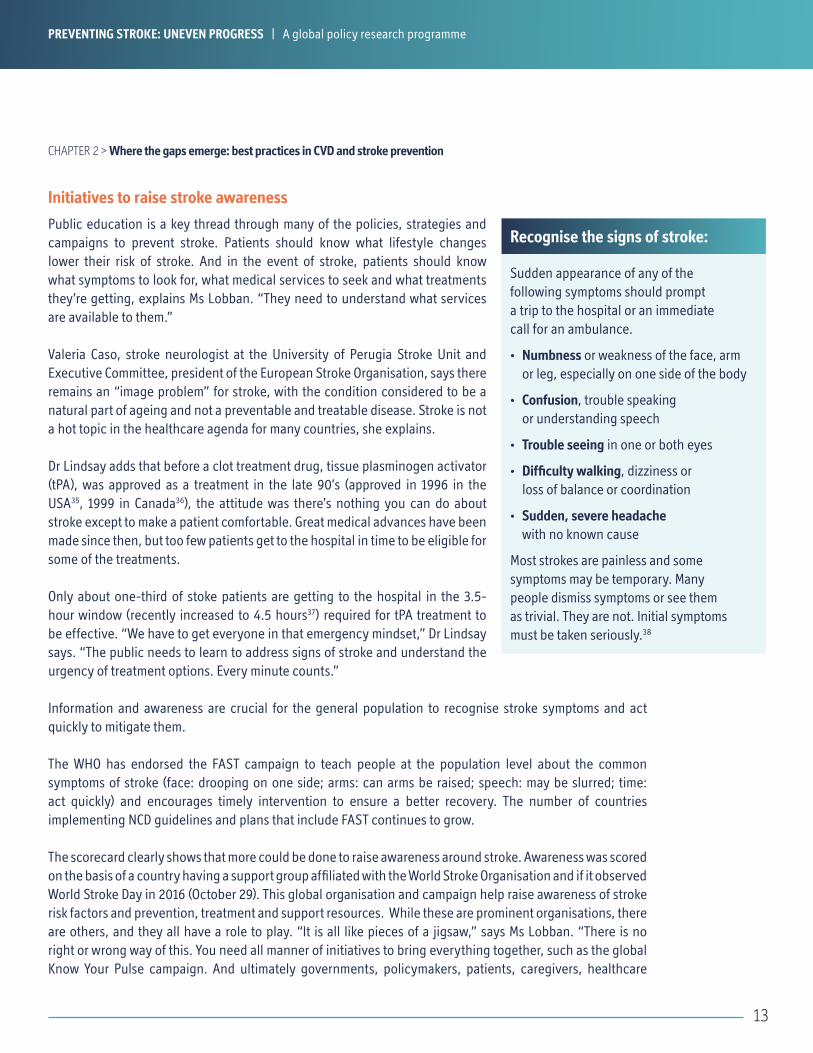
Sudden appearance of any of the following symptoms should prompt a trip to the hospital or an immediate call for an ambulance.
• Numbness or weakness of the face, arm or leg, especially on one side of the body
• Confusion, trouble speaking or understanding speech
• Trouble seeing in one or both eyes
• Difficulty walking, dizziness or loss of balance or coordination
• Sudden, severe headache with no known cause
Most strokes are painless and some symptoms may be temporary. Many people dismiss symptoms or see them as trivial. They are not. Initial symptoms must be taken seriously.38
PREVENTING STROKE: UNEVEN PROGRESS | A global policy research programme
Recognise the signs of stroke:

14
CHAPTER 2 > Where the gaps emerge: best practices in CVD prevention
professionals, anyone and everyone associated with arrhythmia [heart rhythm disorders] will need to collaborate to improve the outcome for all those involved or affected by stroke.”
Six countries (Australia, Canada, Italy, South Africa, UK and US) received a full score for having both initiatives in place, while six countries either have an affiliated support group or participated in World Stroke Day. The remaining eight countries had neither initiative but may participate in other stroke recognition efforts.
FAST in Canada
Adoption and promotion of stroke awareness are different. If you don’t actively share that information, it is only going to have so much value. “It’s on our website” does not work, says Patrice Lindsay, who directs stroke awareness campaigns in Canada. A FAST campaign across Canadian provinces was pushed through the use of radio, television, print ads, bus station ads and even decals on ambulances. One year after the campaign, a national polling of 3,000 Canadians that asked what stroke is and what should be done showed the baseline of people knowing the FAST signs had gone up significantly. In areas where a second year of campaigns ran, awareness was even higher.
“During the time when commercials were running, the number of people using ambulances went up, and as commercials stopped, it went back down. This tells us that the public needs constant reminders because even though FAST is a lot easier to remember, they won’t retain it all.”
Besides the data, the Heart and Stroke Foundation of Canada receives testimonials from the public. An 8-year-old girl who was with her grandmother recognised symptoms from a commercial and got her to hospital in time. A woman on the phone with her mom noticed slurred speech and sent an ambulance. “We get these stories sent to us on a very regular basis,” Dr Lindsay says. “They often say they knew what to do because they saw it on the bus shelters or on TV.”
PREVENTING STROKE: UNEVEN PROGRESS | A global policy research programme
15
Many risk factors must be covered to prevent stroke, with screening in clinical settings playing an important role. Screening may involve at least two approaches:
1) systematic population screening programmes for asymptomatic people and 2) opportunistic screening in primary care.39
Blood pressure monitoring and screening for AF in primary care settings are explicitly recommended in many countries. If high blood pressure or AF is detected, treatment can be initiated to reduce the risk of stroke. The picture is mixed across countries as to the extent that opportunistic screening is fully integrated into clinical practice.
To understand how opportunistic screening for blood pressure and AF is applied in the real world, we did an online survey of 1,000 physicians in 2017 (50 physicians in each country studied) to identify the proportion of patients screened for hypertension and AF in a primary care setting.
The survey was designed to eliminate bias; therefore questions were asked on other domains of primary care where screening is important. Short periods of time were used, and a funnel approach as per the below:
• Physicians were asked about the patient load (total number of patients seen in the past period), and then by age bands
• Then asked for the total number screened for a selection of conditions—including hypertension and AF
• Then asked how many of those screenings were done for people who had been identified with a pre-existing condition
• The percentage balance was calculated (ie people in the relevant age band who had been screened out of the people who were not already monitored for a pre-existing condition)
Screening responsibly
Screening programmes
Systematic population screening programmes identify people who may be at increased risk of a disease or condition. Following a screening test, providers offer information, further tests, support and treatment to reduce associated risks or complications. The programmes are often centrally funded and have built-in quality assurance measures. Examples include screening for breast and cervical cancers.
Opportunistic screening is done for a patient who has consulted a medical professional for other purposes. Examples: a GP checking a patient’s blood pressure or a dentist looking for signs of oral diseases. This testing is done outside of an organised quality-assured screening programme. Serious conditions or risks may be identified by this type of screening. Further testing or specialist referral is usually required to make a diagnosis.
PREVENTING STROKE: UNEVEN PROGRESS | A global policy research programme
CHAPTER 2 > Where the gaps emerge: best practices in CVD and stroke prevention
16
CHAPTER 2 > Where the gaps emerge: best practices in CVD prevention
HypertensionHigh blood pressure, or hypertension, is the most important modifiable risk factor for stroke. Over time, high blood pressure damages and narrows blood vessels, increasing the risk of blockages that stop the flow of blood to the brain. The prevalence of high blood pressure rises significantly with age.40
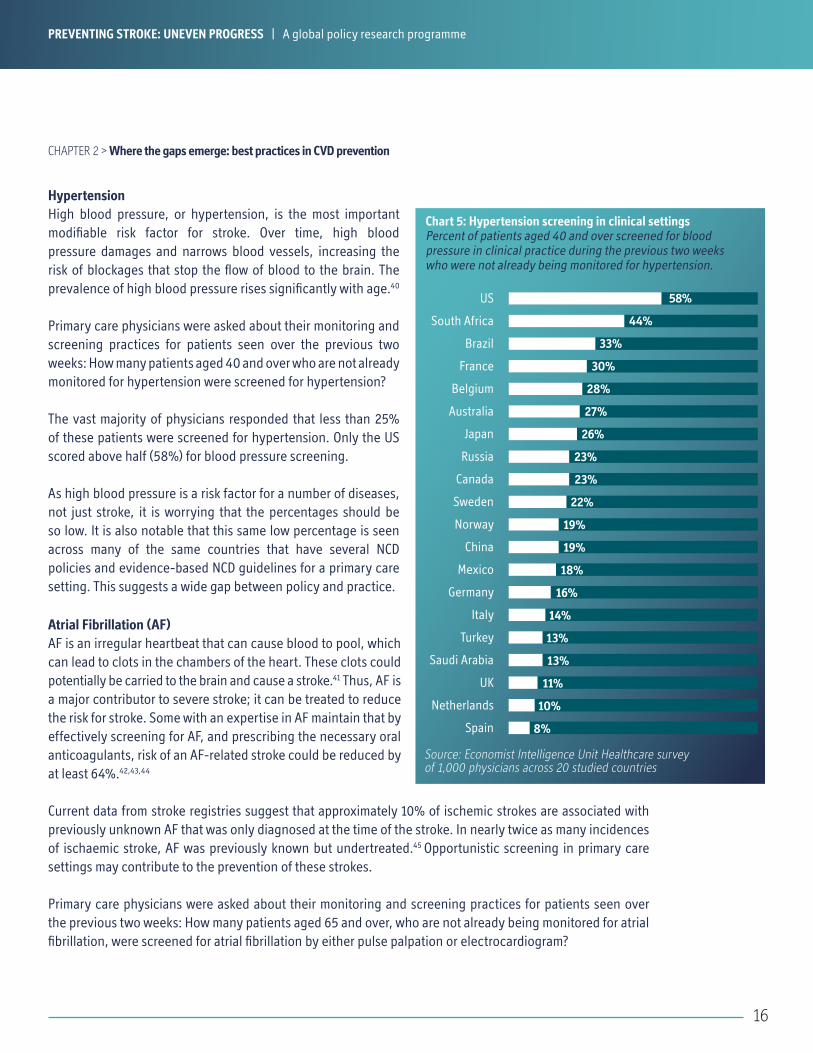
Primary care physicians were asked about their monitoring and screening practices for patients seen over the previous two weeks: How many patients aged 40 and over who are not already monitored for hypertension were screened for hypertension?
The vast majority of physicians responded that less than 25% of these patients were screened for hypertension. Only the US scored above half (58%) for blood pressure screening.
As high blood pressure is a risk factor for a number of diseases, not just stroke, it is worrying that the percentages should be so low. It is also notable that this same low percentage is seen across many of the same countries that have several NCD policies and evidence-based NCD guidelines for a primary care setting. This suggests a wide gap between policy and practice.
Atrial Fibrillation (AF)AF is an irregular heartbeat that can cause blood to pool, which can lead to clots in the chambers of the heart. These clots could potentially be carried to the brain and cause a stroke.41 Thus, AF is a major contributor to severe stroke; it can be treated to reduce the risk for stroke. Some with an expertise in AF maintain that by effectively screening for AF, and prescribing the necessary oral anticoagulants, risk of an AF-related stroke could be reduced by at least 64%.42,43,44
Current data from stroke registries suggest that approximately 10% of ischemic strokes are associated with previously unknown AF that was only diagnosed at the time of the stroke. In nearly twice as many incidences of ischaemic stroke, AF was previously known but undertreated.45 Opportunistic screening in primary care settings may contribute to the prevention of these strokes.
Primary care physicians were asked about their monitoring and screening practices for patients seen over the previous two weeks: How many patients aged 65 and over, who are not already being monitored for atrial fibrillation, were screened for atrial fibrillation by either pulse palpation or electrocardiogram?
Chart 5: Hypertension screening in clinical settingsPercent of patients aged 40 and over screened for blood pressure in clinical practice during the previous two weeks who were not already being monitored for hypertension.
US
South Africa
Brazil
France
Belgium
Australia
Japan
Russia
Canada
Sweden
Norway
China
Mexico
Germany
Italy
Turkey
Saudi Arabia
UK
Netherlands
Spain
11%
13%
13%
10%
8%
44%
33%
30%
28%
27%
26%
23%
23%
22%
19%
19%
18%
16%
14%
58%
PREVENTING STROKE: UNEVEN PROGRESS | A global policy research programme
Source: Economist Intelligence Unit Healthcare survey of 1,000 physicians across 20 studied countries
Source: Economist Intelligence Unit Healthcare survey of 1,000 physicians across 20 studied countries
17
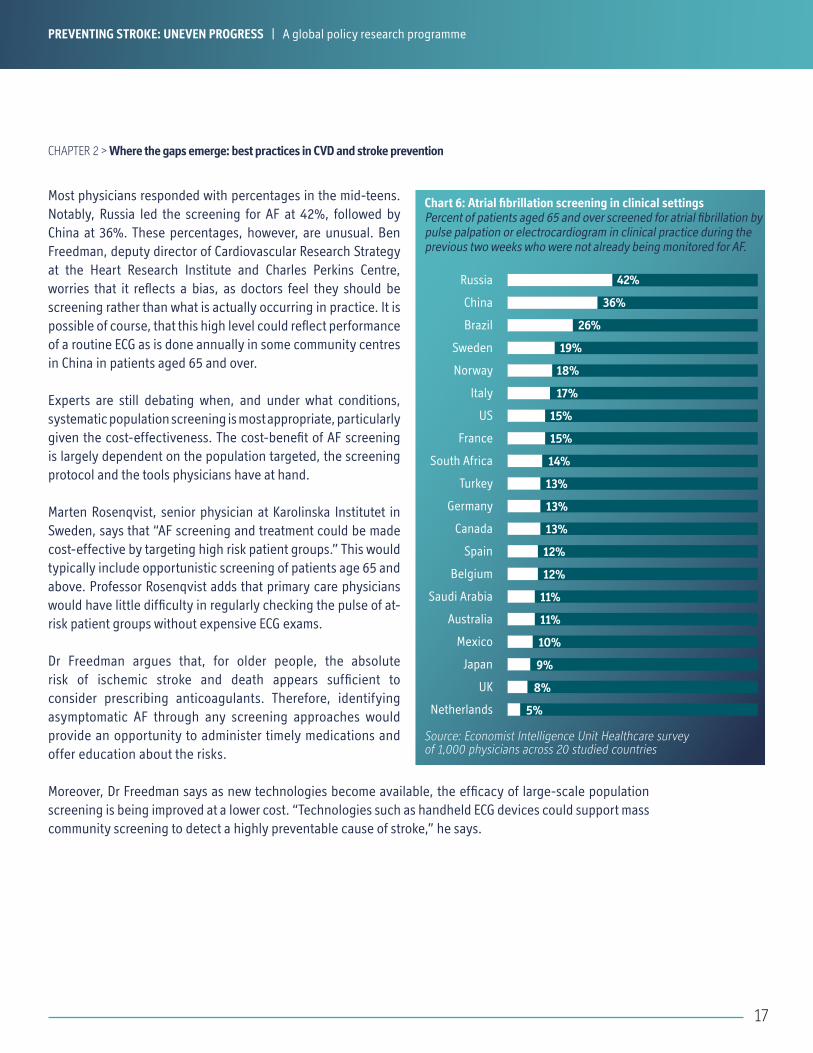
Most physicians responded with percentages in the mid-teens. Notably, Russia led the screening for AF at 42%, followed by China at 36%. These percentages, however, are unusual. Ben Freedman, deputy director of Cardiovascular Research Strategy at the Heart Research Institute and Charles Perkins Centre, worries that it reflects a bias, as doctors feel they should be screening rather than what is actually occurring in practice. It is possible of course, that this high level could reflect performance of a routine ECG as is done annually in some community centres in China in patients aged 65 and over.
Experts are still debating when, and under what conditions, systematic population screening is most appropriate, particularly given the cost-effectiveness. The cost-benefit of AF screening is largely dependent on the population targeted, the screening protocol and the tools physicians have at hand.
Marten Rosenqvist, senior physician at Karolinska Institutet in Sweden, says that “AF screening and treatment could be made cost-effective by targeting high risk patient groups.” This would typically include opportunistic screening of patients age 65 and above. Professor Rosenqvist adds that primary care physicians would have little difficulty in regularly checking the pulse of at-risk patient groups without expensive ECG exams.
Dr Freedman argues that, for older people, the absolute risk of ischemic stroke and death appears sufficient to consider prescribing anticoagulants. Therefore, identifying asymptomatic AF through any screening approaches would provide an opportunity to administer timely medications and offer education about the risks.
Moreover, Dr Freedman says as new technologies become available, the efficacy of large-scale population screening is being improved at a lower cost. “Technologies such as handheld ECG devices could support mass community screening to detect a highly preventable cause of stroke,” he says.
Chart 6: Atrial fibrillation screening in clinical settingsPercent of patients aged 65 and over screened for atrial fibrillation by pulse palpation or electrocardiogram in clinical practice during the previous two weeks who were not already being monitored for AF.
Russia
China
Brazil
Sweden
Norway
Italy
US
France
South Africa
Turkey
Germany
Canada
Spain
Belgium
Saudi Arabia
Australia
Mexico
Japan
UK
Netherlands
9%
11%
10%
8%
5%
36%
26%
19%
18%
17%
15%
15%
14%
13%
13%
13%
12%
12%
11%
42%
PREVENTING STROKE: UNEVEN PROGRESS | A global policy research programme
CHAPTER 2 > Where the gaps emerge: best practices in CVD and stroke prevention

18
CHAPTER 2 > Where the gaps emerge: best practices in CVD prevention
The existence of national stroke registries is among the rising priorities for measuring and managing stroke risks. Registries are tools to follow patients, document their characteristics and experience, and to understand and track the outcomes of specific interventions. The data gathered can then be used to inform improvements in clinical practice and health policies.
Half the sample had, as of late 2015, a stroke registry—a sign of growing interest in following patients and documenting outcomes. Dr Freedman adds that registries are most effective when linked with other health registries and prescription data, thus becoming a powerful tool to implement activity to target and monitor interventions on multiple stroke risk factors.
For example, the Swedish national stroke registry, Riksstroke, can be combined with Sweden’s national patient register and national dispensed drug register, and serve as a rich data source for medical and policy research.
The importance of data: national stroke registries
Chart 7: Existence of national stroke registries
Source: Economist Intelligence Unit research
2+ stroke registries exist
1 stroke registry exists
0 known national stroke registry initiativeBelgiumBrazilFranceItalyNetherlands
NorwaySaudi ArabiaSouth AfricaSpainTurkey
Australia Canada China Germany
Japan Russia Sweden
MexicoUKUS
PREVENTING STROKE: UNEVEN PROGRESS | A global policy research programme
19
The increasing prevalence of stroke across the globe suggests that more needs to be done to close the gap between various countries’ health policies and practices known to mitigate risk factors.
To be effective, the future of policy efforts must have two core elements. The first: a combination of population-wide approaches and individual clinical approaches. Population approaches include awareness campaigns, healthy lifestyle promotion and population screening of high risk groups. Clinical approaches include the implementation of and adherence to guidelines and patient follow-ups through medical registries.
The second: a call for coordination across the different components of stroke prevention. To create synergies, NCD policies for wider health promotion should not be siloed, but should involve partnerships among a spectrum of stakeholders. The success of interventions to reduce tobacco smoking, for example, relies on public policy initiatives such as smoke-free laws, combined with health-specific interventions such as clinically led smoking cessation programmes.
The scorecard highlights the importance of implementing multiple, yet comprehensively linked, approaches to preventing stroke, serving as a guide for political and clinical change. Each element, improved in policy and practice, has the potential to create widespread change across populations. The more prevention initiatives across the element of the scorecard that countries are able to effectively implement, the greater the likelihood of a reduction in stroke incidence and mortality.
CHAPTER 3: Future directions: a focus on coordinated approaches
New and emerging technologies are offering opportunities to address risk factors in a cost-effective manner. Raymond Wimmers, knowledge and trends manager of the Dutch Heart Foundation, supports the use of innovative technology to educate people “using personal monitoring devices, such as smartphones and apps, that allows people to better understand their own health and risk factors. These devices can potentially reach and educate more people than doctors and health professionals alone”.
Indeed, smartphones and apps can provide real-time information to individuals and health professionals to assist clinical decision-making. The number of clinically tested apps and tools with this aim continues to rise.45
Important, greater focus is being given to the role technology can play in supporting sustained behaviour change. Apps such as JOOL Health use data, predictive modelling and behaviour-modification strategies to give people the determination to maintain healthier lifestyles and tackle risk factors such as smoking, alcohol use, poor diet and lack of exercise.
Cost-effective technologies also help screening programmes be more efficient by providing high positive predictive value at low cost. Devices ranging from handheld ECGs to smartphones that use camera and flash to measure blood flow have been developed for AF screening.46 Harnessing the power of low-cost and widely available technology provides opportunities to implement effective population screening.47
Technology assistance
PREVENTING STROKE: UNEVEN PROGRESS | A global policy research programme

20
Stroke remains a growing problem for nations and individuals. Our scorecard demonstrates that there is a manageable, defined set of key medical and non-medical risk factors that can be addressed by integrated policies to prevent stroke. However, although many good efforts may be taking place in certain areas, significant gaps remain.
Effectively reducing the prevalence and burden of stroke requires countries to develop stronger strategies and to do more to address implementation on the ground. Strategies may include the following:
Coordinating interventions against a range of risk factors and ensuring that all modifiable elements are targeted. These stroke prevention strategies must be integrated with strategies for other NCDs where risk factors are overlapping.
Combining individual medical interventions for known at-risk groups with population-based approaches to ensure that those at higher risk of stroke have the opportunity to tackle risk factors while the majority of the population is encouraged to improve overall personal health and well-being.
Improve education and promotion around the risk factors for stroke such as high blood pressure, AF, limited physical activity, poor diet, alcohol and tobacco use. Continuing to educate people to recognise stroke warning signs and act immediately will also increase the proportion of stroke survivors.
Implement screenings (population and/or opportunistic) to detect major risk factors of stroke, such as hypertension and AF, and initiate timely and appropriate clinical care.
Ensure that more clinically relevant data are collected and collated will help governments to better understand the prevalence of stroke and to support the development of appropriate prevention strategies and stroke management services.
Data-sharing between countries on which stroke prevention policies and programmes are working and which ones are not. Implementing policies that address so many risk factors is a challenge and requires careful evaluation. Tools like the scorecard can be used by governments to identify where improvements in policy could be made and where best practices might be drawn from.
Conclusion
PREVENTING STROKE: UNEVEN PROGRESS | A global policy research programme
21
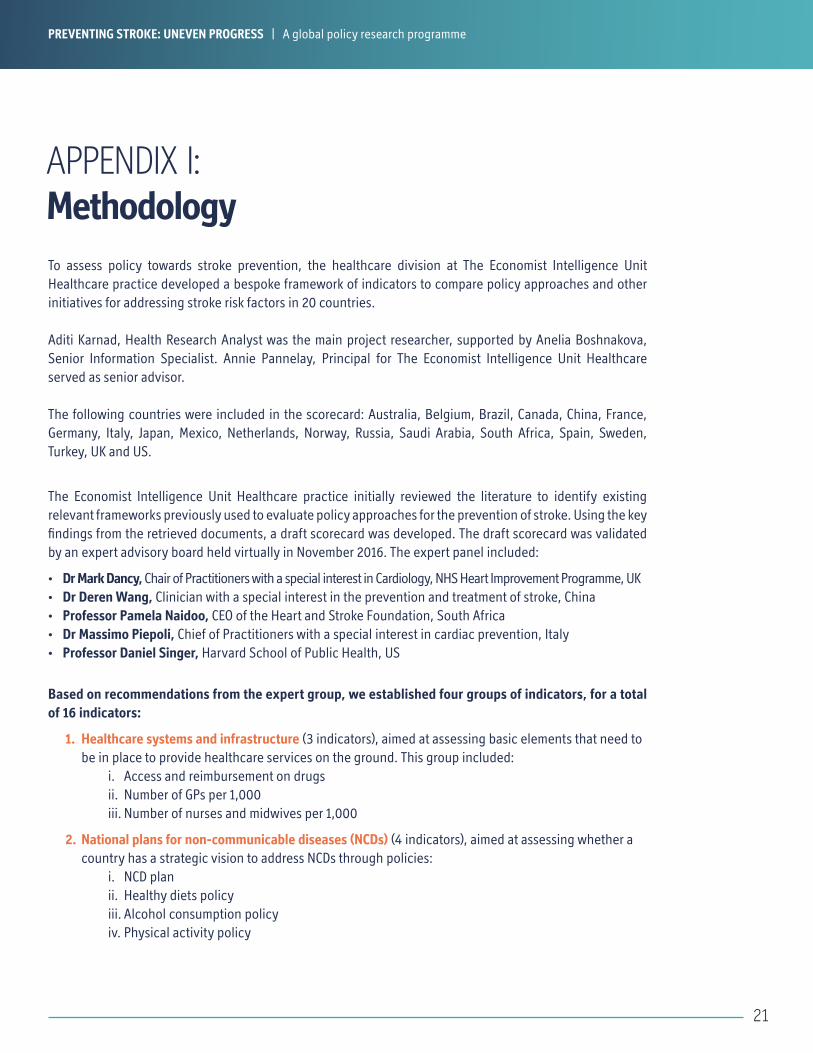
APPENDIX I: MethodologyTo assess policy towards stroke prevention, the healthcare division at The Economist Intelligence Unit Healthcare practice developed a bespoke framework of indicators to compare policy approaches and other initiatives for addressing stroke risk factors in 20 countries.
Aditi Karnad, Health Research Analyst was the main project researcher, supported by Anelia Boshnakova, Senior Information Specialist. Annie Pannelay, Principal for The Economist Intelligence Unit Healthcare served as senior advisor.
The following countries were included in the scorecard: Australia, Belgium, Brazil, Canada, China, France, Germany, Italy, Japan, Mexico, Netherlands, Norway, Russia, Saudi Arabia, South Africa, Spain, Sweden, Turkey, UK and US.
The Economist Intelligence Unit Healthcare practice initially reviewed the literature to identify existing relevant frameworks previously used to evaluate policy approaches for the prevention of stroke. Using the key findings from the retrieved documents, a draft scorecard was developed. The draft scorecard was validated by an expert advisory board held virtually in November 2016. The expert panel included:
• Dr Mark Dancy, Chair of Practitioners with a special interest in Cardiology, NHS Heart Improvement Programme, UK• Dr Deren Wang, Clinician with a special interest in the prevention and treatment of stroke, China• Professor Pamela Naidoo, CEO of the Heart and Stroke Foundation, South Africa• Dr Massimo Piepoli, Chief of Practitioners with a special interest in cardiac prevention, Italy• Professor Daniel Singer, Harvard School of Public Health, US
Based on recommendations from the expert group, we established four groups of indicators, for a total of 16 indicators:
1. Healthcare systems and infrastructure (3 indicators), aimed at assessing basic elements that need to be in place to provide healthcare services on the ground. This group included:
i. Access and reimbursement on drugsii. Number of GPs per 1,000iii. Number of nurses and midwives per 1,000
2. National plans for non-communicable diseases (NCDs) (4 indicators), aimed at assessing whether a country has a strategic vision to address NCDs through policies:
i. NCD planii. Healthy diets policyiii. Alcohol consumption policyiv. Physical activity policy
PREVENTING STROKE: UNEVEN PROGRESS | A global policy research programme
22
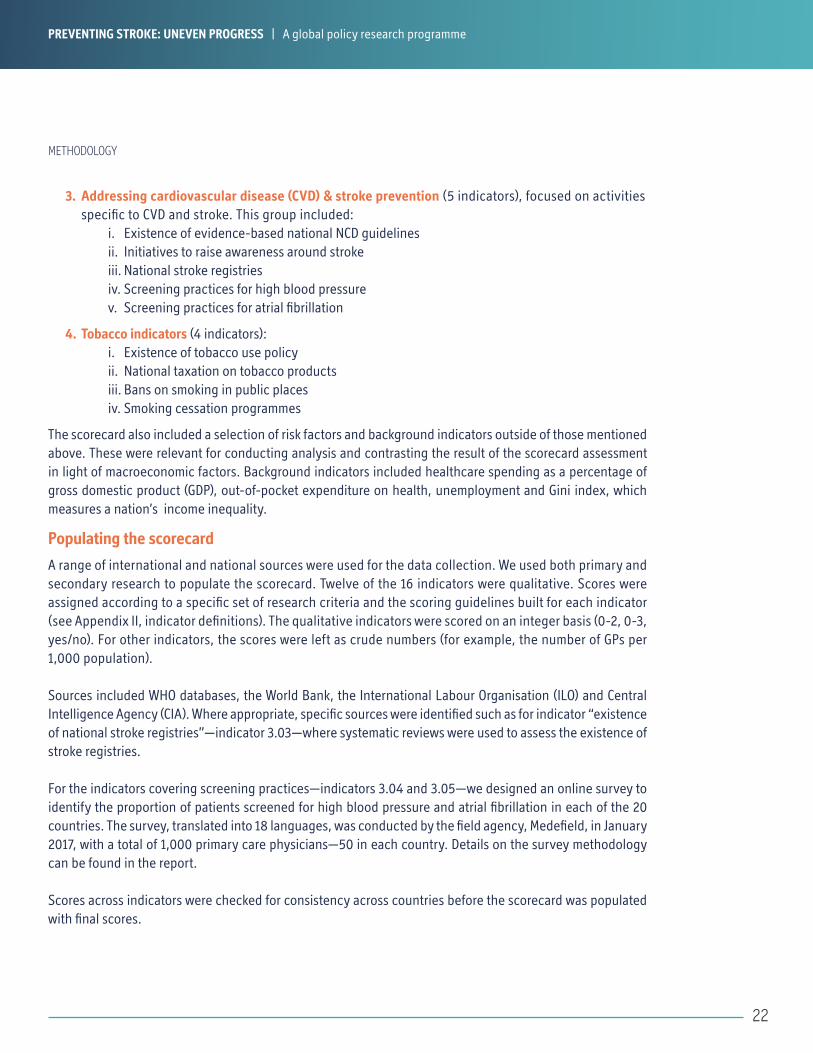
3. Addressing cardiovascular disease (CVD) & stroke prevention (5 indicators), focused on activities specific to CVD and stroke. This group included:
i. Existence of evidence-based national NCD guidelinesii. Initiatives to raise awareness around strokeiii. National stroke registriesiv. Screening practices for high blood pressurev. Screening practices for atrial fibrillation
4. Tobacco indicators (4 indicators):i. Existence of tobacco use policyii. National taxation on tobacco products iii. Bans on smoking in public placesiv. Smoking cessation programmes
The scorecard also included a selection of risk factors and background indicators outside of those mentioned above. These were relevant for conducting analysis and contrasting the result of the scorecard assessment in light of macroeconomic factors. Background indicators included healthcare spending as a percentage of gross domestic product (GDP), out-of-pocket expenditure on health, unemployment and Gini index, which measures a nation’s income inequality.
METHODOLOGY
A range of international and national sources were used for the data collection. We used both primary and secondary research to populate the scorecard. Twelve of the 16 indicators were qualitative. Scores were assigned according to a specific set of research criteria and the scoring guidelines built for each indicator (see Appendix II, indicator definitions). The qualitative indicators were scored on an integer basis (0-2, 0-3, yes/no). For other indicators, the scores were left as crude numbers (for example, the number of GPs per 1,000 population).
Sources included WHO databases, the World Bank, the International Labour Organisation (ILO) and Central Intelligence Agency (CIA). Where appropriate, specific sources were identified such as for indicator “existence of national stroke registries”—indicator 3.03—where systematic reviews were used to assess the existence of stroke registries.
For the indicators covering screening practices—indicators 3.04 and 3.05—we designed an online survey to identify the proportion of patients screened for high blood pressure and atrial fibrillation in each of the 20 countries. The survey, translated into 18 languages, was conducted by the field agency, Medefield, in January 2017, with a total of 1,000 primary care physicians—50 in each country. Details on the survey methodology can be found in the report.
Scores across indicators were checked for consistency across countries before the scorecard was populated with final scores.
Populating the scorecard
PREVENTING STROKE: UNEVEN PROGRESS | A global policy research programme
23
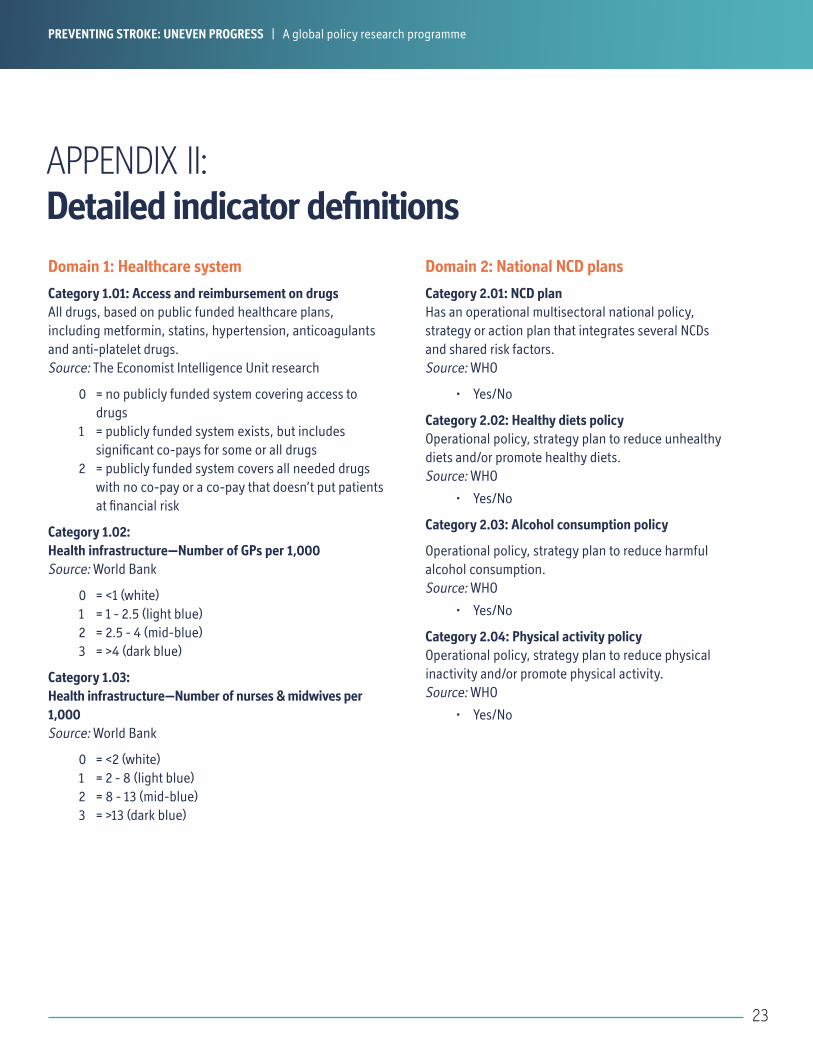
APPENDIX II: Detailed indicator definitionsDomain 1: Healthcare system
Category 1.01: Access and reimbursement on drugs All drugs, based on public funded healthcare plans, including metformin, statins, hypertension, anticoagulants and anti-platelet drugs. Source: The Economist Intelligence Unit research
0 = no publicly funded system covering access to drugs
1 = publicly funded system exists, but includes significant co-pays for some or all drugs
2 = publicly funded system covers all needed drugs with no co-pay or a co-pay that doesn’t put patients at financial risk
Category 1.02: Health infrastructure—Number of GPs per 1,000Source: World Bank
0 = <1 (white)1 = 1 - 2.5 (light blue)2 = 2.5 - 4 (mid-blue)3 = >4 (dark blue)
Category 1.03: Health infrastructure—Number of nurses & midwives per 1,000Source: World Bank
0 = <2 (white)1 = 2 - 8 (light blue)2 = 8 - 13 (mid-blue)3 = >13 (dark blue)
Domain 2: National NCD plans
Category 2.01: NCD plan Has an operational multisectoral national policy, strategy or action plan that integrates several NCDs and shared risk factors. Source: WHO
• Yes/No
Category 2.02: Healthy diets policy Operational policy, strategy plan to reduce unhealthy diets and/or promote healthy diets. Source: WHO
• Yes/No
Category 2.03: Alcohol consumption policy
Operational policy, strategy plan to reduce harmful alcohol consumption. Source: WHO
• Yes/No
Category 2.04: Physical activity policy Operational policy, strategy plan to reduce physical inactivity and/or promote physical activity. Source: WHO
• Yes/No
PREVENTING STROKE: UNEVEN PROGRESS | A global policy research programme
24
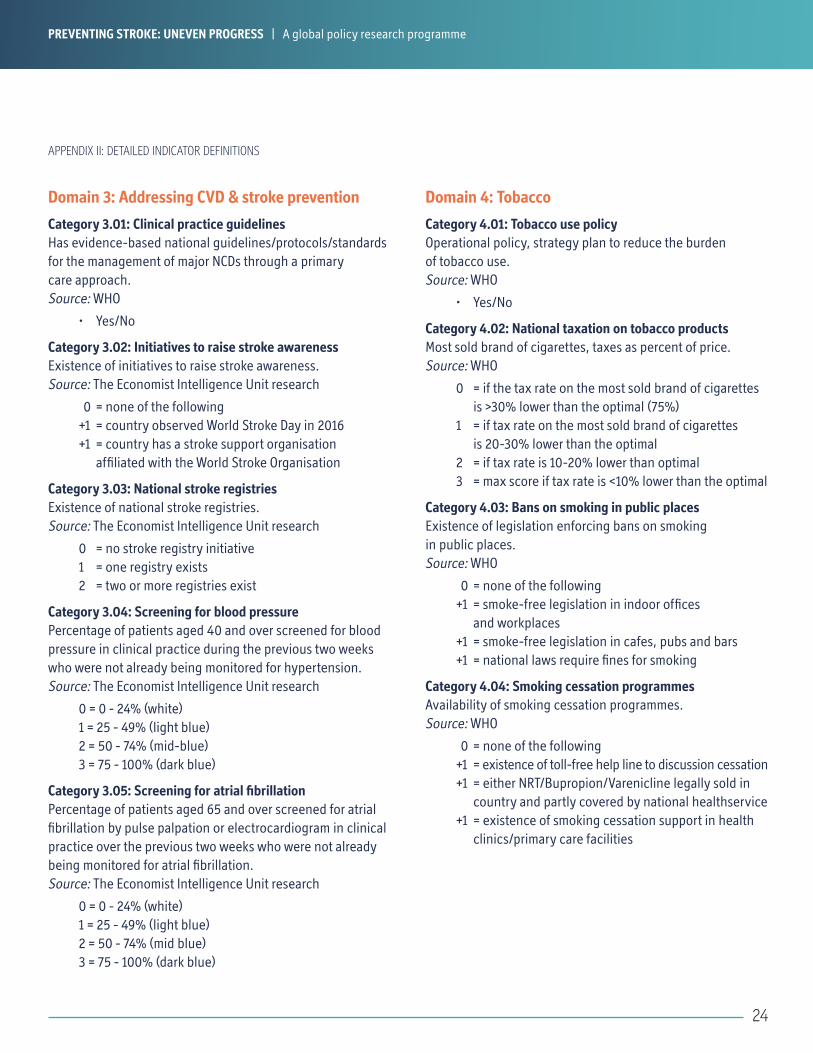
Domain 3: Addressing CVD & stroke prevention
Category 3.01: Clinical practice guidelines Has evidence-based national guidelines/protocols/standards for the management of major NCDs through a primary care approach. Source: WHO
• Yes/No
Category 3.02: Initiatives to raise stroke awareness Existence of initiatives to raise stroke awareness. Source: The Economist Intelligence Unit research
0 = none of the following+1 = country observed World Stroke Day in 2016+1 = country has a stroke support organisation
affiliated with the World Stroke Organisation
Category 3.03: National stroke registries Existence of national stroke registries. Source: The Economist Intelligence Unit research
0 = no stroke registry initiative1 = one registry exists2 = two or more registries exist
Category 3.04: Screening for blood pressure Percentage of patients aged 40 and over screened for blood pressure in clinical practice during the previous two weeks who were not already being monitored for hypertension. Source: The Economist Intelligence Unit research
0 = 0 - 24% (white)1 = 25 - 49% (light blue)2 = 50 - 74% (mid-blue)3 = 75 - 100% (dark blue)
Category 3.05: Screening for atrial fibrillation Percentage of patients aged 65 and over screened for atrial fibrillation by pulse palpation or electrocardiogram in clinical practice over the previous two weeks who were not already being monitored for atrial fibrillation. Source: The Economist Intelligence Unit research
0 = 0 - 24% (white)1 = 25 - 49% (light blue)2 = 50 - 74% (mid blue)3 = 75 - 100% (dark blue)
Domain 4: Tobacco
Category 4.01: Tobacco use policy Operational policy, strategy plan to reduce the burden of tobacco use. Source: WHO
• Yes/No
Category 4.02: National taxation on tobacco products Most sold brand of cigarettes, taxes as percent of price. Source: WHO
0 = if the tax rate on the most sold brand of cigarettes is >30% lower than the optimal (75%)
1 = if tax rate on the most sold brand of cigarettes is 20-30% lower than the optimal
2 = if tax rate is 10-20% lower than optimal3 = max score if tax rate is <10% lower than the optimal
Category 4.03: Bans on smoking in public places Existence of legislation enforcing bans on smoking in public places. Source: WHO
0 = none of the following+1 = smoke-free legislation in indoor offices
and workplaces+1 = smoke-free legislation in cafes, pubs and bars+1 = national laws require fines for smoking
Category 4.04: Smoking cessation programmes Availability of smoking cessation programmes. Source: WHO
0 = none of the following+1 = existence of toll-free help line to discussion cessation+1 = either NRT/Bupropion/Varenicline legally sold in
country and partly covered by national healthservice+1 = existence of smoking cessation support in health
clinics/primary care facilities
APPENDIX II: DETAILED INDICATOR DEFINITIONS
PREVENTING STROKE: UNEVEN PROGRESS | A global policy research programme

25
Uni
tSource Au
stra
lia
Belg
ium
Braz
il
Cana
da
Chin
a
Fran
ce
Germ
any
Italy
Japa
n
Mex
ico
Net
herla
nds
Nor
way
Russ
ia
Saud
i Ara
bia
Sout
h Af
rica
Spai
n
Swed
en
Turk
ey
UK
US
Healthcare system and infrastructure
1.01 Access and reimbursement on drugs* 0-2 EIU research 2 2 1 1 1 2 2 2 2 1 2 2 1 1 2 2 2 1 2 1
1.02 Number of GPs per 1,000 World Bank 3.3 3 1.9 2.1 1.5 3.4 3.8 4.1 1.7 2.1 2.5 3.7 4.1 2.5 0.8 4.9 3.9 1.7 2.8 2.5
1.03 Number of nurses & midwives per 1,000 World Bank 10.6 14.9 3.8 9.3 1.7 9.3 11.5 6.9 11.8 2.5 15.1 13.4 8.5 4.8 4.7 5.8 11.9 2.4 9.5 9.4
National NCD plans
2.01 NCD Plan Y/N WHO Y Y Y Y Y Y N Y Y N Y Y Y Y N N N N Y Y
2.02 Healthy diets policy Y/N WHO Y Y Y Y Y Y Y Y Y Y Y Y Y Y Y Y Y Y Y Y
2.03 Alcohol consumption policy Y/N WHO Y Y Y Y Y Y Y Y Y Y Y Y Y N Y Y Y N Y Y
2.04 Physical activity policy Y/N WHO Y Y Y Y Y Y Y Y Y Y Y Y Y Y Y Y Y Y Y Y
Addressing CVD & stroke prevention
3.01 Evidence-based national NCD guidelines Y/N WHO N DK Y Y Y — Y N Y Y Y Y Y Y Y Y N N Y N
3.02 Initiatives to raise stroke awareness* 0-2 EIU research 2 1 1 2 1 0 0 2 1 1 0 0 0 1 2 0 0 0 2 2
3.03 National stroke registries* 0-2 EIU research 1 0 0 1 1 0 1 0 1 2 0 0 1 P 0 0 1 0 2 2
3.04 Screening for blood pressure* % EIU research 27 28 33 23 19 30 16 14 26 18 10 19 23 13 44 8 22 13 11 58
3.05 Screening for atrial fibrillation* % EIU research 11 12 26 13 36 15 13 17 9 10 5 18 42 11 14 12 19 13 8 15
Tobacco
4.01 Tobacco use policy Y/N WHO Y Y Y Y Y Y Y Y Y Y Y Y Y Y Y Y Y Y Y Y
4.02 National taxation on tobacco products (% of price, total tax) 0-3 WHO 2 3 2 3 0 3 3 3 2 3 3 3 1 0 1 3 3 3 3 0
4.03 Bans on smoking in public places 0-3 Tobacco in Australia 2 3 3 2 0 3 1 3 0 3 1 2 3 3 1 3 0 3 3 0
4.04 Smoking cessation programmes 0-3 WHO 3 3 3 3 2 2 2 2 2 3 3 3 2 2 0 1 2 3 3 3
Epidemiology—risk factors
5.01 Stroke mortality—no. of deaths per 100,000 Global Burden of Disease Study 61.3 83.8 69.3 49.6 136.9 73.1 90.7 119.8 133.1 31.5 64.7 67.9 257.2 22.8 68.8 74.5 89.0 41.7 82.5 50.8
5.02 Stroke morbidity—DALYs lost per 1,000 WHO 3 4 11 3 12 3 4 4 5 4 4 3 19 4 11 3 3 13 4 4
5.03 AF prevalence (age standardised % of population for all age groups)
Global Burden of Disease Study 693 915 258 1,047 455 1,275 1,482 1,293 703 215 1,730 2,012 860 136 167 1,474 1,942 248 1,344 1,824
5.04 Diabetes (age standardised % of population 20-79 years) % World Bank 5.1 5.1 10.4 7.4 9.8 5.3 7.4 5.1 5.7 15.8 5.5 6.0 9.2 20.0 7.6 7.7 4.7 12.8 4.7 10.8
5.05 Tobacco (age standardised % of population 15+ years) % World Bank 15.8 23.0 14.7 16.1 28.1 34.1 24.5 19.5 19.3 19.9 26.2 22.4 59.0 27.9 31.4 31.3 20.4 39.5 19.9 19.5
5.06 Raised blood pressure (age standardised % of population 18+ years) % WHO 21.4 24.9 30.8 17.4 27.3 27.7 31.5 31.1 26.7 22.8 27.5 33.0 37.8 24.2 33.7 27.0 30.8 22.0 27.7 18.0
5.07 Total raised cholesterol (age standardised % of population 25+ years) % WHO 55.2 62.4 44.2 53.4 33.4 62.0 65.6 62.2 57.1 50.7 60.5 61.9 50.6 39.0 35.5 56.1 51.8 39.7 63.4 53.8
5.08 Obesity (age standardised % of population 18+ years) % WHO 26.8 22.1 18.8 26.2 5.7 18.2 25.1 19.8 5.0 32.1 18.8 21.5 26.5 33.0 31.3 26.6 18.6 27.8 26.9 33.0
5.09 Total alcohol per capita consumption (litres) WHO 12.2 11.0 8.7 10.2 6.7 12.2 11.8 6.7 7.2 7.2 9.9 7.7 15.1 0.2 11 11.2 9.2 2.0 11.6 9.2
Background indicators
6.01 Healthcare spending (% of GDP) % World Bank 9.4 10.6 8.3 10.4 5.5 11.5 11.3 9.2 10.2 6.3 10.9 9.7 7.1 4.7 8.8 9.0 11.9 5.4 9.1 17.1
6.02 Out-of-pocket health expenditure (% of total expenditure on health) % World Bank 18.8 17.8 25.5 13.6 32.0 6.3 13.2 21.2 13.9 44.0 5.2 13.6 45.8 14.3 6.5 24.0 14.1 17.8 9.7 11.0
6.03 Unemployment (% of total labour force ) % International Labor Organisation 6.0 8.5 6.8 6.9 4.7 9.9 5.0 12.5 3.7 4.9 6.9 3.4 5.1 5.6 25.1 24.7 8.0 9.2 6.3 6.2
6.04 Gini Index CIA 30.3 25.9 51.9 32.1 46.9 31.0 27.0 31.9 37.9 48.3 25.1 26.8 42.0 45.9 62.5 35.9 24.0 40.2 32.4 45.0
DK Don’t knowP Possible— No response
PREVENTING STROKE: UNEVEN PROGRESS | A global policy research programme
APPENDIX III: Scorecard

26
APPENDIX IV: References1. J Adamson, A Beswick, S Ebrahim. (2004). Is Stroke the Most Common Cause of Disability? Journal of Stroke and Cerebrovascular Diseases. 2004;13(4):171-7.
http://dx.doi.org/10.1016/j.jstrokecerebrovasdis.2004.06.003
2. National Stroke Association. Preventing a Stroke. (2016). http://www.stroke.org/understand-stroke/preventing-stroke. Accessed July, 2017.
3. The Stroke Association. State of the Nation: stroke statistics. (2017). https://www.stroke.org.uk/sites/default/files/state_of_the_nation_2017_final_1.pdf. Accessed July, 2017.
4. V L Feigin, MH Forouzanfar, R Krishnamurthi, et al. (2013). Global and regional burden of stroke during 1990-2010: findings from the Global Burden of Disease Study 2010. Lancet. 2013;383(9913):245-255. http://dx.doi.org/10.1016/S0140-6736(13)61953-4
5. World Health Organization. (2017). The top 10 causes of death. http://www.who.int/mediacentre/factsheets/fs310/en/. Accessed July, 2017.
6. A Di Carlo. (2009). Human and economic burden of stroke. Age and Ageing. 2009;38(1):4-5. https://doi.org/10.1093/ageing/afn282
7. I Lekander, C Willers, M von Euler, M Lilja, K S Sunnerhagen, H Pessah-Rasmussen, et al. (2017). Relationship between functional disability and costs one and two years post-stroke. PLoS ONE. 2017;12(4):e0174861. https://doi.org/10.1371/journal.pone.0174861
8. E Stevens, E Emmett, Y Wang, C McKevitt, C D Wolfe. (2017). The Burden of Stroke in Europe. http://www.strokeeurope.eu/downloads/TheBurdenOfStrokeInEuropeReport.pdf. Accessed July, 2017.
9. American Heart Association. (2015). Risk factors for stroke. https://www.strokeassociation.org/idc/groups/stroke-public/@wcm/@hcm/documents/downloadable/ucm_309713.pdf. Accessed July, 2017.
10. The American Heart Association. Types of Stroke. http://www.strokeassociation.org/STROKEORG/AboutStroke/TypesofStroke/Types-of-Stroke_UCM_308531_SubHomePage.jsp
11. A Bhalla, Y Wang, A Rudd, C D Wolfe. (2013). Differences in outcome and predictors between ischemic and intracerebral haemorrhage: the South London Stroke Register. Stroke. 2013;44:2174-2181. https://doi.org/10.1161/STROKEAHA.113.001263
12. American Heart Association. Types of Stroke - TIA (Transient Ischemic Attack). http://www.strokeassociation.org/STROKEORG/AboutStroke/TypesofStroke/TIA/Transient-Ischemic-Attack-TIA_UCM_492003_SubHomePage.jsp. Accessed July, 2017.
13. World Federation of Neurology. (2017). Stroke in ICD-11: the end of a long exile. https://www.wfneurology.org/2017-06-17-wfn-stroke-in-icd-11. Accessed July, 2017.
14. Mayo Clinic. Stroke symptoms and causes. (2017). http://www.mayoclinic.org/diseases-conditions/stroke/symptoms-causes/dxc-20117265. Accessed July, 2017.
15. M J O’Donnell, SL Chin, S Rangarajan, et al. (2016). Global and regional effects of potentially modifiable risk factors associated with acute stroke in 32 countries (INTERSTROKE): a case-control study. Lancet. 2016;388(10046):761-75. http://dx.doi.org/10.1016/S0140-6736(16)30506-2
16. World Health Organization. (2006). The World Health Report 2006: Working together for health. http://www.who.int/whr/2006/en/. Accessed July, 2017.
17. V I Feigin, B Norrving, M G George, et al. (2016). Prevention of stroke: a strategic global imperative, Neurology. Nature Reviews Neurology, 2016;12:501–512. http://dx.doi.org/10.1038/nrneurol.2016.107
18. World Health Organization. (2005). Preventing chronic diseases: a vital investment. http://www.who.int/chp/chronic_disease_report/en/. Accessed July, 2017.
19. R S Shah, J W Cole. (2017) “Smoking and Stroke: The More You Smoke the More You Stroke.” Expert review of cardiovascular therapy. 2010;8(7):917-932. http://dx.doi.org/10.1586/erc.10.56
20. World Health Organization. (2017). Tobacco Fact Sheet. http://www.who.int/mediacentre/factsheets/fs339/en/. Accessed July, 2017.
21. Centers for Disease Control and Prevention. National Center for Health Statistics. (2016). Current Smoking. https://www.cdc.gov/nchs/data/nhis/earlyrelease/earlyrelease201605_08.pdf. Accessed July, 2017.
22. Euromonitor. (2014). Tobacco in Western Europe.http://www.euromonitor.com/tobacco-in-western-europe/report. Accessed July, 2017.
23. W Zatonski, K Przewozniak, U Sulkowska, R West, A Wojtyła. (2012). Tobacco smoking in countries of the European Union. Ann Agric Environ Med. 2012;19(2):181-192.
PREVENTING STROKE: UNEVEN PROGRESS | A global policy research programme

27
24. WHO MONICA Project Investigators. The World Health Organization MONICA Project (Monitoring trends and determinants in cardiovascular disease). Journal of Clinical Epidemiology. 1988;41:105-114.
25. World Health Organization. MPOWER IN ACTION Defeating the global tobacco epidemic. (2013). http://www.who.int/tobacco/mpower/publications/mpower_2013.pdf?ua=1. Accessed July, 2017.
26. S Gravely, G A Giovino, L Craig, et al. (2017). Implementation of key demand-reduction measures of the WHO Framework Convention on Tobacco Control and change in smoking prevalence in 126 countries: an association study. Lancet Public Health. 2017;2(4):e166-e174. http://dx.doi.org/10.1016/S2468-2667(17)30045-2
27. Tax Foundation. (2014). State Cigarette Tax Rates in 2014. https://taxfoundation.org/state-cigarette-tax-rates-2014/. Accessed July, 2017.
28. M Öberg, M S Jaakkola, A Woodward, et al. (2010) Worldwide burden of disease from exposure to second-hand smoke: a retrospective analysis of data from 192 countries. Lancet. 2011;377(9760):139–46. http://dx.doi.org/10.1016/S0140-6736(10)61388-8
29. World Health Organization. (2013). WHO Report on the Global Tobacco Epidemic. Appendix IX—Tobacco taxes and prices. http://www.who.int/tobacco/global_report/2015/appendix2.pdf?ua=1. Accessed July, 2017.
30. World Bank. (1999). Curbing the epidemic: Governments and the economics of tobacco control. Washington. Accessed July, 2017.
31. World Health Organization. (2004). WHO European strategy for smoking cessation policy. http://www.euro.who.int/__data/assets/pdf_file/0017/68111/E80056.pdf?ua=1. Accessed July, 2017.
32. K Nilan, M Raw, T M McKeever, R L Murray, A. McNeill. (2017). Progress in implementation of WHO FCTC Article 14 and its guidelines: A survey of tobacco dependence treatment provision in 142 countries. Addiction. http://dx.doi.org/10.1111/add.13903
33. World Health Organization / Europe. (2017). Implementation of the WHO FCTC. http://www.euro.who.int/en/health-topics/disease-prevention/tobacco/policy/who-framework-convention-on-tobacco-control-who-fctc/implementation-of-the-who-fctc. Accessed July, 2017.
34. MDCalc. CHADS2 Score for Atrial Fibrillation Stroke Risk. https://www.mdcalc.com/chads2-score-atrial-fibrillation-stroke-risk. Accessed July, 2017.
35. American Heart Association. (2008). Tissue Plasminogen Activator (tPA) What You Should Know. http://www.strokeassociation.org/idc/groups/stroke-public/@wcm/@hcm/@gwtg/documents/downloadable/ucm_430859.pdf. Accessed July, 2017.
36. Heart & Stroke Foundation of Canada. Stroke Medications. https://www.heartandstroke.ca/stroke/treatments/medications. Accessed July, 2017.
37. J Bryan. (2014). The rise and fall of the clot buster: A review on the history of Streptokinase. The Pharmaceutical Journal. http://www.pharmaceutical-journal.com/news-and-analysis/features/the-rise-and-fall-of-the-clot-buster-a-review-on-the-history-of-streptokinase/20065679.article. Accessed July, 2017.
38. Centers for Disease Control and Prevention. (2017). Stroke Signs and Symptoms. https://www.cdc.gov/stroke/signs_ symptoms.htm. Accessed July, 2017.
39. S Holding, C Russell, K Tyndall. (2013). Atrial fibrillation 1: opportunistic screening for atrial fibrillation. Nursing Times. 2013;109:30,12-15.
40. National Stroke Association. (2012). High blood pressure and stroke. https://www.stroke.org.uk/sites/default/files/high_blood_pressure_and_stroke.pdf. Accessed July, 2017.
41. Heart Rhythm Alliance. AF-related stroke. http://www.heartrhythmalliance.org/afa/uk/af-related-stroke . Accessed July, 2017.
42. T J Bungard, W A Ghali, K K Teo KK, et al. (2000). Why do patients with atrial fibrillation not receive warfarin? Archives of Internal Medicine, 2000;160:41-6. http://dx.doi.org/10.1001/archinte.160.1.41
43. RG Hart, LA Pearce, MI Aguilar. (2007). Meta-analysis: antithrombotic therapy to prevent stroke in patients who have nonvalvular atrial fibrillation. Annals of Internal Medicine. 2017;146:857-67.
44. CT Ruff, RP Giugliano, E Braunwald, et al. (2014). Comparison of the efficacy and safety of new oral anticoagulants with warfarin in patients with atrial fibrillation: a meta-analysis of randomised trials. Lancet. 2014;383:955-62. http://dx.doi.org/10.1016/S0140-6736(13)62343-0
45. B Freedman, J Camm, H Calkins, et al. (2017). Screening for Atrial Fibrillation, A Report of the AF-SCREEN International Collaboration. Circulation. 2017;135(19):1851-1867. http://dx.doi.org/ 10.1161/CIRCULATIONAHA.116.026693
46. P Chan, C Wong, Y C Poh, et al. (2016). Diagnostic Performance of a Smartphone-Based Photoplethysmographic Application for Atrial Fibrillation Screening in a Primary Care Setting. Journal of the American Heart Association. 2016;5(7):e003428. http://dx.doi.org/10.1161/JAHA.116.003428
47. B Freedman. (2016). Screening for Atrial Fibrillation Using a Smartphone: Is There an App for That? Journal of the American Heart Association. 2016;5(7)pii: e004000. https://doi.org/10.1161/JAHA.116.004000
APPENDIX IV: REFERENCES
PREVENTING STROKE: UNEVEN PROGRESS | A global policy research programme

London20 Cabot SquareLondonE14 4QWUnited KingdomTel: (44.20) 7576 8000Fax: (44.20) 7576 8476E-mail: [email protected]
New York750 Third Avenue5th FloorNew York, NY 10017United StatesTel: (1.212) 554 0600Fax: (1.212) 586 0248E-mail: [email protected]
Hong Kong1301 Cityplaza Four12 Taikoo Wan RoadTaikoo ShingHong KongTel: (852) 2585 3888Fax: (852) 2802 7638E-mail: [email protected]
GenevaBoulevard desTranchées 161206 GenevaSwitzerlandTel: (41) 22 566 2470Fax: (41) 22 346 93 47E-mail: [email protected]
Whilst every effort has been taken to verify the accuracy of thisinformation, neither The Economist Intelligence Unit Ltd. nor thesponsor of this report can accept any responsibility or liabilityfor reliance by any person on this white paper or any of theinformation, opinions or conclusions set out in the white paper.
© The Economist Intelligence Unit Limited 2017