prevention of atherosclerosis by bioactive palmitoleate
TRANSCRIPT

R E S EARCH ART I C L E
ATHEROSCLEROS I S
http://stm.scie
Dow
nloaded from
Prevention of atherosclerosis by bioactive palmitoleatethrough suppression of organelle stress andinflammasome activationIsmail Çimen,1,2 Begüm Kocatürk,1,2 Seda Koyuncu,1* Özlem Tufanlı,1,2 Umut I. Onat,1,2
Asli D. Yıldırım,1,2 Onur Apaydın,1,2 Şeyma Demirsoy,1† Zaliha G. Aykut,1 Uyen T. Nguyen,3
Steven M. Watkins,3 Gökhan S. Hotamışlıgil,4 Ebru Erbay1,2‡
De novo lipogenesis (DNL), the conversion of glucose and other substrates to lipids, is often associated withectopic lipid accumulation, metabolic stress, and insulin resistance, especially in the liver. However, organ-specificDNL can also generate distinct lipids with beneficial metabolic bioactivity, prompting a great interest in their use forthe treatment of metabolic diseases. Palmitoleate (PAO), one such bioactive lipid, regulates lipid metabolism in liverand improves glucose utilization in skeletal muscle when it is generated de novo from the obese adipose tissue. Weshow that PAO treatment evokes an overall lipidomic remodeling of the endoplasmic reticulum (ER) membranesin macrophages and mouse tissues, which is associated with resistance of the ER to hyperlipidemic stress. Bypreventing ER stress, PAO blocks lipid-induced inflammasome activation in mouse and human macrophages.Chronic PAO supplementation also lowers systemic interleukin-1b (IL-1b) and IL-18 concentrations in vivo inhyperlipidemic mice. Moreover, PAO prevents macrophage ER stress and IL-1b production in atheroscleroticplaques in vivo, resulting in a marked reduction in plaque macrophages and protection against atherosclerosisin mice. These findings demonstrate that oral supplementation with a product of DNL such as PAO can promotemembrane remodeling associated with metabolic resilience of intracellular organelles to lipid stress and limit theprogression of atherosclerosis. These findings support therapeutic PAO supplementation as a potential preventiveapproach against complex metabolic and inflammatory diseases such as atherosclerosis, which warrants furtherstudies in humans.
ncem
on September 30, 2016ag.org/
INTRODUCTION
Fatty acids (FAs) can be generated de novo from a surplus of carbohy-drates and other substrates in lipogenic organs. These lipids are thenreleased as very low density lipoprotein (VLDL) particles from the liverand stored as triglycerides (TAGs) in the adipose tissue until furtherneed (1). Although diet is usually a sufficient source of FA formammals,de novo lipogenesis (DNL) is essential during development, as exempli-fied by the embryonic lethality of geneticmousemodels lacking keyDNLenzymes, such as FA synthase and acetyl–coenzyme A carboxylase 1.Furthermore, a maternal fat-rich diet does not rescue the lethality, sug-gesting that certain structural or signaling lipid molecules essential forembryonic development can only be generated de novo (2–4). Recentstudies have shown that several bioactive lipid species are produced byDNL, including endogenous ligands for nuclear receptors [1-palmitoyl-2-oleoyl-sn-glycerol-3-phosphocoline and 1-stearoyl-2-oleoyl-sn-glycerol-3-phosphocoline, peroxisome proliferator–activated receptora (PPARa) and alkyl ether lipids, and PPARg], fatty acid–hydroxy fattyacids (FAHFAs), and palmitoleate (PAO), which have specificbiological activities and exert potent metabolic effects (5–9).
1Department of Molecular Biology and Genetics, Bilkent University, Ankara 06800,Turkey. 2National Nanotechnology Research Center, Bilkent University, Ankara06800, Turkey. 3Metabolon, Sacramento, CA 95691, USA. 4Department of Geneticsand Complex Diseases and Sabri Ülker Center, Harvard T.H. Chan School of Public Health,Boston, MA 02115, USA.*Present address: Department of Cellular and Molecular Medicine, Katholieke UniversiteitLeuven, Leuven 3000, Belgium.†Present address: CECAD Cluster of Excellence: Cellular Stress Responses in Aging-Associated Diseases, University of Cologne, Cologne 50931, Germany.‡Corresponding author. Email: [email protected]
www.ScienceTra
One striking observation regarding the biological impact of DNL-generated lipids was made in snakes. PAO concentrations spike in theplasma of Burmese pythons that are going through an extrememetabolicadaptation to a large meal after long periods of starvation. Palmitoleicacid ethanolamide (palmitoleoyl ethanolamide), a potent regulator ofenergy balance, is markedly increased in the fed pythons’ gastrointestinaltract. During this adaptation, the pythons undergo remarkable organgrowth, including a particularly striking increase in cardiac size. On theother hand, administration of a lipidmix that includes PAO can promotehealthy heart growth in a physiological setting (10). Together, thesefindings suggest a surprising beneficial metabolic impact of a mono-unsaturated fatty acid (MUFA), PAO, previously not associated with anydistinct biological function.
Adipose tissue DNL and PAO production is also activated in fattyacid–binding protein (FABP)–deficient mice, which are highly resistantto developing insulin resistance and atherosclerosis despite developingobesity and dyslipidemia on a high-fat diet (7, 11–15). Liver is theprimary site for FA synthesis. Adipose tissue DNL is usually inactive,and the lipid composition at this site reliably reflects dietary lipidinput (16). However, adipose tissue from FABP-deficientmice becomesrefractory to dietary input and activates DNL to generate its own FAfrom glucose (7, 17, 18). PAO generated from the adipose tissue canhave regulatory effects on lipidmetabolism in liver and improve glucoseutilization in skeletal muscle (7, 17, 18). Hence, PAO is considered tobe a lipokine, a lipid signal serving at the adipose tissue–liver and adi-pose tissue–muscle axes. Additionally, exogenous PAO administrationhas favorable metabolic and anti-inflammatory effects in mice, sheep,and rats (19–22).
nslationalMedicine.org 28 September 2016 Vol 8 Issue 358 358ra126 1

R E S EARCH ART I C L E
on September 30, 2016
http://stm.sciencem
ag.org/D
ownloaded from
Interpretation of association studies to translate these preclinicalfindings to humans has been challenging because PAO is generated inthe setting of obesity and alongside hepatic DNL. Because hepatic DNLassociates with ectopic lipid accumulation and insulin resistance, the risein PAO in serum has been associated with metabolic disorder (23–25).The coupling of liver DNL to PAO production in obesity may be anadaptation to help offset the hazardous effects of excess intake ofsaturated lipids (such as on membranes and membrane-initiatedsignaling) (11, 26, 27). Another complication in the analysis of theseepidemiological studies is that PAO concentrations were measuredfrom different lipid classes. For example, PAO in the nonesterified fattyacid (NEFA) fraction shows a positive correlation with insulin sensitiv-ity, whereas esterified PAO in cholesterol ester (CE), diacylglycerol(DAG), and TAG correlates with fatty liver disease, insulin resistance,diabetes, and acute coronary disease (23, 24, 28–30). In humans, cir-culating esterified PAO concentration mainly reflects hepatic DNL(31, 32). These seemingly discrepant results imply that the free formof PAO could have distinct bioactivity in humans, similar to mice (7).Mouse studies using an exogenous source of PAO (independent ofhepatic DNL) provide valuable insight into PAO’s biological impact,including enhanced insulin sensitivity, reduced inflammation, andimproved lipid metabolism (7, 21, 22, 33–35). In a recent randomized,controlled trial in humans, purified PAO treatment markedly reducedhigh-sensitivity C-reactive protein and improved serum lipids, suggestingthat PAO supplementation may have a beneficial impact on athero-sclerosis (36). However, these correlations do not establish causalityor accurately reflect the real biological function of PAO in cardiovasculardisease, warranting a direct analysis of the effect of PAO supplementationin a model of atherosclerosis.
Atherosclerosis is a chronic inflammatory disease of the arterialwall induced by lipid imbalance and a maladaptive immune system(37–39). The immune system plays a crucial role in the development ofplaques in the intima, progression, and predisposition to rupture (40–42).The activation of the Nod-like receptor (NLR) family, pyrin domaincontaining-3 (NLRP3) inflammasome, a multiprotein complex in themyeloid linage that plays an important role in the innate immuneresponse to pathogens, can be induced by cholesterol crystals or saturatedFA (SFA) and promote atherogenesis (43, 44). The inflammasome isassembled from NACHT, LRR, and PYD domains–containing protein(NALP), apoptosis-associated speck-like protein containing a caspase-1 recruitment domain (ASC), and caspase-1.Upon its activation, caspase-1 processes pro–interleukin-1b (pro–IL-1b) and pro–IL-18 into theirmature forms, resulting in their secretion (45). Inflammasomes can alsobe activated in response to organelle stress, a pathological mechanismthat contributes to atherogenesis (11, 44, 46–48). Endoplasmic reticulum(ER) stress is linked to inflammasome activation through mobilizationof intracellular calcium and generation of reactive oxygen species (ROS),which provide an activation signal for the inflammasome (44, 46, 47).Moreover, calcium mobilization during ER stress causes mitochondriadamage and generation of ROS linked to inflammasome activation (47).Under conditions of metabolic challenge, simultaneous ER stress andmitochondrial oxidative stress can generate a vicious cycle, potentiatinginflammasome activity and establishing a pattern of chronic inflamma-tion.Macrophage ER stress, similar to inflammasome activity, contributesto the development of obesity, insulin resistance, and atherosclerosis(11, 43). Additionally, macrophage mitochondrial oxidative stress pro-motes atherogenesis (48). In an earlier study,we have demonstrated thatlipid-induced ER stress can be antagonized by PAO in vitro (11).
www.ScienceTra
Whether PAO can inhibit inflammasome activation in macrophagesor alter the course of atherosclerosis remains unknown.
Despite major interest in DNL-based therapeutic developmentfor chronic metabolic diseases, nothing is known about the DNL-generated lipid species’ impact on atherosclerosis. Moreover, very littleis known about the mechanism of action of these lipids in vivo, particu-larly in innate immune cells like macrophages, during the developmentof atherosclerosis. Here, we investigated the direct impact of a DNLproduct, PAO, on atherosclerosis. PAO prevented lipid-induced stressresponse in the ER, suppressing inflammasome activation inmouse andhuman macrophages and IL-1b and IL-18 production in vivo. Themetabolic resilience of organelles to lipotoxic stress was associated withPAO-initiated lipidomic remodeling of ERmembranes inmacrophagesand tissues in vivo. Overall, PAO supplementation increased the incor-poration of this FA into major lipid species represented in the mouseaortas and reduced macrophage ER stress and atherosclerotic plaquearea in apolipoprotein E–deficient (ApoE−/−) mice. These findings havepotentially important translational implications for atherosclerosistreatment through nutritional management of bioactive lipid speciessuch as PAO.
RESULTS
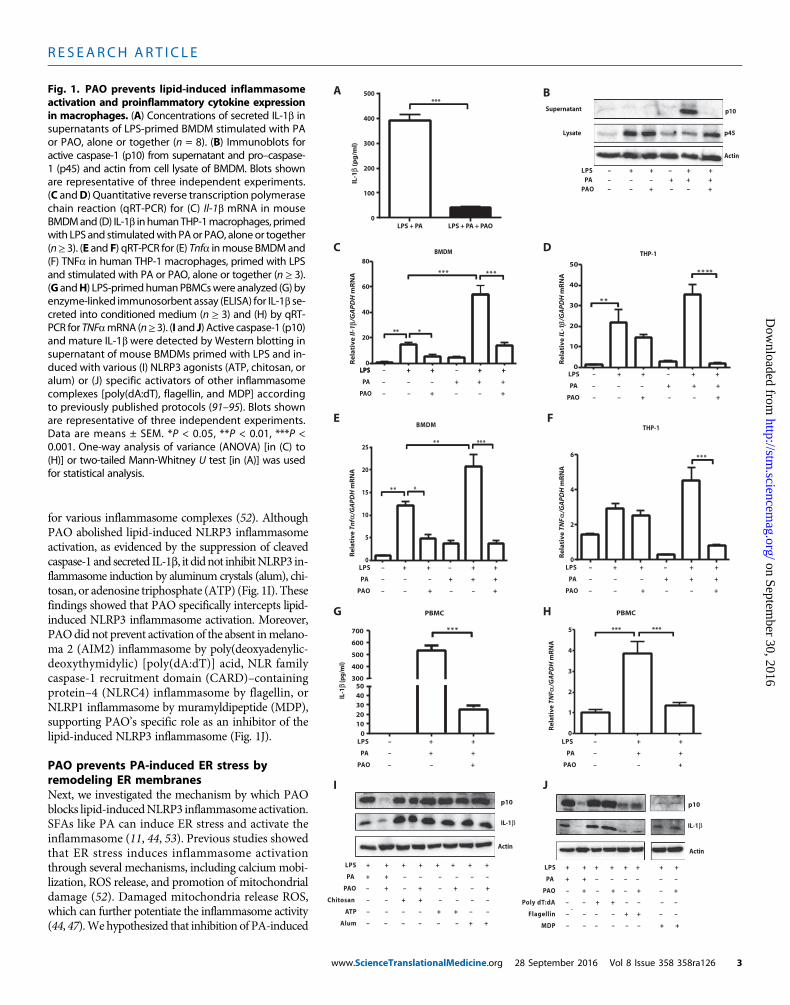
PAO blocks lipid-induced inflammasome activation andinflammation in macrophagesHere, we assessed the impact of PAO on SFA-induced inflammasomeactivation in macrophages. Earlier studies showed that treatment oflipopolysaccharide (LPS)–primedmouse bonemarrow–derivedmacro-phages (BMDMs) with an SFA such as palmitate (PA) specificallyinduced the activation of NLRP3 inflammasome and the secretion ofIL-1b (44). PAO cotreatment completely blocked PA-induced IL-1b se-cretion (P < 0.001; Fig. 1A). PA stimulation of LPS-primed BMDMactivated caspase-1, whereas cotreatment with PAO blocked this activ-ity (Fig. 1B). Priming with LPS up-regulates pro–Il-1bmRNA, which isexpressed in low amounts in resting macrophages (49). PAO partiallyblocked the LPS-induced Il-1b mRNA increase in mouse BMDM butnot in human THP-1 macrophages (Fig. 1, C and D). PA treatmentenhanced Il-1b mRNA expression in LPS-primed BMDM and inTHP-1 macrophages, but this effect could be completely blocked withPAO cotreatment (Fig. 1, C and D). Upon release, IL-1b and IL-18engage their respective receptors on other innate immune cells and stim-ulate a proinflammatory response characterized by the secondary releaseof cytokines such as tumor necrosis factor–a (TNFa) (50). PAO treat-ment blocked PA-stimulated Tnfa production in LPS-primed BMDMand human THP-1 macrophages (P < 0.001; Fig. 1, E and F). We ob-served similar inhibitory effects of PAO on PA-stimulated Il-6 and Ccl2production from LPS-primed BMDMand THP-1 cells (fig. S1, A toD).Finally, PAO inhibited PA-induced IL-1b secretion in LPS-primedhuman peripheral blood mononuclear cells (PBMCs) without reductionin IL-1b mRNA (P < 0.001; Fig. 1G and fig. S1, E and F). Furthermore,PAOblocked PA-inducedTNFamRNA induction in the same cells (P <0.001; Fig. 1H) (51). Collectively, these experiments demonstrate thatPAO is a potent inhibitor of lipid-induced inflammasome activationand proinflammatory cytokine production in mouse and humanmacrophages.
We next asked whether PAO could inhibit other inflammasomecomplexes. For this, mouse BMDMswere treated with specific activators
nslationalMedicine.org 28 September 2016 Vol 8 Issue 358 358ra126 2
R E S EARCH ART I C L E
http://stm.science
Dow
nloaded from
-
.
.
--)
-
.
on September 30, 2016
mag.org/
for various inflammasome complexes (52). AlthoughPAO abolished lipid-induced NLRP3 inflammasomeactivation, as evidenced by the suppression of cleavedcaspase-1 and secreted IL-1b, it didnot inhibitNLRP3 in-flammasome induction by aluminum crystals (alum), chi-tosan, or adenosine triphosphate (ATP) (Fig. 1I). Thesefindings showed that PAO specifically intercepts lipid-induced NLRP3 inflammasome activation. Moreover,PAOdid not prevent activation of the absent inmelano-ma 2 (AIM2) inflammasome by poly(deoxyadenylic-deoxythymidylic) [poly(dA:dT)] acid, NLR familycaspase-1 recruitment domain (CARD)–containingprotein–4 (NLRC4) inflammasome by flagellin, orNLRP1 inflammasome by muramyldipeptide (MDP),supporting PAO’s specific role as an inhibitor of thelipid-induced NLRP3 inflammasome (Fig. 1J).
PAO prevents PA-induced ER stress byremodeling ER membranesNext, we investigated the mechanism by which PAOblocks lipid-inducedNLRP3 inflammasomeactivation.SFAs like PA can induce ER stress and activate theinflammasome (11, 44, 53). Previous studies showedthat ER stress induces inflammasome activationthrough several mechanisms, including calciummobi-lization, ROS release, and promotion of mitochondrialdamage (52). Damaged mitochondria release ROS,which can further potentiate the inflammasome activity(44, 47).Wehypothesized that inhibition of PA-induced
Actin
p45
Supernatant
Lysate
A B
IL-1
β(p
g/m
l)
0
100
200
300
400
500***
LPS + PA LPS + PA + PAO
C D
E F
THP-1
THP-1
LPS – + + + +
LPS – + + – + +PA – – – + + +
PAO – – + – – +
BMDM
p10
BMDM
LPS – + + – + +
PA – – – + + +
PAO – – + – – +
LPS – + + – + +
PA – – – + + +
PAO – – + – – +
LPS – + + – + +
PA – – – + + +
PAO – – + – – +
Re
lati
ve
Il-1
β/G
AP
DH
mR
NA
Rel
ativ
e TN
Fα
/GA
PD
H m
RN
AR
elat
ive
IL-1
β/G
AP
DH
mR
NA
Rel
ativ
e Tn
f α/G
AP
DH
mR
NA
0
2
4
6 ** *
0
10
20
30
40
50 ** **
* *
0
20
40
60
80
** * ***
** *
0
5
10
15
20
25***
* * *
* *
G H
***
0
1
2
3
4
5 ***
01020304050
300
400
500
600
700
IL-1
β (p
g/m
l)
** *
PBMC PBMC
I Jp10 p10
ActinActin
IL-1β IL-1β
LPS – + +
PA – + +
PAO – – +
LPS – + +
PA – + +
PAO – – +
LPS + + + + + + + +
PA + + – – – – – –
PAO – + – + – + – +
Poly dT:dA – – + + – – – –
Flagellin – – – – + + – –
MDP – – – – – – + +
Rel
ativ
e TN
Fα/G
AP
DH
mR
NA
LPS + + + + + + + +
PA + + – – – – – –
PAO – + – + – + – +
Chitosan – – + + – – – –
ATP – – – – + + – – `
Alum – – – – – – + +
LPS + + – + +
PA – – – + + +
PAO – – + – – +
Fig. 1. PAO prevents lipid-induced inflammasomeactivation and proinflammatory cytokine expression
in macrophages. (A) Concentrations of secreted IL-1b insupernatants of LPS-primed BMDM stimulated with PAor PAO, alone or together (n = 8). (B) Immunoblots foractive caspase-1 (p10) from supernatant and pro–caspase1 (p45) and actin from cell lysate of BMDM. Blots shownare representative of three independent experiments(C andD) Quantitative reverse transcription polymerasechain reaction (qRT-PCR) for (C) Il-1b mRNA in mouseBMDMand (D) IL-1b in humanTHP-1macrophages, primedwith LPS and stimulatedwith PAor PAO, aloneor together(n≥ 3). (E and F) qRT-PCR for (E) Tnfa inmouse BMDMand(F) TNFa in human THP-1 macrophages, primed with LPSand stimulated with PA or PAO, alone or together (n ≥ 3)(G andH) LPS-primedhumanPBMCswere analyzed (G) byenzyme-linked immunosorbent assay (ELISA) for IL-1b secreted into conditioned medium (n ≥ 3) and (H) by qRTPCR for TNFamRNA (n≥ 3). (I and J) Active caspase-1 (p10and mature IL-1b were detected by Western blotting insupernatant of mouse BMDMs primed with LPS and induced with various (I) NLRP3 agonists (ATP, chitosan, oralum) or (J) specific activators of other inflammasomecomplexes [poly(dA:dT), flagellin, and MDP] accordingto previously published protocols (91–95). Blots shownare representative of three independent experimentsData are means ± SEM. *P < 0.05, **P < 0.01, ***P <0.001. One-way analysis of variance (ANOVA) [in (C) to(H)] or two-tailed Mann-Whitney U test [in (A)] was usedfor statistical analysis.www.ScienceTranslationalMedicine.org 28 September 2016 Vol 8 Issue 358 358ra126 3

R E S EARCH ART I C L E
on September 30, 2016
http://stm.sciencem
ag.org/D
ownloaded from
ER stress by PAO blocks NLRP3 inflam-masome activation in macrophages. In anearlier study, we showed that PAO preventslipid-induced ER stress but not proteotoxicER stress in macrophages (11). Becauseinflammasome activation requires LPS pre-treatment in cultured macrophages, weassessedwhether PAO can block ER stressunder inflammasome-activating conditions.PAO also blocked PA-induced ER stressin LPS-pretreated BMDMs, as measuredby spliced Xbp1 mRNA production (fig.S1G). This finding shows that PAO canblock lipid-induced ER stress upstream ofinflammasome activation.
To understand how PAO limits theimpact of lipid stress on macrophages,we next used high-resolution quantitativelipidomics to analyze PAO-induced altera-tions inmacrophage lipid composition. Forthis purpose, we analyzed the lipid changesin mouse BMDMs treated with PA andPAO alone or in combination (PA + PAO).Analysis of the data showed increases in
total PAO concentration and MUFA/SFA ratio in cells treated withPAO (alone or with PA; P < 0.001; Fig. 2, A and B). PAO incorporatedinto all major lipid species whether applied alone or in combinationwith PA (Fig. 2C). PA+PAOcotreatment expanded the TAGcompart-ment and its metabolic precursor, DAG, suggesting that PAO may bebufferingPA-associated lipotoxicity by facilitating its effective entry intoneutral lipid stores (P < 0.001 and P < 0.01, respectively; Fig. 2D). MorePA incorporated into TAG and DAG when cotreated with PAO (P <0.001 and P < 0.01; Fig. 2E).We also examined anothermembrane con-stituent, phospholipids (PLs), because their production is mainly regu-lated by the ER with the contribution of IRE1-XBP1 signaling branch(54). PA, but not PAO (alone or cotreated), expanded the PL compart-ment (P< 0.01; Fig. 2D).However, PAOeffectively incorporated into allPL species, with highest concentrations seen in phosphatidylcholinewww.ScienceTra
and its metabolic precursor, lysophosphatidylcholine (Fig. 2, C and F).These findings imply that desaturationofmembrane lipids byPAOcouldhave an influence on the membrane’s biophysical properties (55).
Next, we used a mouse model of atherosclerosis, ApoE−/− mice, inwhich ER stress and inflammasome activation can be induced over timeby a hyperlipidemic (Western) diet (43). Typically, PAO makes upabout 0.38% ofWestern diet. We decided to administer up to threefoldhigher PAO by oral gavage (about 1.2% of diet or 1400 mg/kg per day)to ApoE−/− mice on Western diet and analyze the effect of this chronicexposure on lipid composition of plasma andmultiple tissues (56). Fourweeks of PAO treatment increased PAO in the circulation and aortasof ApoE−/− mice but not in liver, adipose, and muscle tissues (P < 0.05;Fig. 3A and fig. S2A). In addition, theMUFA/SFA ratiowas increased inthe aortas andplasma fromPAO-treatedmicewhen compared to control
PA
O c
on
ce
ntr
ati
on
(m
ol
%)
Control PA PA + PAO PAO
MU
FA
/SF
A r
ati
o
Control PA PA + PAO PAO
LPC LPE PC PE PG PI PS
A B
C
D E
0
10
20
30
40
** *
***
0.0
0.2
0.4
0.6
0.8
1.0
** *
** *
** *
Control
PA
PA + PAO
PAO
0
10
20
30
40 Control
PA
PA + PAO
PAO
***
***
***
***
***
***
***
**
**
***
**
***
***
***
******
**
***
**
ControlPAPA + PAO
PAO
FFA TAG CE DAG PL
F
0
50100150200
40,00030,000
20,000
10,000 ***** ***
***
**
*
***
**
**
0
20
40
60
***
***
*** ***
***
*
***
***
***
******
***
**
** **
PA
O c
on
ce
ntr
ati
on
(mo
l %
) P
AO
co
nc
en
tra
tio
n i
n
ph
os
ph
oli
pid
s (
mo
l %
)
PA
co
nc
en
tra
tio
n
(µ
M)
FFA TAG CE DAG PL
0
2000
40000
60,000 50,000
30,000 20,000 10,000
Control
***
****
***
**
* **** **
ns
TAG DAG PL
PAPA + PAOPAO
L
ipid
cla
ss
c
on
ce
ntr
ati
on
(µ
M)
40,000
Fig. 2. PAO regulates lipid composition inprimarymousemacrophages.MouseBMDMs
were treatedwith PA or PAO, alone or together,for 6 hours. (A) Mean PAO (C16:1n7) concentra-tion [mole percent (mol%); the ratio ofmolesof FAs to total moles of FAs]. (B) MUFA/SFAratio. (C) PAO (C16:1n7) concentration (mol %)in various lipid classes. (D) Mean concentra-tion of each lipid class (mM). ns, not signifi-cant. (E) Mean concentration of PA (C16:0) ineach lipid class (mM). (F) PAO (C16:1n7) con-centration invariousPLs (mol%).Dataaremeans± SEM. *P < 0.05, **P < 0.01, ***P < 0.001. n = 4.Nonparametric Kruskal-Wallis test and un-paired two-tailed Student’s t test were usedfor statistical analysis. PC, phosphatidylcholine;LPC, lysophosphatidylcholine; LPE, lysopho-sphatidylethanolamine; PG, phosphatidyl-glycerol; PE, phosphatidylethanolamine; PI,phosphatidylinositol; PS, phosphatidylserine;FFA, free fatty acid.nslationalMedicine.org 28 September 2016 Vol 8 Issue 358 358ra126 4

R E S EARCH ART I C L E
on September 30, 2016
http://stm.sciencem
ag.org/D
ownloaded from
0.0
0.5
1.0
1.5
M
UFA
/SFA
rati
o
*
Control PAO
0
5000
10000
15000
20000
Lip
id c
lass
co
nce
ntr
ati
on
(µ
M)
Control
PAO
FFA TAG CE PL DAG
FFA TAG CE PLDAGPSPILPC PGPEPCLPE
PA
O c
once
ntra
tion
(mol
%)
0
5
10
15
PAO
*
Control
A
B
C
D
E
F
G
0
1000
2000
3000
4000Control
PAO
Aorta-PG Aorta-PE
0
2
4
6
8
*
*
*
Control
PAO
Control
PAO
0
5
10
15
20
*
* **
P
AO
co
nce
ntr
ati
on
in p
ho
sph
oli
pid
s (m
ol %
)
Control
Control
Control
Control
PAO
PAO
PAO
PAO
PG22
:4
PG20
:4
PG18
:4
PG20
:5
PG22
:1
PG22
:6
PG18
:2
PG18
:0
PG20
:1
PG22
:2
PG20
:2
PG18
:3
PG22
:5
PG14
:1
PG14
:0
PG15
:0
PG17
:0
PG20
:3
PG22
:0
PG16
:1
PG16
:0
PG18
:1
−4−2
02
46
Control
Control
Control
Control
PAO
PAO
PAO
PAO
PE18
:4
PE18
:3
PE14
:1
PE20
:5
PE22
:0
PE15
:0
PE20
:4
PE22
:4
PE22
:2
PE18
:2
PE14
:0
PE17
:0
PE16
:0
PE18
:0
PE20
:3
PE16
:1
PE22
:1
PE20
:1
PE20
:2
PE22
:5
PE22
:6
PE18
:1
−2−1
01
23
4
Control
Control
Control
Control
PAO
PAO
PAO
PAO
CE14
:1
CE15
:0
CE18
:2
CE18
:3
CE17
:0
CE18
:4
CE18
:0
CE20
:3
CE20
:4
CE20
:0
CE22
:2
CE20
:5
CE12
:0
CE16
:1
CE18
:1
CE14
:0
CE22
:0
CE22
:6
CE20
:2
CE22
:4
CE16
:0
CE22
:5
CE24
:0
CE22
:1
CE24
:1
CE20
:1
−2−1
01
23
Aorta-CE H I
Control
Control
Control
Control
PAO
PAO
PAO
PAO
TAG
17:0
TAG
14:0
TAG
15:0
TAG
14:1
TAG
16:0
TAG
20:0
TAG
18:3
TAG
20:4
TAG
20:5
TAG
22:4
TAG
18:0
T AG
22:6
TAG
22:5
TAG
18:2
TAG
12:0
TAG
22:1
TAG
20:2
T AG
16:1
TAG
18:1
TAG
20:3
TAG
20:1
−4−2
02
4
Control
Control
Control
Control
PAO
PAO
PAO
PAO
DAG1
4:0
DAG1
8:3
D AG1
2:0
DAG2
0:1
D AG1
4:1
D AG1
8:2
DAG2
0:2
DAG2
0:0
DAG1
6:1
DAG1
8:1
DAG1
5:0
DAG2
2:4
DAG1
8:0
DAG2
0:5
DAG2
2:5
DAG2
0:3
DAG2
2:6
DAG1
6:0
D AG2
0:4
−4−2
02
4
Aorta-TAG Aorta-DAG
JK
P
ho
sph
oli
pid
co
nce
ntr
ati
on
(µ
M)
P
AO
co
nce
ntr
ati
on
(m
ol %
)PC PE PS PI PG LPC LPE
Fig. 3. PAO regulates lipid composition in aortas from ApoE−/− mice.Aortaswere isolated fromPAO-treated and controlApoE−/−mice onWestern
shows various lipid metabolites in each sample (y axis) that are up-regulated(red) or down-regulated (green), calculated by centering to the mean of the
diet and analyzed. (A)Mean concentration of PAO (C16:1n7) (mol%; the ratioof moles of FAs to total moles of FAs). (B) MUFA/SFA ratio. (C) Concentrationof each lipid metabolite (expressed as mM). (D) Mean concentration of PAO(C16:1n7) (mol %) in various lipid metabolites. (E) Concentration (mM) of thevarious PL metabolites. (F) Mean concentration of C16:1n7 (mol %) in thevarious PLmetabolites. (G toK) The heatmaps display lipid class compositionanalysis for (G) PG, (H) PE, (I) CE, (J) TAG, and (K) DAG. In the heat maps, x axis
www.ScienceTra
control group and scaled by the SD of all observations. In the line plots, y axisshows the t statistics from comparing two groups. The black line is the 95thpercentile of the standardized statistics over 1000 permutations. The red dotsare the z scores of the observed statistics that were standardized to 1000 per-mutations. Graphs show means ± SEM. *P < 0.05. n = 4. Unpaired two-tailedStudent’s t test [in (B)] or Wilcoxon test [in (A) and (C) to (F)] was used forstatistical analysis.
nslationalMedicine.org 28 September 2016 Vol 8 Issue 358 358ra126 5

R E S EARCH ART I C L E
on September 30, 2016
http://stm.sciencem
ag.org/D
ownloaded from
(P < 0.05, Fig. 3B; P < 0.01, fig. S2B). PAO treatment did not cause ex-pansion of any major lipid class analyzed in aortas and plasma (Fig. 3Cand fig. S2C), but PAOwas increased in these samples (P < 0.05; Fig. 3Dand fig. S2D). In particular, PAOwas increased inmany of the PL specieswithout expanding the PL compartment (Fig. 3, E and F, and fig. S2, Eand F). PAO (C16:1n7)was one of themost elevated FAs inmany of thelipid compartments (Fig. 3, G to K, and fig. S3, A to F). In conclusion,oral PAO supplementation increased plasma PAO concentration andenhanced PAO incorporation into various lipid compartments in theaortas of hyperlipidemic mice.
PAO-induced lipidomic remodeling of cellular membranes and tis-sues may underlie the resilience of ER to lipotoxic stress. Lipotoxicity,lipid-induced cellular dysfunction and death, is associated with thedisruption of ER structure resulting from membrane stiffening causedby increased SFA or cholesterol content (57, 58). Therefore, we examinedwhether orally delivered PAO can enter and remodel ERmembranesin mouse tissues. Lipidomic analysis of isolated liver ERs from PAO-treatedmice showed a significant increase in total PAO inERmembranescompared to control (P < 0.05; Fig. 4A and fig. S4A). PAO treatmentincreased theMUFA/SFA ratio in liver ERs (Fig. 4B). PAO incorporatedinto many lipid compartments, especially PL and CE, of liver ERs (P <0.05 and P < 0.01; Fig. 4C). PAO was one of the most highly elevatedFAs in all lipid compartments of liver ER (Fig. 4, D and E, and fig. S4, Bto D). Collectively, these data demonstrate that oral PAO treatment canpromote systemic desaturation of ER membranes in vivo.
Lipidomic analysis of ER compartments from macrophages alsoreflects the increase in total PAO and MUFA/SFA ratios after PAOtreatment (P < 0.05, Fig. 4F; P < 0.01, Fig. 4G; and validation of the ERfraction; fig. S4E). PAO is incorporated into all ER lipid species (Fig. 4H).In the macrophages, PA-induced unfolded protein response (UPR)activation (as assessed by IRE1 phosphorylation and spliced XBP1 pro-tein) was blocked by PAO (fig. S4F). Therefore, the efficient integrationof PAO into PL and CE together with an increase in MUFA/SFA ratioin the ER membranes suggests that PAO treatment could promoterobust changes in membrane dynamics and membrane-initiated UPRactivation inmacrophages. For example, the assembly of IRE1 or PERKinto high-order oligomers on ERmembranes is essential for transmittingstress fromwithin this organelle (59). Activation of these proximal UPRkinases by saturated lipids, unlike activation by unfolded proteins, doesnot require ligand binding by their luminal domains (60). Lipidcomposition changes in ER membrane may alter oligomerizationand activation states of these kinases. Thus, we investigated the impactof PA andPAOon IRE1oligomerization states onERmembranes usingpreviously established protocols (61). PA induced green fluorescentprotein (GFP)–tagged IRE1 oligomer formation on ER and splicingof XBP1, which was largely prevented by cotreatment with PAO (Fig.4I and fig. S4, G to I). This result confirms that ERmembrane saturationor desaturation by PA or PAO, respectively, can alter the oligomerizationstate of a proximal UPR sensor and affect downstream UPR signaling.
PAO prevents the development of atherosclerosis in miceAtherosclerosis is a nonresolving chronic inflammatory disease of thearterial wall. It is triggered by subendothelial deposition of lipoproteinsin areas of disturbed laminar flow that cause endothelial damage. Theseretained lipoproteins are susceptible to oxidation and othermodificationsthat render themhighly proinflammatory and toxic to the overlying en-dothelial cells. This also causes activation of the endothelial cells andintramural recruitment of cells from the mononuclear lineage. In the
www.ScienceTra
subendothelial space, monocytes are transformed first to phagocytesthat scavenge lipid deposits and then into proinflammatory, cholesterol-laden foam cells. The foam cells eventually become engorged with cho-lesterol and lose their capacity to migrate, compromising their immuneresponse. As a result, the plaques advance and become more complexwith the contribution of other immune cells and vascular smoothmuscle(VSM) cells. At this advanced stage, the plaque stability is highly influ-enced by macrophages through their secretion of proinflammatorycytokines and chemokines as well as matrix-degrading proteases.Moreover, upon their death, the release of their toxic content resultsin the formation of a prothrombotic necrotic core (37–39, 62).
Atherosclerotic plaques of both mice and humans display signs ofER stress, mitochondrial oxidative stress, and inflammasome activationinmacrophages (11, 43, 63–66). Increased ER stress in lesions associateswith plaque vulnerability and acute coronary syndrome (65). Genetic,dietary, and chemical interventions that reduce ER stress and inflam-masome activity can prevent atherosclerosis in mice (11, 67–70). More-over, specific and selective inhibitors for ER stress and inflammasomesthat can alleviate multiple components of metabolic syndrome are cur-rently under investigation (52, 71).
Given our findings that PAO can inhibit lipid-induced stress in theER and subsequent activation of the inflammasome in macrophages(Fig. 1 and fig. S1), we hypothesized that chronic PAO interventionin mice could prevent atherosclerosis in vivo. For this purpose, maleApoE−/−mice were placed on a hypercholesterolemic diet at 6 weeks ofage for a total of 16 weeks. There were no significant differences in bodyweights or blood glucose concentrations of mice in the experimentalgroups before or after PAO treatment (table S1). Starting at 12 weekson diet, PAO was administered daily by oral gavage, whereas controlmice received vehicle for a total of 4 weeks (Fig. 5A). Chronic oralPAO treatment resulted in a significant (P < 0.01) decrease (−33%) inthe development of atherosclerotic lesions in en face aorta analysis whencompared to control mice (Fig. 5B). The impact of PAO on athero-sclerosis development was also evaluated in cross-sectional lesionsof the aortic root. The foam cell area in the plaques (visualized withOil Red O staining) was significantly (P < 0.05) decreased (−29.4%)in the aortic sinus sections (Fig. 5C). In parallel, there was a significant(P < 0.01) reduction in the necrotic core area in the lesions of the PAO-treated group when compared to control mice (−31%) (Fig. 5D). Theseresults show that PAO treatment alleviated atherosclerosis withoutimproving dyslipidemia and that ER stress (as evident by decrease insXbp1 mRNA in hearts) was markedly reduced in PAO-treated mice(Fig. 5E and fig. S5, A to D). These in vivo findings demonstrate thatdietary supplementation with PAO can effectively mitigate athero-sclerosis in mice.
PAO alters plaque composition by reducing macrophagesin lesionsMany kinds of immune and nonimmune cell types participate in theformation and advancement of atherosclerotic plaques. For example,intramural deposition of lipoproteins is linked to endothelial damagethat triggers mononuclear cell infiltration to the subendothelial spaceand subsequent formation of foam cells. Other immune cell types, suchas dendritic cells, lymphocytes, eosinophils, and mast cells, are alsoinvolved in plaque advancement (38, 39, 68, 72, 73). Given that PAOreduces atherosclerosis inApoE−/−mice, we next analyzed PAO-initiatedchanges in the cellular composition of atherosclerotic plaques. Whencompared to control, PAO treatment reduced (−18%) the macrophage
nslationalMedicine.org 28 September 2016 Vol 8 Issue 358 358ra126 6

R E S EARCH ART I C L E
on September 30, 2016
http://stm.sciencem
ag.org/D
ownloaded from
content of aortic root lesions, as visualized byMOMA-2 staining (P < 0.05; Fig. 6A and fig. S6).This is consistent with the reduced amount offoam cells in the lesions of PAO-treated mice(Fig. 5C, seen as Oil Red O–positive staining).This was not, however, related to an increase inmacrophage apoptosis, because PAO treatmentalso reduced the number of apoptotic cells(−34.8%) in the lesion area stained with MOMA-2, as determined by terminal deoxynucleotidyltransferase–mediated deoxyuridine triphosphatenick end labeling (TUNEL) assay (P < 0.05; Fig.6B). Furthermore, we examined the T lymphocytepopulations in PAO-treated and control aorticsinus lesions and found no significant differencesin CD3+ cells between the two experimentalgroups (Fig. 6C and fig. S6).
A
D E
G
Control PAO FFA TAG CE DAG PL
F
B C
H
Control PA PA + PAO PAO
0.0
0.5
1.0
1.5
MU
FA
/SF
A r
ati
o
*
Control PAO
Liver-ER-CELiver-ER-PC
Control PA PA + PAO PAO
TAG CE DAG PL
0
5
10
15
20***
* **
0.0
0.5
1.0
1.5 *
* *
Liver-ER Liver-ER Liver-ER
Macrophage-ER
Macrophage-ER
ControlPA
PA + PAO
PAO
0
2
4
6
8
10
*
Macrophage-ER
MU
FA/S
FA r
atio
FFA
PA
O c
on
cen
tra
tio
n (
mo
l %
)
PA
O c
on
ce
ntr
ati
on
(µ
M)
PA
O c
on
ce
ntr
ati
on
(m
ol
%)
0
10
20
30
40
50
**
**
**
***
***
*
** **
**
**
**
PA
O c
on
ce
ntr
ati
on
(m
ol
%)
IRE1-GFP DAPI Merge
Control
PA
PA + PAO
IRE
1 f
oc
i n
um
be
r/c
ell
α
0
5
10
**
PA PA + PAO
ControlControlControlControlControl
PAOPAOPAOPAOPAO
PC20
:2
PC18
:2
PC16
:0
PC20
:3
PC18
:0
PC22
:4
PC20
:4
PC18
:1
PC20
:1
PC18
:4
PC22
:6
PC18
:3
PC20
:0
PC22
:1
PC17
:0
PC14
:0
PC14
:1
PC15
:0
PC12
:0
PC22
:5
PC20
:5
PC22
:2
PC16
:1
−4−3
−2−1
01
23
Control
ControlControlControl
ControlPAO
PAOPAO
PAO
PAO
CE18
:1
CE22
:6
CE14
:0
CE12
:0
CE17
:0
CE18
:0
CE15
:0
CE18
:2
CE16
:0
CE20
:4
CE22
:1
CE20
:1
CE18
:4
CE22
:5
CE18
:3
CE20
:2
CE24
:1
CE20
:5
CE22
:2
CE22
:4
CE20
:0
CE20
:3
CE24
:0
CE22
:0
CE16
:1
CE14
:1
−4−2
02
I
0
1000
2000
3000
4000
5000
Control
PAO
**
*
*
*
Fig. 4. PAO regulates lipid composition in theERs from livers of ApoE−/− mice and from
macrophages. (A to E) Liver ER fractions wereisolated fromPAO-treated and control ApoE−/−miceon Western diet and analyzed. (A) Mean concentra-tion of PAO (C16:1n7) (mol %; the ratio of moles ofFAs to total moles of FAs). (B) MUFA/SFA ratio. (C)Mean concentration (mM) of PAO (C16:1n7) in vari-ous lipid metabolites. Data are means ± SEM. *P <0.05, **P < 0.01. n = 5. Unpaired two-tailed Student’st test [in (B)] and Wilcoxon test [in (A) and (C)] wereused for statistical analysis. (D and E) The heat mapsdisplay lipid class composition analysis for (D) PCand (E) CE. In the heat maps, x axis shows each lipidmetabolitemeasurement in each sample (y axis) asup-regulated (red) or down-regulated (green), asdetermined by centering to themean of the controlgroup and scaled by the SD of all observations. Inthe lineplot, y axis shows the t statistics fromcompar-ing two groups. The black line is the 95th percentileof the standardized statistics over 1000permutations.The reddots are the z scores of theobserved statisticsthat were standardized to 1000 permutations. Dataare means ± SEM. *P < 0.05, **P < 0.01. n = 5. (F toH) ER fractions were isolated from RAW 293.6macrophages and analyzed. (F) Mean concentration(mol %) of C16:1n7. (G) MUFA/SFA ratio. (H) Meanconcentration (mol %) of C16:1n7 in various lipidclasses. Data are means ± SEM. *P < 0.05, **P <0.01, ***P < 0.001. n = 4. Nonparametric Kruskal-Wallis test and unpaired two-tailed Student’s t testwere used for statistical analysis. (I) Cells expressingGFP-IRE1 were treated with PA or PAO, alone ortogether, for 6 hours and analyzed for formationof discrete IRE1oligomer foci (greendots) by imagingwith a confocal microscope (blue, nuclei; green,GFP-IRE1). The graph depicts quantification of IRE1oligomerization as reporteddistinct IRE1 foci (green)per cell. Data are means ± SEM. **P < 0.01. n ≥ 100cells from four experiments. To compare PA-treatedversus cotreated with PA and PAO, Mann-WhitneyU test was used for statistical analysis. Scale bar,20 mm. DAPI, 4′,6-diamidino-2-phenylindole.www.ScienceTranslationalMedicine.org 28 September 2016 Vol 8 Issue 358 358ra126 7

R E S EARCH ART I C L E
on September 30, 2016
http://stm.sciencem
ag.org/D
ownloaded from
In addition to having proatherogenic immune celltypes, atherosclerotic lesions containVSM,which canmigrate from adventitia to intima and aid in sealingthe fibrous cap against rupture. This migratory effectis controlled by the mediators and chemokines re-leased frommacrophages and other plaque cells (38).Immunofluorescence staining of aortic root lesionswith a specific antibody against a–smooth muscleactin showed no significant change in VSM+ area afterPAO treatment (Fig. 6D and fig. S6). Additionally,VSM-derived collagen content showed no change inPAO-treated lesionswhen compared to control lesions(Fig. 6E). Overall, PAO treatment does not appear toimprove the mechanical strength of the lesions.
PAO prevents macrophage ER stress andinflammasome activation in lesionsOur findings demonstrated a strong impact of PAOon lesionmacrophages and their viability. Our earlierstudies have also indicated that PAO can block lipo-toxic, but not proteotoxic, ER stress in macrophages(11). In our current study, we observed that PAO canblock lipid-inducedER stress, subsequently leading tosuppression of the inflammasome (Fig. 1 and fig. S1).Hence, we asked whether the anti-stress and anti-inflammatory effects of PAOobserved inmacrophagescan be recapitulated in vivo during atherogenesis. First,we examined the immunofluorescence signal intensityfor two markers of activation of the ER stress re-sponse, namely, phosphorylation of eukaryotic initiationfactor 2a (eIF2a) and expression of cyclic adenosinemonophosphate–dependent transcription factor 3(ATF3) in macrophage-enriched areas of aortic root
6 weeks 18 weeks 22 weeks
Western Diet
Oral gavage once daily for 4 consecutive weeks
1% BSA in PBS : Control groupPAO in 1% BSA in PBS : PAO group
H&E
Oil Red O
Control
PAO
Control PAO
A
B
C
Necrotic core
D
E
Le
sio
n a
rea
(
10
3µ
m2 )
0
100
200
300 *
PAOControl
Le
sio
n a
rea
(%
tota
l)
0
5
10
15
20 **
Control PAO
0
200
400
600
800
1000ns
To
tal
ch
ole
ste
rol
(
mg
/dl)
Ch
ole
ste
rol
(mg
/dl)
0
200
400
600
800ns
ns
ns
VLDL LDL HDL
Control
PAO
lor
etsel
oh
C(µ
noitc
arfr
ep
g)
VLDL
100
80
60
40
20
0
LDLHDL
ControlPAO
1
Control PAO
Ne
cro
tic
core
are
a (%
)0
5
10
15
20**
Control PAO
12 26 50
F
Fraction number
Fig. 5. PAO treatment reduces atherosclerosis inApoE−/− mice. (A) Experimental design for the analysis
of atherosclerosis in ApoE−/− mice on a Western diet.BSA, bovine serum albumin; PBS, phosphate-bufferedsaline. (B) PAO treatment reduced atherosclerotic lesionsin en face aorta (control, n = 18; PAO, n = 15; **P < 0.01).(C) Histology of plaques (marked with arrows) at theaortic sinus stained with Oil Red O and hematoxylinand eosin (H&E). Lesion area was reduced in the plaquesof PAO-treated mice (control, n = 10; PAO, n = 10; *P <0.05). Scale bar, 300 mm. (D) The necrotic core area(marked with dashed lines and arrows) was also de-creased in the plaques of PAO-treated mice as comparedto control mice (control, n = 12; PAO; n = 11, **P < 0.01).Scale bar, 50 mm. (E) Serum total cholesterol and lipo-protein cholesterol [VLDL, low-density lipoprotein (LDL),or high-density lipoprotein (HDL)] concentrations weresimilar between PAO-treated and control mice. (F) Li-poprotein profiles from control (blue) and PAO-treated(red) ApoE−/− mice show the average distribution (mg perfraction; 1 to 13: VLDL, 14 to 31: LDL, and 32 to 50: HDL)of total cholesterol for each group. Data are means ±SEM. *P < 0.05, **P < 0.01. ns, not significant. control,n = 4; PAO, n = 6. Control versus PAO: Mann-WhitneyU test [in (B) to (D)] or unpaired two-tailed Student’st test [in (E)] was used for statistical analysis.www.ScienceTranslationalMedicine.org 28 September 2016 Vol 8 Issue 358 358ra126 8

R E S EARCH ART I C L E
on September 30, 2016
http://stm.sciencem
ag.org/D
ownloaded from
lesions. Quantitative analysis of ER stress byimmunofluorescence stainingshowedasig-nificant (P<0.01) reduction in p-eIF2a andATF3 (−42.5 and −42.6%, respectively) inthe macrophage-rich regions of lesions afterchronic PAO treatment when compared tothe control group (Fig. 7, A and B, and fig.S6). Moreover, PAO supplementation re-ducedXBP1 splicing in the hearts from thesemice (fig. S5D). These results are consistentwith our earlier findings inmacrophages invitro and demonstrate the efficacy of oralPAO treatment in alleviating macrophageER stress in atherosclerotic lesions in vivo.
We next asked whether PAO could in-hibit lipid-induced inflammasome acti-vation and secretion of IL-1b and IL-18
in vivo. Previous studies showed that the hyperlipidemic diet in ApoE−/−mice causes amarked induction of the inflammasome in the lesions andsystemically, as evidenced by increased secretion of IL-1b and IL-18(43, 74). We found that the intensity of immunofluorescence staining forIL-1b in atherosclerotic lesions was significantly (P < 0.05) reduced byPAO (−32.8%), demonstrating effective suppression of the inflamma-someby oral PAO treatment (Fig. 7C and fig. S6). Analysis of serum frommice supplemented for 4 weeks with PAO (threefold higher dosage thanfound inWestern diet) showed a significant (P < 0.05) reduction in sys-temic IL-1b and IL-18 production (−32.2 and −26.6%, respectively) by
www.ScienceTra
PAO treatment when compared to control mice (Fig. 7, D and E). Col-lectively, these findings demonstrate that chronic PAO supplementationcan effectively block hyperlipidemia-inducedmacrophage ER stress andinflammasome activity in atherosclerotic plaques in vivo.
DISCUSSION
The contribution of DNL to obesity and its complications is complex inpart because lipogenesis in various organs has different consequences
MOMA-2
Control PAO
α-SMA
Masson’strichrome
A
B
C
D
MO
MA
–2 p
osit
ive
area
(%)
0
10
20
30*
Control PAO
α -SM
A–p
osi
tive
are
a (%
)0.0
0.5
1.0
1.5
2.0
2.5ns
Control PAO
TUNEL
0
10
20
30
40 ns
Control PAO
C
olla
gen
are
a (%
of l
esio
n a
rea)
CD3
CD
3
cell
s/m
m+
2
0.00
0.02
0.04
0.06
0.08 ns
PAOControl
TU
NE
L-p
osi
tiv
e c
ell
/mm
(%
)2
0
5
10
15
20
25*
Control PAO
E
Fig. 6. PAO reduces themacrophage areaand apoptotic cells in atherosclerotic pla-
ques. Six-week-oldApoE−/−micewereput onWestern diet (total of 16 weeks) and orallygavaged with PAO or vehicle daily (for thelast 4 weeks). Proximal aorta cryosectionswere stained with specific antibodies forvarious cellular markers. The representativeimages are shown for (A) macrophagemarkerMOMA-2 (n = 10 per group). Mean percentMOMA-2–positive area relative to total lesionarea is reported. (B) TUNEL assay. Arrowheadsshow apoptotic cells (control, n = 10; PAO, n =9). Average apoptotic cells per plaque area(mm2) are reported. (C) T cell marker, CD3(control, n=9; PAO, n=10). Arrowheads showCD3-positive cells. The average numbers ofT cells per plaque area (mm2) in each sectionare reported. (D) VSM cell marker a–smoothmuscle actin (a-SMA) is depicted (n = 10 pergroup). Dashed line outlines the lesion area.Mean percent a-SMA area relative to totallesion area is reported. Enlarged images (four-fold; upper right) represent thea-SMA–positivearea in the intimal region. (E) Masson’s tri-chrome stain for collagen (blue, collagen; red,cytoplasm andmuscle fibers) (control, n= 13;PAO, n = 9). Mean percent collagen area rela-tive to total lesion area is reported. Data aremeans ± SEM. *P < 0.05. ns, not significant.Control versus PAO: Mann-Whitney U testwas used for statistical analysis. Scale bars,150 mm.nslationalMedicine.org 28 September 2016 Vol 8 Issue 358 358ra126 9

R E S EARCH ART I C L E
on September 30, 2016
http://stm.sciencem
ag.org/D
ownloaded from
on systemicmetabolism. For example, liverDNL is increased in obesity and frequentlyassociates with fatty liver disease and in-sulin resistance (75, 76). Lipogenesis inthe skeletal muscle can promote insulinresistance but is also required for optimalmuscle strength (77). Brain DNL generateslipid signals that affect food intake andenergymetabolism (78). DNL inwhite ad-ipose tissue is beneficial for systemic me-tabolism by increasing insulin sensitivityand improving lipid metabolism (7, 79).Therefore, developing therapeutic strate-gies based on DNL is challenging. For in-stance, a global DNL inhibitor may havebeneficial metabolic effects acting on thehepatocytes, but adverse effects may beassociatedwith blockingDNL in adipocytes,pancreatic b cells, and macrophages (76).It is now clear that DNL can generate nu-merous lipid signals (1-palmitoyl-2-oleoyl-sn-glycerol-3-phosphocoline, alkyl etherlipids, and PAO) that can act through dis-tinct receptors and mechanisms to exertpotent metabolic effects (75). Alternatively,nutritional supplementation with a specificDNL product may effectively generate thebeneficial metabolic effects of DNL in dis-eases afflicting target cells in metabolicallyactive organs (6, 7, 9–11, 21, 33, 34, 36, 80).Despite a great interest in DNL-based ther-apeutic development for chronicmetabolicdiseases, DNL-generated lipid species’ im-pact on the vasculature and atherosclerosisisnot known.Circumstantial findings fromseveral genetic or chemical models of DNLactivation in mice suggest that DNL orits products could be protective againstatherosclerosis (33,34,36,75,79).Our studyprovides a direct examination of PAO’s im-pact on atherogenesis. Our findings dem-onstrate that PAO supplementation (atthreefold higher dosage than found in thecomposition of Western diet) reduces ath-erosclerosis inApoE−/−mice.Chronic PAOtreatment effectively mitigated macrophageER stress in lesions and blocked inflamma-someactivation in lesions and systemically,similar to our initial observation in culturedprimary mouse and human macrophages.In addition, a recent PAO supplementa-tion trial in humans resulted in a markedreduction in high-sensitivity C-reactive pro-tein and improved serum lipids, suggest-ing that PAO supplementation could alsobe atheroprotective in humans (36). Col-lectively, the outcome of these studies im-plies that nutritional supplementationwith
Control
PAO
p-eIF2α
ATF3
MOMA-2/DAPI
MOMA-2/DAPI
MOMA-2/DAPI
p-eif2α/DAPI
p-eif2α/DAPI
ATF3/DAPI
ATF3/DAPI
A
B
C
IL-1ββ
Control PAO
IL-1
β (p
g/m
l)
0
50
100
150
200 *
Control PAO
Control
PAO
ATF3
0
10,000
20,000
30,000
40,000*
Control PAO
Re
lati
ve
flu
ore
sce
nce
inte
nsi
ty (
a.u
.)
IL-1β
p-elF2α
0
5000
10,000
15,000
**
Control PAO
Re
lati
ve
flu
ore
sce
nce
inte
nsi
ty (
a.u
.)R
ela
tiv
e f
luo
resc
en
ce
in
ten
sity
(a
.u.)
0
10,000
20,000
30,000 **
Control PAO
MOMA-2/DAPI
IL-1
8 (p
g/m
l)
0
50
100
150
200
250
Control PAO
*D E
Fig. 7. PAO mitigates ER stress in lesional macrophages and suppresses the inflammasome inlesions. Aortic root sections from PAO or vehicle-treated mice were analyzed using the following specific
antibodies for immunofluorescence staining: (A) p-eIF2a (green) andMOMA-2 (red) (control, n = 8; PAO, n =5), (B) ATF3 (green) and MOMA-2 (red) (control, n = 8; PAO, n = 4), and (C) IL-1b (control, n = 10; PAO, n = 8).Fluorescence intensity of ER stress markers in macrophage-enriched (MOMA-2–positive) areas was quanti-fied using ImageJ. IL-1b (control, n = 8; PAO, n = 4) (D) and IL-18 (n = 7 per group) (E) were measured inplasma of ApoE−/−mice treatedwith orwithout PAO after 4weeks. All data aremeans ± SEM. *P< 0.05, **P<0.01. Control versus PAO: Mann-Whitney U test was used for statistical analysis. Scale bars, 150 mm. a.u.,arbitrary units.www.ScienceTranslationalMedicine.org 28 September 2016 Vol 8 Issue 358 358ra126 10

R E S EARCH ART I C L E
on September 30, 2016
http://stm.sciencem
ag.org/D
ownloaded from
PAO may be a promising preventive approach in atherosclerosisthrough effective mitigation of ER stress and inflammasome activity.This does, however, require direct validation in future human trials.
The mechanism of action of DNL-produced lipids in vivo duringatherogenesis is not known. Here, we sought to gain insight into PAO’smechanism of action in vivo by studying its effects on macrophagesinvolved in atherogenesis. Macrophages play a prominent role in theprogression of atherosclerosis to vulnerable plaques (38, 62). Previousstudies established that cholesterol crystals and SFAs specifically induceNLRP3 inflammasome and IL-1b secretion from macrophages, andgenetic or pharmacological inhibition of the inflammasome alleviatesatherosclerosis (43, 74, 81). Here, we found that treatment of primarymouse or humanmacrophageswithPAOeffectively blocked inflamma-some activation by SFAs, but not by other NLRP3 inducers like ATPand alum. Additionally, PAO did not prevent activation of any otherinflammasome complexes (AIM2, NLRC4, or NLRP1) by their specificinducers. These results underscore PAO’s specificity as an inhibitor tolipid-induced NLRP3 inflammasome activation. Consistently, in vivoPAO treatment also lowered hyperlipidemia-induced IL-1b and IL-18concentrations in serum and IL-1b expression in plaques. Therapiesinvolving small-molecule inhibitors anddietary regimes aimed at blockinginflammasome activation and IL-1b secretion in a variety of diseases arehighly sought after (52, 69, 82).
The activation signal for the inflammasome can be generated bydistress in ER (44, 47, 50, 83). There are several ways in which ER caninduce inflammasome activity, including release of Ca2+ or ROS andmitochondrial damage (47, 49). Moreover, damaged mitochondriagenerate ROS, which can further potentiate inflammasome activity (49).In an earlier study, we showed that PAO is a potent inhibitor of lipid-induced but not proteotoxic ER stress (11). Studies have also shown ERstress being causally associated with atherogenesis, diabetes, and obesity(84). Here, we confirmed that PAO inhibits hyperlipidemia-induced ERstress in vivo and in themacrophages infiltrating atherosclerotic plaques,and subsequent inflammasome activation. Collectively, the outcome ofthese experiments underscores PAO’s ability to strongly antagonizelipid-induced ER stress upstream of inflammasome activation.
How does PAO promote metabolic resilience to hyperlipidemia?Dietary PAO intake is quite lowbecause PAO is not ubiquitiously foundin food sources (25). However, PAO is the fifth most abundant FA inhumans, suggesting that endogenous PAO synthesis, particularly inobesity, is a major contributor to PAO abundance in humans (85).One plausible explanation for the increased PAO production in obesityis that it reflects a necessary metabolic adaptation to meet the highdemand forMUFA in rerouting themetabolism of SFA and cholesteroltoward storage or excretion and to support membrane function byactive remodeling (86–89).Here,we showed that PAOeffectively replacesother FAs, resulting in increased MUFA/SFA ratio in macrophages,plasma, and aorta, but without expanding any of the lipid classes. Themarked incorporation of PAO intomultiple PL species and, in particular,cardiolipin implies dynamicmembrane remodelingof organelles throughdesaturation by PAO. Further lipidomic analysis of isolated ER fractionsfrom macrophages and livers confirmed that PAO effectively incorpo-rates into most lipid compartments, especially PLs and cholesterol, inthis organelle and increases theMUFA/SFAratio. ExtensiveERmembraneremodeling can thus be achieved through PAO-induced desaturationandmay have wider implications, such as altered membrane biophysicalproperties and UPR signaling emanating from these membranes.Proximal UPR regulators form high-order oligomers on ER membranes
www.ScienceTran
upon ER stress induction by chemicals (61). Here, we show that PAevokes IRE1 oligomerization on ER membranes and splicing of XBP1mRNA, which can be blocked by PAO cotreatment. The outcome ofthese experiments strongly supports the idea that dynamic remodelingofmembranes by desaturationwithPAOunderlies ER resistance to stressinduced by PA. One limitation of our study is that we do not know theextent of remodeling in other intracellular organelles’ membranesbecause we only analyzed the ER via lipidomics. However, our studyprovides proof of principle that organelle membrane remodeling bynutritional supplementation with a bioactive lipid could be an effectivestrategy for the treatment of atherosclerosis.
This study and others support the conclusion that PAO supplemen-tation can mitigate more than one component of metabolic syndrome,including insulin resistance and atherosclerosis (7, 28, 33, 36, 90). PAOis a potent inhibitor of lipid-induced ER stress and inflammasomeactivation in mouse and human macrophages and atheroscleroticplaques in vivo. These beneficial changes are associated with dynamiclipidomic remodeling of ER membranes in mice in vivo. Our findingsshow that it is possible to modify organelle stress responses andsuppress inflammasome activity through nutritional supplementationwith PAO. PAO supplementation reduces atherosclerosis in mice,and these results warrant future investigation to assess PAO’s therapeuticpotential in human disease.
SUPPLEMENTARY MATERIALS
www.sciencetranslationalmedicine.org/cgi/content/full/8/358/358ra126/DC1Materials and MethodsFig. S1. Lipid-induced proinflammatory cytokine expression and ER stress prevented by PAO.Fig. S2. Increased desaturation of plasma lipids in PAO-supplemented ApoE−/− mice.Fig. S3. Lipid class composition analysis of plasma from ApoE−/− mice.Fig. S4. Analysis of liver or macrophage ER membrane lipid composition and IRE oligomerizationon ER.Fig. S5. Lipoprotein profile and ER stress status of PAO-supplemented ApoE−/− mice.Fig. S6. Representative images for negative controls in immunofluorescence staining.Table S1. Physical and biochemical characteristics of ApoE−/− mice in PAO-treated and controlgroups.Table S2. Raw data and statistical analyses (provided as an Excel file).References (96–99)
REFERENCES AND NOTES
1. A. Aarsland, D. Chinkes, R. R. Wolfe, Contributions of de novo synthesis of fatty acids tototal VLDL-triglyceride secretion during prolonged hyperglycemia/hyperinsulinemia innormal man. J. Clin. Invest. 98, 2008–2017 (1996).
2. E. J. Parks, M. K. Hellerstein, Carbohydrate-induced hypertriacylglycerolemia: Historical perspec-tive and review of biological mechanisms. Am. J. Clin. Nutr. 71, 412–433 (2000).
3. L. Abu-Elheiga, M. M. Matzuk, P. Kordari, W. Oh, T. Shaikenov, Z. Gu, S. J. Wakil, Mutantmice lacking acetyl-CoA carboxylase 1 are embryonically lethal. Proc. Natl. Acad. Sci. U.S.A.102, 12011–12016 (2005).
4. S. S. Chirala, H. Chang, M. Matzuk, L. Abu-Elheiga, J. Mao, K. Mahon, M. Finegold, S. J. Wakil,Fatty acid synthesis is essential in embryonic development: Fatty acid synthase null mutantsand most of the heterozygotes die in utero. Proc. Natl. Acad. Sci. U.S.A. 100, 6358–6363 (2003).
5. M. V. Chakravarthy, I. J. Lodhi, L. Yin, R. R. Malapaka, H. E. Xu, J. Turk, C. F. Semenkovich,Identification of a physiologically relevant endogenous ligand for PPARa in liver. Cell 138,476–488 (2009).
6. S. Liu, J. D. Brown, K. J. Stanya, E. Homan, M. Leidl, K. Inouye, P. Bhargava, M. R. Gangl, L. Dai,B. Hatano, G. S. Hotamisligil, A. Saghatelian, J. Plutzky, C.-H. Lee, A diurnal serum lipid integrateshepatic lipogenesis and peripheral fatty acid use. Nature 502, 550–554 (2013).
7. H. Cao, K. Gerhold, J. R. Mayers, M. M. Wiest, S. M. Watkins, G. S. Hotamisligil, Identificationof a lipokine, a lipid hormone linking adipose tissue to systemic metabolism. Cell 134,933–944 (2008).
slationalMedicine.org 28 September 2016 Vol 8 Issue 358 358ra126 11

R E S EARCH ART I C L E
on September 30, 2016
http://stm.sciencem
ag.org/D
ownloaded from
8. I. J. Lodhi, L. Yin, A. P. L. Jensen-Urstad, K. Funai, T. Coleman, J. H. Baird, M. K. El Ramahi,B. Razani, H. Song, F. Fu-Hsu, J. Turk, C. F. Semenkovich, Inhibiting adipose tissue lipogenesisreprograms thermogenesis and PPARg activation to decrease diet-induced obesity. Cell Metab.16, 189–201 (2012).
9. M. M. Yore, I. Syed, P. M. Moraes-Vieira, T. Zhang, M. A. Herman, E. A. Homan, R. T. Patel,J. Lee, S. Chen, O. D. Peroni, A. S. Dhaneshwar, A. Hammarstedt, U. Smith, T. E. McGraw,A. Saghatelian, B. B. Kahn, Discovery of a class of endogenous mammalian lipids withanti-diabetic and anti-inflammatory effects. Cell 159, 318–332 (2014).
10. C. A. Riquelme, J. A. Magida, B. C. Harrison, C. E. Wall, T. G. Marr, S. M. Secor, L. A. Leinwand,Fatty acids identified in the Burmese python promote beneficial cardiac growth. Science334, 528–531 (2011).
11. E. Erbay, V. R. Babaev, J. R. Mayers, L. Makowski, K. N. Charles, M. E. Snitow, S. Fazio,M. M. Wiest, S. M. Watkins, M. F. Linton, G. S. Hotamisligil, Reducing endoplasmic reticulumstress through a macrophage lipid chaperone alleviates atherosclerosis. Nat. Med. 15, 1383–1391(2009).
12. G. S. Hotamisligil, R. S. Johnson, R. J. Distel, R. Ellis, V. E. Papaioannou, B. M. Spiegelman,Uncoupling of obesity from insulin resistance through a targeted mutation in aP2, theadipocyte fatty acid binding protein. Science 274, 1377–1379 (1996).
13. L. Makowski, J. B. Boord, K. Maeda, V. R. Babaev, K. T. Uysal, M. A. Morgan, R. A. Parker, J. Suttles,S. Fazio, G. S. Hotamisligil, M. F. Linton, Lack of macrophage fatty-acid-binding protein aP2protects mice deficient in apolipoprotein E against atherosclerosis. Nat. Med. 7, 699–705(2001).
14. K. Maeda, H. Cao, K. Kono, C. Z. Gorgun, M. Furuhashi, K. T. Uysal, Q. Cao, G. Atsumi, H. Malone,B. Krishnan, Y. Minokoshi, B. B. Kahn, R. A. Parker, G. S. Hotamisligil, Adipocyte/macrophagefatty acid binding proteins control integrated metabolic responses in obesity and diabetes.Cell Metab. 1, 107–119 (2005).
15. H. Cao, K. Maeda, C. Z. Gorgun, H.-J. Kim, S.-Y. Park, G. I. Shulman, J. K. Kim, G. S. Hotamisligil,Regulation of metabolic responses by adipocyte/macrophage fatty acid–binding proteins inleptin-deficient mice. Diabetes 55, 1915–1922 (2006).
16. E. Shrago, J. A. Glennon, E. S. Gordon, Comparative aspects of lipogenesis in mammaliantissues. Metabolism 20, 54–62 (1971).
17. G. S. Hotamisligil, D. A. Bernlohr, Metabolic functions of FABPs—Mechanisms and therapeuticimplications. Nat. Rev. Endocrinol. 11, 592–605 (2015).
18. L. Scheja, L. Makowski, K. T. Uysal, S. M. Wiesbrock, D. R. Shimshek, D. S. Meyers, M. Morgan,R. A. Parker, G. S. Hotamisligil, Altered insulin secretion associated with reduced lipolyticefficiency in aP2−/− mice. Diabetes 48, 1987–1994 (1999).
19. Z.-H. Yang, H. Miyahara, A. Hatanaka, Chronic administration of palmitoleic acid reducesinsulin resistance and hepatic lipid accumulation in KK-Ay Mice with genetic type 2 diabetes.Lipids Health Dis. 10, 120 (2011).
20. S. K. Duckett, G. Volpi-Lagreca, M. Alende, N. M. Long, Palmitoleic acid reduces intramuscularlipid and restores insulin sensitivity in obese sheep. Diabetes Metab. Syndr. Obes. 7, 553–563(2014).
21. Z.-H. Yang, J. Takeo, M. Katayama, Oral administration of omega-7 palmitoleic acid inducessatiety and the release of appetite-related hormones in male rats. Appetite 65, 1–7 (2013).
22. X. Guo, H. Li, H. Xu, V. Halim, W. Zhang, H. Wang, K. T. Ong, S. L. Woo, R. L. Walzem,D. G. Mashek, H. Dong, F. Lu, L. Wei, Y. Huo, C. Wu, Palmitoleate induces hepatic steatosis butsuppresses liver inflammatory response in mice. PLOS ONE 7, e39286 (2012).
23. P. Puri, M. M. Wiest, O. Cheung, F. Mirshahi, C. Sargeant, H.-K. Min, M. J. Contos, R. K. Sterling,M. Fuchs, H. Zhou, S. M. Watkins, A. J. Sanyal, The plasma lipidomic signature of nonalcoholicsteatohepatitis. Hepatology 50, 1827–1838 (2009).
24. F. Paillard, D. Catheline, F. Le Duff, M. Bouriel, Y. Deugnier, M. Pouchard, J.-C. Daubert,P. Legrand, Plasma palmitoleic acid, a product of stearoyl-coA desaturase activity, is anindependent marker of triglyceridemia and abdominal adiposity. Nutr. Metab. Cardiovasc. Dis.18, 436–440 (2008).
25. L. Hodson, F. Karpe, Is there something special about palmitoleate? Curr. Opin. Clin. Nutr.Metab. Care 16, 225–231 (2013).
26. S. Fu, S. M. Watkins, G. S. Hotamisligil, The role of endoplasmic reticulum in hepatic lipidhomeostasis and stress signaling. Cell Metab. 15, 623–634 (2012).
27. J. E. Schaffer, Lipotoxicity: When tissues overeat. Curr. Opin. Lipidol. 14, 281–287 (2003).28. N. Stefan, K. Kantartzis, N. Celebi, H. Staiger, J. Machann, F. Schick, A. Cegan, M. Elcnerova,
E. Schleicher, A. Fritsche, H.-U. Häring, Circulating palmitoleate strongly and independentlypredicts insulin sensitivity in humans. Diabetes Care 33, 405–407 (2010).
29. L. Wang, A. R. Folsom, Z. J. Zheng, J. S. Pankow, J. H. Eckfeldt; ARIC Study Investigators,Plasma fatty acid composition and incidence of diabetes in middle-aged adults: The Athero-sclerosis Risk in Communities (ARIC) Study. Am. J. Clin. Nutr. 78, 91–98 (2003).
30. B. Vessby, A. Aro, E. Skarfors, L. Berglund, I. Salminen, H. Lithell, The risk to develop NIDDMis related to the fatty acid composition of the serum cholesterol esters. Diabetes 43, 1353–1357(1994).
31. K. E. Pinnick, M. J. Neville, B. A. Fielding, K. N. Frayn, F. Karpe, L. Hodson, Gluteofemoraladipose tissue plays a major role in production of the lipokine palmitoleate in humans.Diabetes 61, 1399–1403 (2012).
www.ScienceTran
32. R. Roberts, L. Hodson, A. L. Dennis, M. J. Neville, S. M. Humphreys, K. E. Harnden, K. J. Micklem,K. N. Frayn, Markers of de novo lipogenesis in adipose tissue: Associations with smalladipocytes and insulin sensitivity in humans. Diabetologia 52, 882–890 (2009).
33. C. O. Souza, A. A. Teixeira, E. A. Lima, H. A. Batatinha, L. M. Gomes, M. Carvalho-Silva, I. T. Mota,E. L. Streck, S. M. Hirabara, J. C. Rosa Neto, Palmitoleic acid (n-7) attenuates the immuno-metabolic disturbances caused by a high-fat diet independently of PPARa. Mediators Inflamm.2014, 582197 (2014).
34. K. L. Chan, N. J. Pillon, D. M. Sivaloganathan, S. R. Costford, Z. Liu, M. Théret, B. Chazaud, A. Klip,Palmitoleate reverses high fat-induced proinflammatory macrophage polarization via AMP-activated protein kinase (AMPK). J. Biol. Chem. 290, 16979–16988 (2015).
35. N. A. Talbot, C. P. Wheeler-Jones, M. E. Cleasby, Palmitoleic acid prevents palmitic acid-induced macrophage activation and consequent p38 MAPK-mediated skeletal muscle insulinresistance. Mol. Cell. Endocrinol. 393, 129–142 (2014).
36. A. M. Bernstein, M. F. Roizen, L. Martinez, Purified palmitoleic acid for the reduction ofhigh-sensitivity C-reactive protein and serum lipids: A double-blinded, randomized, placebocontrolled study. J. Clin. Lipidol. 8, 612–617 (2014).
37. C. Weber, A. Zernecke, P. Libby, The multifaceted contributions of leukocyte subsets toatherosclerosis: Lessons from mouse models. Nat. Rev. Immunol. 8, 802–815 (2008).
38. C. Weber, H. Noels, Atherosclerosis: Current pathogenesis and therapeutic options. Nat.Med. 17, 1410–1422 (2011).
39. K. J. Moore, F. J. Sheedy, E. A. Fisher, Macrophages in atherosclerosis: A dynamic balance.Nat. Rev. Immunol. 13, 709–721 (2013).
40. J. Bernhagen, R. Krohn, H. Lue, J. L. Gregory, A. Zernecke, R. R. Koenen, M. Dewor, I. Georgiev,A. Schober, L. Leng, T. Kooistra, G. Fingerle-Rowson, P. Ghezzi, R. Kleemann, S. R. McColl,R. Bucala, M. J. Hickey, C. Weber, MIF is a noncognate ligand of CXC chemokine receptorsin inflammatory and atherogenic cell recruitment. Nat. Med. 13, 587–596 (2007).
41. R. R. Koenen, P. von Hundelshausen, I. V. Nesmelova, A. Zernecke, E. A. Liehn, A. Sarabi,B. K. Kramp, A. M. Piccinini, S. R. Paludan, M. A. Kowalska, A. J. Kungl, T. M. Hackeng, K. H. Mayo,C. Weber, Disrupting functional interactions between platelet chemokines inhibits athero-sclerosis in hyperlipidemic mice. Nat. Med. 15, 97–103 (2009).
42. R. R. Koenen, C. Weber, Therapeutic targeting of chemokine interactions in atherosclerosis.Nat. Rev. Drug Discov. 9, 141–153 (2010).
43. P. Duewell, H. Kono, K. J. Rayner, C. M. Sirois, G. Vladimer, F. G. Bauernfeind, G. S. Abela,L. Franchi, G. Nunez, M. Schnurr, T. Espevik, E. Lien, K. A. Fitzgerald, K. L. Rock, K. J. Moore,S. D. Wright, V. Hornung, E. Latz, NLRP3 inflammasomes are required for atherogenesis andactivated by cholesterol crystals. Nature 464, 1357–1361 (2010).
44. H. Wen, D. Gris, Y. Lei, S. Jha, L. Zhang, M. T.-H. Huang, W. J. Brickey, J. P.-Y. Ting, Fatty acid–induced NLRP3-PYCARD inflammasome activation interferes with insulin signaling. Nat.Immunol. 12, 408–415 (2011).
45. K. Schroder, J. Tschopp, The inflammasomes. Cell 140, 821–832 (2010).46. M. F. Gregor, G. S. Hotamisligil, Inflammatory mechanisms in obesity. Annu. Rev. Immunol.
29, 415–445 (2011).47. T. Horng, Calcium signaling and mitochondrial destabilization in the triggering of the
NLRP3 inflammasome. Trends Immunol. 35, 253–261 (2014).48. Y. Wang, G. Z. Wang, P. S. Rabinovitch, I. Tabas, Macrophage mitochondrial oxidative stress
promotes atherosclerosis and nuclear factor-kB–mediated inflammation in macrophages.Circ. Res. 114, 421–433 (2014).
49. A. Abderrazak, T. Syrovets, D. Couchie, K. El Hadri, B. Friguet, T. Simmet, M. Rouis, NLRP3inflammasome: From a danger signal sensor to a regulatory node of oxidative stress andinflammatory diseases. Redox Biol. 4, 296–307 (2015).
50. T. Strowig, J. Henao-Mejia, E. Elinav, R. Flavell, Inflammasomes in health and disease. Nature481, 278–286 (2012).
51. L. L’Homme, N. Esser, L. Riva, A. Scheen, N. Paquot, J. Piette, S. Legrand-Poels, Unsaturatedfatty acids prevent activation of NLRP3 inflammasome in human monocytes/macrophages.J. Lipid Res. 54, 2998–3008 (2013).
52. H. Guo, J. B. Callaway, J. P.-Y. Ting, Inflammasomes: Mechanism of action, role in disease,and therapeutics. Nat. Med. 21, 677–687 (2015).
53. E. Diakogiannaki, N. G. Morgan, Differential regulation of the ER stress response by long-chainfatty acids in the pancreatic b-cell. Biochem. Soc. Trans. 36, 959–962 (2008).
54. R. Sriburi, H. Bommiasamy, G. L. Buldak, G. R. Robbins, M. Frank, S. Jackowski, J. W. Brewer,Coordinate regulation of phospholipid biosynthesis and secretory pathway gene expressionin XBP-1(S)-induced endoplasmic reticulum biogenesis. J. Biol. Chem. 282, 7024–7034(2007).
55. I. Tabas, Cholesterol and phospholipid metabolism in macrophages. Biochim. Biophys. Acta1529, 164–174 (2000).
56. R. Harmancey, C. R. Wilson, N. R. Wright, H. Taegtmeyer, Western diet changes cardiac acyl-CoAcomposition in obese rats: A potential role for hepatic lipogenesis. J. Lipid Res. 51, 1380–1393(2010).
57. N. M. Borradaile, X. Han, J. D. Harp, S. E. Gale, D. S. Ory, J. E. Schaffer, Disruption ofendoplasmic reticulum structure and integrity in lipotoxic cell death. J. Lipid Res. 47, 2726–2737(2006).
slationalMedicine.org 28 September 2016 Vol 8 Issue 358 358ra126 12

R E S EARCH ART I C L E
on September 30, 2016
http://stm.sciencem
ag.org/D
ownloaded from
58. B. Feng, P. M. Yao, Y. Li, C. M. Devlin, D. Zhang, H. P. Harding, M. Sweeney, J. X. Rong,G. Kuriakose, E. A. Fisher, A. R. Marks, D. Ron, I. Tabas, The endoplasmic reticulum is the site ofcholesterol-induced cytotoxicity in macrophages. Nat. Cell Biol. 5, 781–792 (2003).
59. A. V. Korennykh, P. F. Egea, A. A. Korostelev, J. Finer-Moore, C. Zhang, K. M. Shokat,R. M. Stroud, P. Walter, The unfolded protein response signals through high-order assembly ofIre1. Nature 457, 687–693 (2009).
60. R. Volmer, K. van der Ploeg, D. Ron, Membrane lipid saturation activates endoplasmic reticu-lum unfolded protein response transducers through their transmembrane domains. Proc. Natl.Acad. Sci. U.S.A. 110, 4628–4633 (2013).
61. H. Li, A. V. Korennykh, S. L. Behrman, P. Walter, Mammalian endoplasmic reticulum stresssensor IRE1 signals by dynamic clustering. Proc. Natl. Acad. Sci. U.S.A. 107, 16113–16118(2010).
62. T. Seimon, I. Tabas, Mechanisms and consequences of macrophage apoptosis in athero-sclerosis. J. Lipid Res. 50, S382–S387 (2009).
63. S. Han, C.-P. Liang, T. DeVries-Seimon, M. Ranalletta, C. L. Welch, K. Collins-Fletcher, D. Accili,I. Tabas, A. R. Tall, Macrophage insulin receptor deficiency increases ER stress-induced ap-optosis and necrotic core formation in advanced atherosclerotic lesions. Cell Metab. 3, 257–266(2006).
64. A. J. Bowes, M. I. Khan, Y. Shi, L. Robertson, G. H. Werstuck, Valproate attenuatesaccelerated atherosclerosis in hyperglycemic apoE-deficient mice: Evidence in supportof a role for endoplasmic reticulum stress and glycogen synthase kinase-3 in lesion de-velopment and hepatic steatosis. Am. J. Pathol. 174, 330–342 (2009).
65. M. Myoishi, H. Hao, T. Minamino, K. Watanabe, K. Nishihira, K. Hatakeyama, Y. Asada, K.-i. Okada,H. Ishibashi-Ueda, G. Gabbiani, M.-L. Bochaton-Piallat, N. Mochizuki, M. Kitakaze, Increasedendoplasmic reticulum stress in atherosclerotic plaques associated with acute coronarysyndrome. Circulation 116, 1226–1233 (2007).
66. A. X. Zhou, I. Tabas, The UPR in atherosclerosis. Semin. Immunopathol. 35, 321–332 (2013).67. F. Engin, G. S. Hotamisligil, Restoring endoplasmic reticulum function by chemical
chaperones: An emerging therapeutic approach for metabolic diseases. Diabetes Obes.Metab. 12 (suppl. 2), 108–115 (2010).
68. A. R. Tall, L. Yvan-Charvet, Cholesterol, inflammation and innate immunity. Nat. Rev. Immunol.15, 104–116 (2015).
69. R. C. Coll, A. A. B. Robertson, J. J. Chae, S. C. Higgins, R. Muñoz-Planillo, M. C. Inserra, I. Vetter,L. S. Dungan, B. G. Monks, A. Stutz, D. E. Croker, M. S. Butler, M. Haneklaus, C. E. Sutton,G. Nuñez, E. Latz, D. L. Kastner, K. H. G. Mills, S. L. Masters, K. Schroder, M. A. Cooper,L. A. J. O’Neill, A small-molecule inhibitor of the NLRP3 inflammasome for the treatment ofinflammatory diseases. Nat. Med. 21, 248–255 (2015).
70. O. M. Finucane, C. L. Lyons, A. M. Murphy, C. M. Reynolds, R. Klinger, N. P. Healy, A. A. Cooke,R. C. Coll, L. McAllan, K. N. Nilaweera, M. E. O’Reilly, A. C. Tierney, M. J. Morine, J. F. Alcala-Diaz,J. Lopez-Miranda, D. P. O’Connor, L. A. O’Neill, F. C. McGillicuddy, H. M. Roche, Mono-unsaturated fatty acid–enriched high-fat diets impede adipose NLRP3 inflammasome–mediated IL-1b secretion and insulin resistance despite obesity. Diabetes 64, 2116–2128(2015).
71. H. Kraskiewicz, U. FitzGerald, InterfERing with endoplasmic reticulum stress. Trends Pharmacol.Sci. 33, 53–63 (2011).
72. R. Ross, Atherosclerosis—An inflammatory disease. N. Engl. J. Med. 340, 115–126 (1999).73. C. C. Hedrick, Lymphocytes in atherosclerosis. Arterioscler. Thromb. Vasc. Biol. 35, 253–257
(2015).74. F. J. Sheedy, A. Grebe, K. J. Rayner, P. Kalantari, B. Ramkhelawon, S. B. Carpenter, C. E. Becker,
H. N. Ediriweera, A. E. Mullick, D. T. Golenbock, L. M. Stuart, E. Latz, K. A. Fitzgerald, K. J. Moore,CD36 coordinates NLRP3 inflammasome activation by facilitating intracellular nucleation ofsoluble ligands into particulate ligands in sterile inflammation. Nat. Immunol. 14, 812–820(2013).
75. S. Liu, R. K. Alexander, C.-H. Lee, Lipid metabolites as metabolic messengers in inter-organcommunication. Trends Endocrinol. Metab. 25, 356–363 (2014).
76. G. Solinas, J. Borén, A. G. Dulloo, De novo lipogenesis in metabolic homeostasis: Morefriend than foe? Mol. Metab. 4, 367–377 (2015).
77. K. Funai, H. Song, L. Yin, I. J. Lodhi, X. Wei, J. Yoshino, T. Coleman, C. F. Semenkovich,Muscle lipogenesis balances insulin sensitivity and strength through calcium signaling.J. Clin. Invest. 123, 1229–1240 (2013).
78. M. Fantino, Role of lipids in the control of food intake. Curr. Opin. Clin. Nutr. Metab. Care 14,138–144 (2011).
79. L. Eissing, T. Scherer, K. Tödter, U. Knippschild, J. W. Greve, W. A. Buurman, H. O. Pinnschmidt,S. S. Rensen, A. M. Wolf, A. Bartelt, J. Heeren, C. Buettner, L. Scheja, De novo lipogenesis inhuman fat and liver is linked to ChREBP-b and metabolic health. Nat. Commun. 4, 1528(2013).
80. J. M. Lee, Y. K. Lee, J. L. Mamrosh, S. A. Busby, P. R. Griffin, M. C. Pathak, E. A. Ortlund, D. D. Moore,A nuclear-receptor-dependent phosphatidylcholine pathway with antidiabetic effects. Nature474, 506–510 (2011).
81. A. Abderrazak, D. Couchie, D. F. D. Mahmood, R. Elhage, C. Vindis, M. Laffargue, V. Matéo,B. Büchele, M. R. Ayala, M. El Gaafary, T. Syrovets, M.-N. Slimane, B. Friguet, T. Fulop, T. Simmet,
www.ScienceTran
K. El Hadri, M. Rouis, Anti-inflammatory and antiatherogenic effects of the NLRP3 inflam-masome inhibitor arglabin in ApoE2.Ki mice fed a high-fat diet. Circulation 131, 1061–1070(2015).
82. Y.-H. Youm, K. Y. Nguyen, R. W. Grant, E. L. Goldberg, M. Bodogai, D. Kim, D. D’Agostino,N. Planavsky, C. Lupfer, T. D. Kanneganti, S. Kang, T. L. Horvath, T. M. Fahmy, P. A. Crawford,A. Biragyn, E. Alnemri, V. D. Dixit, The ketone metabolite b-hydroxybutyrate blocks NLRP3inflammasome–mediated inflammatory disease. Nat. Med. 21, 263–269 (2015).
83. P. Menu, A. Mayor, R. Zhou, A. Tardivel, H. Ichijo, K. Mori, J. Tschopp, ER stress activatesthe NLRP3 inflammasome via an UPR-independent pathway. Cell Death Dis. 3, e261(2012).
84. S. Hummasti, G. S. Hotamisligil, Endoplasmic reticulum stress and inflammation in obesityand diabetes. Circ. Res. 107, 579–591 (2010).
85. L. Hodson, C. M. Skeaff, B. A. Fielding, Fatty acid composition of adipose tissue andblood in humans and its use as a biomarker of dietary intake. Prog. Lipid Res. 47, 348–380(2008).
86. M. T. Clandinin, S. Cheema, C. J. Field, M. L. Garg, J. Venkatraman, T. R. Clandinin, Dietaryfat: Exogenous determination of membrane structure and cell function. FASEB J. 5, 2761–2769(1991).
87. L. L. Listenberger, X. Han, S. E. Lewis, S. Cases, R. V. Farese Jr., D. S. Ory, J. E. Schaffer,Triglyceride accumulation protects against fatty acid-induced lipotoxicity. Proc. Natl. Acad.Sci. U.S.A. 100, 3077–3082 (2003).
88. A. G. Clamp, S. Ladha, D. C. Clark, R. F. Grimble, E. K. Lund, The influence of dietary lipids onthe composition and membrane fluidity of rat hepatocyte plasma membrane. Lipids 32,179–184 (1997).
89. I. Tabas, S. Marathe, G. A. Keesler, N. Beatini, Y. Shiratori, Evidence that the initial up-regulationof phosphatidylcholine biosynthesis in free cholesterol-loaded macrophages is an adaptiveresponse that prevents cholesterol-induced cellular necrosis. Proposed role of an eventualfailure of this response in foam cell necrosis in advanced atherosclerosis. J. Biol. Chem. 271,22773–22781 (1996).
90. D. Mozaffarian, H. Cao, I. B. King, R. N. Lemaitre, X. Song, D. S. Siscovick, G. S. Hotamisligil,Circulating palmitoleic acid and risk of metabolic abnormalities and new-onset diabetes.Am. J. Clin. Nutr. 92, 1350–1358 (2010).
91. V. A. K. Rathinam, Z. Jiang, S. N. Waggoner, S. Sharma, L. E. Cole, L. Waggoner, S. K. Vanaja,B. G. Monks, S. Ganesan, E. Latz, V. Hornung, S. N. Vogel, E. Szomolanyi-Tsuda, K. A. Fitzgerald,The AIM2 inflammasome is essential for host defense against cytosolic bacteria and DNAviruses. Nat. Immunol. 11, 395–402 (2010).
92. E. Kuroda, K. J. Ishii, S. Uematsu, K. Ohata, C. Coban, S. Akira, K. Aritake, Y. Urade, Y. Morimoto,Silica crystals and aluminum salts regulate the production of prostaglandin in macro-phages via NALP3 inflammasome-independent mechanisms. Immunity 34, 514–526(2011).
93. Y. Qu, S. Misaghi, K. Newton, L. L. Gilmour, S. Louie, J. E. Cupp, G. R. Dubyak, D. Hackos,V. M. Dixit, Pannexin-1 is required for ATP release during apoptosis but not for inflammasomeactivation. J. Immunol. 186, 6553–6561 (2011).
94. M. G. Netea, C. A. Nold-Petry, M. F. Nold, L. A. B. Joosten, B. Opitz, J. H. M. van der Meer,F. L. van de Veerdonk, G. Ferwerda, B. Heinhuis, I. Devesa, C. J. Funk, R. J. Mason, B. J. Kullberg,A. Rubartelli, J. W. M. van der Meer, C. A. Dinarello, Differential requirement for the activationof the inflammasome for processing and release of IL-1b in monocytes and macrophages.Blood 113, 2324–2335 (2009).
95. G. M. Keegan, J. D. Smart, M. J. Ingram, L.-M. Barnes, G. R. Burnett, G. D. Rees, Chitosanmicroparticles for the controlled delivery of fluoride. J. Dent. 40, 229–240 (2012).
96. T. Nakamura, M. Furuhashi, P. Li, H. Cao, G. Tuncman, N. Sonenberg, C. Z. Gorgun, G. S. Hotamisligil,Double-stranded RNA-dependent protein kinase links pathogen sensing with stress and meta-bolic homeostasis. Cell 140, 338–348 (2010).
97. A. G. Lerner, J.-P. Upton, P. V. K. Praveen, R. Ghosh, Y. Nakagawa, A. Igbaria, S. Shen, V. Nguyen,B. J. Backes, M. Heiman, N. Heintz, P. Greengard, S. Hui, Q. Tang, A. Trusina, S. A. Oakes,F. R. Papa, IRE1a induces thioredoxin-interacting protein to activate the NLRP3 inflammasomeand promote programmed cell death under irremediable ER stress. Cell Metab. 16, 250–264(2012).
98. S. Fu, L. Yang, P. Li, O. Hofmann, L. Dicker, W. Hide, X. Lin, S. M. Watkins, A. R. Ivanov,G. S. Hotamisligil, Aberrant lipid metabolism disrupts calcium homeostasis causing liver endo-plasmic reticulum stress in obesity. Nature 473, 528–531 (2011).
99. M. Furuhashi, G. Tuncman, C. Z. Görgün, L. Makowski, G. Atsumi, E. Vaillancourt, K. Kono,V. R. Babaev, S. Fazio, M. F. Linton, R. Sulsky, J. A. Robl, R. A. Parker, G. S. Hotamisligil,Treatment of diabetes and atherosclerosis by inhibiting fatty-acid-binding protein aP2.Nature 447, 959–965 (2007).
Acknowledgments: We express our appreciation to B. Gültekin and S. B. Widenmaier for as-sistance with the studies, K. Claiborn for critical reading and editing of the manuscript, C. Sonfor valuable advice on confocal imaging and analysis, P. Walter for GFP-IRE1 and KDEL plas-mids, R. G. Roeder for the anti-TBP antibody, and Metabolon for lipidomic analysis. Funding:Marie Curie Reintegration Grant (Lipokines 276922). Author contributions: I.Ç. performed the
slationalMedicine.org 28 September 2016 Vol 8 Issue 358 358ra126 13

R E S EARCH ART I C L E
in vivo mouse atherosclerosis study, en face aorta staining, cytokine ELISAs, cell cultureexperiments, and qRT-PCRs. B.K. performed immunofluorescence and collagen staining of le-sions. S.K. and Ö.T. performed cell culture experiments related to inflammasomes, qRT-PCRs,and Western blots. O.A. performed immunofluorescence staining of lesions and helped withfigure preparation. U.I.O. performed cell culture experiments and confocal microscopy imag-ing. A.D.Y. performed IRE1 oligomerization assays. Z.G.A. performed atherosclerosisexperiments. Ş.D. performed cell culture experiments and qRT-PCR for inflammatory markers.I.Ç., B.K., and S.K. contributed to the writing of the manuscript. U.T.N. and S.M.W. analyzed thelipidomics data and critically read and edited the manuscript. G.S.H. analyzed the data andcritically read and edited the manuscript. E.E. conceptualized the project, designed anddirected the experiments, analyzed the data, and wrote the manuscript. Competing interests:G.S.H. received funding from UCB (Union Chimique Belge) and Servier for other projects,
www.ScienceTran
which was not used for the current study. S.M.W. and U.T.N. are employees of Metabolon,which carried out the lipidomic analysis.
Submitted 19 April 2016Accepted 9 August 2016Published 28 September 201610.1126/scitranslmed.aaf9087
Citation: I. Çimen, B. Kocatürk, S. Koyuncu, Ö. Tufanlı, U. I. Onat, A. D. Yıldırım, O. Apaydın,Ş. Demirsoy, Z. G. Aykut, U. T. Nguyen, S. M. Watkins, G. S. Hotamışlıgil, E. Erbay, Preventionof atherosclerosis by bioactive palmitoleate through suppression of organelle stress andinflammasome activation. Sci. Transl. Med. 8, 358ra126 (2016).
slationalMedicine.org 28 September 2016 Vol 8 Issue 358 358ra126 14
on September 30, 2016
http://stm.sciencem
ag.org/D
ownloaded from

10.1126/scitranslmed.aaf9087] (358), 358ra126. [doi:8Science Translational Medicine
Hotamisligil and Ebru Erbay (September 28, 2016) Zaliha G. Aykut, Uyen T. Nguyen, Steven M. Watkins, Gökhan S.Umut I. Onat, Asli D. Yildirim, Onur Apaydin, Seyma Demirsoy, Ismail Çimen, Begüm Kocatürk, Seda Koyuncu, Özlem Tufanli,suppression of organelle stress and inflammasome activationPrevention of atherosclerosis by bioactive palmitoleate through
Editor's Summary
severity of atherosclerosis in mouse models.metabolic stress in a variety of tissues as well as in atherosclerotic plaques and thus decreases the small amounts. Using human cells and mouse models, the authors demonstrate that palmitoleate reducesthat can be produced directly by the human body and is also found in a variety of foods, but only in
. identifies a type of fat that is not only harmless but also protective. Palmitoleate is a lipidet alÇimen Although fatty foods often have a bad reputation when it comes to atherosclerosis, a study by
Artery-saving fat
This information is current as of September 30, 2016. The following resources related to this article are available online at http://stm.sciencemag.org.
Article Tools
http://stm.sciencemag.org/content/8/358/358ra126article tools: Visit the online version of this article to access the personalization and
MaterialsSupplemental
http://stm.sciencemag.org/content/suppl/2016/09/26/8.358.358ra126.DC1"Supplementary Materials"
Related Content
http://stm.sciencemag.org/content/scitransmed/5/166/166ra1.fullhttp://stm.sciencemag.org/content/scitransmed/6/239/239sr1.fullhttp://stm.sciencemag.org/content/scitransmed/7/275/275ra20.fullhttp://stm.sciencemag.org/content/scitransmed/8/333/333ra50.full
's sites:ScienceThe editors suggest related resources on
Permissionshttp://www.sciencemag.org/about/permissions.dtlObtain information about reproducing this article:
is a registered trademark of AAAS.MedicineScience TranslationalAssociation for the Advancement of Science; all rights reserved. The title
Science, 1200 New York Avenue, NW, Washington, DC 20005. Copyright 2016 by the Americanweekly, except the last week in December, by the American Association for the Advancement of
(print ISSN 1946-6234; online ISSN 1946-6242) is publishedScience Translational Medicine
on September 30, 2016
http://stm.sciencem
ag.org/D
ownloaded from

Supplementary Materials for
Prevention of atherosclerosis by bioactive palmitoleate through
suppression of organelle stress and inflammasome activation
Ismail Çimen, Begüm Kocatürk, Seda Koyuncu, Özlem Tufanlı, Umut I. Onat,
Asli D. Yıldırım, Onur Apaydın, Şeyma Demirsoy, Zaliha G. Aykut, Uyen T. Nguyen,
Steven M. Watkins, Gökhan S. Hotamışlıgil, Ebru Erbay*
*Corresponding author. Email: [email protected]
Published 28 September 2016, Sci. Transl. Med. 8, 358ra126 (2016)
DOI: 10.1126/scitranslmed.aaf9087
The PDF file includes:
Materials and Methods
Fig. S1. Lipid-induced proinflammatory cytokine expression and ER stress
prevented by PAO.
Fig. S2. Increased desaturation of plasma lipids in PAO-supplemented ApoE−/−
mice.
Fig. S3. Lipid class composition analysis of plasma from ApoE−/− mice.
Fig. S4. Analysis of liver or macrophage ER membrane lipid composition and
IRE oligomerization on ER.
Fig. S5. Lipoprotein profile and ER stress status of PAO-supplemented ApoE−/−
mice.
Fig. S6. Representative images for negative controls in immunofluorescence
staining.
Table S1. Physical and biochemical characteristics of ApoE−/− mice in PAO-
treated and control groups.
References (96–99)
Other Supplementary Material for this manuscript includes the following:
(available at
www.sciencetranslationalmedicine.org/cgi/content/full/8/358/358ra126/DC1)
Table S2. Raw data and statistical analyses (provided as an Excel file).
www.sciencetranslationalmedicine.org/cgi/content/full/8/358/358ra126/DC1

Materials and Methods
Study design:
All cell culture experiments were performed at least three independent times. QPCR samples
were analyzed in technical duplicates and experimental quadruplicates. All the mouse
experiments were done in two to three independent cohorts. All in vivo experiments and their
quantitative analysis (such as atherosclerotic lesion analysis and immunofluorescent and
immunohistochemical staining quantifications) were performed blind. Elimination criteria for
outliers were based on visible health of the individual mice and determined in agreement with a
veterinarian. Mice that appeared sick or experienced substantial weight loss (more than 20% of
their body mass at the beginning of the study) were eliminated from all analysis.
Reagents and plasmids:
Tissue culture reagents: DMEM, RPMI, L-glutamine, penicillin/streptomycin, PBS, and HBSS
were obtained from HyClone, and fetal bovine serum (FBS), HEPES, and Trypsin-EDTA were
obtained from GIBCO. Ultrapure LPS, fatty acid-free BSA, palmitate, palmitoleate, NaCl,
EDTA, NaF, Triton, sodium orthovanadate (Na3VO4), phenylmethanesulfonylfluoride (PMSF),
and phosphatase inhibitor cocktail-3 were obtained from Sigma Aldrich. Palmitoleate used in
mouse studies was from NuCheck Prep. The pCMV-Myc-GFP-KDEL plasmid and pcDNA5-
IRE1-3F6HGFP-FRT plasmid were obtained from Peter Walter (UCSF) (61).
Cell culture and stimulation:
BMDMs were derived from tibiae and femurs of the indicated mice and cultured in the presence
of conditioned medium from L929 cells (ATCC) and RPMI-1640 (Hyclone). BMDMs
constituted more than 95% of the proliferating cells as assessed by flow cytometry. THP-1 cells
(ATCC) were grown in RPMI with 10% FBS. PA and PAO (from Sigma) were dissolved in
absolute ethanol to produce a main stock concentration of 500 mM and stock solutions were
stored at −20 °C. Palmitate and palmitoleate were conjugated with 1% BSA (fatty acid-free) as
described earlier (11, 96). Before treatment with lipids, cells were stimulated with ultrapure LPS
(200 ng/ml; Sigma) for 3 hours. Then, cells were stimulated with ethanol-BSA (negative
control), palmitate-BSA (1000 µM, or palmitoleate-BSA (1000 µM for the indicated amounts of
time. Proteins (from cells or conditioned medium) and RNA were isolated from the cells as
described earlier (11). PBMCs were bought from Zenbio and grown in Lymphocyte Medium
(RPMI 1640, L-glutamine, FBS, penicillin/streptomycin). Before treatment with lipids, cells
were stimulated with ultrapure LPS (200 ng/ml) for 3 hours. Then, cells were stimulated with
ethanol-BSA (negative control), palmitate-BSA (500 µM or palmitoleate-BSA (500 µM for the
indicated amounts of time. Cells were seeded at a density of 2 x 10⁶ cells/ml and primed with
200 ng/ml LPS for 3 hours before treatment with different inflammasome inducers such as 5 mM
ATP (Sigma), 200 μg/ml Imject Alum (Thermo Scientific), 100 g/ml chitosan, 10 μg/ml MDP,
or 1 μg/ml flagellin either alone or in combination with palmitoleate-BSA (1000 µM (91-95).
Finally, Poly(dA-dT) DNA was transfected using Lipofectamine-3000 (Invitrogen) at a
concentration of 5 μg/ml, and then cells treated with palmitoleate-BSA (1000 µM for the
indicated times (91).

qRT-PCR:
Total RNA was extracted with Trisure reagent (Bioline) and converted to cDNA with Revert Aid
First Strand cDNA Synthesis Kit (Thermo Scientific). Using specific primers, cDNAs were
amplified on Light Cycler 480II (Roche) or Rotor Gene (Qiagen). The formula that was used for
calculating expression changes is as follows: (primer efficiency)-ΔΔCt where ΔΔCt means ΔCt
(target gene) - ΔCt (reference gene) and Ct means (threshold cycle). Results are representative
from three or more independent experiments that were quantified and analyzed by Student’s t-
test. The following primers were used:
mIL-1-Frw:5′-CAACCAACAAGTGATATTCTCCATG-3′;
mIL-1-Rev:5′-GATCCACACTCTCCAGCTGCA-3′;
mTNF-Frw:5′-CATCTTCTCAAAATTCGAGTGACAA-3′;
mTNF-Rev:5′-TGGGAGTAGACAAGGTACAACCC-3′;
mMCP1-Frw: 5′- CTTCTGGGCCTGCTGTTCA-3′
mMCP1-Rev: 5′-CCAGCCTACTCATTGGGATCA-3’
mIL6-Frw: 5′- GAGGATACCACTCCCAACAGACC-3′
mIL6-Rev: 5′- AAGTGCATCATCGTTGTTCATACA-3′
mXbp1-Frw: 5′-TGAGAACCAGGAGTTAAGAACACGC-3′;
mXbp1-Rev: 5′-CCTGCACCTGCTGCGGAC-3′;
mGAPDH-Frw:5′-GTGAAGGTCGGTGTGAACG-3′;
mGAPDH-Rev: 5′- GGTCGTTGATGGCAACAATCTC -3′.
hIL1-Frw: 5′- TTACAGTGGCAATGAGGATGAC-3′
hIL1-Rev: 5′- GTCGGAGATTCGTAGCTGGAT-3′
hTNF-Frw:5′-CCCAGGGACCTCTCTCTAATCA -3′;
hTNF-Rev: 5′-AGCTGCCCCTCAGCTTGAG-3′;
hMCP1-Frw: 5′- CTTCTGCGCCTGCTGTTCA-3′;
hMCP1-Rev: 5′-CCAGCCTACTCATTGGGATCA-3′.
hIL6-Frw: 5′-ACTCACCTCTTCAGAACGAATTG-3′.
hIL6-Rev: 5′-CCATCTTTGGAAGGTTCAGGTTG-3′.
hGAPDH-Frw: 5′-GACCACAGTCCATGCCATCACT-3′.
hGAPDH-Rev: 5′-TCCACCACCCTGTTGCTGTAG-3′.
hsXBP1-Rev: 5’-GCTGGCAGGCTCTGGGGAAG -3’
hsXBP1-Frw: 5’-TGCTGAGTCCGCAGCAGGTG-3’
Measurements of IL-1β and IL-18:
The IL-1β ELISA Kit (Abcam) was used for detecting IL-1β in mouse plasma and conditioned
medium of BMDM cultures, and the results were quantified according to manufacturer’s
instructions. The Mouse IL-18 ELISA Kit (Medical&Biolological Laboratories) was used for
detecting IL-18 in mouse plasma and quantified according to manufacturer’s instructions.
IRE1 oligomerization: Transfections were performed using Lipofectamaine 2000 (Invitrogen) and PEI reagent (Roche).
IRE1-3F6HGFP expressing HEK-293 stable cell lines were generated as published (61). 1x10⁶
cells HEK-293 stable cells on cover slips were treated with BSA (control), palmitate-BSA (500
µM), or palmitoleate-BSA (500 µM) alone or in combination for 6 hours. Images of the cells
were acquired on Leica DMI 4000B equipped with Andor DSD2 spinning disk confocal

microscope (Cagdas Son Lab, Middle East Technical University, Ankara, Turkey).
Oligomerization analysis was performed according to previously published protocols by
counting IRE1 foci in >100 cells from multiple replicates for each treatment (61).
Immunoblot analysis: Cells were scraped with lysis buffer, which contained 50 mM HEPES pH:7.9, NaCl (100 mM),
EDTA (10 mM), NaF (10 mM), NaPP (4 mM), 1% Triton, sodium orthovanadate (2 mM), PMSF
(1 mM), 1X phosphatase inhibitor cocktail 3 (Sigma), and protease inhibitor cocktail (10 µM;
Sigma), then centrifuged at 13000 rpm at 4°C for 10 minutes. The Bradford assay (Sigma) was
used to measure total protein amount. Proteins from conditioned cell medium were precipitated
with methanol:chloroform as described previously (97). Lysates were mixed with 5X SDS
loading dye and heated at 95°C for 5 minutes before loading on SDS-PAGE gels. Proteins were
then transferred to PVDF membranes. The following primary antibodies were used for protein
analysis: caspase-1 (M20) (Santa Cruz Biotechnology, sc-514); phospho-AMPKα (Thr172) (Cell
Signaling, 2531S); β tubulin (Santa Cruz Biotechnology, sc-9104), AMPK (Cell Signaling), e-
cadherin (Santa Cruz Biotechnology), TBP (from Robert G. Roeder Lab, Rockefeller University,
USA), IRE1 (Cell Signaling, 3294S), sXbp1 (Biolegend, 619502), and IL-1β (R&D Systems).
The following secondary antibodies were used: HRP-tagged anti-mouse, -rabbit, and anti-goat
antibodies (Santa Cruz Biotechnology). Detection was performed with ECL Prime Western Blot
Detection Kit (Amersham Pharmacia).
ER isolation: ER isolation proceeded as published previously for livers, but with minor modifications for
RAW-264.7 macrophages (98) . Briefly, 1x10⁸ cells were treated with ethanol+BSA, PA (500
µM), PA (500 µM)+PAO (500 µM), or PAO (500 µM) for 6 h. Cells were suspended with
hypotonic extraction buffer (10 mM HEPES, pH 7.8, 25 mM potassium chloride, and 1 mM
EGTA and 1x protease inhibitor cocktail), incubated for 30 minutes at 4 °C, and centrifuged at
600 g for 5 minutes, after which the supernatant was removed by aspiration. We then added
isotonic extraction buffer (10 mM HEPES, pH 7.8, 250 mM sucrose, 25 mM potassium
chloride, 1 mM EGTA, and protease inhibitor cocktail), followed by homogenization (30
strokes) with a Dounce homogenizer. The whole lysates were cleared by centrifugation at 1,000
g for 10 minutes at 4 oC, followed by a two additional centrifugations (12,000 g for 15 minutes
and 100,000 g for 60 minutes at 4 oC) to obtain the final ER pellet. The pellet was washed with 5
ml of ice-cold PBS and subjected to centrifugation to obtain the final ER preparation, which was
snap frozen in liquid nitrogen for lipidomic analysis.
Mouse models, dietary treatments, and experimental procedures:
Animal care and experimental procedures were performed according to the local animal care and
ethical review committee guidelines accepted at İhsan Dogramaci Bilkent University. ApoE-
deficient mice on a C57Bl/6 background (Charles River WIGA GesmbH) were maintained in a
clean environment on a regular light-dark cycle (14 h light, 10 h dark). To study atherosclerotic
lesion formation, 6-week-old male ApoE-deficient mice were fed a Western diet (TD88137 mod.
containing 21% fat and 0.2% cholesterol) (Ssniff) for 12 weeks. After 12 weeks of Western diet,
the mice were treated by oral gavage with vehicle (1 % BSA in PBS) or 1400 mg/kg/day PAO
dissolved in vehicle for 4 weeks while continuing on Western diet. Weight and blood glucose
concentrations were determined before PAO treatment and continued weekly during PAO
treatment. At the end of the experiment, the mice were anesthetized, and blood was collected

from the left ventricle by cardiac puncture. Perfusion was performed via the left ventricle with
ice-cold PBS+heparin (1000 U/ml), followed by another perfusion with 10% formalin. Adipose
tissue, spleen, muscle, and liver were removed after the PBS perfusion and stored at -80oC. The
aorta was dissected intact and immediately immersed in 10% formalin. The heart was removed at
the proximal aorta, and the upper half was placed into a tissue mold, covered with OCT (Tissue-
Tek), and flash frozen.
Lipidomic analysis:
Lipidomic analysis of BMDM (n=4), RAW-264.7 macrophages’ ER fractions (n=4), liver ER
(n=5), plasma (n=6), and tissues including aorta (n=4), muscle, liver, and adipose tissues
(control; n=4 and PAO; n=6) were performed by Metabolon. The analysis was performed as
previously described (7). Lipids from plasma, muscle, liver, and adipose tissue were extracted in
chloroform:methanol in the presence of internal standards. Neutral lipids were separated from
polar lipids by solid phase chromatography. The polar lipid fraction was separated into
individual lipid classes by HPLC, and the lipid class fractions were collected for fatty acid
analysis. Neutral lipids were separated into individual lipid classes by thin-layer
chromatography, and the lipid class fractions were collected for fatty acid analysis. Individual
fatty acids were separated and quantified by capillary gas chromatography (Agilent Technologies
model 6890) equipped with a 30 m HP-88 capillary column (Agilent Technologies) and a flame
ionization detector. The absolute concentration of each fatty acid in the original sample was
determined by comparing the peak area to that of the internal standard. Lipid class
concentrations were calculated by summing the concentration of all fatty acids present in the
class. Data were reported as both quantitative (nmol per gram of material or μM as indicated in
the figures) and normalized (mole percentage of all fatty acids) results. Lipids from BMDM,
RAW-264.7 macrophages’ ER fractions, liver ER fractions, and aortas were extracted from
samples in methanol:dichloromethane in the presence of internal standards. The extracts were
concentrated under nitrogen and reconstituted in 0.25 mL of 10 mM ammonium acetate
dichloromethane:methanol (50:50). The extracts were transferred to inserts and placed in vials
for infusion-MS analysis, performed on a Shimazdu LC with nano PEEK tubing and the Sciex
SelexIon-5500 QTRAP. The samples were analyzed by both positive and negative mode
electrospray. The 5500 QTRAP scan was performed in MRM mode with a total of more than
1,100 MRMs. Individual lipid species were quantified by taking the peak area ratios of target
compounds and their assigned internal standards, then multiplying by the concentration of
internal standard added to the sample. Lipid class concentrations were calculated from the sum
of all molecular species within a class, and fatty acid compositions were determined by
calculating the proportion of each class comprised of individual fatty acids. Quantitative analysis
were for the following:
(A) lipid classes: CE, FA, DAG, TAG, PC, LPC phosphatidylethanolamine (PE), phosphatidyl-
serine (PS), phosphatidylglycerol (PG), cardiolipin, and sphingomyelin
(B) fatty acids: 14:0, 15:0, 16:0, 18:0, 20:0, 22:0, 24:0, 14:1n5, 16:1n7, 18:1n7, 18:1n9, 20:1n9,
20:3n9, 22:1n9, 24:1n9, 18:2n6, 18:3n6, 20:2n6, 20:3n6, 20:4n6, 22:2n6, 22:4n6, 22:5n6,
18:3n3, 18:4n3, 20:3n3, 20:4n3, 20:5n3, 22:5n3, 22:6n3, 24:6n3, plasmalogen derivatives of
16:0, 18:0, 18:1n7, 18:1n9, t16:1n7, t18:1n9, and t18:2n6.

Quantification of total plaque area in en face aortas:
The aortas were cleaned of any adventitial and fat tissue, cut open longitudinally, and pinned flat
on a black wax surface. The aortas were stained with Sudan IV as described earlier (99). Aorta
images were captured through a stereomicroscope (Leica S8 APO) with a digital camera (Leica
MC-120). Lesion area was quantified using ImageJ software according to published protocols
and expressed as percent stained area relative to total aortic area (99). All quantifications were
carried out by an observer blind to the sample identities.
Aortic sinus sections and staining:
The OCT-embedded aortas were sectioned with a cryostat, and 7 µm sections were obtained
sequentially beginning at the aortic valve. Sections were stained with hematoxylin- eosin and oil
red o according to previously published protocols (99). Mean lesion area (from oil red O
staining) and necrotic area (from H&E staining) for each mouse was calculated by measuring
cross sections every 60 μm of the first 180 μm in the ascending aorta, starting from the aortic
cusp in accord with previously published protocols (63). Collagen content of the lesions was
determined with Masson’s trichrome staining as per the manufacturer’s protocol (Bio-Optica).
Atherosclerotic lesion area, necrotic area, and collagen area were measured using ImageJ
software. All quantifications were carried out by an observer blind to the sample identities.
Plasma measurements:
Particle size distribution of the lipoproteins was determined by fast-performance liquid
chromatography (FPLC) using pooled samples of plasma at the Mouse Metabolic Phenotyping
Center at the University of Cincinnati. Lipoprotein fractions were isolated using columns
arranged in tandem to achieve complete resolution of the major lipoprotein classes from plasma.
The columns were equilibrated in 50 mM phosphate-buffered saline. Fractions (0.5 ml) were
collected and the position of the major lipoprotein classes was determined by cholesterol (or
triglyceride) assay on the column fractions using a microtiter plate enzyme-based assay.
Immunofluorescence staining of lesions:
All immunofluorescent staining was conducted on 7 µm thick frozen aortic root sections. Slides
containing aortic root sections were fixed in acetone and blocked with 6% BSA+ 10% serum
(specific to the species in which the secondary antibodies were raised) in PBS. For the
determination of macrophage area, sections were stained with anti-MOMA-2 (1:50; ab33451;
Abcam). The macrophage area was quantified as the percentage of MOMA-2 positive area in
total lesion area. Apoptotic macrophages in lesions were detected with TUNEL assay kit (in situ
cell death detection kit, fluorescein; product no: 11684795910, Roche). The results were
calculated as apoptotic cell number divided by total lesion area (mm2). For measuring T cell
quantity, sections were stained with anti-CD3-Alexa488 (1:400; Biolegend clone 17A2). The
results were calculated as T cell number divided by total lesion area (mm2). To analyze VSMC
content, lesions were stained with anti α-SMA (1:150; ab5694; Abcam). The signal area of
intimal VSMCs was calculated and represented as the percentage of total lesion area. For the
detection of macrophage-related ER stress, the sections were stained with either p-eIF2α (1:100;
44-728G; Life Technologies) or ATF3 (1:50; sc-188; Santa Cruz Biotechnology) in combination
with MOMA-2. To detect IL-1β in atherosclerotic lesions, the sections were stained with IL-1β
antibody (1:50, ab9722, Abcam). The intensity of p-eIF2α/ ATF3 and IL-1β signals was
measured in macrophage-enriched or lesion areas, respectively, as described previously (11).

After all imunofluorescent stainings, sections were counterstained with DAPI to label nuclei and
mounted with antifade reagent (ProLong Gold). Images were taken on a Zeiss fluorescent
microscope and analysis were performed with ImageJ software. All quantifications were carried
out by an observer blind to sample identity.
Statistical analysis:
Original data and all significant p values are included in Table S2. Basic analyses were
performed with Excel (Microsoft) and Prism (GraphPad Software, Inc.).
qRT-PCR, ELISA: data are expressed as means ± S.E.M. Statistical significance was evaluated
using unpaired two-tailed Student’s t test or by one-way ANOVA (for more than two groups),
where indicated.
Lesion analysis, IHC analysis and IRE1 oligomerization analysis: data are expressed as mean ±
S.E.M. Statistical significance was evaluated using two-tailed Mann-Whitney U test. p<0.05 was
considered statistically significant.
Lipidomics analysis:
(A) Quantitative lipid class concentration and fatty acid composition analysis: means and
standard errors were reported. No samples were treated as outliers and left out of analysis. Using
Wilcoxon signed-rank test, we compared measurements from plasma and aortas of the PAO-
treated group to that of the control group. Non-parametric Kruskal Wallis test was used to
compare mean differences in fatty acids among four treatment groups in BMDM and RAW-
264.7 macrophages’ ER fractions. Differences in measurements among all groups were
considered significant if p<0.05. Statistical significance of a difference between treatments was
evaluated using unpaired two-tailed Student’s t test.
(B) Heatmap: these display the regulation of lipid composition in each lipid class by PAO in
plasma and aortas. The observed data were normalized to the control group. For plasma and
aortas: t-statistics were showed in red squares over the distribution of t-statistics from permuted
data. The black line was the 95th percentile of the t-statistics over 1000 permutations. For
BMDM and ER fractions from RAW-264.7 macrophages: F-statistics were shown in red squares
over the distribution of t-statistics from permuted data. The black line was the 95th percentile of
the standardized F-statistics over 1000 permutations. Squares at both ends of the line showed
significant differences at an alpha level of 5%. Statistical analyses were conducted using R
statistical computing software.
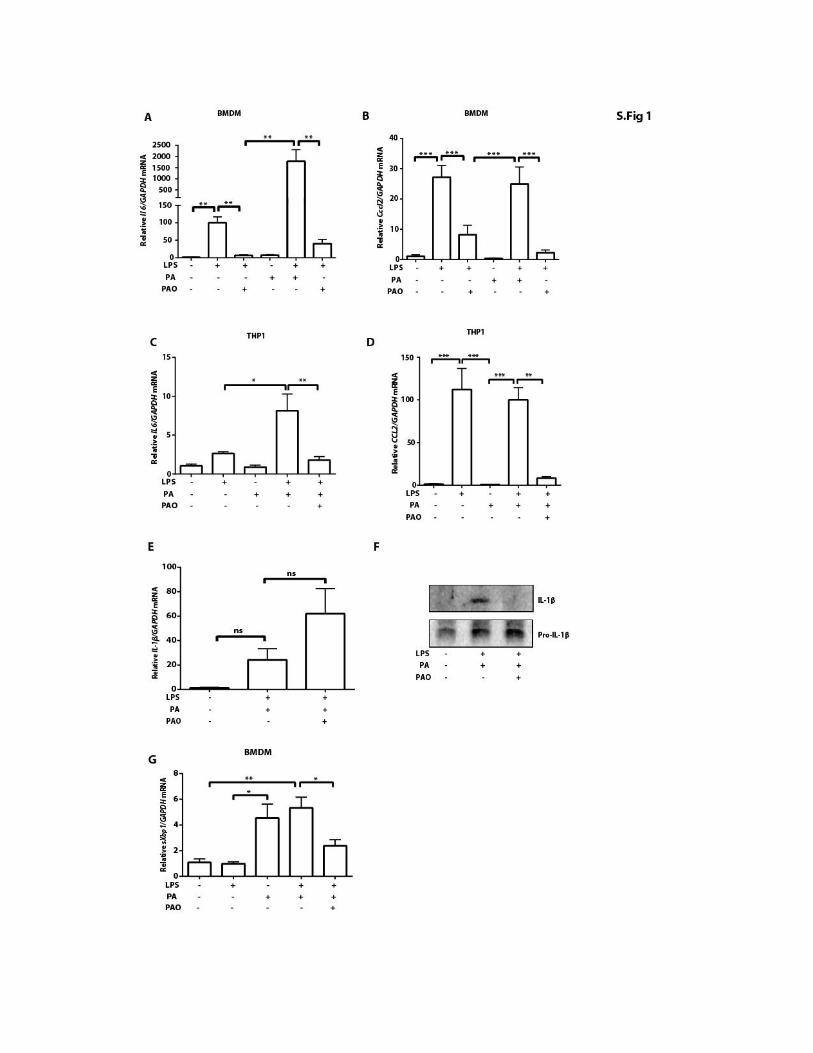

Fig. S1: Lipid- induced proinflammatory cytokine expression and ER stress prevented by PAO. (A-B) LPS-primed
mouse BMDMs were treated with PA or PAO alone or together, and then analyzed by qRT-PCR for (A) Il-6 and (B) Ccl2. (C-
D) LPS-primed THP-1 were treated with PA or PAO alone or together, and then analyzed by qRT-PCR for (C) IL-6 and (D)
CCL2. (E-F) LPS-primed human PBMCs were treated with PA or PAO alone or together, and then analyzed (E) by qRT-PCR
for IL-1 mRNA or (F) by Western blot for pro- and mature IL-1. (G) LPS-primed mouse BMDMs were treated with PA or
PAO alone or together and analyzed for sXbp1 mRNA changes by qRT-PCR. Data are represented as mean ± SEM;
*P<0.05,**P<0.01,***P<0.001, n≥3. One-way ANOVA test was used for statistical analysis in A-E and G.


Fig. S2: Increased desaturation of plasma lipids in PAO-supplemented ApoE-/- mice. Plasma was collected from PAO-
treated and control ApoE-/- mice on Western diet and analyzed. (A) The mean concentration of PAO (C16:1n7) (expressed as
nmol per gram of sample). (B) MUFA/SFA ratio. (C) Th e me a n concentration of lipid metabolites (nmol/gram). (D) The
mean concentration of PAO (C16:1n7) (mole %; expressed as the ratio of moles of fatty acids to total moles of fatty acids) in
various lipid classes. (E) The mean concentration of each phospholipid (nmol/gram). (F) The mean concentration of PAO
(C16:1n7) in each phospholipid (mole %). Data are represented as means ± SEM; *P < 0.05, **P < 0.01, n= 6. Unpaired two-
tailed Student’s t-test (in A, B,C, and E) and Wilcoxon test (in D and F) were used for statistical analysis.

Fig. S3: Lipid class composition analysis of plasma from ApoE-/- mice. Plasma was collected from PAO-treated and control
ApoE-/- mice on Western diet and analyzed. (A-F) The heat maps display lipid class composition analysis for (A) TAG, (B)
CE, (C) DG, (D) PC, (E) PE, and (F) LY. In the heat maps, x-axis shows each lipid metabolite measurement in each sample (y-axis) as up-regulated (red) or down-regulated (green), as determined by centering to the mean of the control group and scaling by
the standard deviation of all observations. In the line plots, y-axis shows the t-statistics from comparing two groups. The black
line is the 95th percentile of the standardized statistics over 1000 permutations. The red dots are the z-scores of the observed
statistics that were standardized to 1000 permutations. Data are represented as means ± SEM; *P < 0.05, n= 6.


Fig. S4: Analysis of liver or macrophage ER membrane lipid composition and IRE oligomerization on ER. (A-D) Liver ER
fractions were isolated. (A) Various cellular fractions obtained during the procedure were validated by western blotting with
anti-IRE1, e-cadherin, -tubulin, and TATA-binding protein (TBP) antibodies. (B-D) Liver ER fractions were analyzed by
lipidomics. The heat maps display lipid class composition analysis for (B) DAG, (C) PS, and (D) TAG. In the heat maps, x-
axis shows each lipid metabolite measurement in each sample (y-axis) as up-regulated (red) or down-regulated (green) by
centering to the mean of the control group and scaling by the standard deviation of all observations. In the line plot, y-axis shows
the t-statistics from comparing two groups. The black line is the 95th percentile of the standardized statistics over 1000
permutations. The red dots are the z-scores of the observed statistics that were standardized to 1000 permutations (n=5). (E) ER
fractions were isolated from RAW293.6 macrophages. The various fractions obtained during the procedure were validated by
western blotting with antibodies against IRE1, e-cadherin, -tubulin, and TATA-binding protein (TBP). (F) RAW 293.6
macrophages were treated with PA or PAO alone or together, and lysates were analyzed by western blotting with antibodies
against p-IRE1, IRE1, sXBP1, and β-actin. (G-I) HEK293 cells with stable expression of GFP-IRE1 (green) and KDEL-
cherry (red; to mark the ER) were treated with PA or PAO alone or together for 6 hours and analyzed for (G) distinct IRE1
oligomer foci formation on the ER (yellow dots) by confocal microscopy. Representative confocal images are shown for the
experiment. Scale bar: 20 M. (H) Induction of sXBP1 protein and IRE1 expression was analyzed by Western blotting and by
measuring (I) sXBP1mRNA by qRT-PCR. Data are shown as means ± SEM, *P<0.05, n=4. One-way ANOVA test was used for
statistical analysis for sXBP1 qRT-PCR.


Fig. S5: Lipoprotein profile and ER stress status of PAO-supplemented ApoE-/- mice. Plasma total triglyceride (A) and (B)
lipoprotein (VLDL, LDL, or HDL) triglyceride quantities were similar between PAO-treated and control ApoE-/- mice. (C)
Lipoprotein profile in control (blue) and PAO-treated (red) ApoE-/- mice. The average distribution (g per fraction; 1-13:
VLDL, 14-31: LDL, and 32-50: HDL) of total triglyceride are reported for each group. Data are expressed as the mean ± SEM.
P<0.05, ns: not significant, n=6, Student’s t-test (VLDL: very low density lipoprotein, LDL: low density lipoprotein, HDL: high
density lipoprotein). (D) Total RNA was isolated from hearts of control or PAO-supplemented ApoE-/- mice, and sXbp1 mRNA
was analyzed by qRT-PCR. Data are shown as means ± SEM; *P<0.05, n=4. Mann-Whitney U test was used for statistical
analysis.
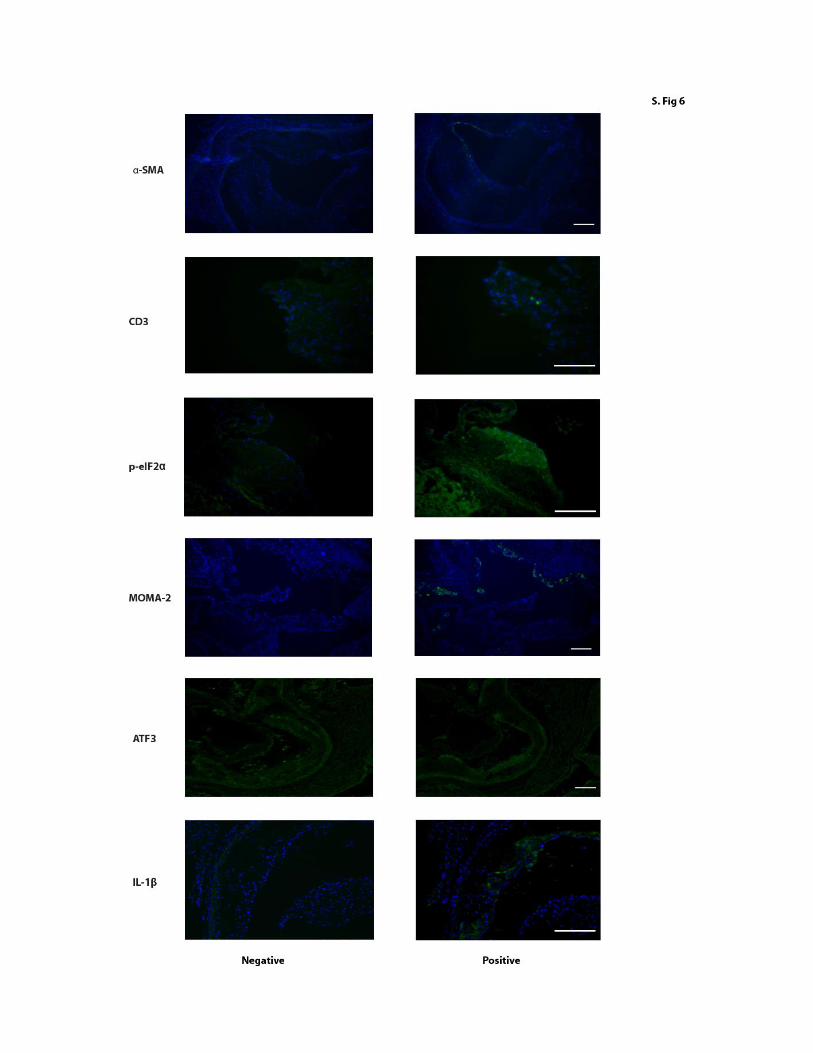

Fig. S6: Representative images for negative controls in immunofluorescence staining. The aortic sinus sections were
incubated with a non-immune immunoglobulin of the same isotype dissolved in the antibody diluent at the same concentration as
the respective primary antibody (except for anti-CD3) shown in the figure. Anti-CD3 antibody was conjugated with Alexa488, so
negative controls were incubated with blocking reagent followed by antibody diluent without the primary antibody (green:
primary antibody as indicated, blue: DAPI for nucleus). Scale bar: 150 M.

Variables Treatment Control Palmitoleate
n
19
15
Body weight (g)
Before After
30±1.36
30.15±1.39
28.67±1.49 28.73±1.49
Glucose (mg/dl)
Before After
118±13.1 110.6±10
117±8.72 90.6±8.38
Table S1: Physical and biochemical characteristics of ApoE-/- mice in PAO-treated and control groups. Data are shown as
means ± SEM. Body weight and glucose values were measured before and after PAO treatment and after PAO or vehicle
treatment for 4 weeks (PAO: n =15, control: n =19).