previous page - murdercube purification... · the methods for analysis and design of distillation...
TRANSCRIPT
5.6 TRANSFER UNITS
Computationally, distillation columns are treated as staged devices, even though in some designs theyfunction as countercurrent contactors such as packed columns. Accordingly, stage concepts as detailed inSection 5.3 may be applied to packed columns as long as the physical contacting mechanisms are not understudy. This approach has led to the concept of the "height equivalent to a theoretical plate/' discussedlater in Section 5.10. When it is desirable to consider the true countercurrent contacting mode, the conceptof the transfer unit should be used.
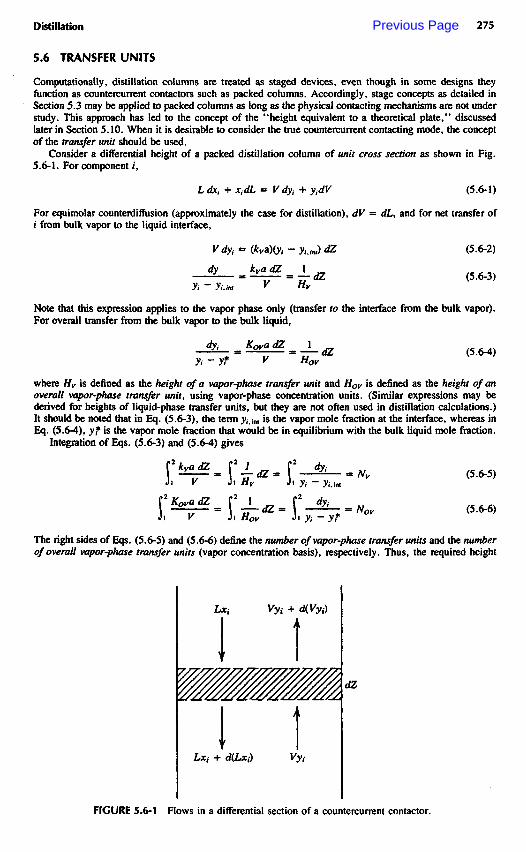
Consider a differential height of a packed distillation column of unit cross section as shown in Fig.5.6-1. For component /,
(5.6-1)
For equimolar counterdiffusion (approximately the case for distillation), dV - dL, and for net transfer ofi from bulk vapor to the liquid interface,
(5.6-2)
(5.6-3)
Note that this expression applies to the vapor phase only (transfer to the interface from the bulk vapor).For overall transfer from the bulk vapor to the bulk liquid,
(5.6-4)
where Hv is defined as the height of a vapor-phase transfer unit and Hov is defined as the height of anoverall vapor-phase transfer unit, using vapor-phase concentration units. (Similar expressions may bederived for heights of liquid-phase transfer units, but they are not often used in distillation calculations.)It should be noted that in Eq. (5.6-3), the term yim is the vapor mole fraction at the interface, whereas inEq. (5.6-4), yf is the vapor mole fraction that would be in equilibrium with the bulk liquid mole fraction.
Integration of Eqs. (5.6-3) and (5.6-4) gives
(5.6-5)
(5.6-6)
The right sides of Eqs. (5.6-5) and (5.6-6) define the number of vapor-phase transfer units and the numberof overall vapor-phase transfer units (vapor concentration basis), respectively. Thus, the required height
FIGURE 5.6-1 Flows in a differential section of a countercurrent contactor.
Previous Page

of packing in a column is obtained from
(5.6-7)
where
(5.6-8)
and
(5.6-9)
evaluated under conditions such that the terms can be brought outside the integral signs of Eq. (5.6-5) and(5.6-6).
For a binary distillation system of components A and B, NKA » Ny# and NOVA = NOVB. For multi-component systems, it is possible for each component to have a different value of the transfer unit. For adiscussion of the multicomponent problem, see Krishnamuithy and Taylor.1 The usual practice is to dealwith the multicomponent mixture as if a staged column were to be used and then convert from theoreticalstages to transfer units by the relationships
(5.6-10)
where N, = the computed number of theoretical stagesX s= the ratio of slopes of the equilibrium and operating lines
Equation (5.6-10) will be discussed in more detail in Section 5.10.
5.7 TRAY-TYPE DISTILLATION COLUMNS
5.7-1 General Description and Types
The typical distillation column has dimensions sufficient for handling the required flows of vapor and liquidand for making the desired separation. The vessel contains internal devices that are designed to promoteintimate contacting of the vapor and liquid. The amounts and properties of the streams usually follow fromthe equilibrium stage or transfer unit calculations (Sections 5.3 and 5.6).
The internal devices may be grouped into two general categories: tray-type and packing-type. Theformer provides a stagewise contacting mode whereas the latter provides a countercurrent mode. In thepresent section the tray-type devices will be considered.
An enormous amount of work has gone into the study of contacting devices, and the literature on theirperformance characteristics is extensive. Most of the work dealing with larger equipment has been basedon plant observations, but a significant portion of it has been based on controlled experiments in commercial-scale equipment by Fractionation Research, Inc. (FRI). The methods for analysis and design of distillationcolumns, presented in this section, are based on a combination of fundamental research papers, resultsreleased by FRI, and many reported plant tests.
General types of tray columns are shown in Fig. 5.7-1. The crossflow tray column is the most prominentin industry, with the trays containing vapor dispersers in the form of bubble caps, liftable valves, or simpleround perforations. Liquid flows down the column, from tray to tray, via connecting downcomer channelsand thus intermittently comes in contact with the upflowing vapor. The counterflow tray ("dualflow tray")column has no downcomers; liquid and vapor use the same openings, which normally are round perforationsbut which in some cases are in the form of slots. Clearly, for such a device to operate stably, the hydro-dynamics must be controlled carefully. The baffle tray column contains simple baffles, or shower decks,over which the liquid flows in a turbulent fashion, contacting the vapor during the fall from one baffle tothe next. Views of typical tray-type devices are shown in Fig. 5.7-2.
When one recognizes that in addition to trays, a number of different packing materials may be used forcontacting devices, the problem of the selection of the optimum device becomes apparent. Table 5.7-1presents several criteria that should be considered both for new designs and for the analysis of existingequipment. The listings are generally self-explanatory, but special mention should be made of the "designbackground*' criterion. The engineer must have reasonable confidence that the selected device will behavein the manner expected; this gives some advantage to the better-known devices but may exclude newer asyet untested devices that could have strong potential for cost savings. Such devices are often of a proprietarynature, with the owners persuading the users on the basis of undocumented experience in ill-definedinstallations. Designers must be wary of claims not based on hard results in known services.

Baffle Single crossflow Double crossflow D ua If low
FIGURE 5.7-1 Types of tray columns.
The contacting devices, or internals, of the distillation column may be classified as shown in Table5.7-2. The categories represent convenient bases for presentation of design methods and as such are followedin this chapter of the handbook. For many years the crossflow tray dominated the chemical and petroleumprocessing industries, with the other devices being used only for special services. In recent years thepackings have become prominent and today tend to be dominant both for new designs and for the retrofittingof existing columns to improve their efficiency and capacity.
5.7-2 Properties of Tray Froths and Sprays
The sieve tray will be selected as the most common crossflow device, and detailed attention to its perfor-mance characteristics will be given. The other crossflow devices will then be considered as modificationsof the sieve tray. A schematic diagram of this basic sieve, or perforated, tray is shown in Fig. 5.7-3.Allocations of cross-sectional area are shown in Fig. 5.7-4.
Liquid enters from the downcomer at the left, flows through the zone aerated by the upflowing vapor,and departs into the downcomer at the right. A two-phase mixture exists on the tray and it may be eitherliquid-continuous (a bubbly froth) or vapor-continuous (a spray), or some combination of the two. Theobjective of the designer is to determine the mass transfer efficiency and pressure drop brought about bythis contacting action; resultant typical performance profiles are shown in Fig. 5.7-5.
It is convenient to define a contacting unit as the space between trays, including the downcomer(s)associated with one of the trays (Fig. 5.7-6). Within the unit three zones can be defined. Zone A isimmediately above the perforations and is liquid continuous. Zone C is in the downcomer and is bothliquid- and vapor-continuous. Zone B is at the vapor outlet end of the unit and is vapor-continuous. Thelocations of the boundaries shown in Fig. 5.7-6 are intended to be illustrative only; even if clear demarcationbetween zones were possible, the boundaries would change with many design and operating parameters.
For a so-called "well-behaved" sieve tray, Zone A comprises a froth (bubbly, or aerated, mixture ofvapor and liquid) with observable height. Liquid droplets are projected or carried into Zone B, and someof them may be entrained from that zone to the tray above. There is also droplet movement into Zone C,in addition to normal movement of froth over the outlet weir. For many designs an attempt is made tohave Zone A predominate in the mass transfer process; the well-behaved sieve tray operates in the frothcontacting mode if at all possible.
Under some circumstances, usually at high volumetric ratios of vapor to liquid flow (as in vacuumfractionation), Zone A inverts to a vapor-continuous spray, with Zone B representing an extension of the

FIGURE 5.7-2 Typical tray-type devices.
Cross!low sieve tray (Fractionation Research. Inc.).
spray but with a higher fraction of vapor than for Zone A. When this happens, the liquid tends to moveinto the tray as a turbulent cloud of spray droplets. The region of inversion from froth to spray (and viceversa) can be predicted and this will be discussed later.
FROTH CONTACTINGWhen Zone A is expected to be largely froth, contacting efficiency can be predicted through the use of the
following equations. The volume of the froth zone may be defined as
(5.7-1)
and the average porosity of the froth is
(5.7-2)
The average density of the froth is
(5.7-3)
The relative froth density (dimensionless) is
(5.7-4)
Dualflow tray (Fractionation Research, Inc.). Typical valve tray (Koch Engineering Co.).

TABLE 5.7-1 Criteria for the Selection of Distillation Column Contacting Devices
GeneralVapor-handling capacity The device must permit reasonable volumetric flow of vapor
without excessive entrainment of liquid or, at themaximum vapor rate, flooding.
Liquid-handling capacity There must be channels for liquid flow that will benonconstrictive, otherwise the column will flood due toexcessive liquid backup.
Flexibility The device should allow for variations in vapor and liquidflow, to accommodate those periods when demand forproduction fluctuates.
Pressure drop For situations when pressure drop can be costly, forexample, in vacuum distillations of heat-sensitivematerials, the device should maximize the ratio ofefficiency to pressure drop.
Cost The device should not be excessively complex, and thereforecostly to manufacture. However, one must consider thetotal cost of the system; an expensive device might permita smaller column, lower cost auxiliary equipment, and soon.
Design background The designer should work with a device in which he or shehas confidence and an understanding of the physicalprinciples by which the device will operate.
Special
1. Possible fouling should be considered; some devices resist fouling better than others.2. Potential corrosion problems place limitations of the type of material and the techniques for
fabricating the device to be used.3. If foaming is expected, some devices can provide a built-in foam-breaking capability.
TABLE 5.7-2 Classification of Contacting Devices
Crossflow trays Bubble-cap traysSieve (perforated) traysValve traysSlotted sieve trays
Counterflow trays Round openings ("Dualflow")Rectangular openings ("Turbogrid")
Baffle trays Segmental bafflesDisk-and-donut bafflesShower decks with perforations
Random packings Raschig rings, plain and slotted, metal and ceramicOther ring-type packingsBerl saddlesIntalox saddles, ceramic and metalOther saddle-type packingsSpecialty random packings
Ordered packings Corrugated metal and plastic gauzeCorrugated sheet metalMesh-structuredGrid-arranged

FIGURE 5.7-3 Schematic diagram of sieve (perforated) tray.
When
(5.7-5)
An average residence time of vapor flowing through the froth may be estimated as
(5.7-6)
In a similar fashion, average liquid residence time may be estimated:
(5.7-7)
Equations (5.7-6) and (5.7-7) involve froth height Zj. Estimation of this height may be made by the useof Fig. 5.7-7, which is adapted from work sponsored by the American Institute of Chemical Engineers(AIChE).' The more recently published approach of Bennett et al.2 permits avoidance of this parameter byuse of Eqs, (5.7-8) and (5.7-9):
(5.7-8)
(5.7-9)
which imply that
Tray above
Froth
Clear;liquid
•Active length
"Froth"(foam)
Downcomer apron
Tray below

(5.7-10)
Values of the terms in Eqs. (5.7-8M5.7-10) may be obtained from Eqs. (5.7-25)-(5.7-28), presented laterin the discussion of pressure drop through sieve trays.
SPRAY CONTACTINGAs mentioned, under certain high ratios of the flow rates of vapor and liquid, a vapor-continuous regioncan exist in the contacting zone. While there is not a great deal of information on the characteristics of theresulting spray, at least with the implications regarding mass transfer, there are methods for predictingwhether a froth is likely not to exist. One method, published by Hofhuis and Zuiderweg,3 will be shownin connection with the prediction of flooding (Fig. 5.7-10). Another useful method for predicting whethera froth might exist is given by Loon et al.4 and is shown graphically in Fig. 5.7-8. This chart indicatesthat the following conditions favor the spray regime:
High vapor rateLow liquid rateLow hole area (i.e., high hole velocity)Large hole size
5.7-3 Vapor Capacity
The usual approach for a new design is first to determine on a tentative basis the required diameter of thecolumn. This diameter often is controlled by the amount of vapor to be handled, although in some casesit may be more a function of liquid flow. After the tentative diameter is calculated, based on an assumed
FIGURE 5.7-4 Allocations of cross-sectional area, crossflowtray: AN = net area = AA + AD = active area + one down-comer area; A7 = total tower cross-sectional area = AA + 2AD.
Downcomer baffle
Active area
Downcomer baffle
Active(bubbling)
area
Down
com
er a
rea
Down
com
er a
rea

Vapor capacity factor
FIGURE 5.7-5 Typical performance profiles for a sieve tray and a combination sieve and valve tray:ethylbenzene-styrene system at 0.13 atm (Ref. 19).
Sieve-valve plate
Sieve plate
E,
Effi
cien
cyP
ress
ure
drop
(m
m H
2O)
Sieve plate
Sieve-valve plate
Zone B—Spray
Zone A—Froth
Zone
C—
Fro
th a
nd
spr
ay
FIGURE 5.7-6 Zones of a contacting unit (tray n).

FRACTIONAL APPROACH TO FLOOD
FIGURE 5.7-7 Chart for estimating height of froth on sieve trays.
Free area (%)
FIGURE 5.7-8 Chart for estimating whether froth contacting can be expected. When operating point fallsbelow the appropriate curve, the froth regime prevails (Ref. 4). : j in. (0.635 cm) holes; —: jin. (1.27 cm) holes; : | in. (1.91 cm) holes. Values on curves are liquid loadings in (m3/h)/m weir.

geometry of the contacting device, the capacity for liquid is checked and any needed adjustments are thenmade. Thus, initial attention is given to vapor capacity.
5.7-4 Maximum Vapor Flow
It is clear that if the vapor rate through the tray is excessively high, liquid droplets ("liquid entrainment")will be carried to the tray above, either passing through its perforations or coalescing into larger drops thatcan fall downward. Also, the very high vapor rate is accompanied by a high pressure drop. It has beenobserved that when the flood point is approached, operation of the tray becomes unstable, mass transferefficiency drops to a very low value (see Fig. 5.7-5), liquid builds up in the downcomers, and the maximumvapor loading has been reached. This flood point thus represents an upper operating limit and it is convenientfor the designer to locate it in context with the other operating parameters (see Fig. 5.7-9).
If a droplet of liquid is considered suspended above the two-phase mixture, with the drag force of thevapor being exactly counterbalanced by the force of gravity, the vapor velocity for suspension may bedetermined from the equation
(5.7-11)
where UN = velocity of approach to the tray (based on net area AN in Fig. 5.7-4)Dd = diameter of the dropletCd = drag coefficient (dimensionless)
PK, PL ~ vapor and liquid densities, respectively
The first term on the right-hand side of Eq. (5.7-11) has a range of values depending on the dropletsize distribution above the two-phase mixture. For practical design purposes it is termed the capacityparameter CSB» after the work of Souders and Brown.5 For a condition of maximum vapor capacity ("en-trainment flood capacity"),
(5.7-12)
Equation (5.7-12) is the basis for most correlations used to predict maximum allowable vapor velocity.The correlations are based on observed flood conditions in operating columns as evidenced by a sharp dropin efficiency (Fig. 5.7-5), a sharp rise in pressure drop, or a liquid loading condition giving difficulty inmaintaining operating stability. A discussion of entrainment flood measurement has been given by Silveyand Keller.6
Of the correlations for CSB/, the one that has best stood the test of time is shown in Fig. 5.7-10.7 Theabscissa term, a flow parameter, represents a ratio of liquid to vapor kinetic energies. It also indicates
Blowing
Flooding
PhasemaldistributionSatisfactory operation
Liquid gradientWeeping
Dumping
Flow parameterFIGURE 5.7-9 Generalized performance diagram, crossflow trays.
Vapo
r vel
ocity

FLOW PARAMETER - L/G ip\^p\)°'S
FIGURE 5.7-10 Flooding correlation forcrossflow trays (sieve, valve, and bubble-cap trays).
zones where spray or froth might predominate.3 For flow parameter values higher than about 0.1, a froth(two-phase bubbly mixture) is usually dominant.
Figure 5.7-10 may be used for design purposes, for sieve, bubble-cap, or valve trays, to obtain themaximum velocity:
(5.7-13)
with the following restrictions:
1. Low-foaming to nonfoaming system.2. Weir height less than 15% of tray spacing.3. Hole diameter 12.7 mm (0.5 in.) or less (sieve trays)4. Hole or riser area 10% or more of the active, or bubbling, area (Fig. 5.7-4). Smaller hole areas
tend to produce jetting because of the high hole velocities8 and require correction:
AiJA0 VNfIUNf from Chart
0.10 1.000.08 0.900.06 0.80
Figure 5.7-10 has been found to represent flood data for all crossflow trays. Since the correlation firstappeared in 1961, a significant number of large-scale flood tests have been reported, many of them in the1.2 m column of FRI. Analysis has shown that the correlation is conservative,9 and one can use 90% ofthe predicted flood values as suitable operating levels for design.
5.7-5 Liquid Entrainment
Reference has been made to liquid entrainment that occurs in increasing amounts as the flood point isapproached. The entrained liquid is recycled back to the tray above, negating the effect of countercurrentcontacting and decreasing tray efficiency. The recirculation due to entrainment is shown in Fig. 5.7-11.
The deentraining device of Fig. 5.7-11 may not be needed if the "contaminated*' overhead vapor meetsdistillate specifications. Entrainment data for sieve and bubble-cap trays have been correlated by Fair andcoworkers l0 as shown in Fig. 5.7-12. The sieve tray data are for trays with small (less than 1 mm)diameter. Visual data of FRI, released as a movie,11 show that under distillation conditions 3 mm holesentrain significantly less than 12.7 mm holes, with hole areas and gross vapor rates being equal.
Tray Spacing, mmSpray zone
Mixed froth Emulsion flow

FIGURE 5.7-12 Chart for estimating effect of liquid entrainment on crossflow tray efficiency.
FRA
CTI
ON
AL
EN
TRA
INM
EN
T, ^
MO
LES/
MO
LE G
RO
SS D
OW
NFL
OW
Perforated PlatesBubble Cap Plates
%0fFlood
%0fFlood
FIGURE 5.7-11 Entrainment recirculation in column. LMD and GMD are liquid and vapor molar flows ona dry basis.
Trays
6 M D
De-entrainer
L M D G M D
L M D

The parameter in the chart is the ratio of entrained liquid to gross downflow:
(5.7-14)
The terms are clear from Fig. 5.7-11. The $ parameter represents a fraction of the total liquid enteringthat is entrained upward. It may be used to correct a "dry" efficiency as follows:
(5.7-15)
where Emv is the dry Murphree tray efficiency, to be discussed in Section 5.9. Equation (5.7-15) is basedon the early work of Colburn.12
Figure 5.7-12 appears to be useful for estimating valve tray entrainment, although the available dataare scarce.9 Absolute values of entrainment obtained from the figure may not be very accurate, but thepredicted effect of the entrainment on efficiency appears quite reliable.
EXAMPLE 5.7-1A distillation column is separating a methanol-water mixture and produces a 98.0 mol % distillate product.The reflux ratio is 1.0, the top of the column operates at 1.0 atm, and the condensing temperature of theoverhead product liquid is 65°C (149°F). For the top condition, the vapor density is 1.22 kg/m3, the liquiddensity is 751 kg/m5, and the surface tension is 20 mN/m (dynes/cm). The net distillate rate is 13,500 kg/h (29,768 lbm/h). The column dimensions are as follows:
Tray Type: Sieve, Single Crossflow, Segmental Downcomers
Column diameter 1.98 m 6.5 ftTray spacing 0.61 m 24 in.Weir height 50 mm 2 in.Weir length 1.43 m 4.7 ftHole diameter 6 mm | in.Downcomer
clearance 25 mm 1 in.Cross-sectional area 3.08 m2 33.2 ft2
Downcomer area 0.31m2 3.32 ft2
Net area 2.77 m2 29.9 ft2
Active area 2.46 m2 26.6 ft2
Hole area (12%open) 0.295 m2 3.18ft2
Tray metal thickness 2.6 mm 0.10 in.
Calculate the following: (a) approach to flooding and (b) efficiency discount due to entrainment, based ona dry Murphree efficiency of 0.75 (75%). The calculations are to be based on the top plate conditions.
Solution
(a) Vapor mass rate = distillate + reflux = 13,500 4- 13,500 = 27,000 kg/h
Vapor volumetric rate =
Net area vapor velocity
Souders-Brown coefficient =
Flow parameter =
From Fig. 5.7-12, at 610 mm tray spacing, CSB/ = 0.12 m/s

(b) For 75% flood and a flow parameter of 0.020, Fig. 5.7-12 gives \f/ - 0.018. From Eq. (5.7-15) andfor Emv « 0.75 (dry basis),
Thus, the dry efficiency is discounted by about 86%, to a value of Ea « 0.859(0.75) = 0.644, or 64%.
5.7-6 Weeping
Whereas bubble-cap trays have a built-in seal against liquid draining through the tray during operation,this is not the case for sieve trays and valve trays. The sieve tray is especially prone to this drainage, whichin relatively small amounts is called weeping and in large amounts, dumping. Liquid draining through theholes causes some short-circuiting, but at the same time provides surface for mass transfer; small amountsof weeping appear not to be detrimental to the operation and performance of a tray. Thus, it is the dumpingthat is normally to be avoided.
Reference to Fig. 5.7-5 shows that at low vapor rates there is a decline in efficiency, and this must betaken into account in determining the "turndown ratio" (ratio of maximum allowable rate to minimumallowable rate) of the tray device. It has been found that a reasonable prediction of the minimum rate canbe made with the use of Fig. 5.7-13. This chart was developed earlier by Fair13 on the basis of visual testsand was later confirmed by Zanelli and Del Bianco.14 In practice, it predicts the "point of minimumturndown" as denoted by Fig. 5.7-5. The pressure loss in forming a gas bubble may be estimated fromthe dimensional relationship
(5.7-16)
5.7-7 Pressure Drop
The pressure loss experienced by the vapor in flowing through a tray is that which might be measured bya manometer as shown in Fig. 5.7-3. It may be assumed that this is the sum of contributions by thedispersers (holes, caps, valves) and by the head of two-phase mixture:
(5.7-17)
The term h'L is treated as a residual and is not necessarily equal to the equivalent head of liquid hL on thetray. It also takes into account the fact that the orifice (disperser) has changed characteristics when it iswetted.
Hole size
-3- in.16
Hoie areaActive area
Mayfield
Mayfield
Hutchison
liquid on tray
FIGURE 5.7-13 Chart for estimating the weep point of a sieve tray. {Note: If operating point lies abovethe appropriate curve, weeping is not expected.)
mm
liqu
id o
n tra
y

HOLE AREA _ _̂ h_ACTIVE AREA AA
FIGURE 5.7-14 Discharge coefficient for sieve trays.
For sieve trays, the simplified orifice equation is used to estimate the pressure loss for flow through theholes:
(5.7-18)
This is the so-called "dry drop." The discharge coefficient Cv is obtained from Fig. 5.7-14, from the workof Leibson et al.15 The plot was developed originally for small-hole sieve trays (7 mm diameter and less).It includes the corrections for velocity of approach and for sharpness of the orifice.
For pressure loss through the two-phase mixture, the residual term is estimated from the relationship
(5.7-19)
where /8 is an aeration factor, originally utilized by Hutchinson et al.16 for sieve tray experiments. Thisfactor has been correlated as shown in Fig. 5.7-15917 and leads to the final equation for estimating pressureloss across a sieve tray:
(5.7-20)
The curves of Fig. 5.7-15 may be represented by the equation
(5.7-21)
where Lw = qllw in m3/s-m. The value of the weir crest how in Eqs. (5.7-19) and (5.7-20) is calculatedby the classical Francis weir equation:
(5.7-22)
even though the two-phase mixture actually flows over the weir (unless "calming zones" (unperforatedsections) are used upstream of the weir. If one wishes to consider that froth actually flows over the weir,
(5.7-23)
or
(5.7-24)
In the two foregoing equations, <f>f is a relative froth density, pflpL.
DISC
HARG
E CO
EFFI
CIEN
T

FIGURE 5.7-15 Aeration factor for sieve trays. (Note: ft/s (lbjft3)1'2 x 1/22 - m/s (kg/m3)1/2 and [(gal/min)/in. weir] X 0.00249 = (m3/s)/m weir.
A more exact analysis of the hydraulic parameters is possible, and for this the paper by Bennett et al.'should be consulted. In that work, an effective froth density is defined as follows:
(5.7-25)
where Q 8 = CSB(AN/Aa) is a capacity parameter based on the active area instead of the net area. Liquidhead above the perforations is given by
(5.7-26)
with the correction factor C obtained from
(5.7-27)
Finally, the residual drop is obtained from Eqs. (5.7-16) and (5.7-27):
(5.7-28)
and this is added to the dry tray drop to obtain the total tray pressure drop. The model of Bennett andcoworkers correlates a large bank of data with an average error of -0.8% and a mean absolute error of6.0%. The reliability of the aeration factor approach is about 10% mean absolute error. It should be notedthat Bennett and coworkers suggest the use of the Leibson plot (Fig. 5.7-14) to obtain dry tray pressureloss.
For valve trays, design manuals of the vendors should be used; these manuals are readily available.The approach used is the same as the aeration factor approach described above, except that constant valuesof this factor are used. For bubble-cap trays, the "dry drop*' is more complex because of the uniquegeometry and mode of flow. For example, the total dry drop can be the sum of losses for flow through theriser, through the annulus, and through the slots. The 1963 work by Bolles18 is undoubtedly the bestcurrently available method for determining the hydraulics of bubble-cap trays. Since these trays are rarelyused for new designs, and since no advances in the technology have been made since 1963, the Bolles
Hole F factor,
Aera
tion
fact
or, gal/min liquid
in. weir

paper should be consulted when it is necessary to analyze the performance of existing bubble-cap instal-lations.
5.7-8 Liquid Handling Capacity
The downflowing liquid is transported from a tray to the tray below by means of conduits called down-comers, and it is evident that if the downcomer is not sufficiently large to handle the required liquid load,the pressure drop associated with liquid flow will serve as a constriction and a point of flow rate limitation.In fact, downcomers usually serve to bottleneck operations of high-pressure fractionators and absorbers.They must be sized such that they do not fill completely under the highest flow rates expected for thecolumn. As will be shown, the vapor flow rate contributes toward the liquid capacity limitation.
Figure 5.7-16 shows a diagram of three trays with downcomers, on which is superimposed the liquidbackup in one of the downcomers. This backup may be calculated from a pressure balance:
(5.7-29)
The segments of the buildup are (a) the equivalent clear liquid head on the tray h'Lt (b) any hydraulicgradient A caused by resistance to liquid flow across the tray, which usually is not significant for sievetrays, (c) liquid head equivalent to pressure loss due to flow under the downcomer apron, H60, and (d) totalpressure loss across the tray above, necessarily included to maintain the dynamic pressure balance betweenpoint A (just above the floor of tray 3) and point B in the vapor space above tray 2.
Segments a and b are covered by the tray pressure drop calculations discussed in Section 5.7-6. Forsegment b, only bubble-cap trays require an evaluation, and methods for this are detailed in Ref. 18. Forsegment c, the head loss for flow under the downcomer may be estimated from the following empiricalexpression:
(5.7-30)
where Uda is in m/s and h^ is in mm of liquid. Equation (5.7-30) applies to flow under a simple downcomerapron, with no recessed discharge area or tray inlet weir (see Fig. 5.7-17 for liquid inflow arrangements).If an inlet weir is used, the value of H^ from Eq. (5.7-30) should be doubled.
This so-called "clearance under the downcomer," represented by the area A (see Fig. 5.7-4), bearsspecial mention, since improperly fitted tray sections can lead to inadequate clearance at one or more pointsin the column. Thus, the clearance is a dimension that should be checked very carefully during trayinstallation.
Tray 1
Froth
Tray 2
FrothTray 3
(gradient)
FIGURE 5.7-16 Components of downcomer backup.

(e)
FIGURE 5.7-17 Possible downcomer arrangements: (a) vertical baffle, no recess, no inlet weir (this typeis quite common); (b) vertical baffle, no recess, inlet weir; (c) vertical baffle, recess, no inlet weir; (d)sloped baffle, no recess, no inlet weir; and (e) double crossflow, vertical baffles, no recesses, inlet weirs.
Returning to Fig. 5.7-16, we see that the backup relationship [Eq. (5.7-29)] is based on clear liquidheads. Actually, the fluid in the downcomer contains a large amount of entrapped vapor and can berepresented as a froth with an average density of 4>dc. Accordingly, the actual downcomer backup is
(5.7-31)
The value of "$dc in Eq. (5.7-31) is obtained as follows. If the flow into the downcomer is a tray froth ofdensity <f>f, then <f>f = <f>dc, and if the flow out of the downcomer is clear liquid (4>dc ~ 1.0), then theaverage value is some mean of these two froth densities. If there is very rapid disengagement of vaporfrom liquid in the downcomer, the average may be as high as 0.8 or 0.9. On the other hand, for slowdisengagement, as in fractionators operating near the critical point of the tray mixture, the poor buoyancyof vapor bubbles can lead to an average downcomer froth density of as low as 0.2 or 0.3. Designers oftenuse an average value of <f>dc = 0.5, but this value should be considered carefully on the basis of the systemas well as the geometry of the downcomer.
It is possible for vapor to be entrained downward with the liquid, and this "reverse entrainment" hasbeen studied by Hoek and Zuiderweg,20 using Fractionation Research, Inc. data taken at pressures of 20and 27 atm and a system operating close to its critical point. The downward entrainment was found toaffect significantly the overall efficiency of the column. A maximum superficial velocity in the downcomershould be about 0.12 m/s, based on clear liquid and the smallest cross section of the downcomer.
The above discussion of downcomer sizing has dealt with flow rates to minimize downward entrainment.From another point of view, the downcomer must have enough volume to allow collapse of any stable
(a) (b) (c)
(d)
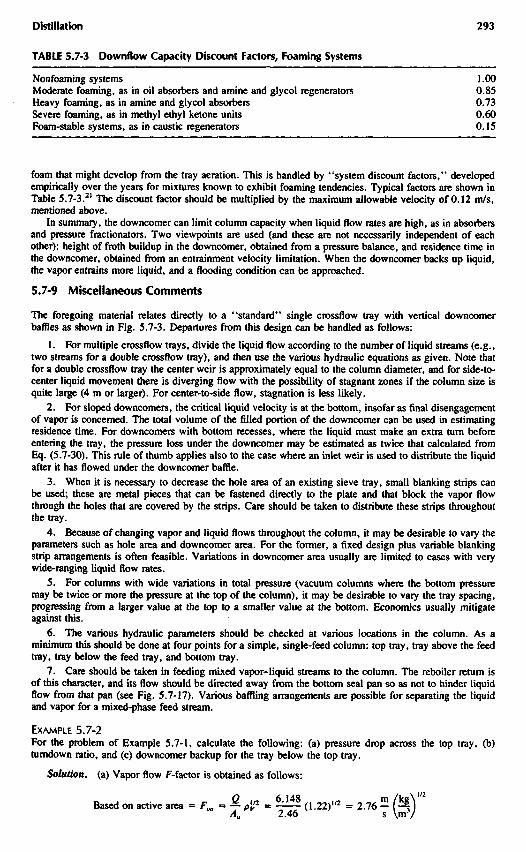
TABLE 5.7-3 Downflow Capacity Discount Factors, Foaming Systems
Nonfoaming systems 1.00Moderate foaming, as in oil absorbers and amine and glycol regenerators 0.85Heavy foaming, as in amine and glycol absorbers 0.73Severe foaming, as in methyl ethyl ketone units 0.60Foam-stable systems, as in caustic regenerators 0.15
foam that might develop from the tray aeration. This is handled by "system discount factors," developedempirically over the years for mixtures known to exhibit foaming tendencies. Typical factors are shown inTable 5.7-3.21 The discount factor should be multiplied by the maximum allowable velocity of 0.12 m/s,mentioned above.
In summary, the downcomer can limit column capacity when liquid flow rates are high, as in absorbersand pressure fractionators. Two viewpoints are used (and these are not necessarily independent of eachother): height of froth buildup in the downcomer, obtained from a pressure balance, and residence time inthe downcomer, obtained from an entrainment velocity limitation. When the downcomer backs up liquid,the vapor entrains more liquid, and a flooding condition can be approached.
5.7-9 Miscellaneous Comments
The foregoing material relates directly to a "standard" single crossflow tray with vertical downcomerbaffles as shown in Fig. 5.7-3. Departures from this design can be handled as follows:
1. For multiple crossflow trays, divide the liquid flow according to the number of liquid streams (e.g.,two streams for a double crossflow tray), and then use the various hydraulic equations as given. Note thatfor a double crossflow tray the center weir is approximately equal to the column diameter, and for side-to-center liquid movement there is diverging flow with the possibility of stagnant zones if the column size isquite large (4 m or larger). For center-to-side flow, stagnation is less likely.
2. For sloped downcomers, the critical liquid velocity is at the bottom, insofar as final disengagementof vapor is concerned. The total volume of the filled portion of the downcomer can be used in estimatingresidence time. For downcomers with bottom recesses, where the liquid must make an extra turn beforeentering the tray, the pressure loss under the downcomer may be estimated as twice that calculated fromEq. (5.7-30). This rule of thumb applies also to the case where an inlet weir is used to distribute the liquidafter it has flowed under the downcomer baffle.
3. When it is necessary to decrease the hole area of an existing sieve tray, small blanking strips canbe used; these are metal pieces that can be fastened directly to the plate and that block the vapor flowthrough the holes that are covered by the strips. Care should be taken to distribute these strips throughoutthe tray.
4. Because of changing vapor and liquid flows throughout the column, it may be desirable to vary theparameters such as hole area and downcomer area. For the former, a fixed design plus variable blankingstrip arrangements is often feasible. Variations in downcomer area usually are limited to cases with verywide-ranging liquid flow rates.
5. For columns with wide variations in total pressure (vacuum columns where the bottom pressuremay be twice or more the pressure at the top of the column), it may be desirable to vary the tray spacing,progressing from a larger value at the top to a smaller value at the bottom. Economics usually mitigateagainst this.
6. The various hydraulic parameters should be checked at various locations in the column. As aminimum this should be done at four points for a simple, single-feed column: top tray, tray above the feedtray, tray below the feed tray, and bottom tray.
7. Care should be taken in feeding mixed vapor-liquid streams to the column. The reboiler return isof this character, and its flow should be directed away from the bottom seal pan so as not to hinder liquidflow from that pan (see Fig. 5.7-17). Various baffling arrangements are possible for separating the liquidand vapor for a mixed-phase feed stream.
EXAMPLE 5.7-2For the problem of Example 5.7-1, calculate the following: (a) pressure drop across the top tray, (b)turndown ratio, and (c) downcomer backup for the tray below the top tray.
Solution, (a) Vapor flow F-factor is obtained as follows:
Based on active area

Based on hole area
The discharge coefficient (Fig. 5.7-14), for a tray thickness/hole diameter of 2.6/6 = 0.43 and Ah/Aa =0.295/2.46 = 0.12, is Cv = 0.75. The weir rate is
The aeration factor [Eq. (5.7-21)] is
For the weir crest [Eq. (5.7-22)]
mm liquid
For the dry tray drop [Eq. (5.7-18)]
mm liquid
The total tray pressure drop [Eq. (5.7-20)] is given by
mm liquid
(b) Estimation of the turndown ratio utilizes Fig. 5.7-13 and a trial-and-error procedure. The pressureloss for bubble formation [Eq. (5.7-16)] is given by
1.73 mm liquid
If we assume 50% of design vapor and liquid rates,
Dry drop = 63.7(0.25) = 15.9 mm liquid
Weir crest = 9.62 mm liquid
Then,
mm liquid
mm liquid
These values are on the curve of Fig. 5.7-13. Thus, our assumption is correct;
* , . 100 ^Turndown ratio = —- = 2
(c) For this part,
Downcomer discharge area = 0.025(1.43) = 0.0358 m2
0.0050Velocity under downcomer = Uda = T-TTT^ = 0.140 m/s
0.0358
The pressure loss for flow under downcomer [Eq. (5.7-30) is
= 165.2(0.14O)2 = 3.24 mm liquid
Backup =

Based on tray spacing.
Fractional backup = — j - = 0.189 (18.9% of tray spacing)610
5.8 PACKED-TYPE DISTILLATION COLUMNS
5.8-1 Types of Packing Materials
Packings for distillation columns come in many types, shapes, and sizes. Many of them are nonproprietaryand are provided by more than one supplier, but most of the newer and more important devices areproprietary, patent-protected, and obtained from a single source. As noted in Table 5.7-2, the packingelements may be placed in the column in a random fashion, as by dumping. Alternatively, they may bestacked as individual elements or they may be fashioned as rigid meshes, grids, or multiple plates andinserted carefully into the column. This latter type of column internal is known as structured packing; theformer type is known as random packing. A diagram of a *'composite*' packed column, taken from thepaper by Chen,1 is shown in Fig. 5.8-1.
RANDOM PACKINGSTraditionally, packed columns have contained random packings. Descriptions of packings in 1934 rangedfrom jackchain and ceramic rings to carpet tacks and birdshot. Through the years various handy materialswere used to provide contact surface for vapor and liquid. Emerging from early experimentation were thefairly standard Raschig rings and Berl saddles in the 1930s and 1940s. In more recent years, two particularrandom packings have been quite popular—the slotted ring (Pall ring, Flexiring, Ballast ring) and themodified saddle (Intalox saddle, Flexisaddle). These packings have become available in ceramic, plastic,or metal materials. For convenience in the present work, these packings will be called Pall rings and Intaloxsaddles.
Newer random packings include the Metal Intalox saddle (Norton Company), called IMTP, the Nutterring (Nutter Engineering Co.), and the Cascade Miniring (Glitsch, Inc.), called CMR. The IMTP andNutter packings are available only in metal, whereas the CMR is available in both metal and plastic. Thesenewer packings have received extensive field and laboratory testing, and the vendors should be consultedfor a review of such testing.
Views of various random packings, useful particularly for distillation service, are shown in Fig. 5.8-2. Properties of several of these packings are shown in Table 5.8-1. It is important to note that the listedspecific surface area of the packing (the amount of surface of a single element times the number of elementsthat can be packed in a given volume) is not necessarily indicative of the mass transfer capability of thepacking.
The packings in Fig. 5.8-2 may be separated into two types according to their resistance to the flowsof liquid and vapor. The older packings require that the fluids flow around them, thus causing pressureloss both by form drag and by skin friction. The Raschig ring, the Berl saddle, and the ceramic Intaloxsaddle are representative of this type. The newer packings permit fluids to flow through them, with greatlyreduced form drag. The distinction between these types is significant, the *'through-flow" concept havingled to the so-called "high efficiency packings" that produce increased mass transfer while minimizingpressure drop.
STRUCTURED PACKINGSAn early form of structured packing was introduced by Stedman2 who cut pieces of metal gauze and placedthem horizontally in small-scale laboratory and pilot plant columns. This packing was found to be quiteefficient for mass transfer34 but was regarded as practical only for small columns. In later times, expandedmetal was used to fabricate structured elements for larger columns,5 and knitted wire mesh was developedas a high-efficiency packing,6 but this too was considered impractical and uneconomical for larger columns.It was not until the 1960s that a structured packing was developed that could be considered a proven andpractical material for commercial distillation columns; this was the packing known as Sulzer BX (SulzerBrothers, Winterthur, Switzerland) and was fabricated from metal gauze. The first test data of significancewere published by Billet in 1969,7 following the granting of a United States patent to Huber.8 Representativedata of Billet, for the ethylbenzene-styrene system, are compared against sieve trays and Pall rings (fromRef. 9) in Fig. 5.8-3. It is clear that the Sulzer BX packing gives a superior combination of high masstransfer efficiency and low pressure drop.
A disadvantage of the Sulzer packing was its high cost of fabrication; in time more economical methodsof manufacture plus the substitution of sheet metal for gauze led to a new group of structured packings:Mellapak (Sulzer Brothers), Flexipac (Koch Engineering), Gempak (Glitsch, Inc.), and Montz B (Julius

Skirt
Circulation pipeto reboiler
Bottomproduct
FIGURE 5.8-1 Composite packed column (Ref. 1).
Vapor outletto condenser
Manway
Liquid distributor
Hold-down grid
Structured packing
Support gridLiquid collector
Ringed channel
Liquid distributor,redistributor
Hold-down grid
Random packing
Support plate
Liquid distributor
Structured grid
Rings orsaddles
Manway
Manway

Raschig Ring BerI Saddle INTALOX®Saddle PALL® Ring INTALOX®Saddle(Metal) (Ceramic) (Ceramic) (Meta!) (Metal)
FIGURE 5.8-2 Representative random packings.
Montz). These structured packings come in various dimensions and are available in a number of materialsof construction (typically plastic as well as metals of various types).
Views of several different structured packings are shown in Fig. 5.8-4; careful inspection will showthat the packing elements are made from sheets of corrugated sheet metal or gauze and that the sheets areperforated. Furthermore, the sheet metal has been given a special surface treatment to aid in the spreadingof the liquid film and thus to emulate the gauze surface, which by capillary action promotes liquid spreading.
The elements of structured packing are installed in layers in the column, with care being taken that theadjoining elements of adjacent layers are oriented such that the liquid flow direction is reversed and thatgas is redistributed. For the simple pilot plant element shown in Fig. 5.8-4, adjacent layers are usuallyrotated by 90°.
Properties of representative packings are shown in Table 5.8-2. More details on typical geometries willbe given when the topics of pressure drop and mass transfer efficiency are addressed.
5.8-2 Packed Column Hydraulics
LIQUID DISTRIBUTIONIt has always been recognized that for a packed bed to exhibit good performance it must be fed with auniform and well-distributed liquid flow. The early work of Baker et al.10 led to the conclusion that forrandomly packed beds, unless the column diameter is at least eight times the nominal diameter of thepacking pieces, there will be excessive liquid flow along the walls, with resulting loss of efficiency due tochanneling. Through the years this limitation has been a guideline and has hampered "scaledown" studiesin pilot plant equipment, it being necessary to use at least a 10 cm (4 in.) diameter pilot column if dataon minimum size packings (12 mm) were to be scaled up to some commercial size.
Fortunately for the designers, the traditional "bluff body" packings such as Raschig rings and Berlsaddles have had some capability to correct any maldistribution of liquid in the center portions of the bed,especially when the column diameter to packing element diameter was very large. Silvey and Keller"reported on tests with 3.8 cm (1.5 in.) ceramic Raschig rings in a 1.2 m (4 ft) column and showed howthe distribution of the liquid improved as it moved down the packed bed. Albright12 has provided a methodfor estimating the "characteristic distribution" of liquid in randomly packed beds, based on a theoreticalmodel involving the diversion of flow by the packing pieces. A number of researchers have found that forbluff packings an initial liquid distribution of at least 40 pour points per square meter of column crosssection (4 points/ft2) is generally satisfactory.
For the higher efficiency packings, those having the "through-flow" characteristic mentioned earlier,the packed bed appears to offer little correction of a poor initial liquid distribution. This matter is discussedby Chen,1 who also provides an excellent coverage of packed column internals in general, and by Kuneshet al.13, who report on studies at Fractionation Research, Inc. The consensus of designers and researchersis that for the high-efficiency packings there should be at least 100 pour points per square meter (about 10points/ft2).
Types of liquid distributors are shown in Fig. 5.8-5. The orifice/riser device can be developed in avariety of forms, and the risers are often of a rectangular cross section. The orifices must be distributedproperly over the cross section and must offer enough resistance to liquid flow that an adequate head ofliquid can be maintained over them. This can lead to difficulties: small holes can be easily plugged, andout-of-levelness of the distributor can lead to dry sections, especially when liquid rate is considerably belowthe design value.
For orifice-type distributors, the head of liquid required to produce a given flow through the orifice canbe calculated from a dimensional form of the orifice equation:
(5.8-1)
where /idis( is in millimeters of liquid and Uh is the velocity of liquid through the hole in meters per second.The perforated pipe distributor (Fig. 5.8-5) is capable of providing many pour points and can be

Vendors"Fp Packing
Factor (m"1)eVoid
FractionSurface Area
(m2/m3)Bed Weight
(kg/m3)Elements(per m3)
Nominal Size(mm)Packing Type
Norton, Koch,Glitsch
Norton
Norton, Glitsch,Koch
Norton, Glitsch,Koch, others
Koch, others
Norton, Glitsch,Koch
Norton, Glitsch,Koch
4021901088145
127775041
195139936150
81927914311868
30416610878
876044
32513869
66032017013070
135825243
230157926653
2000510310215120
790360215150
1056950
31017082
0.780.770.800.790.80
0.970.970.980.98
0.920.940.950.960.97
0.640.740.680.740.75
0.620.680.710.72
0.910.930.94
0.870.900.92
62525519511892
n.a.n.a.n.a.
20513011592
3701901209262
465250150105
20610888
341207100
720705670670590
350230181149
480415385270
880670740660590
865720640625
766460
1168872
730,00084,00025,0009,4001,870
168,40050,10014,7004,630
49,60013,0006,0401,170
378,00047,70013,5005,8001,700
590,00077,00022,8008,800
55,8007,7601,520
213,70050,1506,360
1325385075
25405070
1625385090
1325385075
13253850
255075
162550
Intalox saddles(ceramic)
Intalox saddles(metal)
Pall rings (Ballastrings, Flexirings)(metal)
Raschig rings(ceramic)
Berl saddles(ceramic)
Intalox saddles(plastic)
Pall rings(plastic)
"Identification of vendors: Norton Company, Akron, OH; Glitsch, Inc., Dallas, TX; Koch Engineering Co., Wichita, KS.bn.a.—not available.
TABLE 5.8-1 Properties of Random Packings

Vapor flow factor, Uoply, (m/s) (kg/m3)1/2
FIGURE 5.8-3 Pressure drop/efficiency comparisons, trays and packings: ethylbenzene-styrene system at100 nm Hg pressure (Refs. 8 and 9).
equipped with a central reservoir to allow variations in liquid head as flow rates change (and as the holesbecome partly fouled), and it also has the advantage of offering very little resistance to the flow of vapor.However, the need for resistance to liquid flow limits the total hole area (as in the case of the orifice/riserunit) that can be used. Also, for complex lateral piping (containing the holes), careful fluid flow calculationsmust be made to ensure that all holes discharge equally. For each hole, Eq. (5.8-1) may be applied.
The trough-type distributor can accommodate to wide swings in liquid rate, since the V-notch orificescan function at various heads. A disadvantage is that a uniform and extensive distribution of pour pointsmay be difficult to achieve. Also, the streams from the V-notch weirs tend to be coarse and with attendantsplashing, and the troughs offer some resistance to vapor flow. However, the trough distributor is moreresistant to fouling and indeed can collect significant amounts of solids before losing its ability to distributethe liquid. Thus, troughs are often used when distribution is not overly critical and when dirty liquids areused. If the trough openings are in the form of V-notches, the following equation is suitable for estimatingflow as a function of liquid head over the bottom of the notch:
(5.8-2)
where B is the notch angle and q is in m2/s-notch.The effect of distributor type on packing mass transfer efficiency is shown in Fig. 5.8-6, taken from
the presentation by Kunesh et al.13 The "tubed drip pan" is an orifice riser distributor with tubes extendingtoward the packing from each orifice. The system studied was cyclohexane-w-heptane. The term HETP,to be discussed in Section 5.10, refers to "height equivalent to a theoretical plate" and is a measure ofreciprocal efficiency of the packed bed. The tubed drip pan shows a 50% higher mass transfer efficiencythan the notched trough unit when a through-flow packing such as slotted Raschig rings is used.
Sprays also may be used for liquid distribution. When more than one nozzle is needed, overlapping (orunderlapping) of spray patterns is inevitable. Care must be taken to select a full cone spray nozzle thatdoes not have too fine a mean drop size (to prevent entrainment of liquid by the rising vapor) and whichhas a good pattern of spray over the needed cross section. Nozzles are available for handling liquidscontaining suspended solids, and thus spray distribution is a possible solution to the need to distribute adirty liquid.
LIQUID REDISTRIBUTIONAs shown in Fig. 5.8-1, when a stream is added or withdrawn from the side of the column, it is necessaryto collect the liquid from the bed above and redistribute to the next bed below. Considering the bed fromwhich the liquid is to be collected, a support plate (see below) is used for the packing support, and liquidflowing from this plate is collected in a device that resembles the orifice/riser distributor, except that insteadof the orifices a sump or weir box is used to channel the liquid to a distributor serving the bed below. Inthe instance of a liquid feed being admitted between these beds, the liquid is fed to the lower distributorand mixed with the liquid from the collector above. This arrangement is diagrammed in Fig. 5.8-7. For avapor feed, or a feed that is a mixture of vapor and liquid, a special baffling arrangement can be used toseparate the two phases.
Another aspect of liquid redistribution involves the handling of liquid that has migrated to the walls
Pres
sure
dro
p/th
eore
tica!
sta
ge,
mm
H2O
Gauze
50 mm Pali rings
EB/SM, 100 mm Hg
Sieve tray

FIGURE 5.8-4 Structured packing (Flexipac) of the sheetmetal type: (a) fabricated to fit a pilot-scalecolumn and (b) arranged to fit through the manways of a larger-diameter column (Koch Engineering Co.).
within the packed bed itself. This can be handled with wall wiping devices, if the bed contains randompacking; such devices are simple ring-type affairs that slope downward (Fig. 5.8-8) and that must be placedin the bed during the packing process. Wall wipers are generally not needed if the column diameter is morethan 10 times the packing piece diameter. SiIvey and Keller11 found that for Raschig rings and a trough-type distributor, no redistribution was needed for bed heights up to about 10 m (33 ft). A good generalrule is to limit the height of randomly packed beds to about 7 m (23 ft).
VAPOR DISTRIBUTIONWhile it is apparent that vapor (or gas) should be distributed uniformly to the packing at the bed support,there is usually the assumption that if the initial distribution is not good, pressure drop in the bed will makethe necessary correction. While this assumption is valid for the traditional bluff body packings, it does notapply to the high-efficiency through-flow random packings or to the modern structured packings. Theinherent low pressure drop of such packings may not be sufficient to correct vapor maldistribution.
There are no quantitative guidelines for determining how "good" the distribution should be. The bedsupport may offer little help in ironing out maldistribution. Reasonable care should be used to disperse
(a)
(b)

Vendors: (1) Koch Engineering Co., Wichita, KS.(2) Glitsch, Inc., Dallas, TX.(3) Sulzer Brothers Ltd., Winterthur, Switzerland.(4) Munters Corp., Fort Myers, FL.(5) Kuhni, Ltd., Basle, Switzerland.(6) Julius Montz Co., Hilden, West Germany.
side-entering vapor (e.g., the vapor-liquid return from a reboiler) across the column cross section. Forcritical cases, one or two crossflow trays may be used to improve the distribution, if the pressure drop theyconsume can be tolerated.
LIQUID HOLDUPThe void space in a packed bed is occupied by vapor and liquid during operation. As might be expectedfor countercurrent flow, higher vapor rates restrict liquid downflow and increase liquid holdup. In theextreme case, a sufficient amount of holdup can represent an incipient flooding condition. Figure 5.8-9shows typical holdup and interfacial areas for 1 in. ceramic Raschig rings. At low liquid rates there is littleinfluence of vapor rate on holdup or interfacial area, the latter approximating the specific surface area ofthe packing itself. At higher rates of liquid and vapor flows, there is clear interaction between the streamsand a buildup of liquid takes place. This happens in the so-called "loading zone."
The holdup shown in Fig. 5.8-9 is given as a fraction of the total bed volume. It is a dynamic, or totalholdup, and is given the notation H1. If the vapor and liquid flows were to be stopped, and the bed thenallowed to drain, a certain amount of liquid would be retained in the interstices of the bed; this is the staticholdup, Hs. The difference between these holdup values is the operating holdup, H0.Thus,
(5.8-3)
The effective void fraction under operating conditions is
(5.8-4)
For random packings, Shulman et al.14 proposed the following relationship for the static holdup:
(5.8-5)
TALE 5.8-2 Properties of Structured Packings
Name
Flexipac
Gempak
Sulzer
Kerapak
Munters
Rombopak
Montz
Goodloe
Material
Metal
Metal
Metal gauze
Ceramic
Plastic
Metal
Metal
Metal knit
NominalSize
1234
4a4a2aIa
CYBXAX
BX
6,56012,06017,06025,060
SurfaceArea
(m2/m3)
55825013569
525394262131
700500250
450
40022014898
755
VoidFraction
0.910.930.960.98
0.850.900.95
0.75
PackingFactor (m"1)
108725230
193895633
Vendor
(D
(2)
(3)
(3)
(4)
(5)
(6)
(2)

Percentage of useable capacityFIGURE 5.8-6 Effect of liquid distributor type on packing efficiency (Ref. 13) for 1 in. Pall rings, 24psia, cyclohexane-/i-heptane.
SI conversion
kPa = psi x 6.89
Tubed drip pan
HETP
Rat
io
Notched trough
(c) (d)FIGURE 5.8-5 Types of liquid distributors: (a) orifice/riser; (b) perforated pipe; (c) trough; and (d) spraynozzle.
(a) (b)

Feed liquid
Upper bed
Lower bed
Upper bed support
Collector tray
Downcomer
Distributor tray
Lower bed hold-downscreen ("limiter")
FIGURE 5.8-7 Collection and redistribution at a packed-column feed tray.
FIGURE 5.8-8 Wall-wiper liquid redistributor.

G, Gas rate, lbm/h • ft2 G, Gas rate lbm/h • ft2
FIGURE 5.8-9 Liquid holdup and interfacial area, 1 in. ceramic rings (Ref. 14).
Values of the constants in Eq. (5.8-5) are as follows:
C1 C2 C3
25 mm carbon Raschig rings 0.086 0.02 0.2325 mm ceramic Raschig rings 0.00092 0.02 0.9925 mm ceramic Berl saddles 0.0055 0.04 0.55
The packings tested by Shulman and coworkers are of the traditional bluff body type. One would expectholdup values to be lower for the through-flow type packings. Vendors usually have available holdup valuesbased on air-water tests.
Operating holdup may be estimated from the dimensionless equation of Buchanan:15
(5.8-6)
The first group on the right is a film number and the second is the Froude number. More will be said aboutthese dimensionless parameters when structured packings are discussed. Representative operating holdupdata for a structured packing material are given in Fig. 5.8-10.
LOADING/FLOODINGAs mentioned above, when the vapor rate is very high, downflowing liquid tends to be held up by the dragof the vapor. This reduces the net available cross section for vapor flow and causes the pressure drop toincrease. If vapor rate continues to increase, liquid will be carried overhead and the column will reach astate of incipient flooding. The same situation can arise if there is a large increase in liquid rate, whenvapor rate is kept constant, and excessive rates of liquid also can lead to a state of incipient flooding.
These effects of liquid and vapor flow rates are exhibited in Fig. 5.8-11, based on the studies ofSarchet.17 At low liquid rates, there is essentially vapor flow through a dry bed; that is, liquid occupies arelatively small portion of the available cross section for vapor flow. The effect on pressure drop of higherliquid rates is evident; the pressure drop curves bend upward, as a result of the greatly increased liquidholdup. At the very high rates of vapor and liquid flows, flooding occurs, and this represents a maximumpossible operating condition. As for tray-type devices, it is convenient to relate certain aspects of packedbed operation to this maximum condition, even though it does not represent a practical operating condition.
A discussion of the techniques for measuring the flood condition has been given by SiIvey and Keller;18
as one considers making such a measurement he or she soon realizes that the flood point determination isinfluenced by the measurement approach and that it is really not a "point" but a fairly narrow range ofvalues. Even so, methods for making an estimate of the flood point are useful and are outlined in thefollowing section dealing with pressure drop.
H,, L
iquid
hold
up, f
t3 liqu
id/ft
3 pac
king
2 3
a, Ef
fecti
ve in
terfa
cial a
rea,
ft
/ft
pack
ing 1.0 in.Raschig rings
1.0 in. Raschig rings
Loading point
Loading point

Gas rate, lbm/h • ft2
FIGURE 5.8-11 Pressure drop for flow through 1-in. ceramic Raschig rings, air-water system (Ref. 17).
L = Water rate, lbm/h • ft2
x = Point where water beginsto build up over
in.
H2O
/ft
2
OO
-n >
Vol
ume
hold
up %
Vol
ume
hold
up, %
I NTERFACIAL AREAThe amount of interfacial area that is available in the packed column is of vital importance in determiningthe mass transfer efficiency of the packed column. However, it is rarely known with any degree of accuracy.It bears some relation to the specific area of the packing, that is, the amount of dry packing surface providedby the packing elements. But even this parameter is not really known with accuracy in the case of therandom packings, since an exact count of elements contained in the column is not feasible for commercialscale columns, and even for controlled pilot-scale units the elements may nest or otherwise block out areathat can then serve no purpose for mass transfer.
Figure 5.8-9 shows effective interfacial areas that were deduced by Shulman et al.14 from experimentson the sublimation of naphthalene Raschig rings. Many other studies have been made in an attempt torelate effective area to specific packing surface, as a function of liquid and vapor flow rates. Generally, itis thought that the effective area reaches the specific area near the onset of flooding, but Fig. 5.8-9 showsthat this may not be the case. It also should be noted that the total area available for mass transfer includesfilm surface ripples, entrained liquid within the bed, and vapor bubbling through pockets of liquid held upin the bed. Another important point: relative specific surface of different packings might indicate relativemass transfer efficiencies, but this is often not the case.
In the present state of development, at least for the random packings, it is prudent to deal with an"effective mass transfer surface", as used by Bravo and Fair,16 that can be deduced by semiempiricalmeans, or simply to couple the area term with the mass transfer coefficient to form a volumetric-typecoefficient.
Pressure Drop
RANDOM PACKINGSIt is clear from experimental data such as those shown in Fig. 5.8-11 that the loss of pressure experiencedby the vapor as it flows through the packing is a function of flow rates, system properties, and packingcharacteristics. The resistance offered by the bed is a combination of form drag and skin friction, and thusthe shape of the packing elements must be considered. While some efforts have been made to correlatepressure drop in randomly packed beds by means of a dry bed friction factor that is modified according tovapor flow, the efforts have not been successful for handling the many different possible packing shapesand sizes. (Such an approach has been more successful for the structured packings and will be describedin the next subsection.) As a result, it has been necessary to use empirical approaches for estimatingpressure drop in beds containing the random packings. These approaches are based on the observation thatat flooding, or incipient flooding, most beds exhibit a pressure drop of about 20 mbar/m of packed height(2.5 in. water/ft).
In working with a modification of an early flooding correlation of Sherwood et al.,19 Eckert20 developeda graphical method for pressure drop estimation, shown in Fig. 5.8-12. The Eckert diagram originally wasdesigned to provide both flooding and pressure drop information. The effects of packing type and size areforced to merge through the use of a packing factor that is presumed to be a constant for a given packingtype and size. Representative values of the factor are given in Table 5.8-1, and vendors of packings notlisted can supply values of the packing factor for their products. This approach to the estimation of pressuredrop is quite simple and rapid. It gives approximate values and is recommended for applications when thepressure drop estimation is not of critical importance.
A more fundamental approach to pressure drop prediction is being pursued by current researchers. Theusual first step is to consider the dry pressure drop only, utilizing a conventional Fanning or Darcy typerelationship:
pressure dropheight of bed K ' ' '
Any consistent set of units may be used. After dry pressure drop is determined, the influence of irrigationliquid is introduced:
(5.8-8)
In this equation A' is a constant, characteristic of packing type and size. Pressure drops through beds ofrandom packings have been correlated by these equations,21" but it is not yet possible to point toward aparticular piece of work that gives reliable results for the full range of possible packings.
An adaptation of the basic theory has been presented by Billet and Mackowiak23 and is stated to bevalid for loadings up to about 65% of the flood point. Liquid holdup is obtained from
(5.8-9)

L = Liquid rate, kg/s m2
G = Gas rate, kg/s rr>2Pj_ = Liquid density, kg/m3Pg = Gas density, kg/m3Fp = Packing factor, m"1^L - Viscosity of liquid, mPa s* = Ratio, (density of water)/(density of liquid)g = Gravitational constant, 9.81 m/s2
FIGURE 5.8-12 Eckert method for estimating packed column flooding and pressure drop (Ref. 20). {Note:mm Hg/m x 0.163 = in. H2O/ft.)
where
Froude n u m b e r ( 5 . 8 - 1 0 )
dry bed drop= (5.8-11)
In this expression dp is the effective packing size [=6(1 — e)/ap] and K' is the Ergun-Brauer wall factor:
(5.8-12)
The friction factor in Eq. (5.8-11) is taken as constant at 2.45 for vapor Reynolds numbers of 2100 orhigher. For lower Reynolds numbers,
(5.8-13)
(5.8-14)
Finally, the ratio of irrigated to dry pressure drop is obtained:
Parameter Of Curves IsPressure Drop, mm Hg/meterOf Packed Height

AIR MASS VELOCITYFIGURE 5.8-13 Typical vendor data on random packing pressure drop. One-inch ceramic Raschig rings,air-water system (Norton Co.).
AP-IN
CHES
WAT
ER/F
T. ffc
CKIN
G
Pf^S?!M.-№^^ MS RAIl
TABLE 5.8-3 Constants for Billet Pressure Drop Equations
Packing Material f <t> X Ch
Pall rings Metal 2.45 0.81 0.525 1.0Ceramic 1.95 0.92 0.64 1.15Plastic 2.45 0.83 0.57 0.75
NSW rings* Plastic 1.025 1.0 0.61 0.75Bialecki rings Metal 2.45 0.79 0.596 1.0
•Also known as Nor-Pac packing, product of NSW Co., Roanoke, VA.
(5.8-15)
where <f> — geometric packing factorX = aperture correction factore = packing void fraction
Values of the several constants, each determined experimentally for a particular packing type (but for arange of sizes), are given in Table 5.8-3.
A final approach to the problem of estimating pressure drop for random packings should not be over-looked: test data from the packing vendors. These data usually are based on air-water and are taken in thevendor laboratories. They are presented in charts such as that shown in Fig. 5.8-13. In the example shown,pressure drop is given as a function of gas mass velocity. For gases other than air, the abscissa should bemultiplied by the square root of the ratio, air density to the density of the gas under consideration:

EXAMPLE 5.8-1For the conditions of Example 5.7-1, that is, the top zone of a methanol-water fractionator, and for thecase of 50 mm Pall rings replacing the sieve trays, estimate the pressure drop in the top 0.5 m of packing,using (a) the Eckert graphical method and (b) the Billet analytical method.
Solution, (a) From Example 5.7-1, the value of the flow parameter is
For the ordinate scale parameter of the Eckert chart (Fig. 5.8-12),
From Fig. 5.8-12,
Pressure drop = 2.0 mm Hg/m (0.33 in. H2O/ft)
Thus, for a packing height of 0.5 m,
AP = 1.0 mm Hg
(b) Using the Billet method,
Since ReK is greater than 2100, / = 2.45. By Eq. (5.8-11),

STRUCTURED PACKINGSThe pressure drop through structured packings may be estimated according to the method of Bravo et al.24
as outlined below. The method applies to conditions below the loading point.Equation (5.8-6) may be adapted to allow for vapor flow through the channels of the packing:
(5.8-16)
The effective gas velocity inside the flow channel takes into account the slope of the corrugations, asproposed in an earlier paper by Bravo et al.:24
(5.8-17)
where B is the angle of inclination of the flow channel from the horizontal. The equivalent diameter of theflow channel d^ is taken as the side of a corrugation or crimp of the packing (see Table 5.8-4).
The friction factor for Eq. (5.8-16) is obtained from the general relationship
(5.8-18)
where C1 and C2 are constants for a particular packing type and size. The Reynolds group of Eq. (5.8-18)is defined as
(5.8-19)
This friction factor is applicable to gas flow only and incorporates both turbulent and laminar contributions.Since the shapes of the flow channels of the structured packings are geometrically similar, one would expectthat a single set of constants for Eq. (5.8-18) would cover all packing sizes.
When the packing is irrigated, the influence of the presence of liquid may be related to the operatingholdup, using a form alternate to that given earlier as Fig. 5.8-6. Bemer and Kallis22 concluded that thefollowing simple form is adequate:
(5.8-20)
where A' and a are constants for the packing type.Equation (5.8-8) is then adapted for the total pressure drop:
(5.8-21)
where
Finally, by Eq. (5.8-15),

FIGURE 5.8-14 Geometric factors for estimating structured packing pressure drop (Ref. 24).
(5.8-22)
Figure 5.8-14 shows the flow channel geometry factors. Bravo et al.24 found that for the corrugated-typestructured packings only the constant C3 was variable; values of the other constants in Eqs. (5.8-18) and(5.8-22) are C1 = 0.171, C2 = 92.7, and a = 0.5. Thus, the final working equation is
(5.8-23)
Values of the constant C3 are given in Table 5.8-4.
EXAMPLE 5.8-2In the preceding example, the use of 50 mm Pall rings was considered for the methanol-water fractionatorof Example 5.7-1. For the case of a 12.5 mm crimp height structured packing of the sheet metal type(Flexipac 2, Gempak 2A), estimate the pressure drop in the top 0.5 m of the packed bed.
Solution. For the No. 2 structured packing and from Table 5.8-4,
TABLE 5.8-4 Pressure Drop Parameters for Structured Packings
EquivalentAngle* Diameter
Packing (degrees) (mm) Constant C3
Flexipac 1 45 9 3.382 45 18 3.083 45 36 4.504 45 72 7.26
Gempak IA 45 36 4.502A 45 18 3.083A 45 13.5 3.874A 45 9 3.38
Sulzer BX 60 9 3.38
•Angle of channel from horizontal.
Flow Channel
Triangular crosssection
Flow channel arrangementFlow channel cross section

From Example 5.8-1,
Finally,
or, for 0.5 m of bed, AP = 0.42 mm Hg.
5.8-4 Vapor Capacity
Generalized correlations for flood point prediction have been based on the early work of Sherwood et al.19
Modifications of this work have been made from time to time, with that of Eckert,20 mentioned earlier inconnection with pressure drop estimation, being representative of those now in use. The flood line isdesignated as the top curve of Fig. 5.8-12. Thus, as for pressure drop, the Eckert chart enables a quickestimate of the maximum allowable vapor flow through the packed bed in question.
The ordinate group of Fig. 5.8-12 is a form of the capacity factor used in Fig. 5.7-10 for estimatingflooding in tray columns. It is possible to replace the group with the much simpler Souders-Brown coefficientand obtain quite good correlations of flooding data,25 and a generalized chart on this basis is shown in Fig.5.8-15. Parameters for the chart are shown in Table 5.8-5. This graphical approach to flooding is recom-mended over the one of Eckert, and it can be used for the structured packings as well as the randompackings.
5.9 MASS TRANSFER IN TRAY COLUMNS
5.9-1 Efficiency Definitions and Approaches to Prediction
In Section 5.3 methods were developed for the determination of the number of theoretical stages, or contacts,needed for a given separation. For a tray column, the designer must specify the actual number of trays(stages, contacts) to be installed, and each of these actual stages must operate efficiently enough to givean equivalent theoretical stage, or portion of an equivalent theoretical stage.
Several different efficiency terms will be used in this section, and the one ultimately needed for designis overall column efficiency:
(5.9-1)
where the computed number of theoretical stages is N, and the actual number of column trays is A .̂ Notethat a reboiler or a partial condenser would not be included in Nt: one is concerned here only with thestages in the column itself. Note further that the number of trays actually specified for the column may begreater than Nay to allow for future contingencies, column control problems, and so on.
The efficiency of a distillation column depends on three sets of design parameters:
1. The system being processed, its composition and properties.2. Flow conditions and degree of loading.3. The geometry of the contacting device and how it influences the intimate interaction of vapor and
liquid.
It is clear that each of these parameters is not completely independent of the others and that the designermay not have much control over all of them. Still, it is convenient to consider efficiency from these threeviewpoints and there are optimum approaches to combining them.
Since conditions vary throughout the column, it is more fundamental to deal with a tray efficiency.
Next Page