previous sailing yachts seakeeping investigation in view
TRANSCRIPT
1
Previous sailing yachts seakeeping investigation in view of a new set of rules
Adrien Combourieu
Master Thesis
presented in partial fulfillment of the requirements for the double degree:
“Advanced Master in Naval Architecture” conferred by University of Liege "Master of Sciences in Applied Mechanics, specialization in Hydrodynamics,
Energetics and Propulsion” conferred by Ecole Centrale de Nantes
developed at University of Genoa in the framework of the
“EMSHIP” Erasmus Mundus Master Course
in “Integrated Advanced Ship Design”
Ref. 159652-1-2009-1-BE-ERA MUNDUS-EMMC
Supervisor: Prof. Dario Boote, University of Genoa
Reviewer: Prof. Leonard Domnisoru, University of Galati
Genoa, January 2013
2 Adrien Combourieu
Master Thesis developed at University of Genoa
CONTENTS
ABSTRACT 4
1. INTRODUCTION 5
2. THEORY OF SEAKEEPING 7
2.1. General Problem and conventions 7
2.2. Overview of Methods 8
2.3. Linear Theory 8
3. PRESENTATION OF HYDROSTAR 11
3.1. Potential Flow Problem 11
3.2. Panel Method 13
3.3. Equation of Motion in Frequency Domain 13
3.4. Radiation Diffraction Problem 14
3.5. Highlights on the Full Numerical Process 16
4. PRESENTATION OF THE DATABASE 17
4.1. Origin and Available Data 17
4.2. Modeling with FreeShip 17
4.3. Main Dimensions 18
5. ANALYSIS OF PITCH RAOs 19
5.1. Formatting of RAOs 19
5.2. Comparison with Experimental Data 20
5.3. Pitch Resonance Frequency in Function of Waterline Length 21
5.4. Wave Length Range of Interest 23
5.5 Simplified Pitch RAO 25
6. ACCELERATION RAOs 27
6.1. Acceleration for 1 DOF 27
6.2. Motions Coupling 27
6.3. Comparison of Accelerations in Mast and Cockpit 28
6.4. Results on the Database and Quick Estimation of Mast Acceleration 30
7. SEA STATE CALCULATIONS 33
7.1. Theoretical formulation 33
7.2. Pitch Time Series: Comparison With Experimental Data 35
7.3. Influence of Peak Enhancement Factor 36
7.4. Influence of Significant Wave Height 37
7.5. Influence of Peak Period: “Irregular RAO” 38
7.6. About Worst Case Scenario 41
8. INFLUENCE OF SOME PARAMETERS 43
8.1. Influence of Pitch Radius of Gyration 43
8.2. Influence of Forward Speed 45
8.3. Influence of Heading 47
8.4. Influence of Heel Angle 48
8.5. Influence of Keel 48
8.6. Influence of Water Depth 50
Previous sailing yachts seakeeping investigation in view of a new set of rules 3
“EMSHIP” Erasmus Mundus Master Course, period of study September 2011 – February 2013
8.7. Influence of Center of Gravity Position 50
9. INFLUENCE OF HULL SHAPE 52
9.1. Stern Shape 52
9.2. Beam Draft Ratio 54
9.3. Draft and Displacement 56
10. REAL SCENARIO 57
10.1. Presentation of Kiboko 57
10.2. Estimation of Pitch Results With Proposed Method 58
10.3. Wind and Sea Relation 60
10.4. Detailed Results in Sea States 62
11. CONCLUSION 65
12. ACKNOWLEDGEMENTS 66
13. REFERENCES 67
APPENDIX 68
4 Adrien Combourieu
Master Thesis developed at University of Genoa
ABSTRACT
Sailing boat dismasting is an impressive and dangerous event which consequences are
obviously critical. The causes that can lead to dismasting just start to be precisely investigated
and understood. As a matter of fact, rules of classification societies are nowadays quite poor
when it comes to mast and rigging. Indeed, these causes are intricate and of different kinds.
One of the reasons of dismasting is the lack of good estimations of the loads that will
be applied to the mast and rigging. Part of these loads is due to ship motion in waves, mainly
pitching.
This work is a study of the pitching behavior of sailing vessels at sea with HydroStar
software. It is a potential flow solver using panel methods and developed by Bureau Veritas.
Only linear theory is used here. The aim of this paper is to study what are the main parameters
that drive a sailing boat pitching behavior. It is a first step in the view of building a simplified
method to be able to quickly estimate inertial loads due to waves.
First, the global problem of seakeeping and the method used by HydroStar to solve it
are briefly presented. Then, pitching motion results in regular waves are shown and analyzed
for a small set of modern sailing yachts hulls. Despite the small size of the database a first
simple method to estimate pitch response amplitude operator is proposed, based only on boat
length.
Afterwards, method and results about acceleration in the mast are discussed. A very
rough but quick formulation to evaluate the longitudinal acceleration or force in the mast is
set.
A state-of-the-art process is then applied to enlarge results to irregular sea states and
compute time series. Good agreement with some real full scale measurements is shown in
term of pitching. The sea state parameters influence on pitch motion is studied and the
concept of irregular RAO is proposed.
The influence of different ship parameters is then studied leading to a short list of key
parameters.
To finish, a real case scenario is performed using all the previous conclusions on the
yacht Kiboko. The aim of these results is to be further compared to on-board measurements
that may occur in the next months.
Previous sailing yachts seakeeping investigation in view of a new set of rules 5
“EMSHIP” Erasmus Mundus Master Course, period of study September 2011 – February 2013
1. INTRODUCTION
From a classification society point of view, yachts and particularly sailing yachts
present really specific issues. Unlike for commercial vessels owners, money is not the main
problem of sailing yachts owner. They take risks and put the ship in situations that a
commercial boat would avoid. They always want to be faster.
Of course, such a philosophy sometimes leads to accidents. Dismasting is a critical
one. Not only the ship loses its main propulsion system but also the fall of the mast may be
dangerous for the crew or passengers. Rules concerning the mast scantling are today very
poor. In RINA rules for sailing yachts [5], it is said:
“Each yacht is to be provided with masts, rigging and sails sufficient in number and in good
condition. The scantlings of masts and rigging are left to the experience of builders and
shipowners.”
The main reason explaining this is the lack of understanding of the loads to which the
mast will be submitted. Indeed, these loads are of two kinds. The most obvious is the
aerodynamic force due to wind in the sail. Thanks to wind theory, these forces are quite well
understood in steady state. Another kind of loads is due to ship motion in wave – mainly
pitching. Indeed, pitch motion leads to strong inertial loads in the mast. In addition, it alters
the steady aerodynamic forces in a non negligible way, as shown in recent works (e.g.
[1],[4]).
Part of the work to understand more accurately the effective loads in the mast is thus
to be able to estimate the ship motion at sea. From a classification society point of view, the
aim would be to build a simplified process to be able to quickly estimate the ship pitching
behavior and the induced acceleration in the mast. With such a process, new rules for masts
and rigging scantling could be proposed. This work is a first step in that direction.
In this work, the software HydroStar is used to evaluate the ships response amplitude
operators (RAO). It is a potential flow solver based on panel methods. It is developed by
Bureau Veritas. All this work lies under linear theory.
In the two first parts, the general seakeeping problem and the method used by
HydroStar to solve it are briefly exposed. In the third part, the small database of modern
sailing boat hulls on which calculations have been performed is presented. In the fourth part,
results in term of pitch RAOs are shown and discussed. A quick formulation based only on
boat length is proposed to evaluate roughly a pitch RAO for a modern sailing boat. In the fifth
part, a discussion is made about acceleration in the mast evaluation. In the sixth part, a state-

6 Adrien Combourieu
Master Thesis developed at University of Genoa
of-the-art method to extend the results in irregular sea is presented and the effects of sea state
parameters are analyzed. In parts 7 and 8, influence on pitch motion of some ship parameters
is studied. Finally, in part 9, a real test case is performed using all the previous exposed
methods and conclusions.

Previous sailing yachts seakeeping investigation in view of a new set of rules 7
“EMSHIP” Erasmus Mundus Master Course, period of study September 2011 – February 2013
2. SEAKEEPING THEORY
2.1. General Problem and conventions
Seakeeping addresses the problem of ship motion at sea due to waves. The motion of
the ship is decomposed into 6 basic motions (3 translations and 3 rotations) also called 6
degrees of freedom (DOF). This is depicted in figure 1 where the convention for the axis and
rotations can also be seen.
Figure 1. Ship 6 degrees of freedom and axis convention
The notations for these 6 DOF follow the usual convention:
x1: surge
x2: sway
x3: heave
x4: roll
x5: pitch
x6: yaw
The time derivative of any value x(t) is written . In the following, pitch motion
will be specifically studied.
8 Adrien Combourieu
Master Thesis developed at University of Genoa
2.2. Overview of Methods
To forecast seakeeping behavior of a vessel, different methods are available. First,
experimental measurement can be carried out on a ship model in a towing tank. Experiments
are ideally performed in a wave basin or, with fewer possibilities, in a regular basin.
Less expensive, numerical computations can also be carried out. Different solutions
are possible, depending on the numerical model used. The first numerical solutions developed
for seakeeping applications were using a 2D potential model called strip theory. It solves the
problem section by section. The most famous strip theory software is called Pdstrip. Now that
computational power has largely increased, it has been abandoned.
Indeed, 3D potential flow solver using panel methods are today the state-of-the-art
concerning seakeeping. They need only few minutes to give seakeeping results as RAOs.
They usually use linear theory and frequency domain approach, including more on more non-
linearity. The most famous software are HydroStar, Aquaplus, Seakeeper…
Seakeeping results may also be obtained using more accurate solvers (e.g. RANS
solver like Star-CCM+) at the cost of a bigger computation time (few hours or days). RANS
solvers may be more used in the future when more powerful wave models will be available.
In this work, the potential flow solver HydroStar developed by Bureau Veritas is used
for seakeeping computations.
2.3. Linear Theory
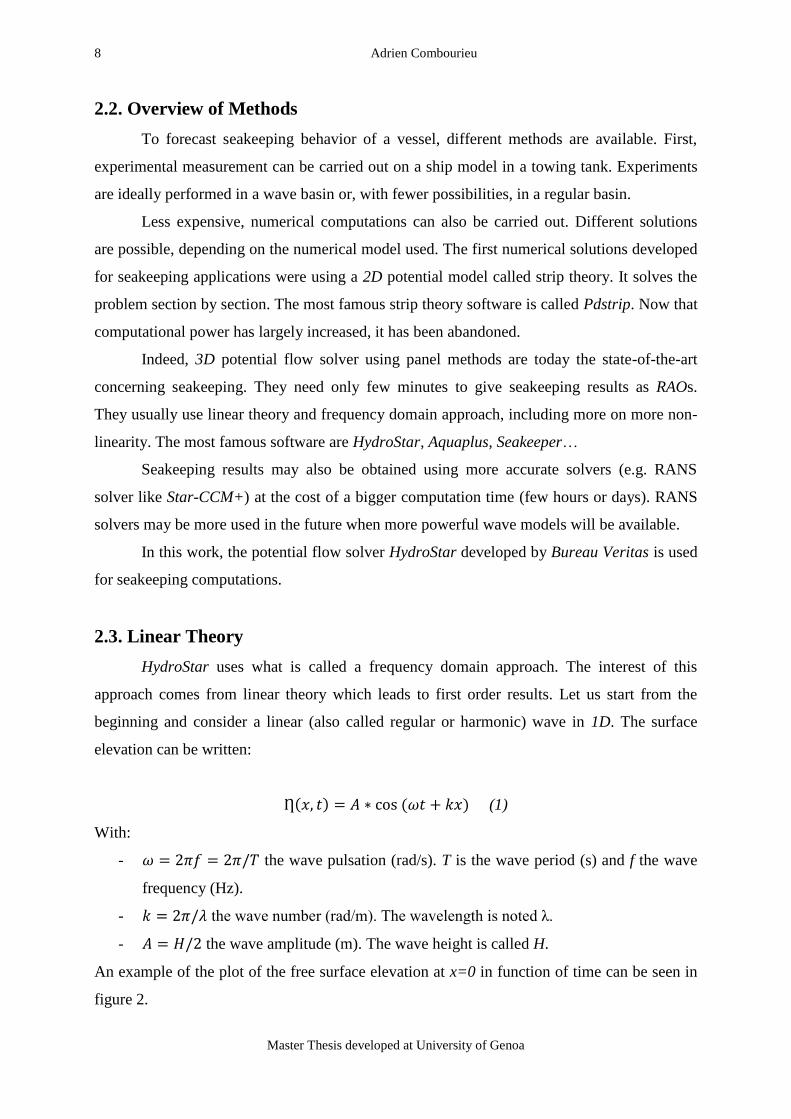
HydroStar uses what is called a frequency domain approach. The interest of this
approach comes from linear theory which leads to first order results. Let us start from the
beginning and consider a linear (also called regular or harmonic) wave in 1D. The surface
elevation can be written:
(1)
With:
- the wave pulsation (rad/s). T is the wave period (s) and f the wave
frequency (Hz).
- the wave number (rad/m). The wavelength is noted λ.
- the wave amplitude (m). The wave height is called H.
An example of the plot of the free surface elevation at x=0 in function of time can be seen in
figure 2.
Previous sailing yachts seakeeping investigation in view of a new set of rules 9
“EMSHIP” Erasmus Mundus Master Course, period of study September 2011 – February 2013
Figure 2. Free surface elevation at x=0 in function of time
Linear wave theory in infinite water depth gives an important relation that will be
largely used in the following. It comes from the dispersion relation:
(2)
This formulation means that a linear wave is completely described by its frequency and its
amplitude in infinite water depth.
Another formulation that should be kept in mind for the following is an empirical
limitation for a wave to be considered linear. Physically, a wave cannot remain sinusoidal if
its steepness ε (ε = H/λ) is too high. Indeed, above a given limit, the waves are breaking. It
means that for a given wavelength, there is a maximum height above which waves cannot be
considered linear anymore:
εmax = (3)
Now that some clues about what are linear waves are established, some considerations
about linear systems can be made. Basically, considering that the ship response to input waves
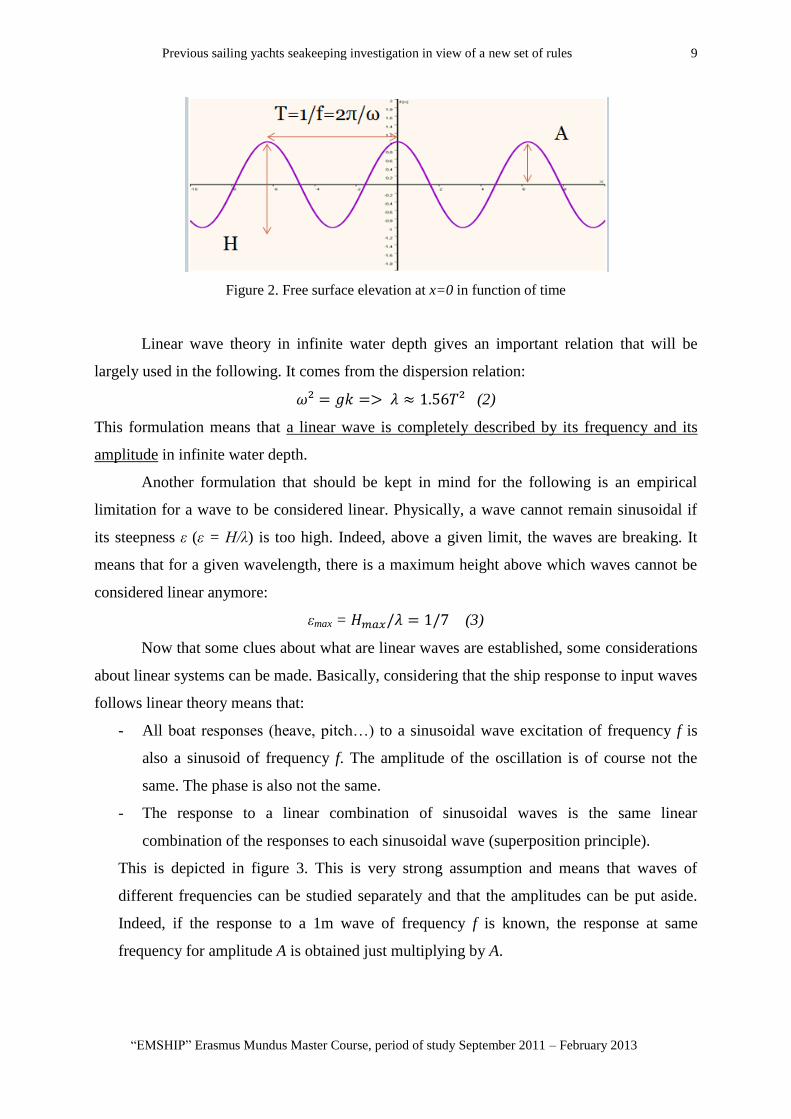
follows linear theory means that:
- All boat responses (heave, pitch…) to a sinusoidal wave excitation of frequency f is
also a sinusoid of frequency f. The amplitude of the oscillation is of course not the
same. The phase is also not the same.
- The response to a linear combination of sinusoidal waves is the same linear
combination of the responses to each sinusoidal wave (superposition principle).
This is depicted in figure 3. This is very strong assumption and means that waves of
different frequencies can be studied separately and that the amplitudes can be put aside.
Indeed, if the response to a 1m wave of frequency f is known, the response at same
frequency for amplitude A is obtained just multiplying by A.
10 Adrien Combourieu
Master Thesis developed at University of Genoa
Figure 3. Ship response in linear theory
For a given frequency f, the amplitude of the response of a response (heave, pitch…)
for a 1m wave is called RAO(f) which stands for Response Amplitude Operator. Similar
concept exists for phases and is called here φ(f).
The main issue of this work is thus to see how to compute the RAO for pitch motion
and how to estimate it quickly. The RAO concept applies not only for the 6 motions but
also for the velocities and accelerations. Another issue of this work is to compute the
acceleration in the mast RAO.
Moreover, in reality, waves at sea are not perfect sinusoids, but an irregular sea state
can be approximate as a linear combination of harmonic waves. The principle of
superposition allows getting responses also in irregular sea states.
In the next part is highlighted how HydroStar computes the motion RAOs.
Previous sailing yachts seakeeping investigation in view of a new set of rules 11
“EMSHIP” Erasmus Mundus Master Course, period of study September 2011 – February 2013
3. PRESENTATION OF HYDROSTAR
The aim of this work is to investigate the pitch motion of sailing boats. To understand
the motion of a body, one must know what the forces acting on this body are. Dealing with a
boat at sea, most of the forces acting on the boat are exerted by water. The fluid properties
need thus to be investigated.
3.1. Potential Flow Problem
Water is an incompressible Newtonian fluid which behavior is fully described by
Navier-Stokes equations. This set of equations links quantities like fluid pressure (p), velocity
(V), density (ρ).
These equations are coupled and non linear. They cannot be analytically solved. The
computation time needed to solve it is quite high (few hours or days typically for naval
issues).
Making some physical assumptions, these equations can be simplified into a new set
of equations called potential problem. Namely:
- The fluid is considered incompressible (constant density ρ=1025 kg/m3).
- The fluid is considered non viscous (υ=0). Viscosity effects are therefore always
neglected in the following.
- The flow is considered non rotational.
- The flow is considered periodic (harmonic) at pulsation ω=2πf. All the (complex)
physical quantities vary temporally in eiωt
which allows to get rid of time
dependence.
Under that assumptions, it can be shown that it exists a scalar function φ(x,y,z) called potential
that verifies a new set of equations. This set of equations is still not linear. It is linearized
using the hypothesis of small wave steepness (ε<<1) which lead to a final set of equations
verified by φ and depending on boundary conditions. It is the first order potential problem:
in the fluid domain D
in z=0 (linearized free surface F)
on the hull surface H (slip condition)
for z=-h
Where:
(4)
12 Adrien Combourieu
Master Thesis developed at University of Genoa
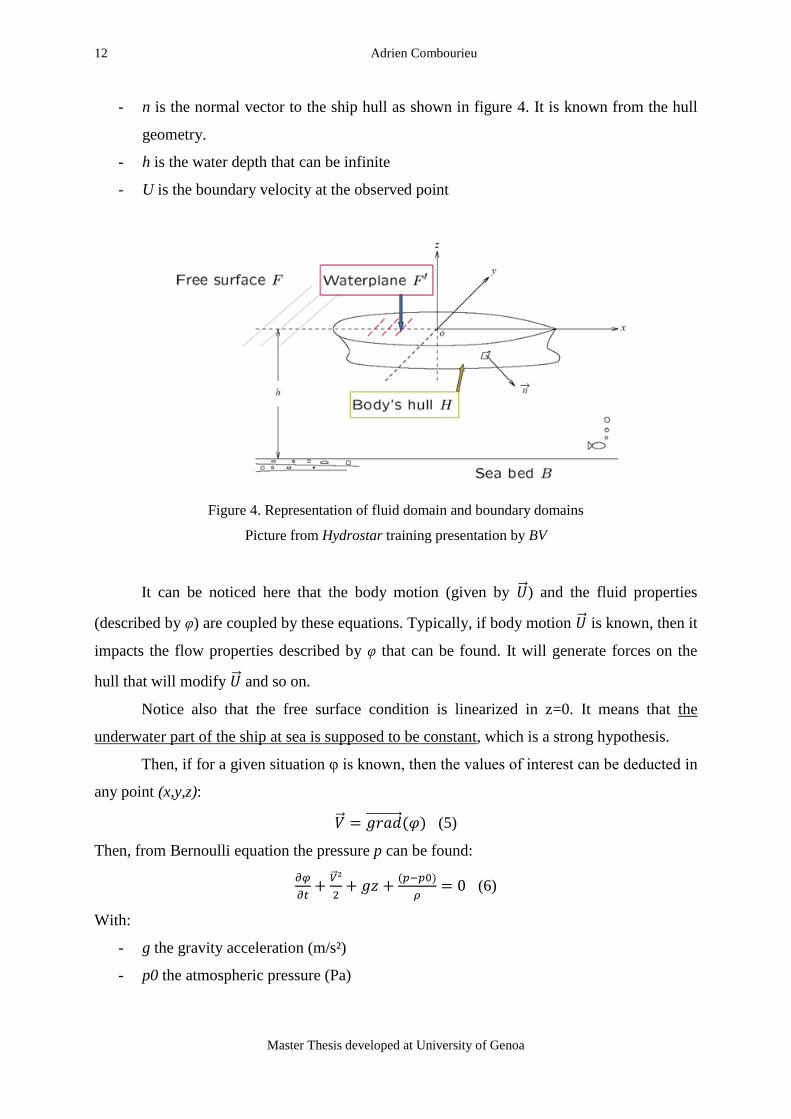
- n is the normal vector to the ship hull as shown in figure 4. It is known from the hull
geometry.
- h is the water depth that can be infinite
- U is the boundary velocity at the observed point
Figure 4. Representation of fluid domain and boundary domains
Picture from Hydrostar training presentation by BV
It can be noticed here that the body motion (given by ) and the fluid properties
(described by φ) are coupled by these equations. Typically, if body motion is known, then it
impacts the flow properties described by φ that can be found. It will generate forces on the
hull that will modify and so on.
Notice also that the free surface condition is linearized in z=0. It means that the
underwater part of the ship at sea is supposed to be constant, which is a strong hypothesis.
Then, if for a given situation φ is known, then the values of interest can be deducted in
any point (x,y,z):
(5)
Then, from Bernoulli equation the pressure p can be found:
(6)
With:
- g the gravity acceleration (m/s²)
- p0 the atmospheric pressure (Pa)
Previous sailing yachts seakeeping investigation in view of a new set of rules 13
“EMSHIP” Erasmus Mundus Master Course, period of study September 2011 – February 2013
Finally, by integrating pressure on hull surface, the forces acting on the hull can be found:
(7)
In the following, it will be explained how equation (4) is solved to find φ when is known.
Then, it will be explained how to solve the global problem of ship motion in waves using the
basic problem described by (4).
3.2. Panel Method
The idea to solve the first order potential flow problem described by (4) is to combine
elementary solutions, called singularities, to build a global solution. Indeed, a linear
combination of potential flow is still a potential flow.
In HydroStar, φ is supposed to be a linear combination of elementary potentials Gi
called green functions:
(8)
with Gi(x,y,z) = G(xi,yi,zi,x,y,z).
G has an analytical description. The N elementary potentials Gi are located on the
underwater hull surface. This is the reason why the underwater part of the hull has to be
meshed into panels. The center of each panel has the coordinates (xi,yi,zi). All Gi verify (4)
by default apart from the hull boundary condition. By injecting (8) in (4) the hull boundary
condition transforms the problem into a linear system which unknown are the αi. As big as
this linear system might be, it exists efficient mathematical methods to solve it in few
seconds. Once the αi are known, φ is known and thus velocity, pressure and forces on the hull
can be found.
Up to now, the general idea to solve (4) and how to deduce the physical quantities of
interest from it have been exposed. In the following subsections will be explained how to
solve the global seakeeping from basic problem (4).
3.3. Equation of Motion: Frequency Domain Approach
The few points exposed about linear theory in part 2.3 express the interest of studying
the seakeeping problem for a given harmonic wave excitation at frequency f or pulsation
ω=2πf. Under linear theory it is very convenient to write any physical quantity x(t) as:
(9)
With X0 complex amplitude that does not depend on time anymore. In the seakeeping
problem, all variables dependency on time is in the complex exponential and can be
14 Adrien Combourieu
Master Thesis developed at University of Genoa
simplified everywhere. The information to be found is the complex amplitude, which means
real amplitude and a phase.
With this notation, time derivative are easily computed:
(10)
(11)
In seakeeping, the variable X of interest is the boat motion. With 6 DOF, it is a vector of
dimension 6. It is ruled by the equation of motion that writes in the frequency domain:
(12)
With M the 6x6 mass matrix of the ship, which is a diagonal matrix with coefficients equals to
the displacement. As weight is cancelled by buoyancy, the hydrostatic force is only the
hydrostatic stiffness expressed by the hydrostatic 6x6 matrix which is supposed to be known:
(13)
The hydrodynamic force has different sources:
- The added mass effect that is proportional to ship acceleration.
- The wave damping proportional to ship velocity (viscous damping is not taken into account)
- The wave excitation force.
It can be written:
(14)
The waves excitation force is itself decomposed into 2 parts: the incident wave and the
diffracted wave. Finally, rearranging everything:
(15)
This equation has to be solved in X for each frequency of interest.
3.4. Radiation and Diffraction Problems
The main unknown in the equation of motion (15) is of course the vector X of ship
motion. Unfortunately, it is not the only unknown. What is known in equation (15) before
seakeeping investigation is:
- The mass matrix M and the stiffness matrix K from hydrostatics calculations.
- The incident wave excitation Fi from wave theory.
The added mass matrix Ma, the wave damping matrix B and the diffracted wave force Fd
are not known a priori. Before solving (15) for X, these 3 quantities have to be found. It is
made by decomposing the problem in two different sub problems: the radiation and the
diffraction problems.
Previous sailing yachts seakeeping investigation in view of a new set of rules 15
“EMSHIP” Erasmus Mundus Master Course, period of study September 2011 – February 2013
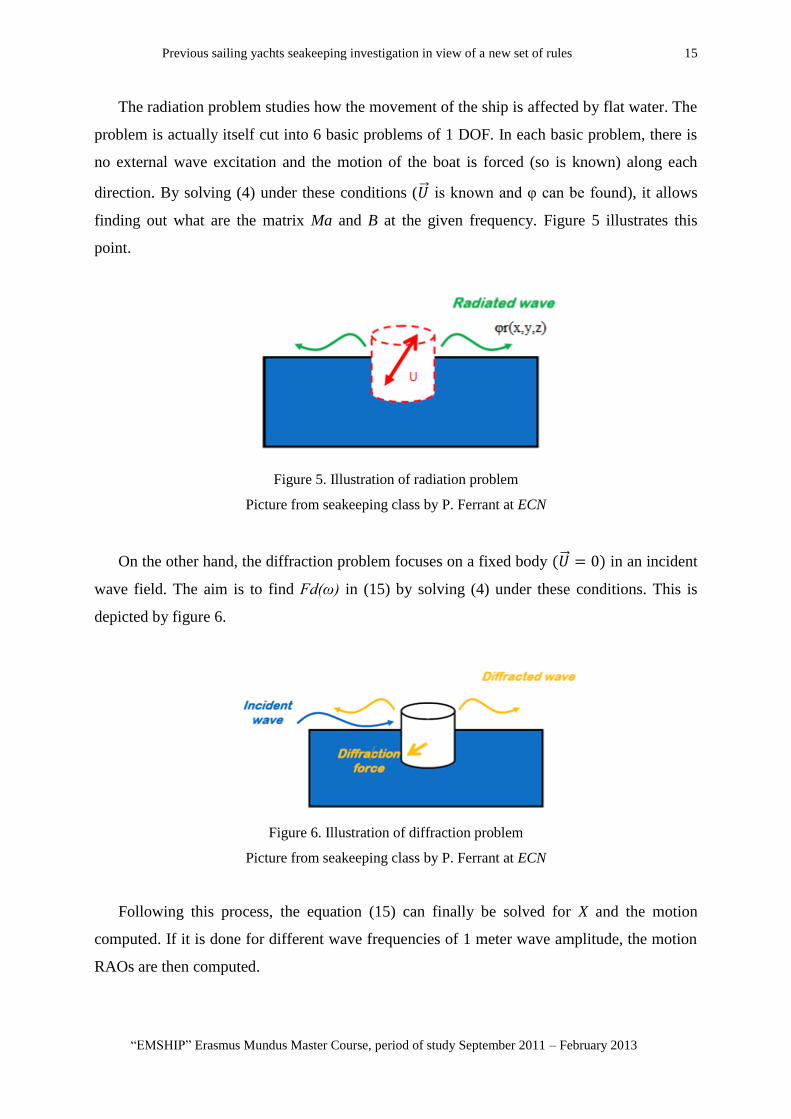
The radiation problem studies how the movement of the ship is affected by flat water. The
problem is actually itself cut into 6 basic problems of 1 DOF. In each basic problem, there is
no external wave excitation and the motion of the boat is forced (so is known) along each
direction. By solving (4) under these conditions ( is known and φ can be found), it allows
finding out what are the matrix Ma and B at the given frequency. Figure 5 illustrates this
point.
Figure 5. Illustration of radiation problem
Picture from seakeeping class by P. Ferrant at ECN
On the other hand, the diffraction problem focuses on a fixed body in an incident
wave field. The aim is to find Fd(ω) in (15) by solving (4) under these conditions. This is
depicted by figure 6.
Figure 6. Illustration of diffraction problem
Picture from seakeeping class by P. Ferrant at ECN
Following this process, the equation (15) can finally be solved for X and the motion
computed. If it is done for different wave frequencies of 1 meter wave amplitude, the motion
RAOs are then computed.
16 Adrien Combourieu
Master Thesis developed at University of Genoa
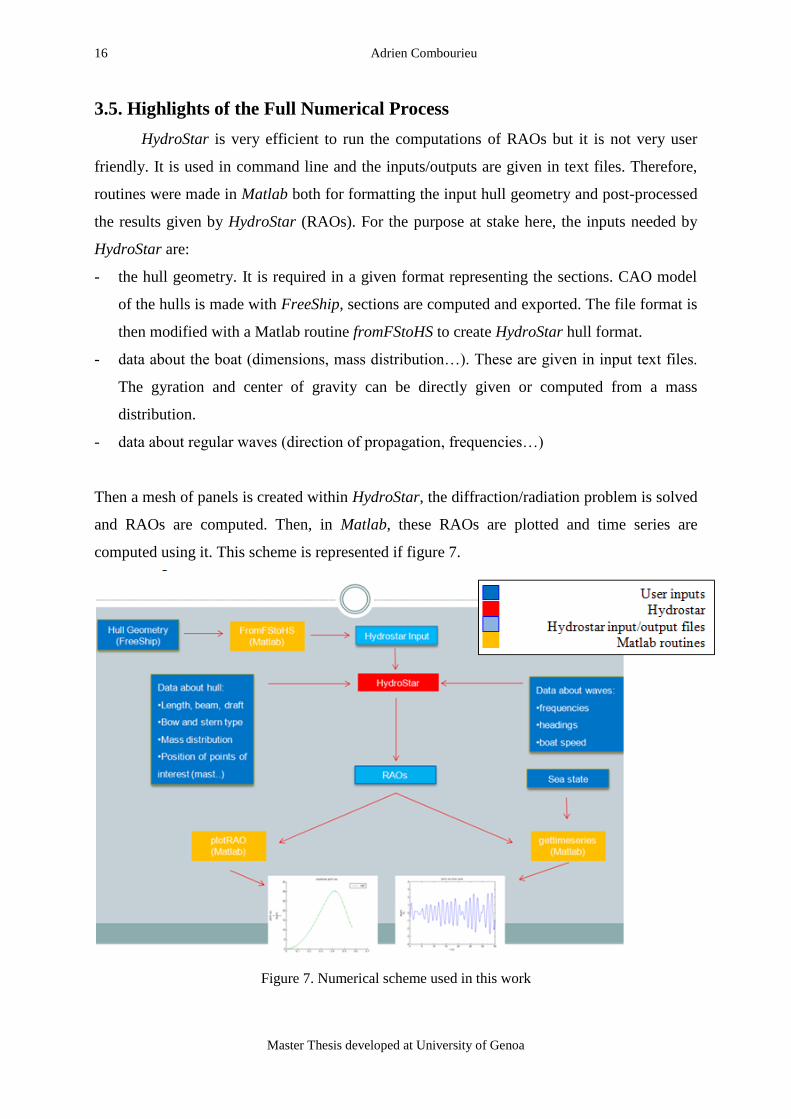
3.5. Highlights of the Full Numerical Process
HydroStar is very efficient to run the computations of RAOs but it is not very user
friendly. It is used in command line and the inputs/outputs are given in text files. Therefore,
routines were made in Matlab both for formatting the input hull geometry and post-processed
the results given by HydroStar (RAOs). For the purpose at stake here, the inputs needed by
HydroStar are:
- the hull geometry. It is required in a given format representing the sections. CAO model
of the hulls is made with FreeShip, sections are computed and exported. The file format is
then modified with a Matlab routine fromFStoHS to create HydroStar hull format.
- data about the boat (dimensions, mass distribution…). These are given in input text files.
The gyration and center of gravity can be directly given or computed from a mass
distribution.
- data about regular waves (direction of propagation, frequencies…)
Then a mesh of panels is created within HydroStar, the diffraction/radiation problem is solved
and RAOs are computed. Then, in Matlab, these RAOs are plotted and time series are
computed using it. This scheme is represented if figure 7.
Figure 7. Numerical scheme used in this work

Previous sailing yachts seakeeping investigation in view of a new set of rules 17
“EMSHIP” Erasmus Mundus Master Course, period of study September 2011 – February 2013
4. PRESENTATION OF THE DATABASE
4.1. Origin and Available Data
The database is composed of 7 modern sailing yacht hulls of different lengths from 8
meters to 30 meters. CAO models have been created using the open software FreeShip. Basic
hull descriptions have been found on the internet (builders’ website) where only few data is
available. Most of the time, main dimensions (length, beam, displacement, ballast weight) are
given and only top and longitudinal views are given.
4.2. Modeling
In FreeShip, a basic hull is quickly created from main dimensions. Only the canoe hull
body is modeled. Then, the top and longitudinal views are loaded as background images. The
hull is modified to fit these views, as shown if figure 8. The draft is given on these views and
is thus fixed. Finally, the sections are slightly modified to fit the right displacement.
Figure 8. Example of J80 modelling with FressShip
Concerning the gyration radius and center of gravity, they are computed by HydroStar
from an input mass distribution. The input mass distribution is simplified as follows:
18 Adrien Combourieu
Master Thesis developed at University of Genoa
- The ballast bulb: its mass is most of the time given by the shipyard on internet. If not, it is
evaluated as a percentage of the displacement (35%, usual percentage for this kind of
boat). The location of the bulb can be read in FreeShip.
- The mast: its mass is evaluated as a percentage of the displacement (1.5%, number given
by RINA). The mass of the mast is not so big compared to displacement but is important
for inertia computation, given the height of the mast. Its center of gravity is taken at half
the mast length and can be read in FreeShip.
- The canoe hull: its mass is all that remains. It is supposed to be uniformly distributed
along ship length. The position of the center of gravity is adjusted to fit a global LCG
equal to known LCB and a reasonable VCG (supposing that the boat was correctly built).
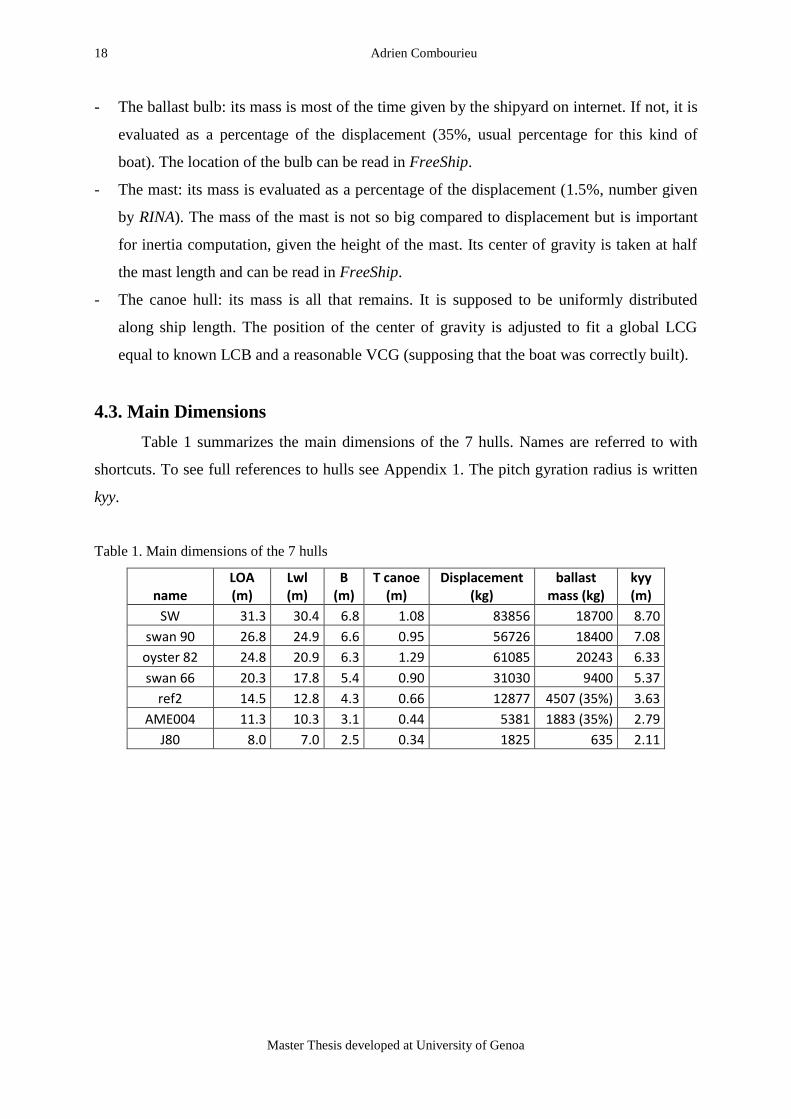
4.3. Main Dimensions
Table 1 summarizes the main dimensions of the 7 hulls. Names are referred to with
shortcuts. To see full references to hulls see Appendix 1. The pitch gyration radius is written
kyy.
Table 1. Main dimensions of the 7 hulls
name LOA (m)
Lwl (m)
B (m)
T canoe (m)
Displacement (kg)
ballast mass (kg)
kyy (m)
SW 31.3 30.4 6.8 1.08 83856 18700 8.70
swan 90 26.8 24.9 6.6 0.95 56726 18400 7.08
oyster 82 24.8 20.9 6.3 1.29 61085 20243 6.33
swan 66 20.3 17.8 5.4 0.90 31030 9400 5.37
ref2 14.5 12.8 4.3 0.66 12877 4507 (35%) 3.63
AME004 11.3 10.3 3.1 0.44 5381 1883 (35%) 2.79
J80 8.0 7.0 2.5 0.34 1825 635 2.11
Previous sailing yachts seakeeping investigation in view of a new set of rules 19
“EMSHIP” Erasmus Mundus Master Course, period of study September 2011 – February 2013
5. ANALYSIS OF PITCH RAOs
5.1. Formatting of the RAOs
There are different ways to show the RAOs. In this work, it has been chosen to plot
the responses for 1 meter of wave in function of the real wave frequency (in Hz). When
nothing else is specified, the results are given with the boat with no forward speed and in pure
head sea (heading of 180°). Indeed, anyone who has once been onboard a sailing yacht knows
that the biggest pitch happens when going in head sea. This choice is also made for simplicity
and because it is what is commonly done in literature. Impact of heading and boat speed will
be further investigated.
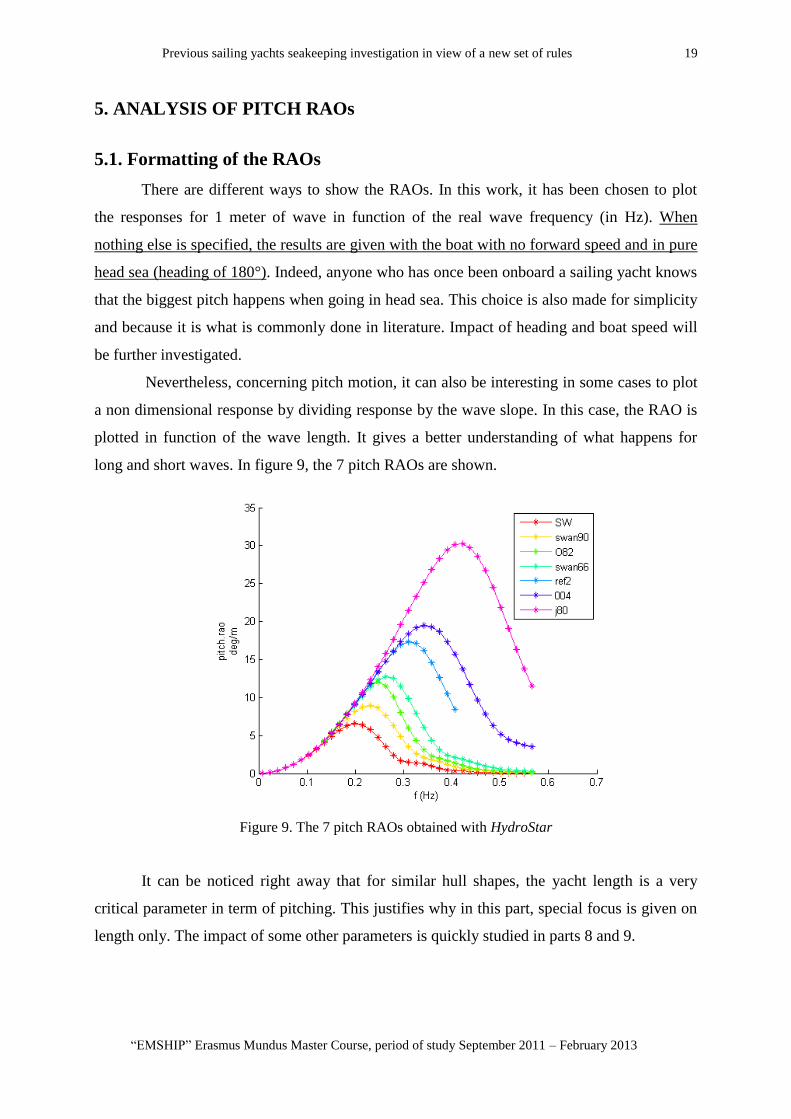
Nevertheless, concerning pitch motion, it can also be interesting in some cases to plot
a non dimensional response by dividing response by the wave slope. In this case, the RAO is
plotted in function of the wave length. It gives a better understanding of what happens for
long and short waves. In figure 9, the 7 pitch RAOs are shown.
Figure 9. The 7 pitch RAOs obtained with HydroStar
It can be noticed right away that for similar hull shapes, the yacht length is a very
critical parameter in term of pitching. This justifies why in this part, special focus is given on
length only. The impact of some other parameters is quickly studied in parts 8 and 9.
20 Adrien Combourieu
Master Thesis developed at University of Genoa
5.2. Comparison with Experimental Results
In [2], the sections and characteristics of a reference hull are given along with some
experimental seakeeping results. The idea was then to create a similar hull with freeship and
compare the results obtained with HydroStar and the experimental results of the paper. This
hull is the hull called “AME004”.
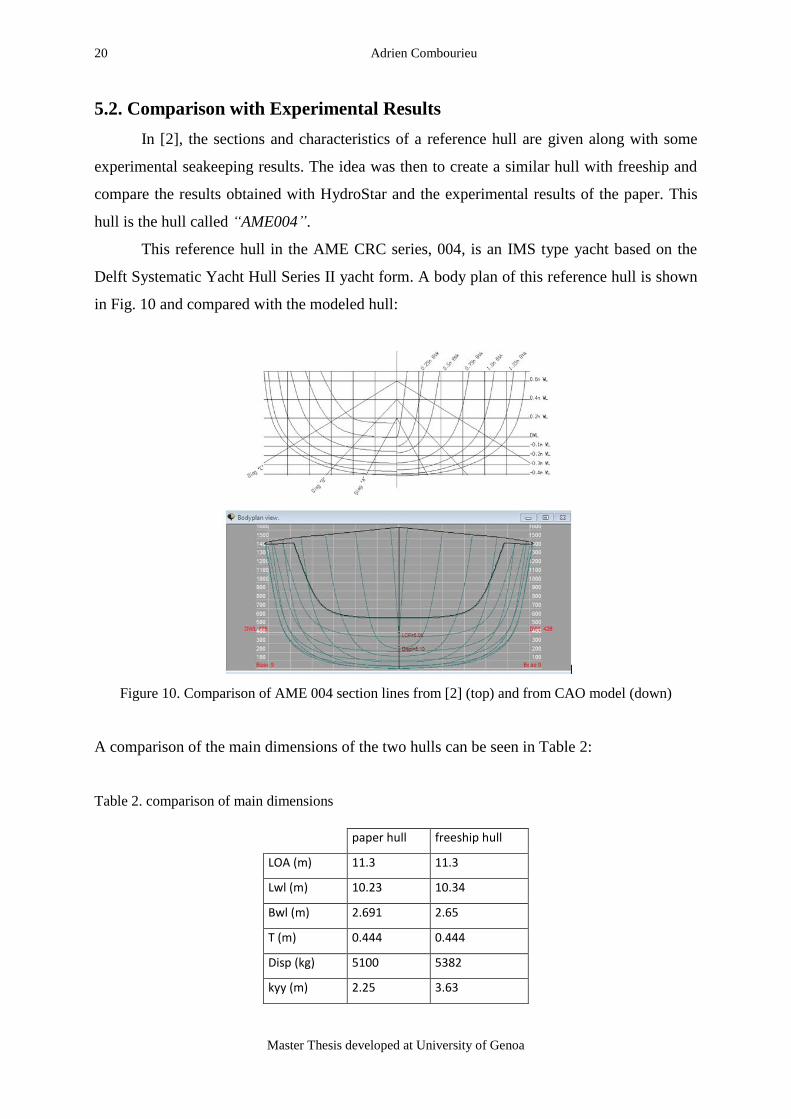
This reference hull in the AME CRC series, 004, is an IMS type yacht based on the
Delft Systematic Yacht Hull Series II yacht form. A body plan of this reference hull is shown
in Fig. 10 and compared with the modeled hull:
Figure 10. Comparison of AME 004 section lines from [2] (top) and from CAO model (down)
A comparison of the main dimensions of the two hulls can be seen in Table 2:
Table 2. comparison of main dimensions
paper hull freeship hull
LOA (m) 11.3 11.3
Lwl (m) 10.23 10.34
Bwl (m) 2.691 2.65
T (m) 0.444 0.444
Disp (kg) 5100 5382
kyy (m) 2.25 3.63
Previous sailing yachts seakeeping investigation in view of a new set of rules 21
“EMSHIP” Erasmus Mundus Master Course, period of study September 2011 – February 2013
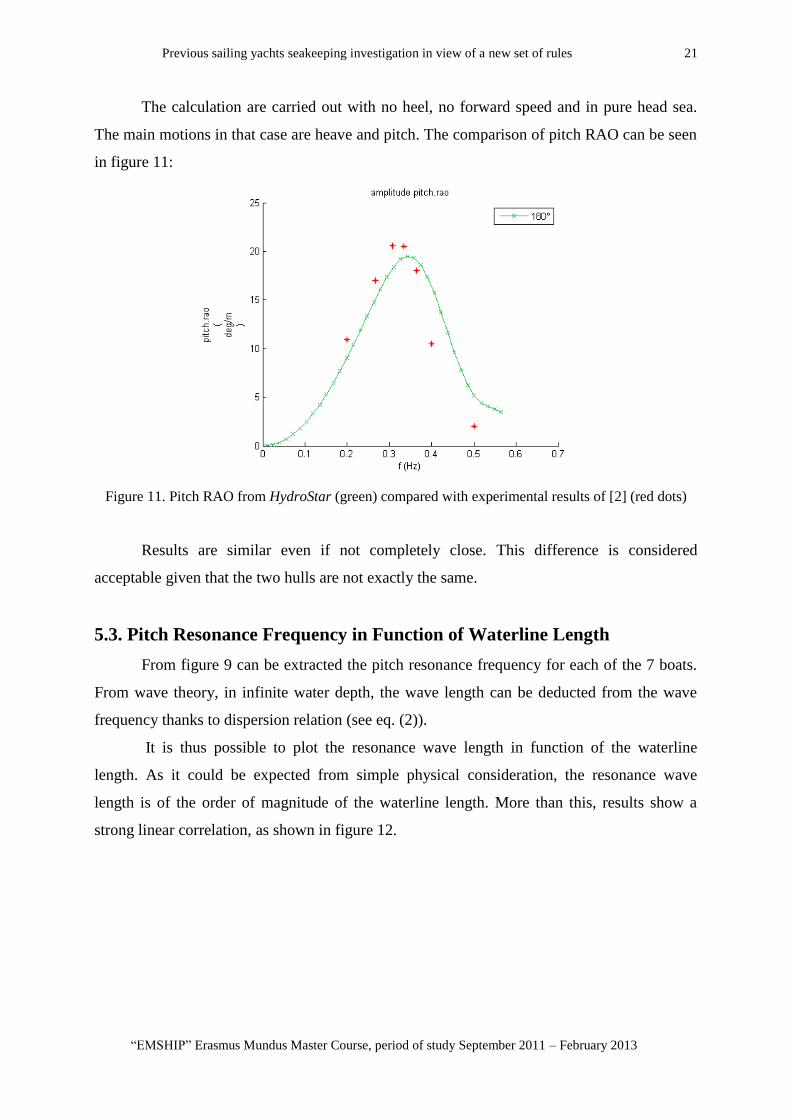
The calculation are carried out with no heel, no forward speed and in pure head sea.
The main motions in that case are heave and pitch. The comparison of pitch RAO can be seen
in figure 11:
Figure 11. Pitch RAO from HydroStar (green) compared with experimental results of [2] (red dots)
Results are similar even if not completely close. This difference is considered
acceptable given that the two hulls are not exactly the same.
5.3. Pitch Resonance Frequency in Function of Waterline Length
From figure 9 can be extracted the pitch resonance frequency for each of the 7 boats.
From wave theory, in infinite water depth, the wave length can be deducted from the wave
frequency thanks to dispersion relation (see eq. (2)).
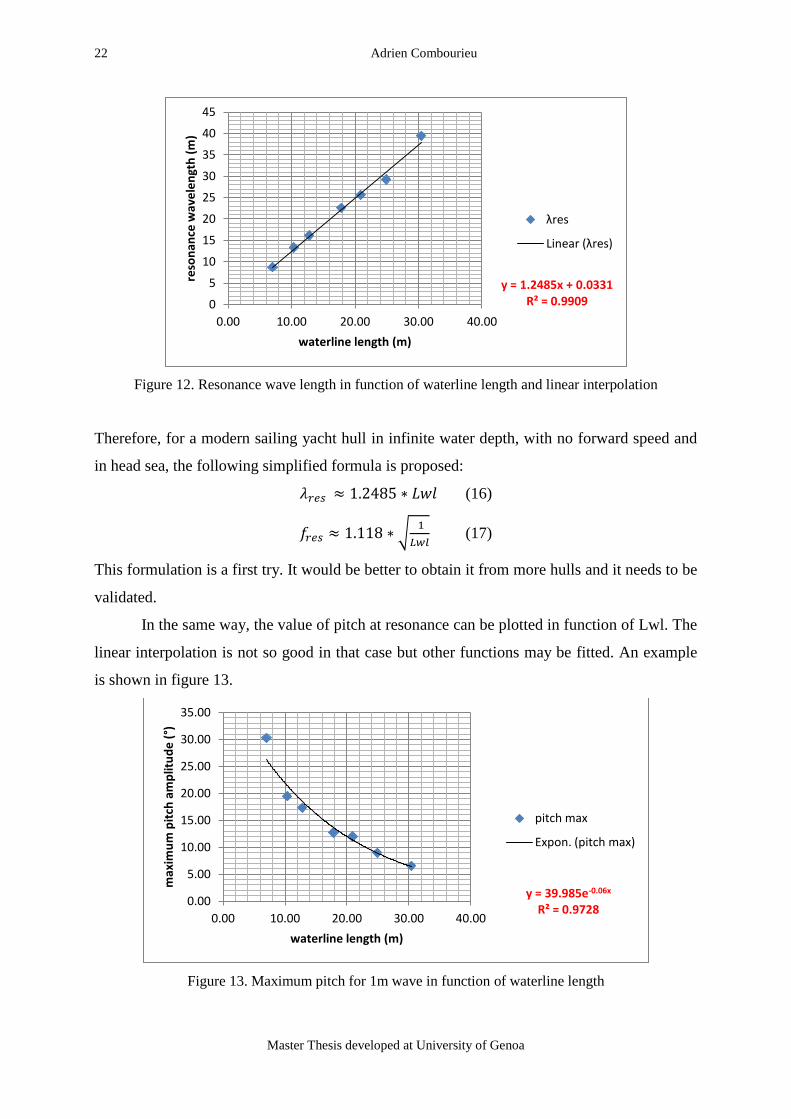
It is thus possible to plot the resonance wave length in function of the waterline
length. As it could be expected from simple physical consideration, the resonance wave
length is of the order of magnitude of the waterline length. More than this, results show a
strong linear correlation, as shown in figure 12.
22 Adrien Combourieu
Master Thesis developed at University of Genoa
Figure 12. Resonance wave length in function of waterline length and linear interpolation
Therefore, for a modern sailing yacht hull in infinite water depth, with no forward speed and
in head sea, the following simplified formula is proposed:
(16)
(17)
This formulation is a first try. It would be better to obtain it from more hulls and it needs to be
validated.
In the same way, the value of pitch at resonance can be plotted in function of Lwl. The
linear interpolation is not so good in that case but other functions may be fitted. An example
is shown in figure 13.
Figure 13. Maximum pitch for 1m wave in function of waterline length
y = 1.2485x + 0.0331 R² = 0.9909 0
5
10
15
20
25
30
35
40
45
0.00 10.00 20.00 30.00 40.00
reso
nan
ce w
ave
len
gth
(m
)
waterline length (m)
λres
Linear (λres)
y = 39.985e-0.06x R² = 0.9728
0.00
5.00
10.00
15.00
20.00
25.00
30.00
35.00
0.00 10.00 20.00 30.00 40.00
max
imu
m p
itch
am
plit
ud
e (
°)
waterline length (m)
pitch max
Expon. (pitch max)
Previous sailing yachts seakeeping investigation in view of a new set of rules 23
“EMSHIP” Erasmus Mundus Master Course, period of study September 2011 – February 2013
5.4. Wave Length Range of Interest
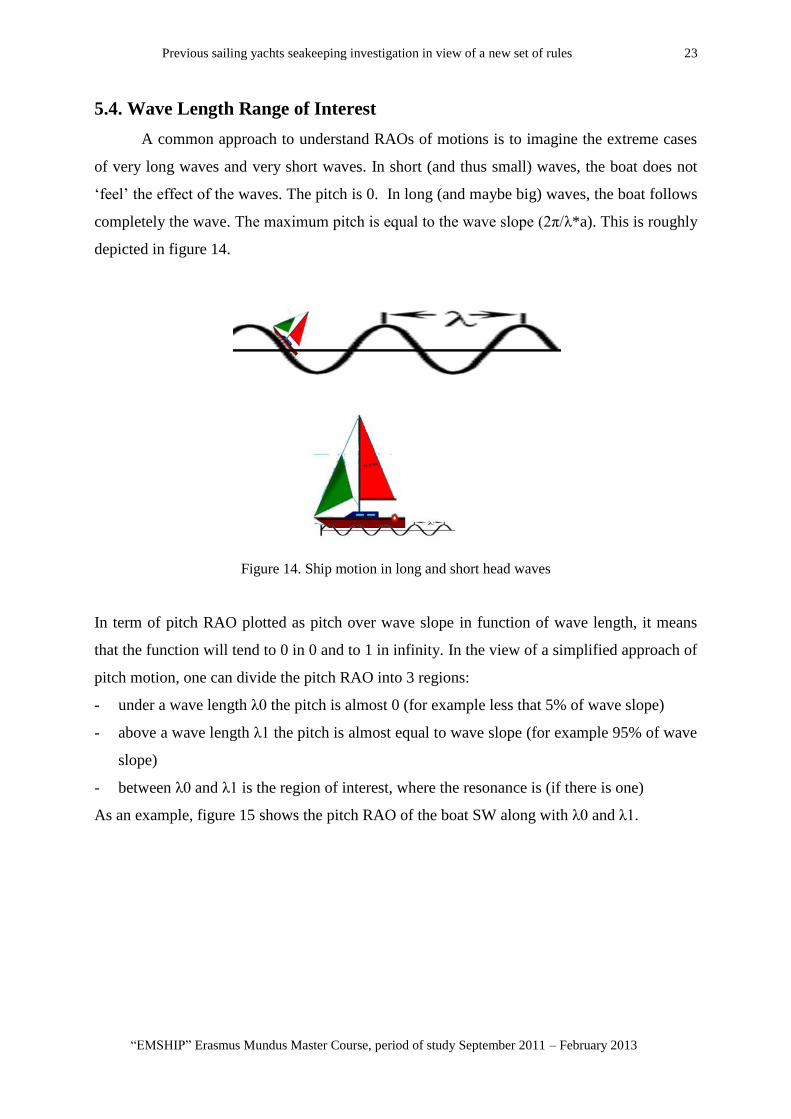
A common approach to understand RAOs of motions is to imagine the extreme cases
of very long waves and very short waves. In short (and thus small) waves, the boat does not
‘feel’ the effect of the waves. The pitch is 0. In long (and maybe big) waves, the boat follows
completely the wave. The maximum pitch is equal to the wave slope (2π/λ*a). This is roughly
depicted in figure 14.
Figure 14. Ship motion in long and short head waves
In term of pitch RAO plotted as pitch over wave slope in function of wave length, it means
that the function will tend to 0 in 0 and to 1 in infinity. In the view of a simplified approach of
pitch motion, one can divide the pitch RAO into 3 regions:
- under a wave length λ0 the pitch is almost 0 (for example less that 5% of wave slope)
- above a wave length λ1 the pitch is almost equal to wave slope (for example 95% of wave
slope)
- between λ0 and λ1 is the region of interest, where the resonance is (if there is one)
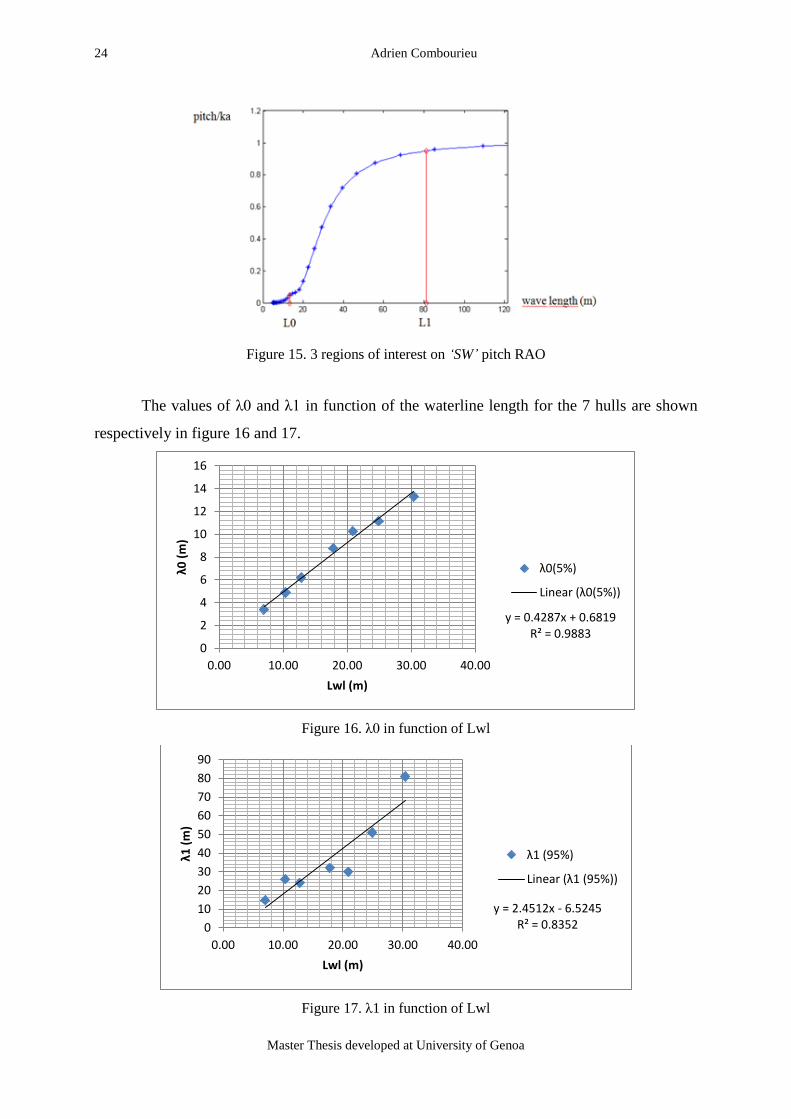
As an example, figure 15 shows the pitch RAO of the boat SW along with λ0 and λ1.
24 Adrien Combourieu
Master Thesis developed at University of Genoa
Figure 15. 3 regions of interest on ‘SW’ pitch RAO
The values of λ0 and λ1 in function of the waterline length for the 7 hulls are shown
respectively in figure 16 and 17.
Figure 16. λ0 in function of Lwl
Figure 17. λ1 in function of Lwl
y = 0.4287x + 0.6819 R² = 0.9883
0
2
4
6
8
10
12
14
16
0.00 10.00 20.00 30.00 40.00
λ0 (
m)
Lwl (m)
λ0(5%)
Linear (λ0(5%))
y = 2.4512x - 6.5245 R² = 0.8352 0
10
20
30
40
50
60
70
80
90
0.00 10.00 20.00 30.00 40.00
λ1 (
m)
Lwl (m)
λ1 (95%)
Linear (λ1 (95%))
Previous sailing yachts seakeeping investigation in view of a new set of rules 25
“EMSHIP” Erasmus Mundus Master Course, period of study September 2011 – February 2013
Surprisingly, λ0 shows a good linear interpolation but not λ1. The approximate values of the
ratios λ0/Lwl (around 0.5) and λ1/Lwl (around 2-2.5) can be understood by physical
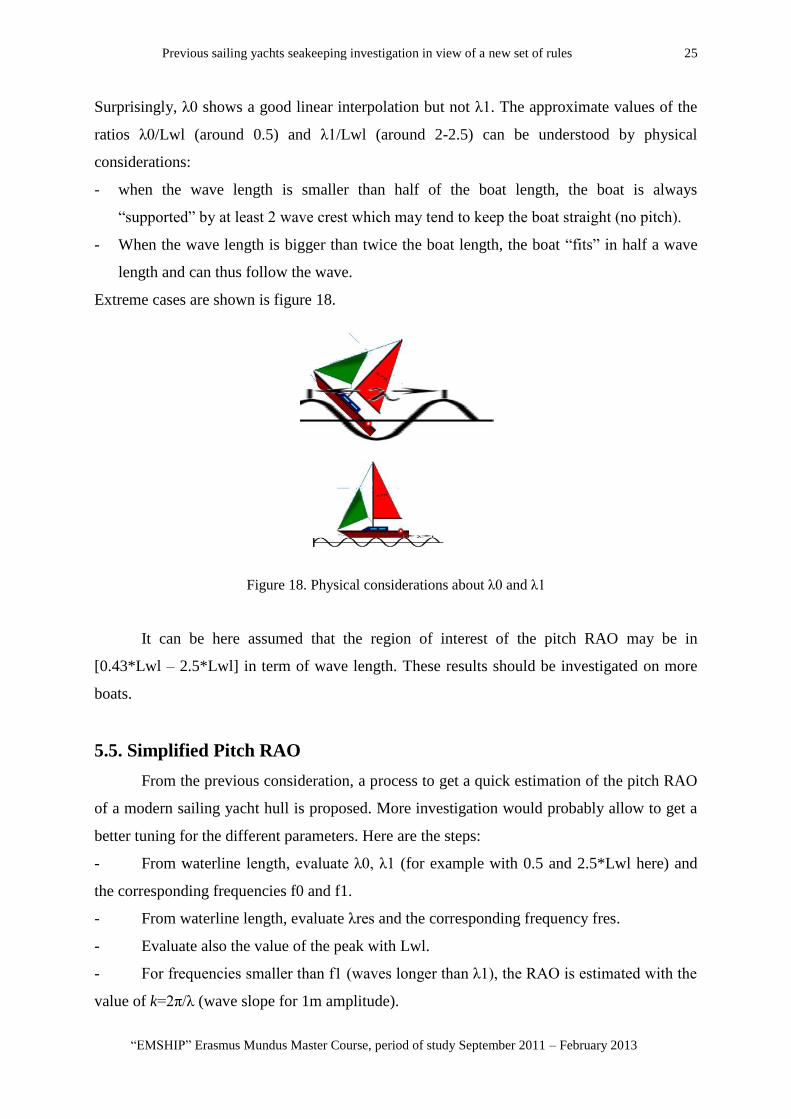
considerations:
- when the wave length is smaller than half of the boat length, the boat is always
“supported” by at least 2 wave crest which may tend to keep the boat straight (no pitch).
- When the wave length is bigger than twice the boat length, the boat “fits” in half a wave
length and can thus follow the wave.
Extreme cases are shown is figure 18.
Figure 18. Physical considerations about λ0 and λ1
It can be here assumed that the region of interest of the pitch RAO may be in
[0.43*Lwl – 2.5*Lwl] in term of wave length. These results should be investigated on more
boats.
5.5. Simplified Pitch RAO
From the previous consideration, a process to get a quick estimation of the pitch RAO
of a modern sailing yacht hull is proposed. More investigation would probably allow to get a
better tuning for the different parameters. Here are the steps:
- From waterline length, evaluate λ0, λ1 (for example with 0.5 and 2.5*Lwl here) and
the corresponding frequencies f0 and f1.
- From waterline length, evaluate λres and the corresponding frequency fres.
- Evaluate also the value of the peak with Lwl.
- For frequencies smaller than f1 (waves longer than λ1), the RAO is estimated with the
value of k=2π/λ (wave slope for 1m amplitude).
26 Adrien Combourieu
Master Thesis developed at University of Genoa
- For frequencies bigger than f0 (waves shorter than λ0), the RAO is estimated to 0
(could probably be estimated less roughly).
- In [f1-fres] and [fres-f0], interpolations can be made. Here simple linear interpolations
are made.
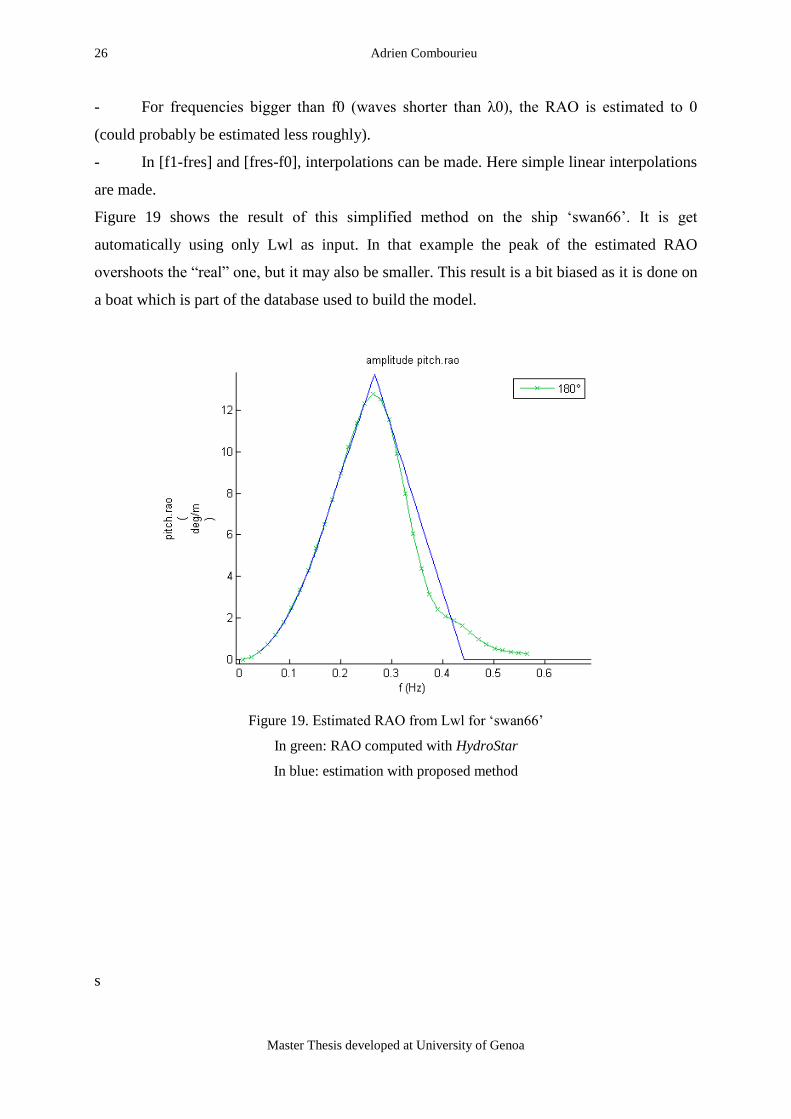
Figure 19 shows the result of this simplified method on the ship ‘swan66’. It is get
automatically using only Lwl as input. In that example the peak of the estimated RAO
overshoots the “real” one, but it may also be smaller. This result is a bit biased as it is done on
a boat which is part of the database used to build the model.
Figure 19. Estimated RAO from Lwl for ‘swan66’
In green: RAO computed with HydroStar
In blue: estimation with proposed method
s
Previous sailing yachts seakeeping investigation in view of a new set of rules 27
“EMSHIP” Erasmus Mundus Master Course, period of study September 2011 – February 2013
6. ACCELERATION RAOs
6.1. Acceleration for 1 DOF
The acceleration RAO for a single DOF can easily be derived from the RAO of the
corresponding motion. Let xi(t) be one of the 6 DOF value in function of time. According to
the hypothesis of the model used, it can be written, for a wave excitation of pulsation :
So the acceleration is easily deduced:
Which means that the acceleration RAO for a single DOF is obtained by multiplying the RAO
of motion by . The phase RAO for this acceleration is obtained by adding π to the one of
the motions.
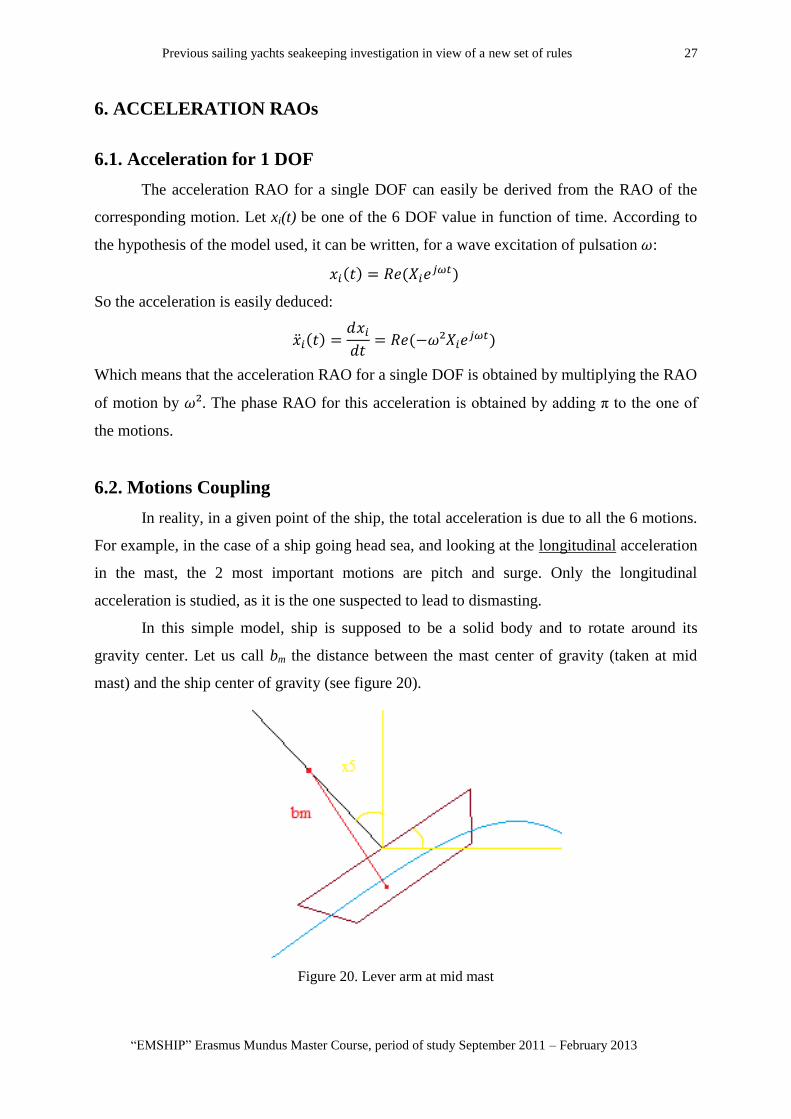
6.2. Motions Coupling
In reality, in a given point of the ship, the total acceleration is due to all the 6 motions.
For example, in the case of a ship going head sea, and looking at the longitudinal acceleration
in the mast, the 2 most important motions are pitch and surge. Only the longitudinal
acceleration is studied, as it is the one suspected to lead to dismasting.
In this simple model, ship is supposed to be a solid body and to rotate around its
gravity center. Let us call bm the distance between the mast center of gravity (taken at mid
mast) and the ship center of gravity (see figure 20).
Figure 20. Lever arm at mid mast

28 Adrien Combourieu
Master Thesis developed at University of Genoa
Then, the motion of M can be written, with hypothesis of small pitch angle:
(18)
(19)
So we see here that with motions coupling, it is not straightforward to get the
acceleration RAO. Nevertheless, it is still easy to solve if the information about phases is also
available – which is the case with HydroStar.
6.3. Comparison of Accelerations in Mast and Cockpit
It can be interesting to compare the acceleration in the mast with the acceleration in
the cockpit. This last one is the acceleration felt by the people on board. The perfect case
would be to be able to define “working conditions” where the accelerations are sustainable for
the mast and for the crew. On the other hand, it might be useless to study the impact of
accelerations in the mast that would not be sustainable for the crew. This idea is depicted in
figure 21.
Figure 21 .Different limit of accelerations onboard a sailing ship
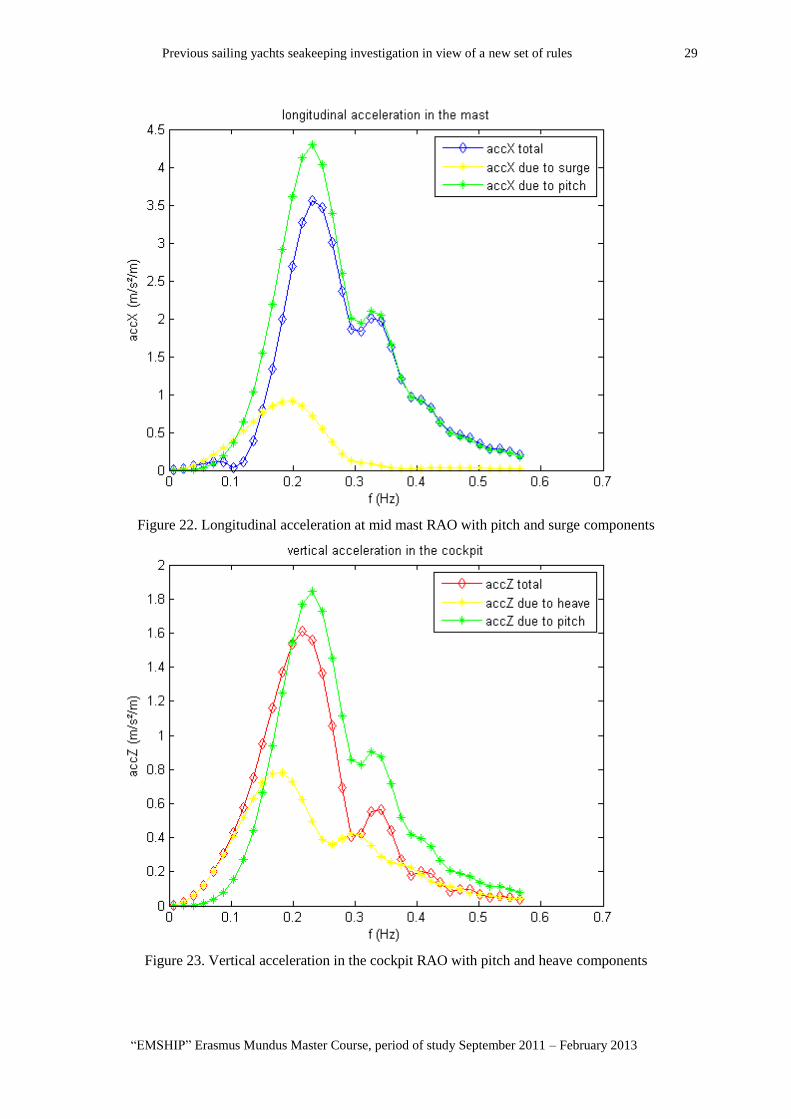
For the situation described in figure 20, the acceleration in the cockpit is composed of
pitch and heave accelerations. Let us take the example of the ‘SW’ ship. Figure 22 and 23
show respectively the acceleration in the mast and in the cockpit. Pitch, heave and surge
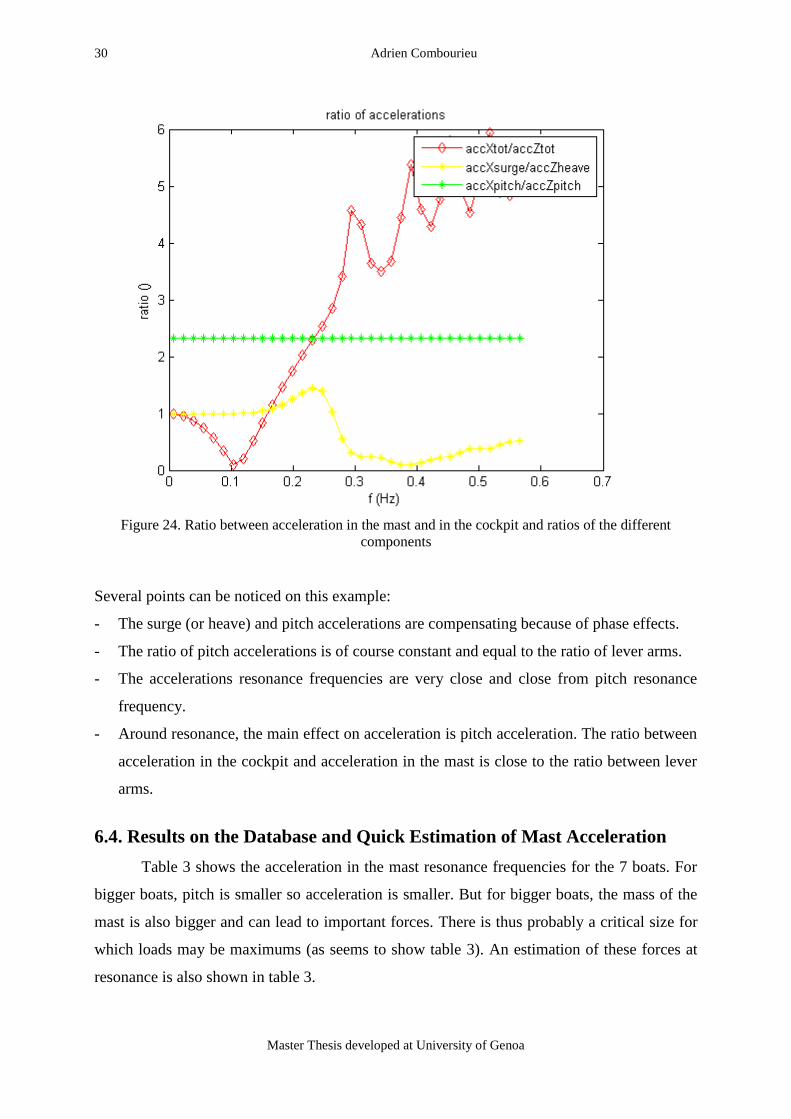
components can be seen. Figure 24 shows the ratio between acceleration in mast and cockpit
along with the ratios of the different components.
Previous sailing yachts seakeeping investigation in view of a new set of rules 29
“EMSHIP” Erasmus Mundus Master Course, period of study September 2011 – February 2013
Figure 22. Longitudinal acceleration at mid mast RAO with pitch and surge components
Figure 23. Vertical acceleration in the cockpit RAO with pitch and heave components
30 Adrien Combourieu
Master Thesis developed at University of Genoa
Figure 24. Ratio between acceleration in the mast and in the cockpit and ratios of the different
components
Several points can be noticed on this example:
- The surge (or heave) and pitch accelerations are compensating because of phase effects.
- The ratio of pitch accelerations is of course constant and equal to the ratio of lever arms.
- The accelerations resonance frequencies are very close and close from pitch resonance
frequency.
- Around resonance, the main effect on acceleration is pitch acceleration. The ratio between
acceleration in the cockpit and acceleration in the mast is close to the ratio between lever
arms.
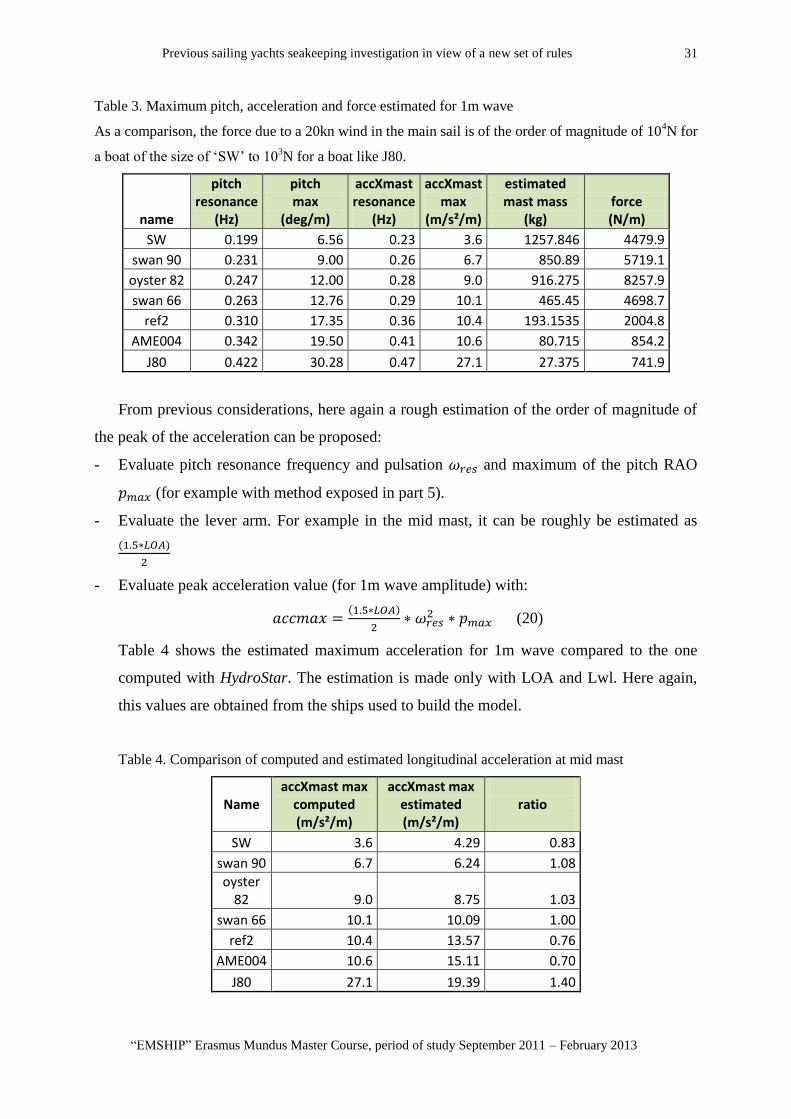
6.4. Results on the Database and Quick Estimation of Mast Acceleration
Table 3 shows the acceleration in the mast resonance frequencies for the 7 boats. For
bigger boats, pitch is smaller so acceleration is smaller. But for bigger boats, the mass of the
mast is also bigger and can lead to important forces. There is thus probably a critical size for
which loads may be maximums (as seems to show table 3). An estimation of these forces at
resonance is also shown in table 3.
Previous sailing yachts seakeeping investigation in view of a new set of rules 31
“EMSHIP” Erasmus Mundus Master Course, period of study September 2011 – February 2013
Table 3. Maximum pitch, acceleration and force estimated for 1m wave
As a comparison, the force due to a 20kn wind in the main sail is of the order of magnitude of 104N for
a boat of the size of ‘SW’ to 103N for a boat like J80.
name
pitch resonance
(Hz)
pitch max
(deg/m)
accXmast resonance
(Hz)
accXmast max
(m/s²/m)
estimated mast mass
(kg) force (N/m)
SW 0.199 6.56 0.23 3.6 1257.846 4479.9
swan 90 0.231 9.00 0.26 6.7 850.89 5719.1
oyster 82 0.247 12.00 0.28 9.0 916.275 8257.9
swan 66 0.263 12.76 0.29 10.1 465.45 4698.7
ref2 0.310 17.35 0.36 10.4 193.1535 2004.8
AME004 0.342 19.50 0.41 10.6 80.715 854.2
J80 0.422 30.28 0.47 27.1 27.375 741.9
From previous considerations, here again a rough estimation of the order of magnitude of
the peak of the acceleration can be proposed:
- Evaluate pitch resonance frequency and pulsation and maximum of the pitch RAO
(for example with method exposed in part 5).
- Evaluate the lever arm. For example in the mid mast, it can be roughly be estimated as
- Evaluate peak acceleration value (for 1m wave amplitude) with:
(20)
Table 4 shows the estimated maximum acceleration for 1m wave compared to the one
computed with HydroStar. The estimation is made only with LOA and Lwl. Here again,
this values are obtained from the ships used to build the model.
Table 4. Comparison of computed and estimated longitudinal acceleration at mid mast
Name
accXmast max computed (m/s²/m)
accXmast max estimated (m/s²/m)
ratio
SW 3.6 4.29 0.83
swan 90 6.7 6.24 1.08
oyster 82 9.0 8.75 1.03
swan 66 10.1 10.09 1.00
ref2 10.4 13.57 0.76
AME004 10.6 15.11 0.70
J80 27.1 19.39 1.40

32 Adrien Combourieu
Master Thesis developed at University of Genoa
The estimation in some cases is quite rough but might be more accurate by inputting
more precise data (e.g. the estimation of the lever arm). In other cases the estimation is
quite good which might mean that this lead should be investigate more in details.
Unfortunately, this approximation is completely irrelevant with forward speed which
increases a lot the acceleration as shown in part 8.2.
Previous sailing yachts seakeeping investigation in view of a new set of rules 33
“EMSHIP” Erasmus Mundus Master Course, period of study September 2011 – February 2013
7. SEA STATE CALCULATIONS
7.1. Theoretical Formulation
The previous results were obtained in regular or harmonic waves. Now in practice, sea
free surface is irregular. To solve this, what is usually done in linear theory, is to decompose
the free surface elevation in a sum of cosine. This can be written, for a fixed boat at the origin
of the axis:
(21)
The dependence in space vanishes if we consider a boat with no speed.
Waves are supposed to have random phases . Then, as the problem is linear and
solved for regular waves, the response for motion would be:
(22)
The RAO used here is the one computed for the heading of interest.
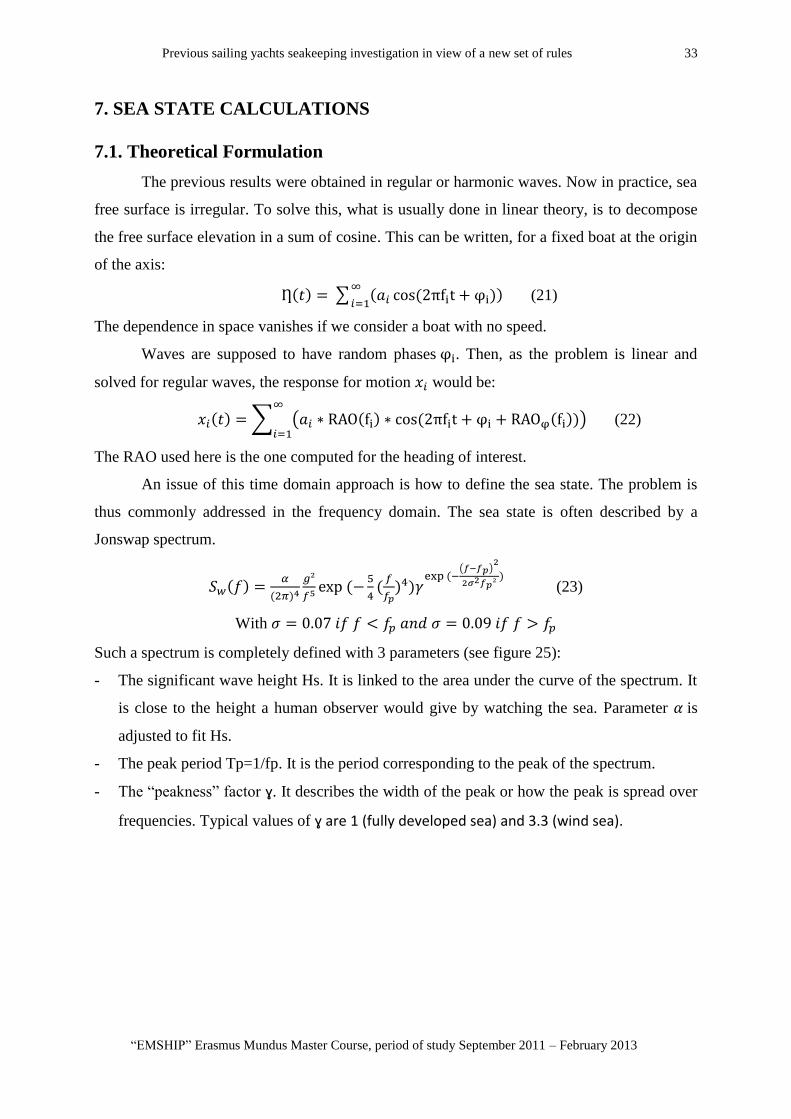
An issue of this time domain approach is how to define the sea state. The problem is
thus commonly addressed in the frequency domain. The sea state is often described by a
Jonswap spectrum.
(23)
With
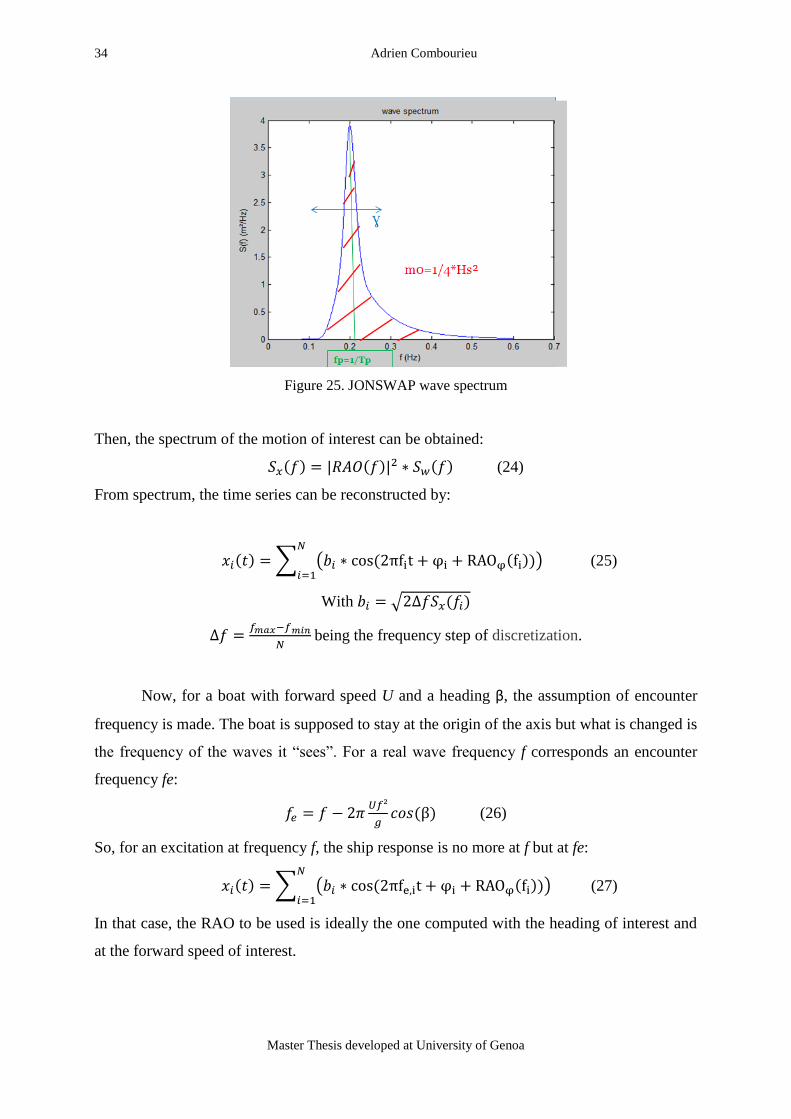
Such a spectrum is completely defined with 3 parameters (see figure 25):
- The significant wave height Hs. It is linked to the area under the curve of the spectrum. It
is close to the height a human observer would give by watching the sea. Parameter is
adjusted to fit Hs.
- The peak period Tp=1/fp. It is the period corresponding to the peak of the spectrum.
- The “peakness” factor ɣ. It describes the width of the peak or how the peak is spread over
frequencies. Typical values of ɣ are 1 (fully developed sea) and 3.3 (wind sea).
34 Adrien Combourieu
Master Thesis developed at University of Genoa
Figure 25. JONSWAP wave spectrum
Then, the spectrum of the motion of interest can be obtained:
(24)
From spectrum, the time series can be reconstructed by:
(25)
With
being the frequency step of discretization.
Now, for a boat with forward speed U and a heading β, the assumption of encounter
frequency is made. The boat is supposed to stay at the origin of the axis but what is changed is
the frequency of the waves it “sees”. For a real wave frequency f corresponds an encounter
frequency fe:
(26)
So, for an excitation at frequency f, the ship response is no more at f but at fe:
(27)
In that case, the RAO to be used is ideally the one computed with the heading of interest and
at the forward speed of interest.

Previous sailing yachts seakeeping investigation in view of a new set of rules 35
“EMSHIP” Erasmus Mundus Master Course, period of study September 2011 – February 2013
7.2. Pitch Time Series: Comparison with Experimental Data
Experimental data to be compared with this model are rare. In [3], real on board
measurement of pitch motion were performed. The ship is a J80. From personal
communication with the authors of [3], some information about the conditions have been
obtained:
- Boat was going upwind (40 degrees from wind) at mean speed around 5 knots.
- Wave height was visually evaluated to 0.3m.
- Encounter period was deduced from measured pitch period to 1.3s.
- Measurements have been performed in the bay of Brest, France, which is almost closed
basin.
Experimental results are given as a plot of the pitch time series over 35s (see figure 26).
It has been chosen to perform the computation with the following inputs:
- In pure front waves (heading of 180 degrees).
- With a speed of 5 knots.
- In a sea state of Hs=0.3m, Tp = 2.251s (which correspond to encounter period of 1.3s) and
with ɣ=3.3 (as the basin is closed, the sea was probably not fully developed).
- No heel angle.
Comparison of time series over 35s can be seen in figure 26.
Figure 26. Comparison of pitch time series measured in [3] and computed (Hs=0.3m, Tp=2.25s and
ɣ=3.3)
In black: measured data
In red: numerical results
36 Adrien Combourieu
Master Thesis developed at University of Genoa
This comparison show very good agreement in term of amplitude and period between
the model and the real measurements. It must not be forgotten that there is a random part (the
phases) in the computation of these time series. Results will thus not be the same by running
twice a computation with the same parameters. It means that the two curves in figure 26 will
never superimpose but what matters is the significant height and period of the response.
However, the longest a ship stays on a given sea state, the more likely it is to meet a
bigger wave than the average wave. A value that can be recorded is the maximum response
staying a given time on a given sea state. As even this value will vary by repeating the same
experiment, an average over several similar experiments can be done. This last value would
be a bit more robust or “less random”.
In the following sub sections, the influence of the 3 sea state parameters on the mean
maximum response over 10 similar experiments is studied. Ship is supposed to stay 3 hours
on a given sea state (typical duration of a sea state). It is going in head sea with no forward
speed.
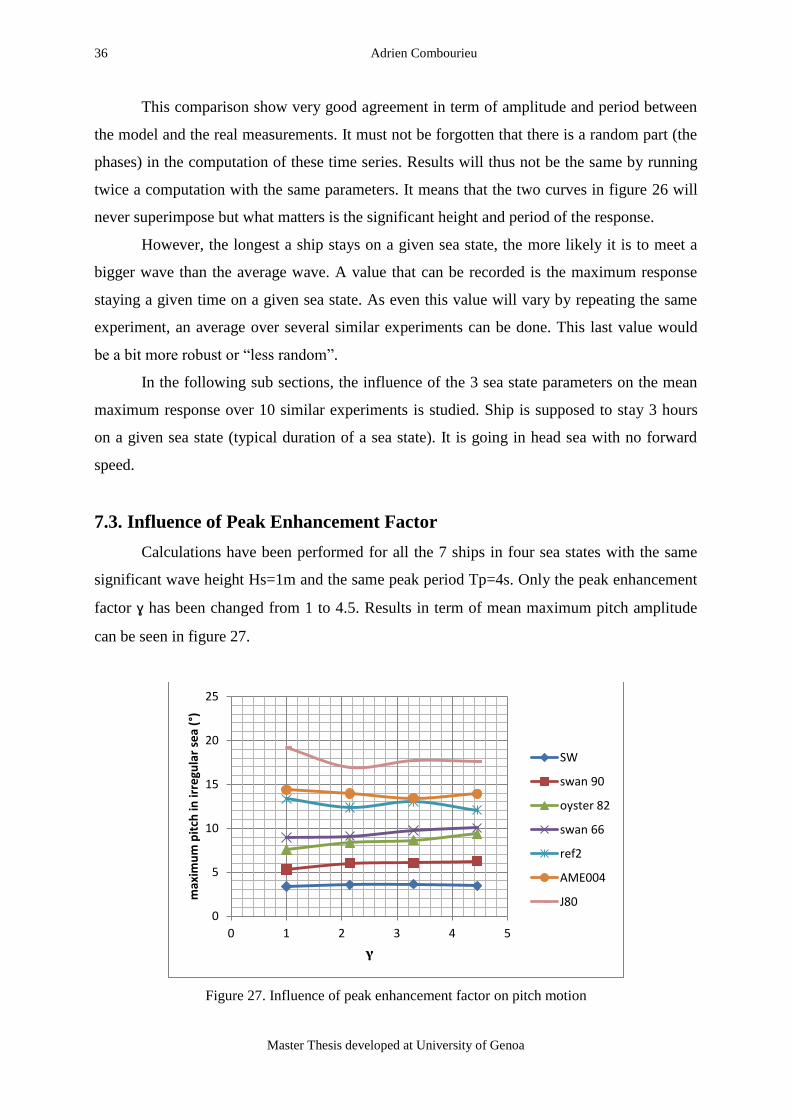
7.3. Influence of Peak Enhancement Factor
Calculations have been performed for all the 7 ships in four sea states with the same
significant wave height Hs=1m and the same peak period Tp=4s. Only the peak enhancement
factor ɣ has been changed from 1 to 4.5. Results in term of mean maximum pitch amplitude
can be seen in figure 27.
Figure 27. Influence of peak enhancement factor on pitch motion
0
5
10
15
20
25
0 1 2 3 4 5
max
imu
m p
itch
in ir
regu
lar
sea
(°)
γ
SW
swan 90
oyster 82
swan 66
ref2
AME004
J80
Previous sailing yachts seakeeping investigation in view of a new set of rules 37
“EMSHIP” Erasmus Mundus Master Course, period of study September 2011 – February 2013
It can be observed that ɣ does not seem to be a critical parameter. It will thus be taken
equal to 1 in the following.
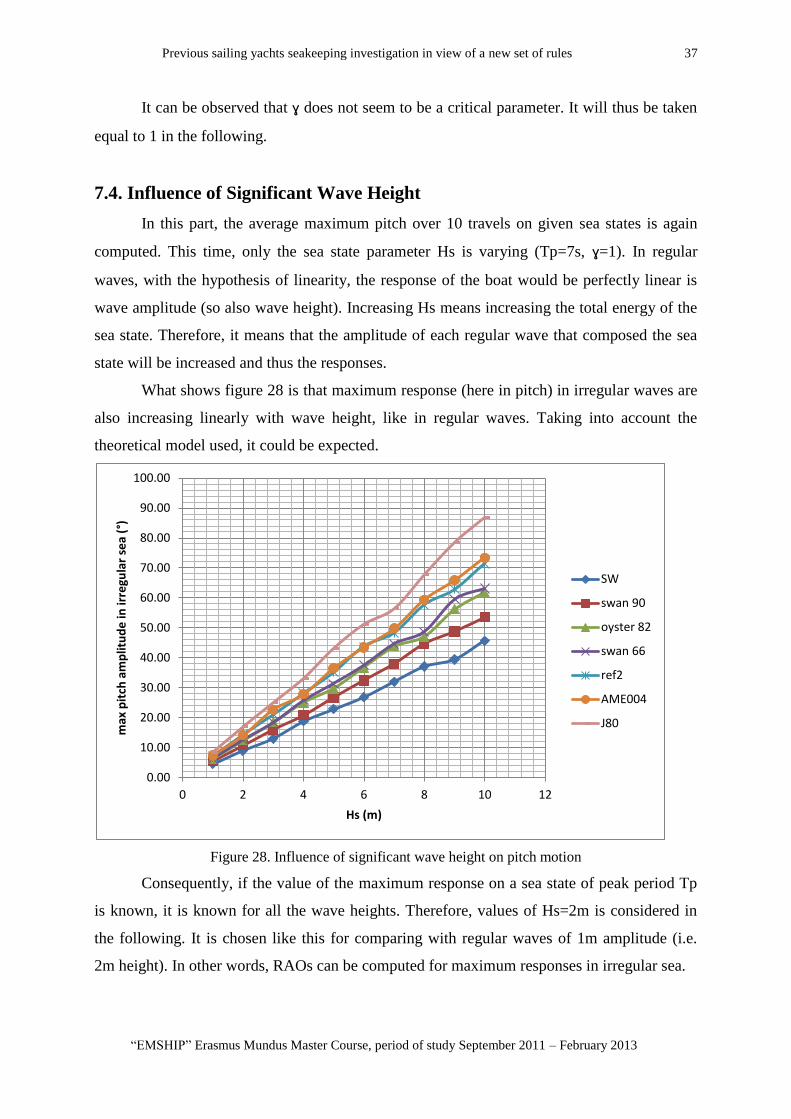
7.4. Influence of Significant Wave Height
In this part, the average maximum pitch over 10 travels on given sea states is again
computed. This time, only the sea state parameter Hs is varying (Tp=7s, ɣ=1). In regular
waves, with the hypothesis of linearity, the response of the boat would be perfectly linear is
wave amplitude (so also wave height). Increasing Hs means increasing the total energy of the
sea state. Therefore, it means that the amplitude of each regular wave that composed the sea
state will be increased and thus the responses.
What shows figure 28 is that maximum response (here in pitch) in irregular waves are
also increasing linearly with wave height, like in regular waves. Taking into account the
theoretical model used, it could be expected.
Figure 28. Influence of significant wave height on pitch motion
Consequently, if the value of the maximum response on a sea state of peak period Tp
is known, it is known for all the wave heights. Therefore, values of Hs=2m is considered in
the following. It is chosen like this for comparing with regular waves of 1m amplitude (i.e.
2m height). In other words, RAOs can be computed for maximum responses in irregular sea.
0.00
10.00
20.00
30.00
40.00
50.00
60.00
70.00
80.00
90.00
100.00
0 2 4 6 8 10 12
max
pit
ch a
mp
litu
de
in ir
regu
lar
sea
(°)
Hs (m)
SW
swan 90
oyster 82
swan 66
ref2
AME004
J80
38 Adrien Combourieu
Master Thesis developed at University of Genoa
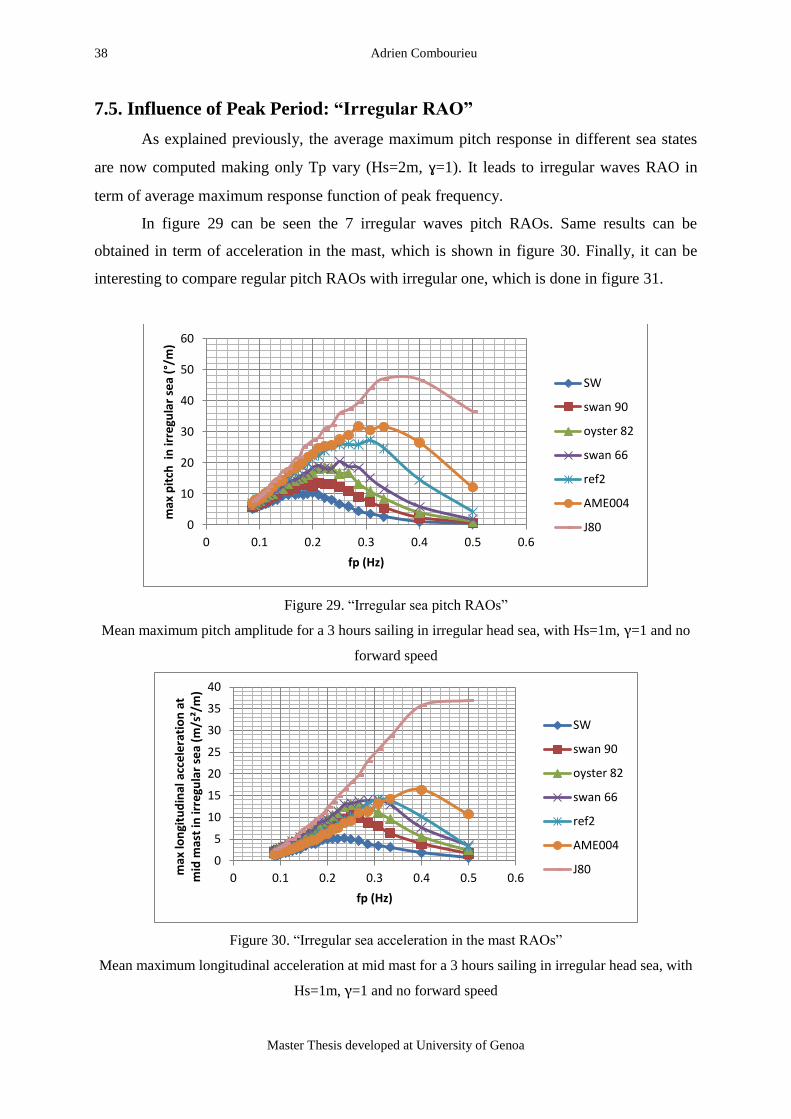
7.5. Influence of Peak Period: “Irregular RAO”
As explained previously, the average maximum pitch response in different sea states
are now computed making only Tp vary (Hs=2m, ɣ=1). It leads to irregular waves RAO in
term of average maximum response function of peak frequency.
In figure 29 can be seen the 7 irregular waves pitch RAOs. Same results can be
obtained in term of acceleration in the mast, which is shown in figure 30. Finally, it can be
interesting to compare regular pitch RAOs with irregular one, which is done in figure 31.
Figure 29. “Irregular sea pitch RAOs”
Mean maximum pitch amplitude for a 3 hours sailing in irregular head sea, with Hs=1m, γ=1 and no
forward speed
Figure 30. “Irregular sea acceleration in the mast RAOs”
Mean maximum longitudinal acceleration at mid mast for a 3 hours sailing in irregular head sea, with
Hs=1m, γ=1 and no forward speed
0
10
20
30
40
50
60
0 0.1 0.2 0.3 0.4 0.5 0.6
max
pit
ch i
n ir
regu
lar
sea
(°/m
)
fp (Hz)
SW
swan 90
oyster 82
swan 66
ref2
AME004
J80
0
5
10
15
20
25
30
35
40
0 0.1 0.2 0.3 0.4 0.5 0.6 max
lon
gitu
din
al a
cce
lera
tio
n a
t m
id m
ast
in ir
regu
lar
sea
(m/s
²/m
)
fp (Hz)
SW
swan 90
oyster 82
swan 66
ref2
AME004
J80

Previous sailing yachts seakeeping investigation in view of a new set of rules 39
“EMSHIP” Erasmus Mundus Master Course, period of study September 2011 – February 2013
Figure 31. Comparison between regular and irregular sea pitch RAOs
40 Adrien Combourieu
Master Thesis developed at University of Genoa
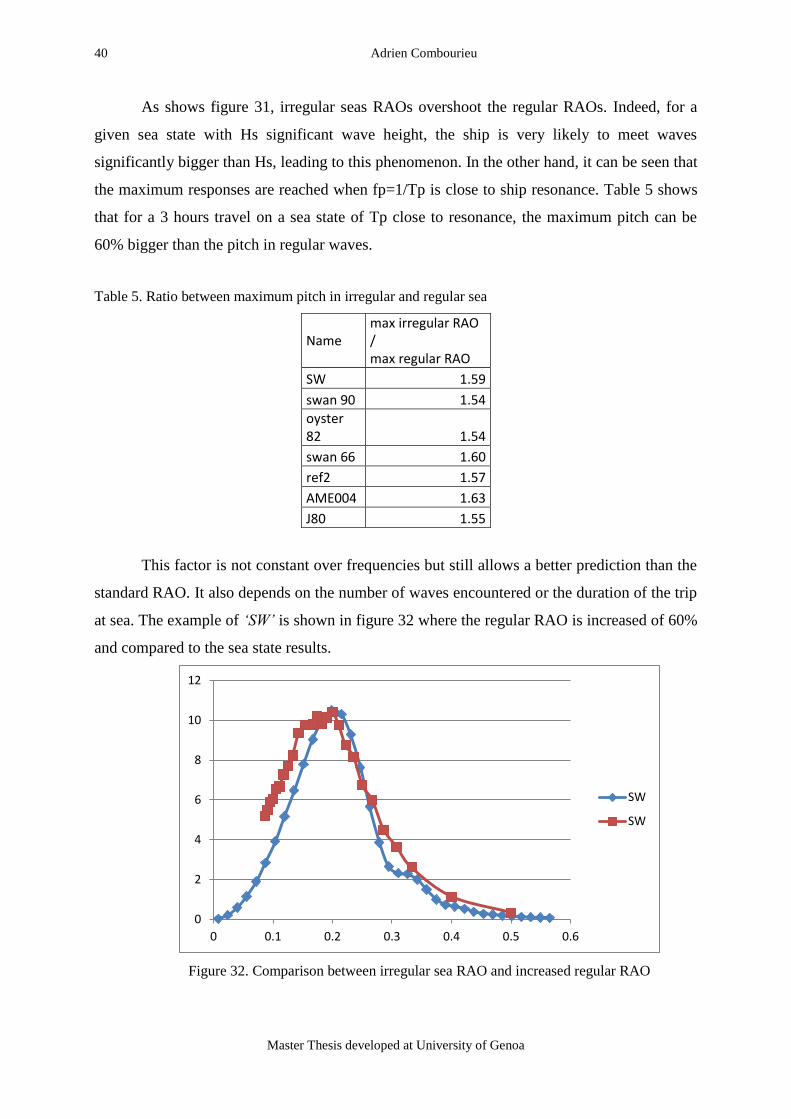
As shows figure 31, irregular seas RAOs overshoot the regular RAOs. Indeed, for a
given sea state with Hs significant wave height, the ship is very likely to meet waves
significantly bigger than Hs, leading to this phenomenon. In the other hand, it can be seen that
the maximum responses are reached when fp=1/Tp is close to ship resonance. Table 5 shows
that for a 3 hours travel on a sea state of Tp close to resonance, the maximum pitch can be
60% bigger than the pitch in regular waves.
Table 5. Ratio between maximum pitch in irregular and regular sea
Name
max irregular RAO / max regular RAO
SW 1.59
swan 90 1.54
oyster 82 1.54
swan 66 1.60
ref2 1.57
AME004 1.63
J80 1.55
This factor is not constant over frequencies but still allows a better prediction than the
standard RAO. It also depends on the number of waves encountered or the duration of the trip
at sea. The example of ‘SW’ is shown in figure 32 where the regular RAO is increased of 60%
and compared to the sea state results.
Figure 32. Comparison between irregular sea RAO and increased regular RAO
0
2
4
6
8
10
12
0 0.1 0.2 0.3 0.4 0.5 0.6
SW
SW
Previous sailing yachts seakeeping investigation in view of a new set of rules 41
“EMSHIP” Erasmus Mundus Master Course, period of study September 2011 – February 2013
7.6. About Worst Case Scenario
Being able of defining a worst case scenario that would lead to the biggest ship
response would be of great use. Indeed, it would provide the design load for the mast
scantling for example.
In linear theory, both frequency and wave height have a big influence on ship motion.
At a given wave height, the worst response is of course reached at resonance. Nevertheless,
big waves far from resonance can lead to bigger response than small waves at resonance. So,
which one will be the design wave?
Ideally, to determine what the worst possible response is, a relation between wave
height and wave frequency would be needed. If a function Hs(fp) was to be obtained, it could
be multiplied to the irregular RAO (or more roughly to the regular RAO increased of 60%)
which would give the maximum possible response in irregular sea.
Such a relation Hs(fp) is not straightforward to obtain as it depends on a lot of
parameters. Empirical link between wave height and wave period can sometimes be found
depending on the location (e.g. north Atlantic [1]). So it is possible to imagine getting such a
relation that would of course depend on the program of the ship.
Without it, a theoretical relation Hs(fp) can also be imagined. As the hypothesis of the
model is linear, the most critical linear case can be described. Indeed, the limit of wave
breaking (which is obviously not linear) is (recall eq. (3)):
This leads to:
(28)
This relation is easy but quite limited for several reasons. First it is purely theoretical
and may have nothing to see with the effective waves encountered by the ship. Then, and this
is true for the general idea of a worst case scenario, the biggest ship response is very likely to
happen in a non linear case. Nevertheless, the values predicted with a linear model might be
of a correct order of magnitude even for events out of the linear range (e.g. breaking waves
with H/λ>1/7).
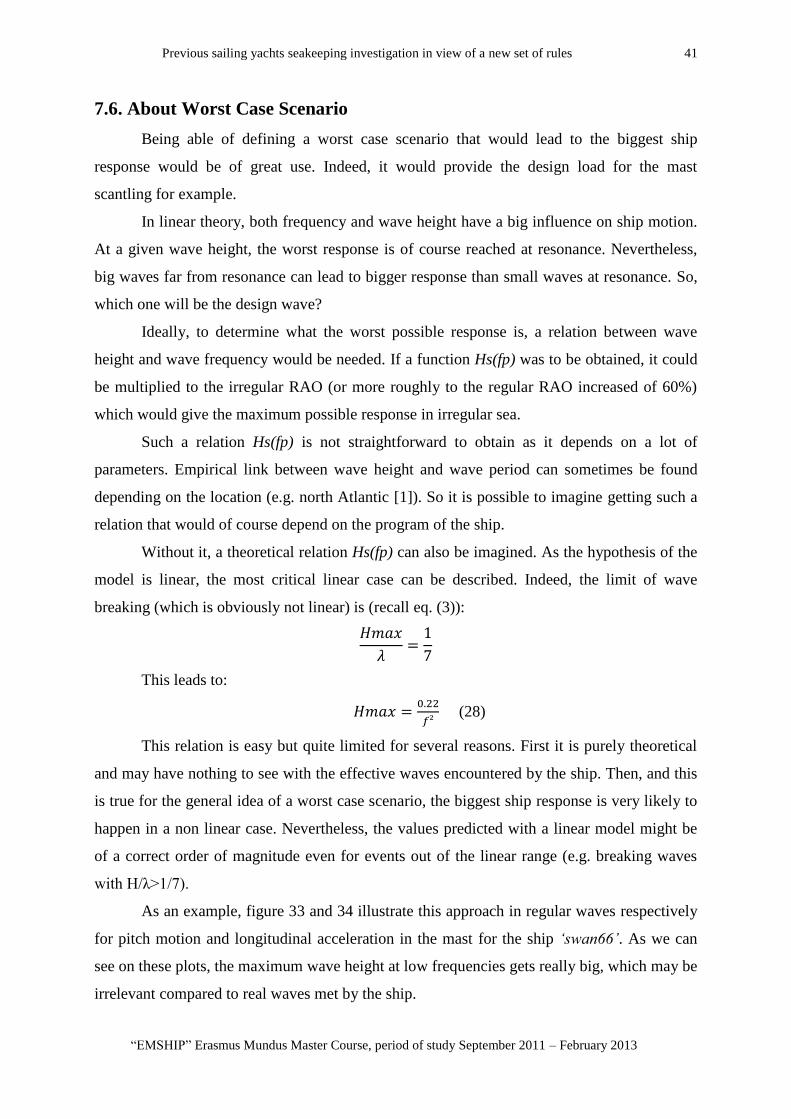
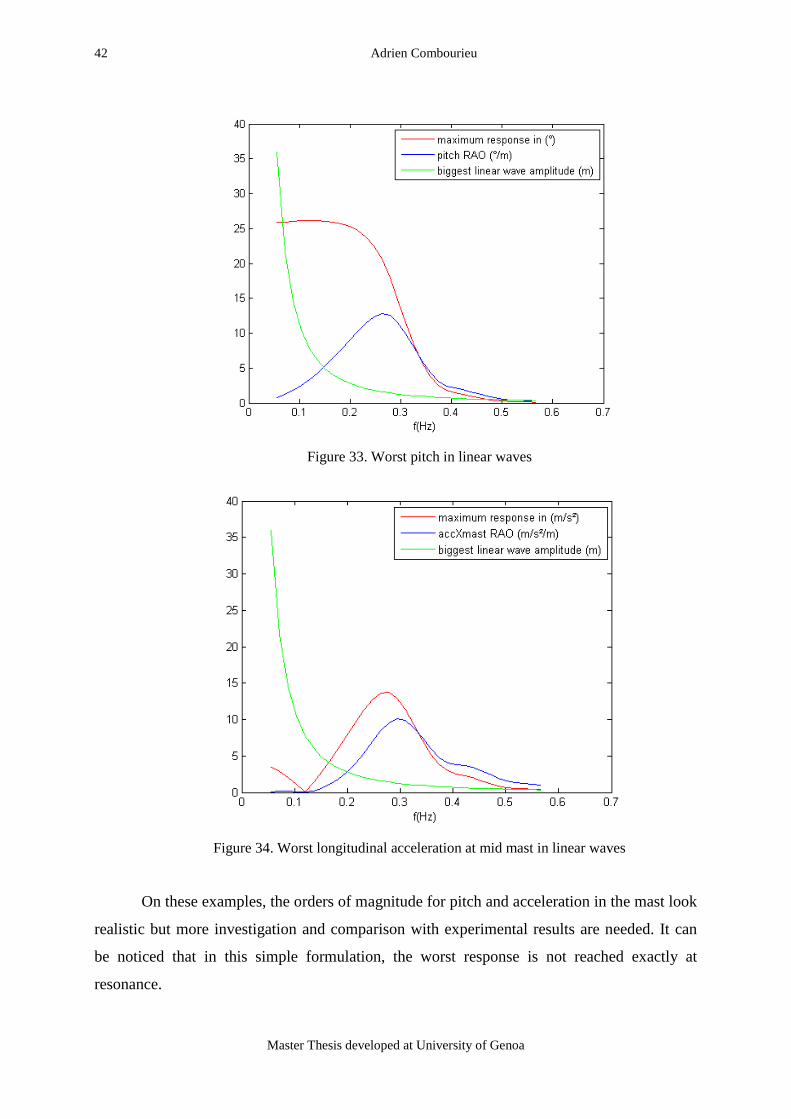
As an example, figure 33 and 34 illustrate this approach in regular waves respectively
for pitch motion and longitudinal acceleration in the mast for the ship ‘swan66’. As we can
see on these plots, the maximum wave height at low frequencies gets really big, which may be
irrelevant compared to real waves met by the ship.
42 Adrien Combourieu
Master Thesis developed at University of Genoa
Figure 33. Worst pitch in linear waves
Figure 34. Worst longitudinal acceleration at mid mast in linear waves
On these examples, the orders of magnitude for pitch and acceleration in the mast look
realistic but more investigation and comparison with experimental results are needed. It can
be noticed that in this simple formulation, the worst response is not reached exactly at
resonance.
Previous sailing yachts seakeeping investigation in view of a new set of rules 43
“EMSHIP” Erasmus Mundus Master Course, period of study September 2011 – February 2013
8. INFLUENCE OF SOME PARAMETERS ON PITCH MOTION
In part 5, the influence of yacht length is studied in details. In this part and in the next
one, a quick study of the influence of some other parameters is made on some examples.
Special care has been given to length influence not only because it is the most critical
parameter, but also because in case of modern sailing boat hulls, a lot of other boat
dimensions can be linked to boat length.
8.1. Influence of Pitch Radius of Gyration
Typically, for modern sailing boat, the pitch radius of gyration is in the interval
[0.25Lwl-0.35Lwl]. Table 6 shows the ratio between the pitch gyration radiuses computed
from simplified mass distribution described in part 4.2 and ship waterline lengths.
Table 6. Ratio between pitch gyration radius and waterline length
name kyy/Lwl
SW 0.29
swan 90 0.28
oyster 82 0.30
swan 66 0.30
ref2 0.28
AME004 0.27
J80 0.30
Therefore, the impact of pitch gyration radius varying in this range should be studied.
It can be expected that gyration radius will change the maximum value of the pitch RAO and
also the value of the resonance frequency. Making the analogy with a simple spring, it can be
expected that with bigger gyration radius (i.e. bigger inertia) the resonance frequency should
decrease (as it is linked to the ratio stiffness over inertia). On the other hand, the peak at
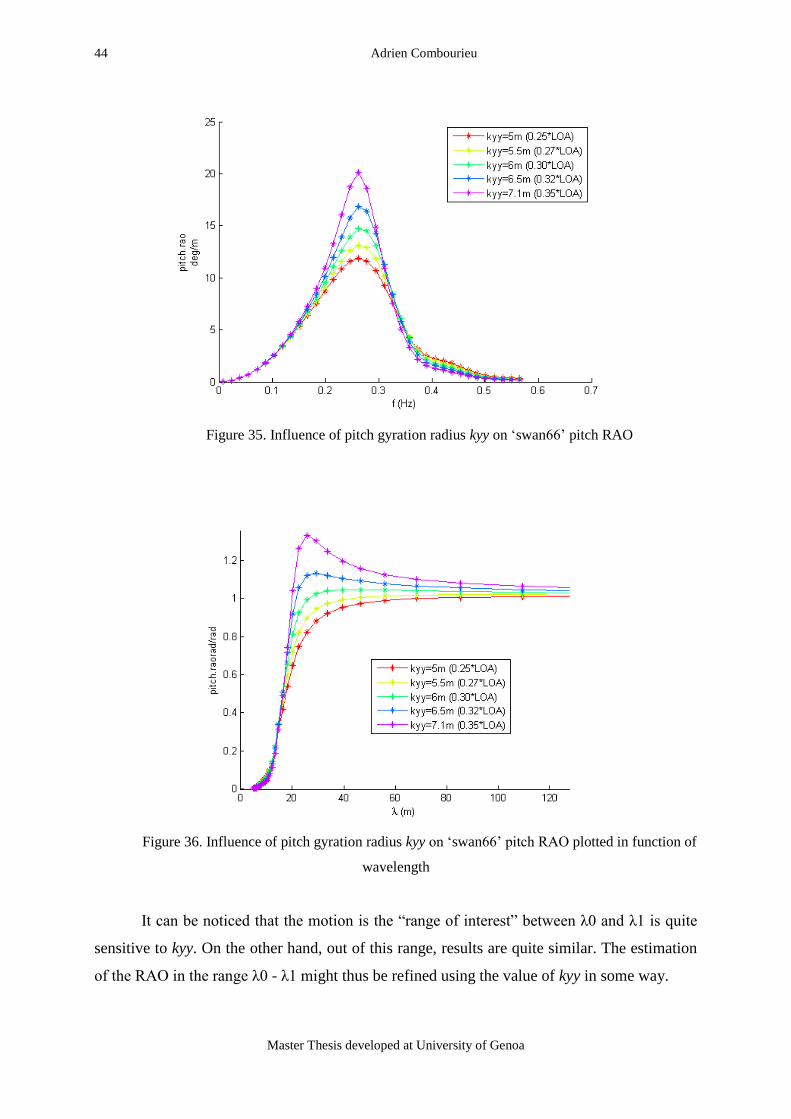
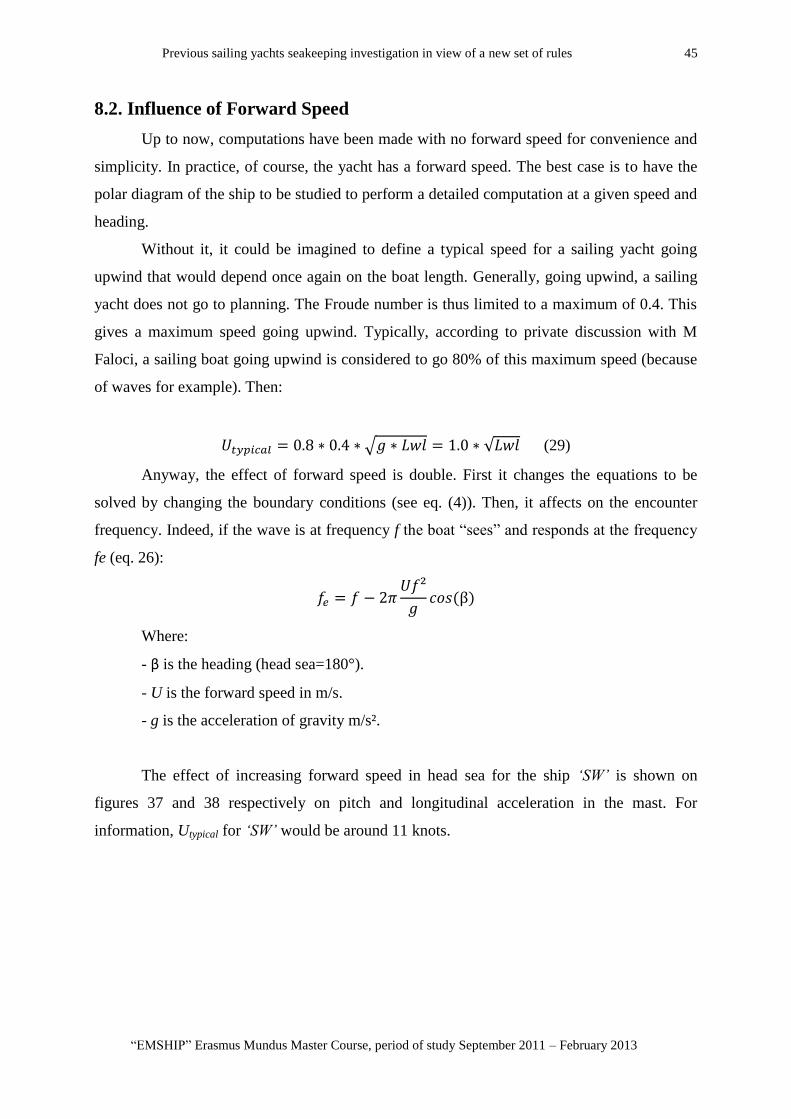
resonance should be bigger. Figure 35 shows the pitch RAO of the ‘swan66’ for different
pitch gyration radius. The resonance does not look to change much in this range of kyy. Figure
36 shows the same result but compared to wave slope in function of wave length.
44 Adrien Combourieu
Master Thesis developed at University of Genoa
Figure 35. Influence of pitch gyration radius kyy on ‘swan66’ pitch RAO
Figure 36. Influence of pitch gyration radius kyy on ‘swan66’ pitch RAO plotted in function of
wavelength
It can be noticed that the motion is the “range of interest” between λ0 and λ1 is quite
sensitive to kyy. On the other hand, out of this range, results are quite similar. The estimation
of the RAO in the range λ0 - λ1 might thus be refined using the value of kyy in some way.
Previous sailing yachts seakeeping investigation in view of a new set of rules 45
“EMSHIP” Erasmus Mundus Master Course, period of study September 2011 – February 2013
8.2. Influence of Forward Speed
Up to now, computations have been made with no forward speed for convenience and
simplicity. In practice, of course, the yacht has a forward speed. The best case is to have the
polar diagram of the ship to be studied to perform a detailed computation at a given speed and
heading.
Without it, it could be imagined to define a typical speed for a sailing yacht going
upwind that would depend once again on the boat length. Generally, going upwind, a sailing
yacht does not go to planning. The Froude number is thus limited to a maximum of 0.4. This
gives a maximum speed going upwind. Typically, according to private discussion with M
Faloci, a sailing boat going upwind is considered to go 80% of this maximum speed (because
of waves for example). Then:
(29)
Anyway, the effect of forward speed is double. First it changes the equations to be
solved by changing the boundary conditions (see eq. (4)). Then, it affects on the encounter
frequency. Indeed, if the wave is at frequency f the boat “sees” and responds at the frequency
fe (eq. 26):
Where:
- β is the heading (head sea=180°).
- U is the forward speed in m/s.
- g is the acceleration of gravity m/s².
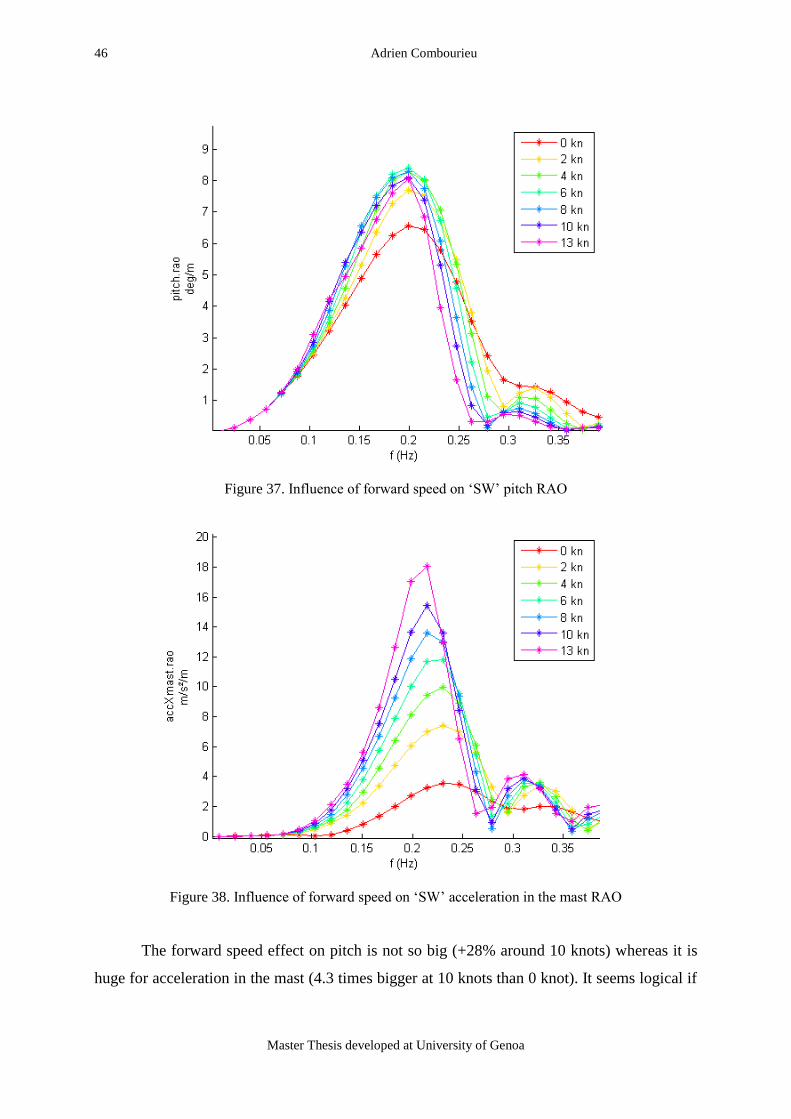
The effect of increasing forward speed in head sea for the ship ‘SW’ is shown on
figures 37 and 38 respectively on pitch and longitudinal acceleration in the mast. For
information, Utypical for ‘SW’ would be around 11 knots.
46 Adrien Combourieu
Master Thesis developed at University of Genoa
Figure 37. Influence of forward speed on ‘SW’ pitch RAO
Figure 38. Influence of forward speed on ‘SW’ acceleration in the mast RAO
The forward speed effect on pitch is not so big (+28% around 10 knots) whereas it is
huge for acceleration in the mast (4.3 times bigger at 10 knots than 0 knot). It seems logical if
Previous sailing yachts seakeeping investigation in view of a new set of rules 47
“EMSHIP” Erasmus Mundus Master Course, period of study September 2011 – February 2013
thought that, in a way, for a given wave, the ship has to do the same pitch but quicker at 10
knots than 0 knot.
These results may convince to research into the direction of a voluntary speed
reduction plan to avoid too big inertial load in the mast (at least when going head sea). Going
down wind, and thus more in following sea, the problem is very different. Actually, in
headings close to 0 degree (pure following sea), the pitch RAOs are very similar than going
head sea. The big difference in that case is the encounter frequency that is much lower. As the
boat follows the waves, they look longer and the accelerations are smaller (see part 10 for a
detailed example).
8.3. Influence of Heading
Up to now, only motion in pure head sea (heading of 180°) has been considered. It is
justified by the fact that the maximum pitch happens when going up sea (which is generally
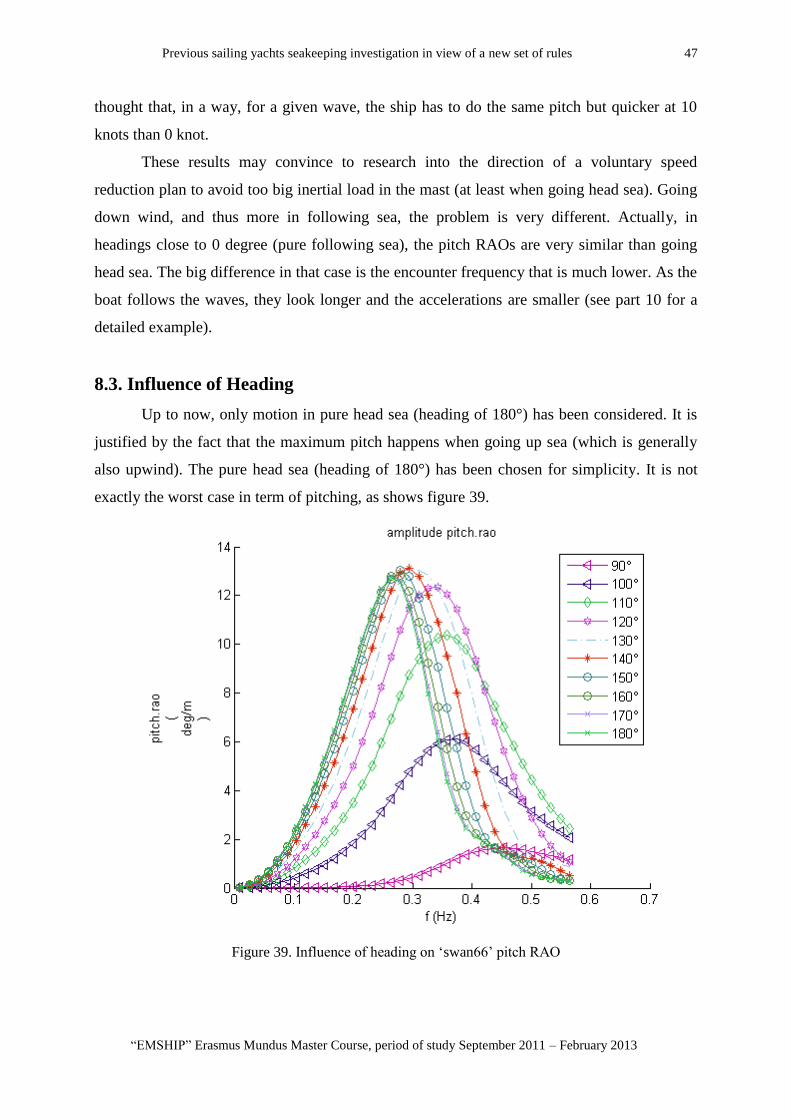
also upwind). The pure head sea (heading of 180°) has been chosen for simplicity. It is not
exactly the worst case in term of pitching, as shows figure 39.
Figure 39. Influence of heading on ‘swan66’ pitch RAO
48 Adrien Combourieu
Master Thesis developed at University of Genoa
Nevertheless, around 180 degrees RAOs are quite close to each other and really
decrease around 90 degrees (side sea). In some cases, pitch can be bigger around 140-120
degrees.
8.4. Influence of Heel Angle
When going in head sea, a sailing yacht is usually also going upwind. In that case, the
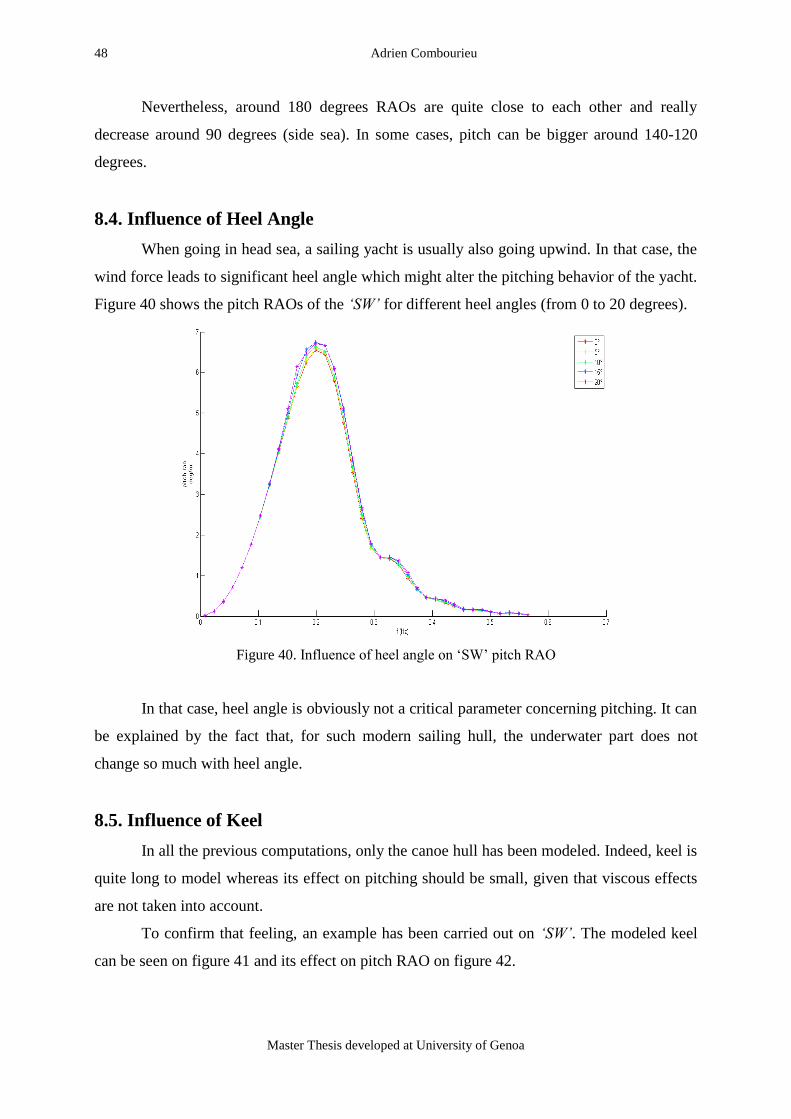
wind force leads to significant heel angle which might alter the pitching behavior of the yacht.
Figure 40 shows the pitch RAOs of the ‘SW’ for different heel angles (from 0 to 20 degrees).
Figure 40. Influence of heel angle on ‘SW’ pitch RAO
In that case, heel angle is obviously not a critical parameter concerning pitching. It can
be explained by the fact that, for such modern sailing hull, the underwater part does not
change so much with heel angle.
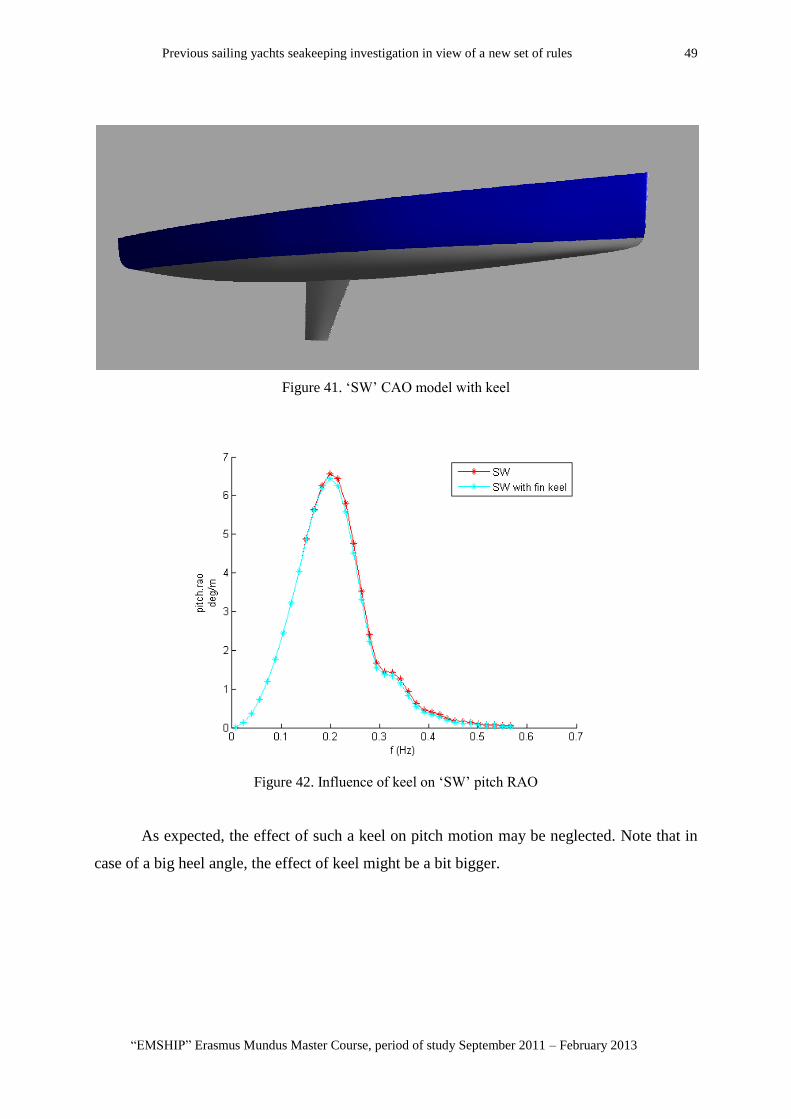
8.5. Influence of Keel
In all the previous computations, only the canoe hull has been modeled. Indeed, keel is
quite long to model whereas its effect on pitching should be small, given that viscous effects
are not taken into account.
To confirm that feeling, an example has been carried out on ‘SW’. The modeled keel
can be seen on figure 41 and its effect on pitch RAO on figure 42.
Previous sailing yachts seakeeping investigation in view of a new set of rules 49
“EMSHIP” Erasmus Mundus Master Course, period of study September 2011 – February 2013
Figure 41. ‘SW’ CAO model with keel
Figure 42. Influence of keel on ‘SW’ pitch RAO
As expected, the effect of such a keel on pitch motion may be neglected. Note that in
case of a big heel angle, the effect of keel might be a bit bigger.

50 Adrien Combourieu
Master Thesis developed at University of Genoa
8.6. Influence of Water Depth
A significant part of the reported dismasting happened when the ships were getting
closer to the coast. This led to the question if it might be because of reducing depth effect. In
this purpose, calculations have been performed on ‘SW’ for different water depths. Up to now,
infinite depth has always been considered. Figure 43 shows the results for pitch RAOs. The
smallest water depths used (5m and 2m) might be irrelevant practically and theoretically but
were performed to see if a tendency appears.
Figure 43. Influence of water depth on ‘SW’ pitch RAO
A real difference in pitch RAOs seems to appear only for really small depths and tends
to decrease the motion. The depth in itself does not look to be a critical factor. More likely,
what can explain that dismasting happens close to the shore is the wave frequency. Indeed,
waves close to shore may be shorter (so potentially closer to ship resonance) for example as a
consequence of smaller fetch.
8.7. Influence of Center of Gravity Position
The position of the center of gravity is not always exactly known. For example,
concerning the 7 hulls of the database, it was not known at all and was guessed. Indeed, the
longitudinal centers of gravity of the hulls alone have been adjusted to get a global (with mast
and ballast) LCG equal to LCB. The vertical centers of gravity of the hulls have also been
adjusted to get a realistic global GB.
Previous sailing yachts seakeeping investigation in view of a new set of rules 51
“EMSHIP” Erasmus Mundus Master Course, period of study September 2011 – February 2013
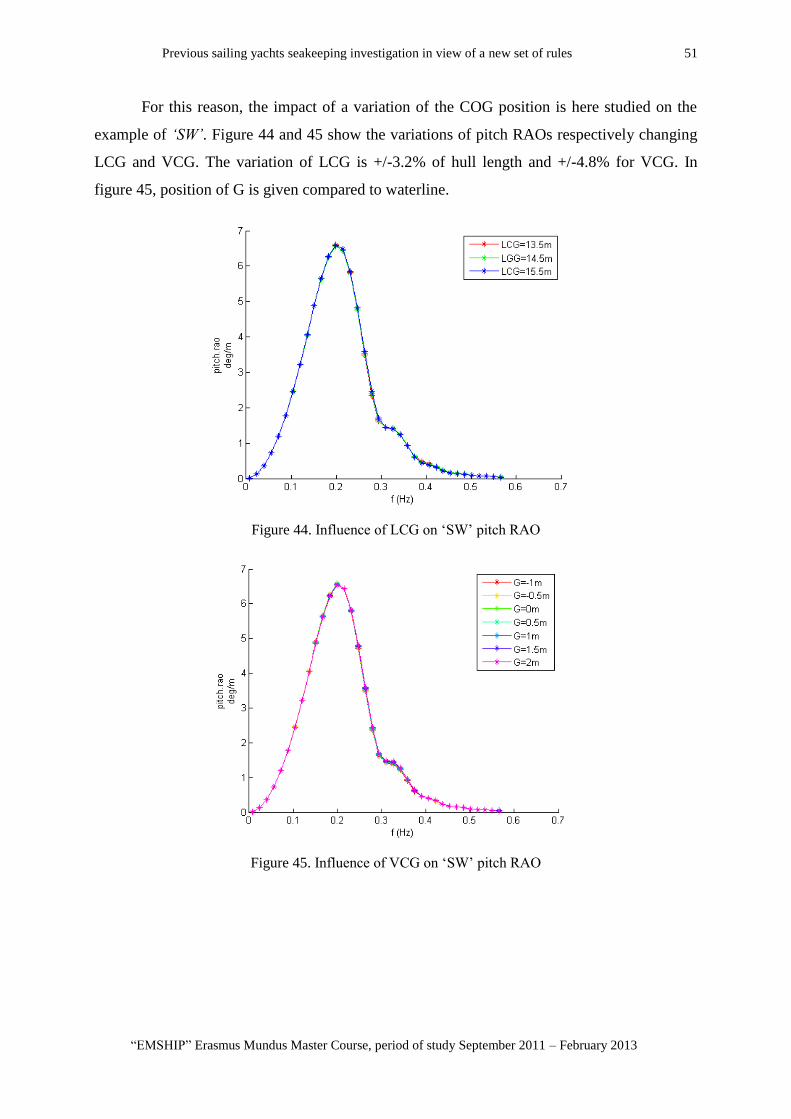
For this reason, the impact of a variation of the COG position is here studied on the
example of ‘SW’. Figure 44 and 45 show the variations of pitch RAOs respectively changing
LCG and VCG. The variation of LCG is +/-3.2% of hull length and +/-4.8% for VCG. In
figure 45, position of G is given compared to waterline.
Figure 44. Influence of LCG on ‘SW’ pitch RAO
Figure 45. Influence of VCG on ‘SW’ pitch RAO
52 Adrien Combourieu
Master Thesis developed at University of Genoa
9. INFLUENCE OF HULL SHAPE
In this part, the impact of some changes in hull shape on pitch motion is studied.
9.1. Stern Shape
Regarding pitch motion, the shape of bow and stern is critical. Modern sailing hulls
tend to have a flat and large stern along with a straight bow. This minimizes the pitch for
several reasons. First, it maximizes the waterline length which effect on pitch motion has been
described in part 5. Then, large and wide stern increases the wave damping effect which
reduces again pitch motion.
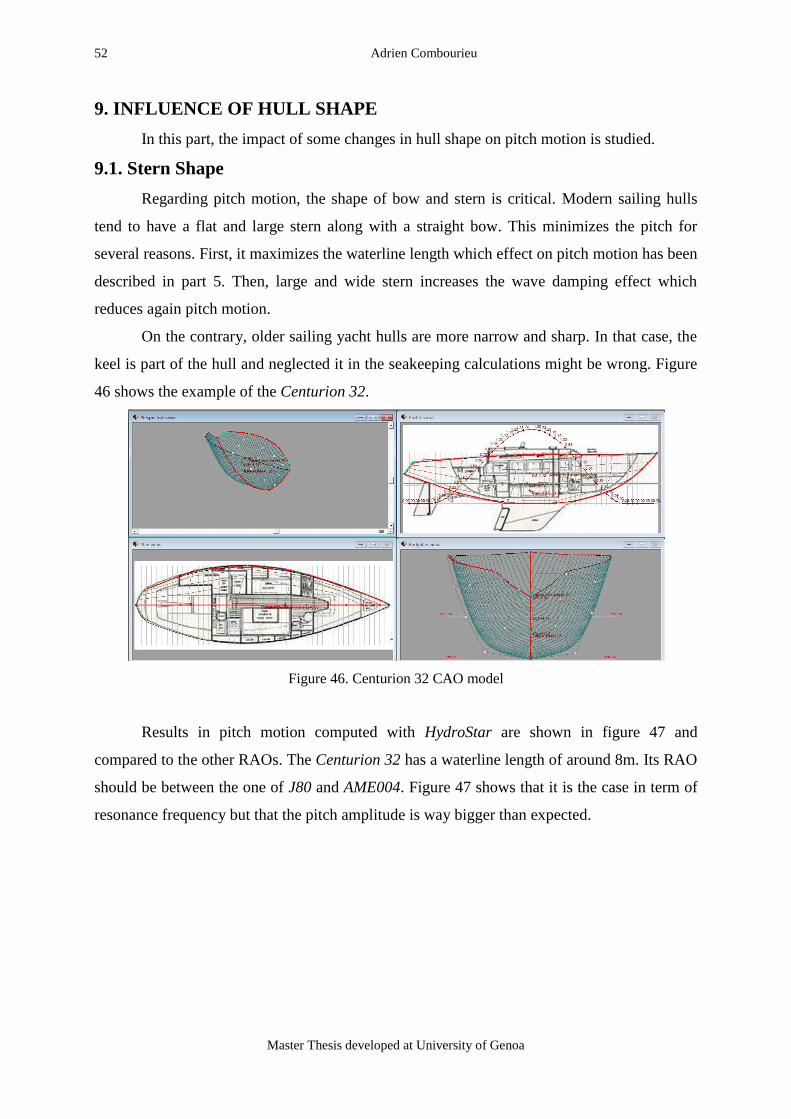
On the contrary, older sailing yacht hulls are more narrow and sharp. In that case, the
keel is part of the hull and neglected it in the seakeeping calculations might be wrong. Figure
46 shows the example of the Centurion 32.
Figure 46. Centurion 32 CAO model
Results in pitch motion computed with HydroStar are shown in figure 47 and
compared to the other RAOs. The Centurion 32 has a waterline length of around 8m. Its RAO
should be between the one of J80 and AME004. Figure 47 shows that it is the case in term of
resonance frequency but that the pitch amplitude is way bigger than expected.
Previous sailing yachts seakeeping investigation in view of a new set of rules 53
“EMSHIP” Erasmus Mundus Master Course, period of study September 2011 – February 2013
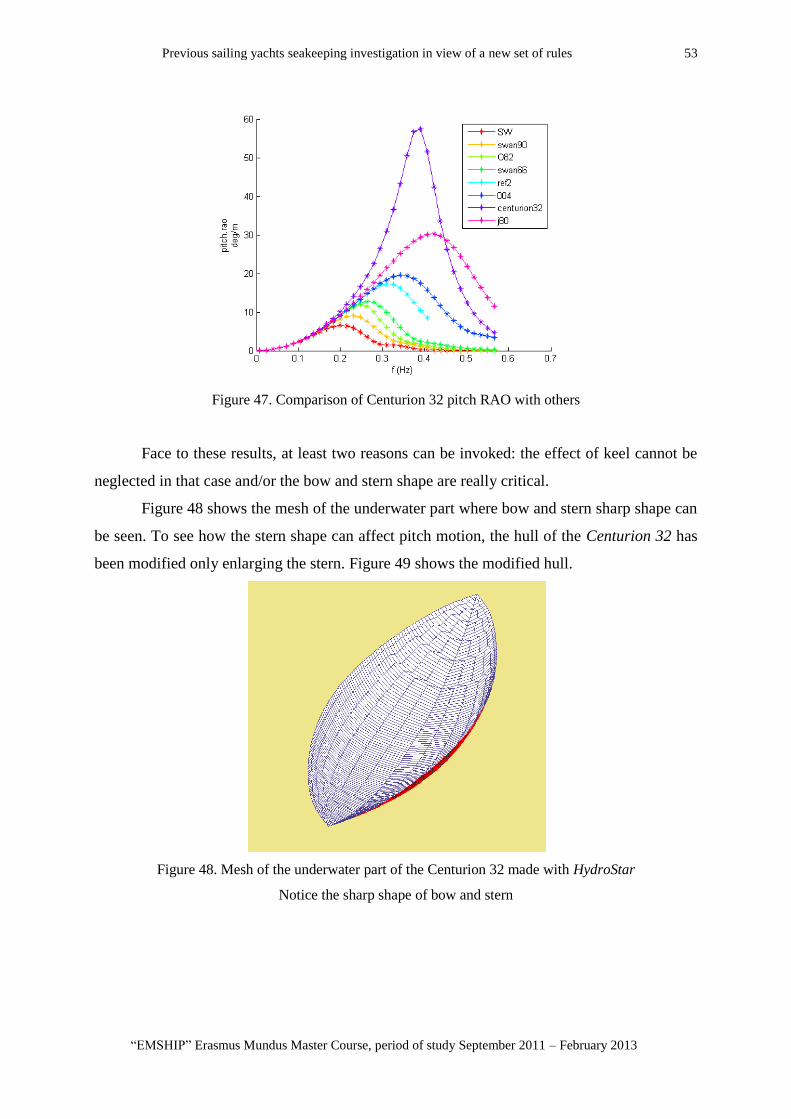
Figure 47. Comparison of Centurion 32 pitch RAO with others
Face to these results, at least two reasons can be invoked: the effect of keel cannot be
neglected in that case and/or the bow and stern shape are really critical.
Figure 48 shows the mesh of the underwater part where bow and stern sharp shape can
be seen. To see how the stern shape can affect pitch motion, the hull of the Centurion 32 has
been modified only enlarging the stern. Figure 49 shows the modified hull.
Figure 48. Mesh of the underwater part of the Centurion 32 made with HydroStar
Notice the sharp shape of bow and stern
54 Adrien Combourieu
Master Thesis developed at University of Genoa
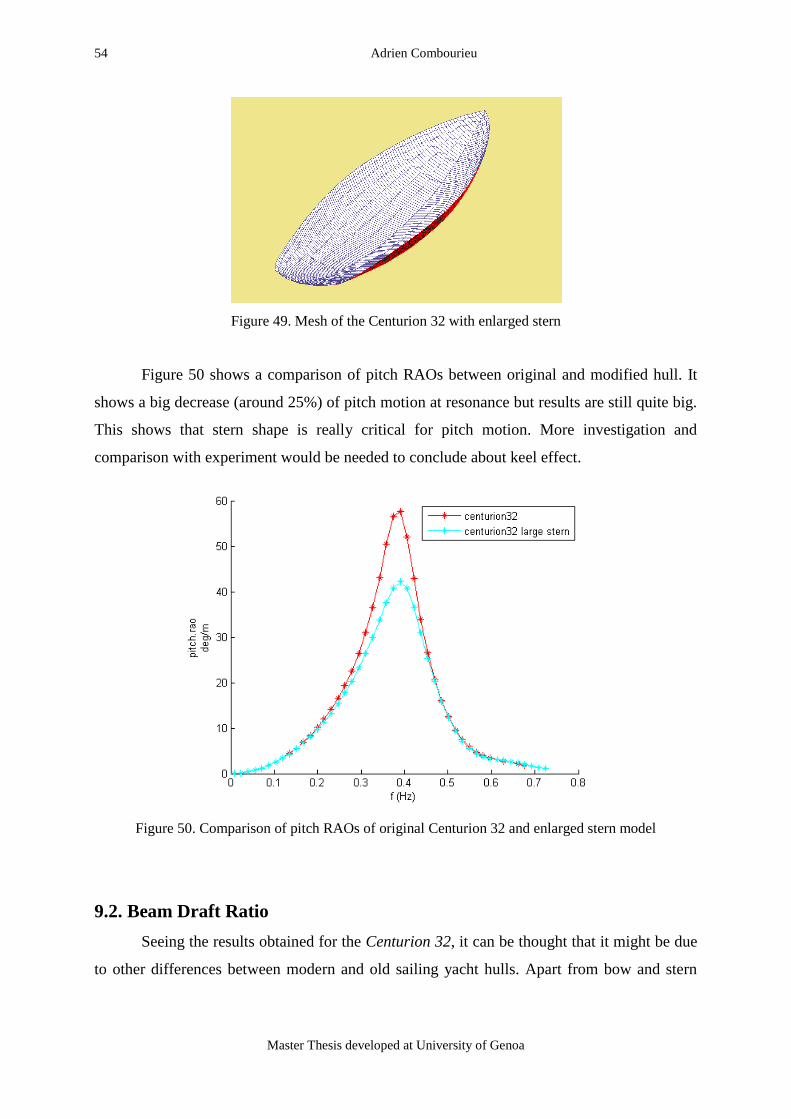
Figure 49. Mesh of the Centurion 32 with enlarged stern
Figure 50 shows a comparison of pitch RAOs between original and modified hull. It
shows a big decrease (around 25%) of pitch motion at resonance but results are still quite big.
This shows that stern shape is really critical for pitch motion. More investigation and
comparison with experiment would be needed to conclude about keel effect.
Figure 50. Comparison of pitch RAOs of original Centurion 32 and enlarged stern model
9.2. Beam Draft Ratio
Seeing the results obtained for the Centurion 32, it can be thought that it might be due
to other differences between modern and old sailing yacht hulls. Apart from bow and stern
Previous sailing yachts seakeeping investigation in view of a new set of rules 55
“EMSHIP” Erasmus Mundus Master Course, period of study September 2011 – February 2013
shape, another big difference between old and modern hulls is that the first ones tend to be
more narrow and deep than the second ones.
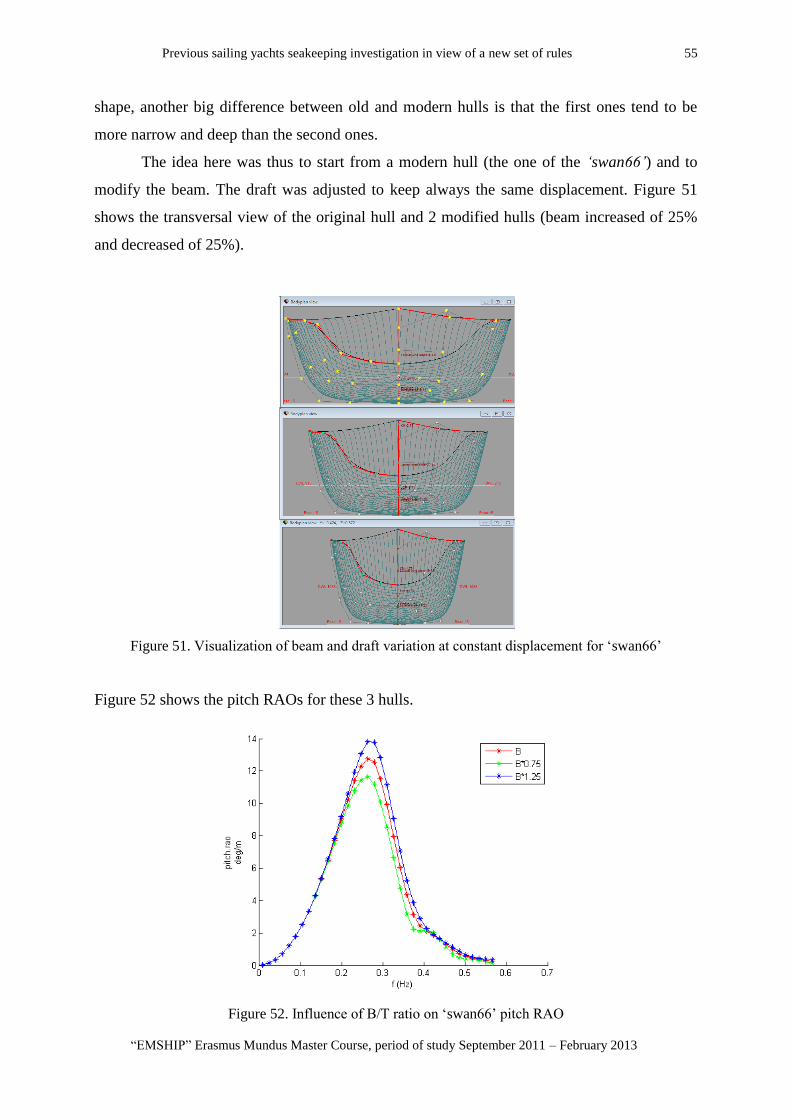
The idea here was thus to start from a modern hull (the one of the ‘swan66’) and to
modify the beam. The draft was adjusted to keep always the same displacement. Figure 51
shows the transversal view of the original hull and 2 modified hulls (beam increased of 25%
and decreased of 25%).
Figure 51. Visualization of beam and draft variation at constant displacement for ‘swan66’
Figure 52 shows the pitch RAOs for these 3 hulls.
Figure 52. Influence of B/T ratio on ‘swan66’ pitch RAO

56 Adrien Combourieu
Master Thesis developed at University of Genoa
It seems that the beam over draft ratio is not so critical concerning pitch motion. Moreover, it
looks like deep and narrow hull may decrease pitch motion. It is thus not because of this factor
that the Centurion 32 has such a big pitch amplitude.
9.3. Draft and Displacement
Often the available hydrostatic data is about lightship. Draft and displacement can
vary when the crew is on board and all the material loaded. This variation will be bigger with
smaller ship. For example with J80, the crew can represent one third of the displacement.
Therefore, a question may be how the pitch motion would be impacted with increasing draft
and displacement. Calculations have been performed in the case of the ‘swan66’ and results are
shown in figure 53 for different drafts (and thus different displacements).
Figure 53. Influence of draft (or displacement) on ‘swan66’ pitch RAO
Draft and displacement increase look to decrease slightly pitch motion. Note that it
modifies also slightly the resonance frequency. The lightship looks thus to be a kind of worst
case concerning displacement. Here again, the big draft and displacement of the Centurion 32
do not justify its big pitch motion obtained with HydroStar.
Previous sailing yachts seakeeping investigation in view of a new set of rules 57
“EMSHIP” Erasmus Mundus Master Course, period of study September 2011 – February 2013
10. REAL SCENARIO
In this part the yacht Kiboko is quickly presented. Then, a comparison between pitch
RAOs computed with HydroStar and estimated with proposed method is made. Finally, more
accurate computations are made with HydroStar taking into account more available data.
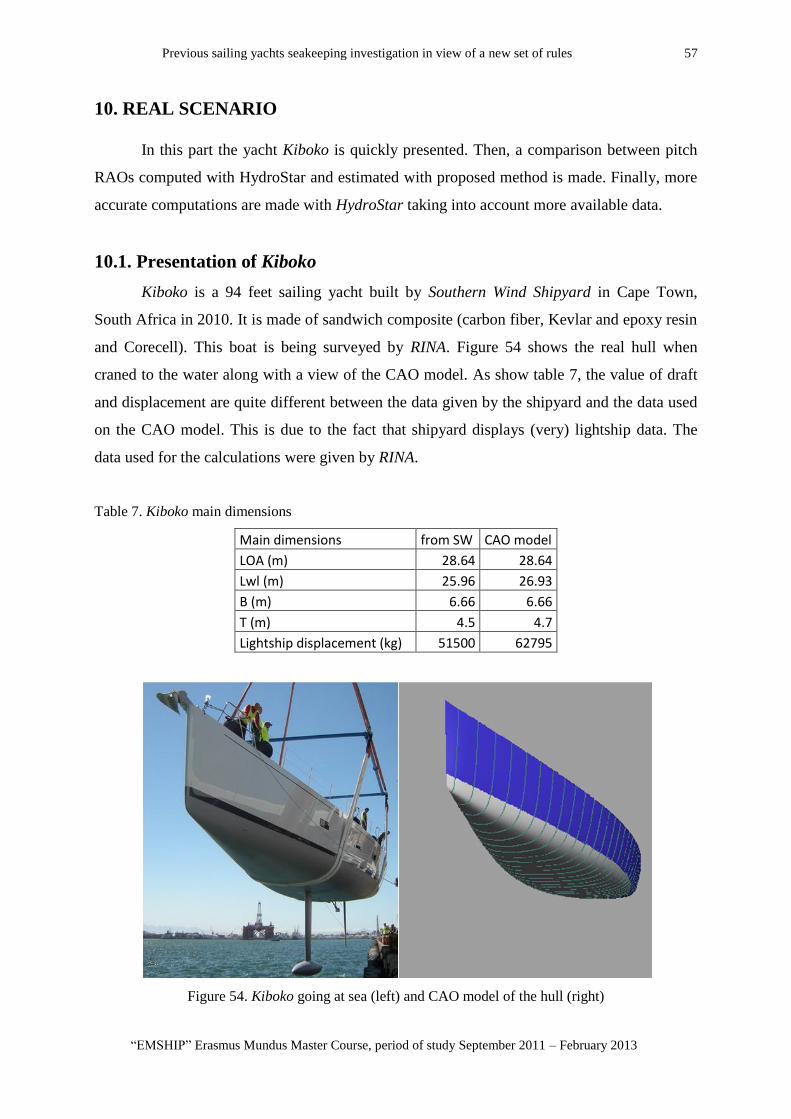
10.1. Presentation of Kiboko
Kiboko is a 94 feet sailing yacht built by Southern Wind Shipyard in Cape Town,
South Africa in 2010. It is made of sandwich composite (carbon fiber, Kevlar and epoxy resin
and Corecell). This boat is being surveyed by RINA. Figure 54 shows the real hull when
craned to the water along with a view of the CAO model. As show table 7, the value of draft
and displacement are quite different between the data given by the shipyard and the data used
on the CAO model. This is due to the fact that shipyard displays (very) lightship data. The
data used for the calculations were given by RINA.
Table 7. Kiboko main dimensions
Main dimensions from SW CAO model
LOA (m) 28.64 28.64
Lwl (m) 25.96 26.93
B (m) 6.66 6.66
T (m) 4.5 4.7
Lightship displacement (kg) 51500 62795
Figure 54. Kiboko going at sea (left) and CAO model of the hull (right)
58 Adrien Combourieu
Master Thesis developed at University of Genoa
Kiboko is supposed to sail from South Africa to Europe in beginning of 2013. RINA
hopes to cooperate with Southern Wind Shipyard to be able to perform on board measurement
during that trip. The idea of the following sub sections is to provide some numerical
computations to be later compared with these onboard measurements. Ideally, true wind
speed, true wind angle, boat speed should be recorded along with pitch motion and
acceleration at mid mast.
10.2. Estimation of Pitch Results with Proposed Method
Kiboko was not part of the small database used to get the approximate method exposed
in previous parts. It is the typical kind of hull for which this method is done. It can thus be
interesting to try to apply it and compare the estimated results with numerical results.
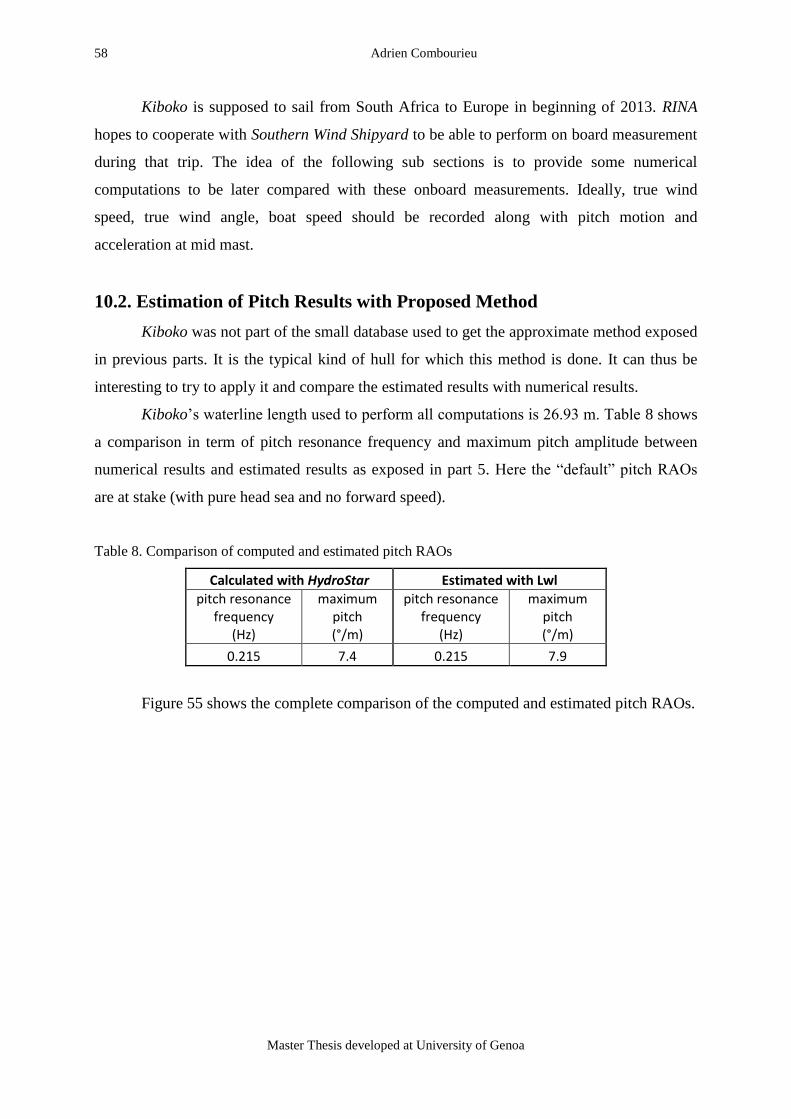
Kiboko’s waterline length used to perform all computations is 26.93 m. Table 8 shows
a comparison in term of pitch resonance frequency and maximum pitch amplitude between
numerical results and estimated results as exposed in part 5. Here the “default” pitch RAOs
are at stake (with pure head sea and no forward speed).
Table 8. Comparison of computed and estimated pitch RAOs
Calculated with HydroStar Estimated with Lwl
pitch resonance frequency
(Hz)
maximum pitch (°/m)
pitch resonance frequency
(Hz)
maximum pitch (°/m)
0.215 7.4 0.215 7.9
Figure 55 shows the complete comparison of the computed and estimated pitch RAOs.
Previous sailing yachts seakeeping investigation in view of a new set of rules 59
“EMSHIP” Erasmus Mundus Master Course, period of study September 2011 – February 2013
Figure 55. Kiboko pitch RAO computed with HydroStar (green) and estimated with its waterline
length (blue)
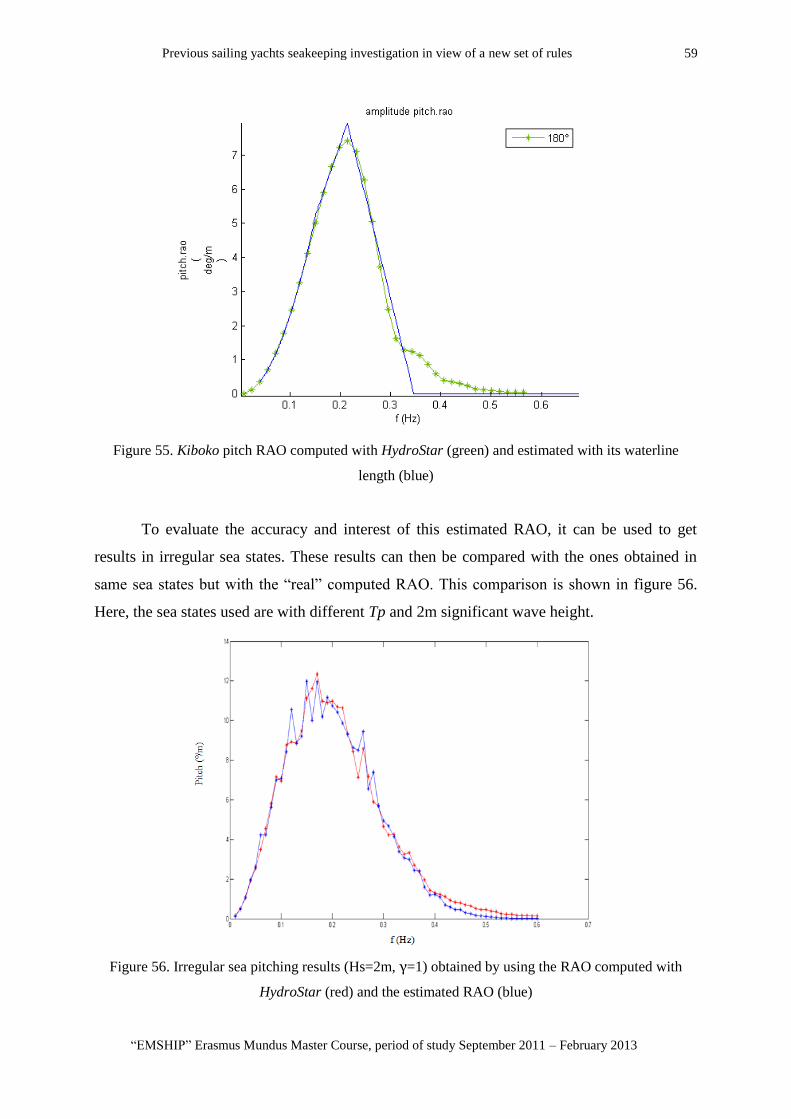
To evaluate the accuracy and interest of this estimated RAO, it can be used to get
results in irregular sea states. These results can then be compared with the ones obtained in
same sea states but with the “real” computed RAO. This comparison is shown in figure 56.
Here, the sea states used are with different Tp and 2m significant wave height.
Figure 56. Irregular sea pitching results (Hs=2m, γ=1) obtained by using the RAO computed with
HydroStar (red) and the estimated RAO (blue)
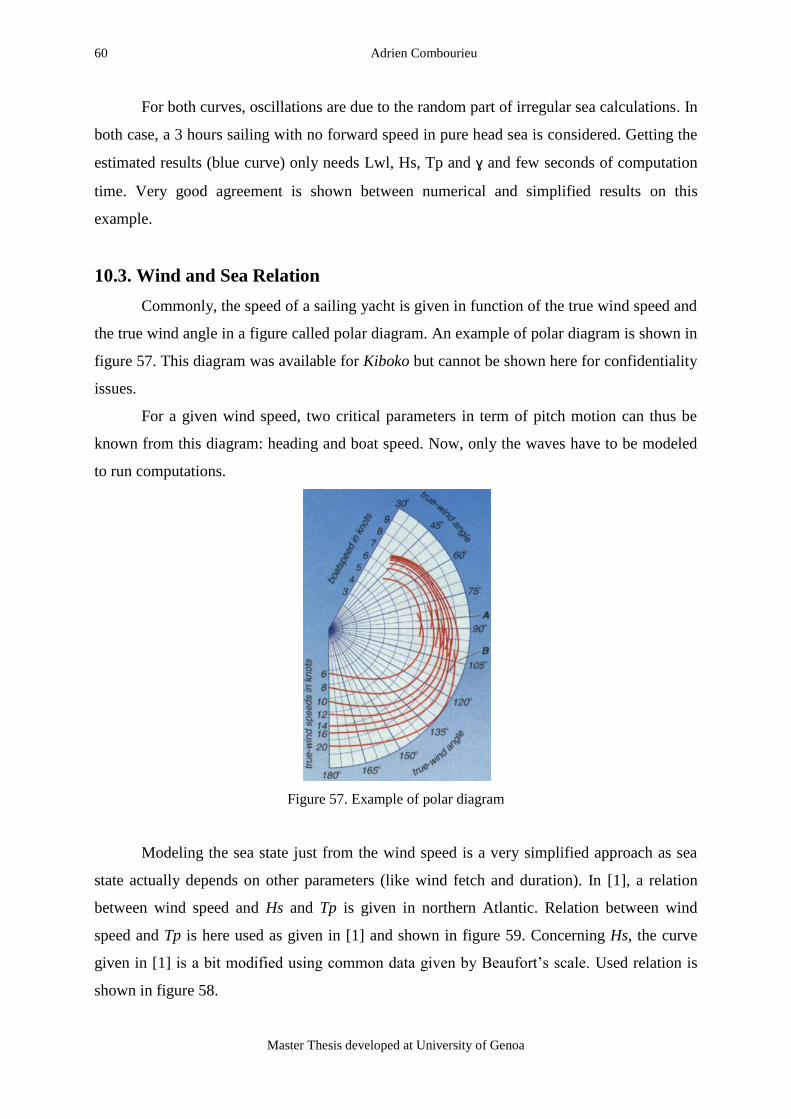
60 Adrien Combourieu
Master Thesis developed at University of Genoa
For both curves, oscillations are due to the random part of irregular sea calculations. In
both case, a 3 hours sailing with no forward speed in pure head sea is considered. Getting the
estimated results (blue curve) only needs Lwl, Hs, Tp and ɣ and few seconds of computation
time. Very good agreement is shown between numerical and simplified results on this
example.
10.3. Wind and Sea Relation
Commonly, the speed of a sailing yacht is given in function of the true wind speed and
the true wind angle in a figure called polar diagram. An example of polar diagram is shown in
figure 57. This diagram was available for Kiboko but cannot be shown here for confidentiality
issues.
For a given wind speed, two critical parameters in term of pitch motion can thus be
known from this diagram: heading and boat speed. Now, only the waves have to be modeled
to run computations.
Figure 57. Example of polar diagram
Modeling the sea state just from the wind speed is a very simplified approach as sea
state actually depends on other parameters (like wind fetch and duration). In [1], a relation
between wind speed and Hs and Tp is given in northern Atlantic. Relation between wind
speed and Tp is here used as given in [1] and shown in figure 59. Concerning Hs, the curve
given in [1] is a bit modified using common data given by Beaufort’s scale. Used relation is
shown in figure 58.
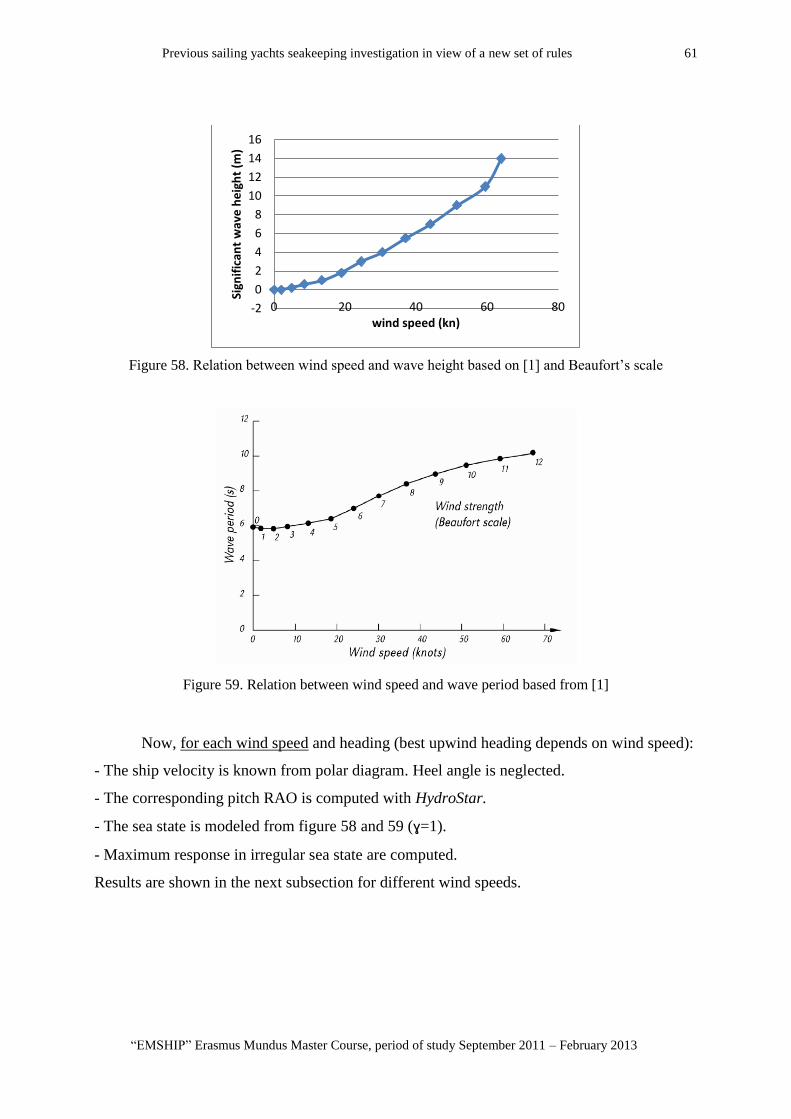
Previous sailing yachts seakeeping investigation in view of a new set of rules 61
“EMSHIP” Erasmus Mundus Master Course, period of study September 2011 – February 2013
Figure 58. Relation between wind speed and wave height based on [1] and Beaufort’s scale
Figure 59. Relation between wind speed and wave period based from [1]
Now, for each wind speed and heading (best upwind heading depends on wind speed):
- The ship velocity is known from polar diagram. Heel angle is neglected.
- The corresponding pitch RAO is computed with HydroStar.
- The sea state is modeled from figure 58 and 59 (ɣ=1).
- Maximum response in irregular sea state are computed.
Results are shown in the next subsection for different wind speeds.
-2
0
2
4
6
8
10
12
14
16
0 20 40 60 80
Sign
ific
ant
wav
e h
eig
ht
(m)
wind speed (kn)
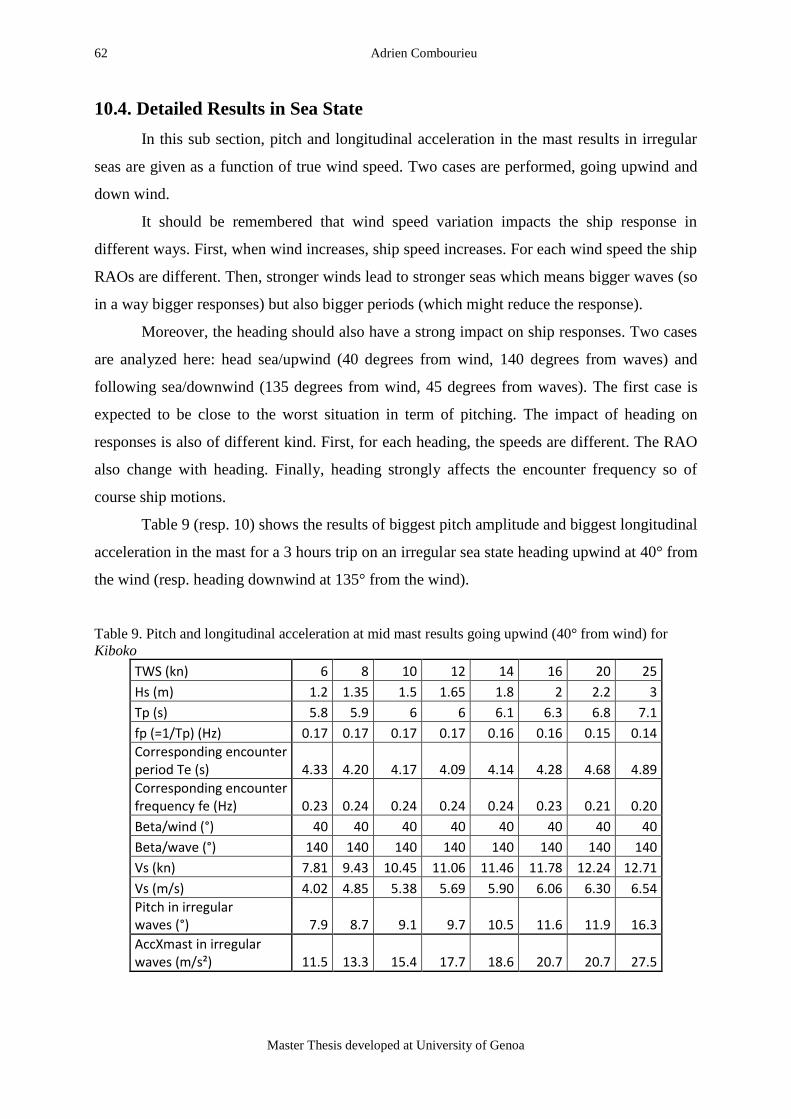
62 Adrien Combourieu
Master Thesis developed at University of Genoa
10.4. Detailed Results in Sea State
In this sub section, pitch and longitudinal acceleration in the mast results in irregular
seas are given as a function of true wind speed. Two cases are performed, going upwind and
down wind.
It should be remembered that wind speed variation impacts the ship response in
different ways. First, when wind increases, ship speed increases. For each wind speed the ship
RAOs are different. Then, stronger winds lead to stronger seas which means bigger waves (so
in a way bigger responses) but also bigger periods (which might reduce the response).
Moreover, the heading should also have a strong impact on ship responses. Two cases
are analyzed here: head sea/upwind (40 degrees from wind, 140 degrees from waves) and
following sea/downwind (135 degrees from wind, 45 degrees from waves). The first case is
expected to be close to the worst situation in term of pitching. The impact of heading on
responses is also of different kind. First, for each heading, the speeds are different. The RAO
also change with heading. Finally, heading strongly affects the encounter frequency so of
course ship motions.
Table 9 (resp. 10) shows the results of biggest pitch amplitude and biggest longitudinal
acceleration in the mast for a 3 hours trip on an irregular sea state heading upwind at 40° from
the wind (resp. heading downwind at 135° from the wind).
Table 9. Pitch and longitudinal acceleration at mid mast results going upwind (40° from wind) for
Kiboko
TWS (kn) 6 8 10 12 14 16 20 25
Hs (m) 1.2 1.35 1.5 1.65 1.8 2 2.2 3
Tp (s) 5.8 5.9 6 6 6.1 6.3 6.8 7.1
fp (=1/Tp) (Hz) 0.17 0.17 0.17 0.17 0.16 0.16 0.15 0.14
Corresponding encounter period Te (s) 4.33 4.20 4.17 4.09 4.14 4.28 4.68 4.89
Corresponding encounter frequency fe (Hz) 0.23 0.24 0.24 0.24 0.24 0.23 0.21 0.20
Beta/wind (°) 40 40 40 40 40 40 40 40
Beta/wave (°) 140 140 140 140 140 140 140 140
Vs (kn) 7.81 9.43 10.45 11.06 11.46 11.78 12.24 12.71
Vs (m/s) 4.02 4.85 5.38 5.69 5.90 6.06 6.30 6.54
Pitch in irregular waves (°) 7.9 8.7 9.1 9.7 10.5 11.6 11.9 16.3
AccXmast in irregular waves (m/s²) 11.5 13.3 15.4 17.7 18.6 20.7 20.7 27.5
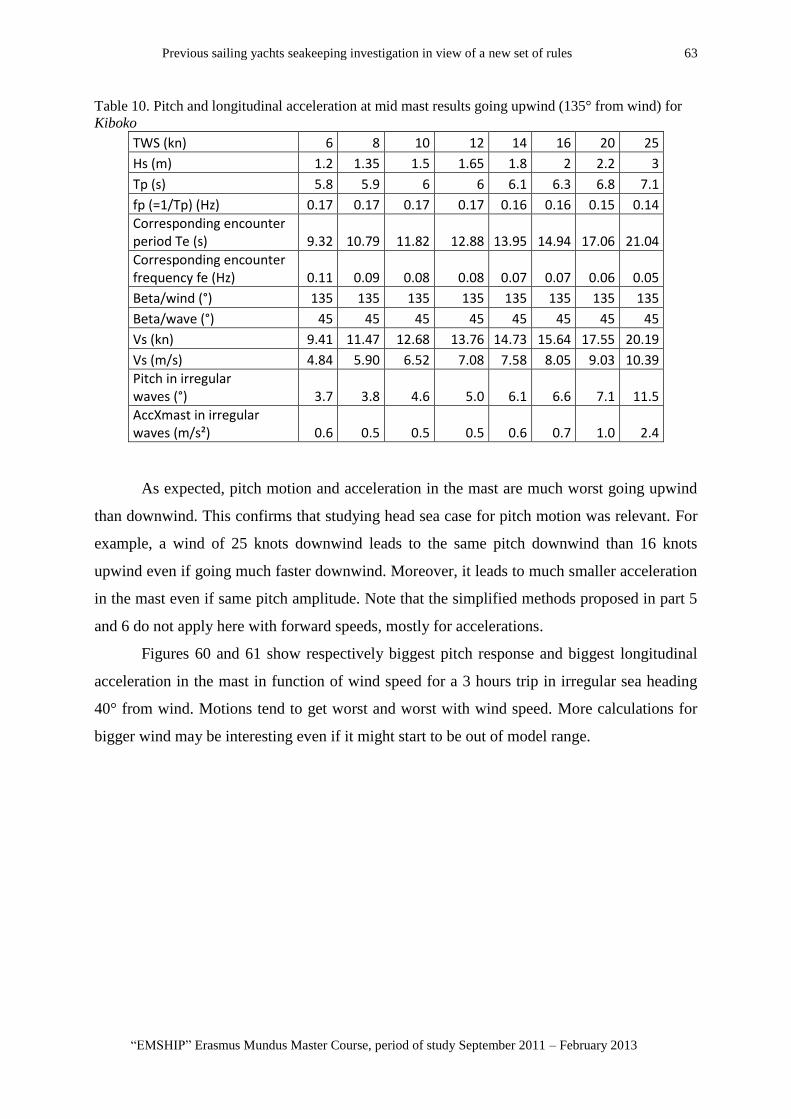
Previous sailing yachts seakeeping investigation in view of a new set of rules 63
“EMSHIP” Erasmus Mundus Master Course, period of study September 2011 – February 2013
Table 10. Pitch and longitudinal acceleration at mid mast results going upwind (135° from wind) for
Kiboko
TWS (kn) 6 8 10 12 14 16 20 25
Hs (m) 1.2 1.35 1.5 1.65 1.8 2 2.2 3
Tp (s) 5.8 5.9 6 6 6.1 6.3 6.8 7.1
fp (=1/Tp) (Hz) 0.17 0.17 0.17 0.17 0.16 0.16 0.15 0.14
Corresponding encounter period Te (s) 9.32 10.79 11.82 12.88 13.95 14.94 17.06 21.04
Corresponding encounter frequency fe (Hz) 0.11 0.09 0.08 0.08 0.07 0.07 0.06 0.05
Beta/wind (°) 135 135 135 135 135 135 135 135
Beta/wave (°) 45 45 45 45 45 45 45 45
Vs (kn) 9.41 11.47 12.68 13.76 14.73 15.64 17.55 20.19
Vs (m/s) 4.84 5.90 6.52 7.08 7.58 8.05 9.03 10.39
Pitch in irregular waves (°) 3.7 3.8 4.6 5.0 6.1 6.6 7.1 11.5
AccXmast in irregular waves (m/s²) 0.6 0.5 0.5 0.5 0.6 0.7 1.0 2.4
As expected, pitch motion and acceleration in the mast are much worst going upwind
than downwind. This confirms that studying head sea case for pitch motion was relevant. For
example, a wind of 25 knots downwind leads to the same pitch downwind than 16 knots
upwind even if going much faster downwind. Moreover, it leads to much smaller acceleration
in the mast even if same pitch amplitude. Note that the simplified methods proposed in part 5
and 6 do not apply here with forward speeds, mostly for accelerations.
Figures 60 and 61 show respectively biggest pitch response and biggest longitudinal
acceleration in the mast in function of wind speed for a 3 hours trip in irregular sea heading
40° from wind. Motions tend to get worst and worst with wind speed. More calculations for
bigger wind may be interesting even if it might start to be out of model range.
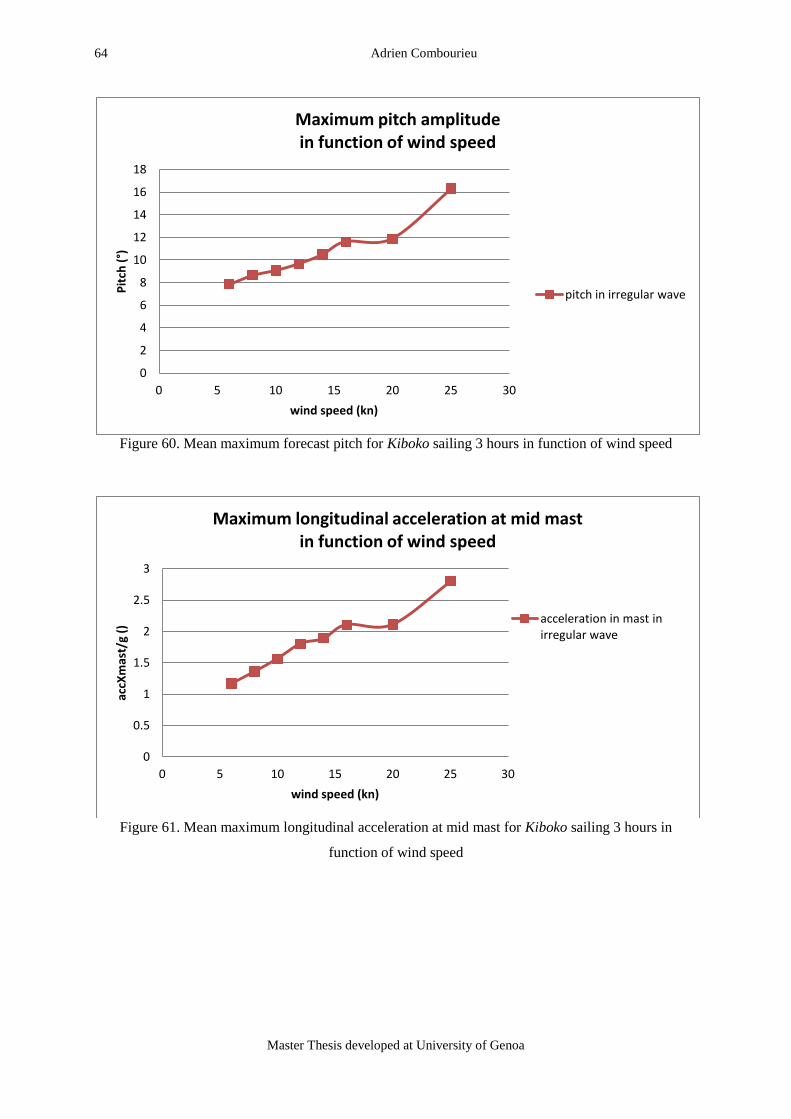
64 Adrien Combourieu
Master Thesis developed at University of Genoa
Figure 60. Mean maximum forecast pitch for Kiboko sailing 3 hours in function of wind speed
Figure 61. Mean maximum longitudinal acceleration at mid mast for Kiboko sailing 3 hours in
function of wind speed
0
2
4
6
8
10
12
14
16
18
0 5 10 15 20 25 30
Pit
ch (
°)
wind speed (kn)
Maximum pitch amplitude in function of wind speed
pitch in irregular wave
0
0.5
1
1.5
2
2.5
3
0 5 10 15 20 25 30
accX
mas
t/g
()
wind speed (kn)
Maximum longitudinal acceleration at mid mast in function of wind speed
acceleration in mast in irregular wave
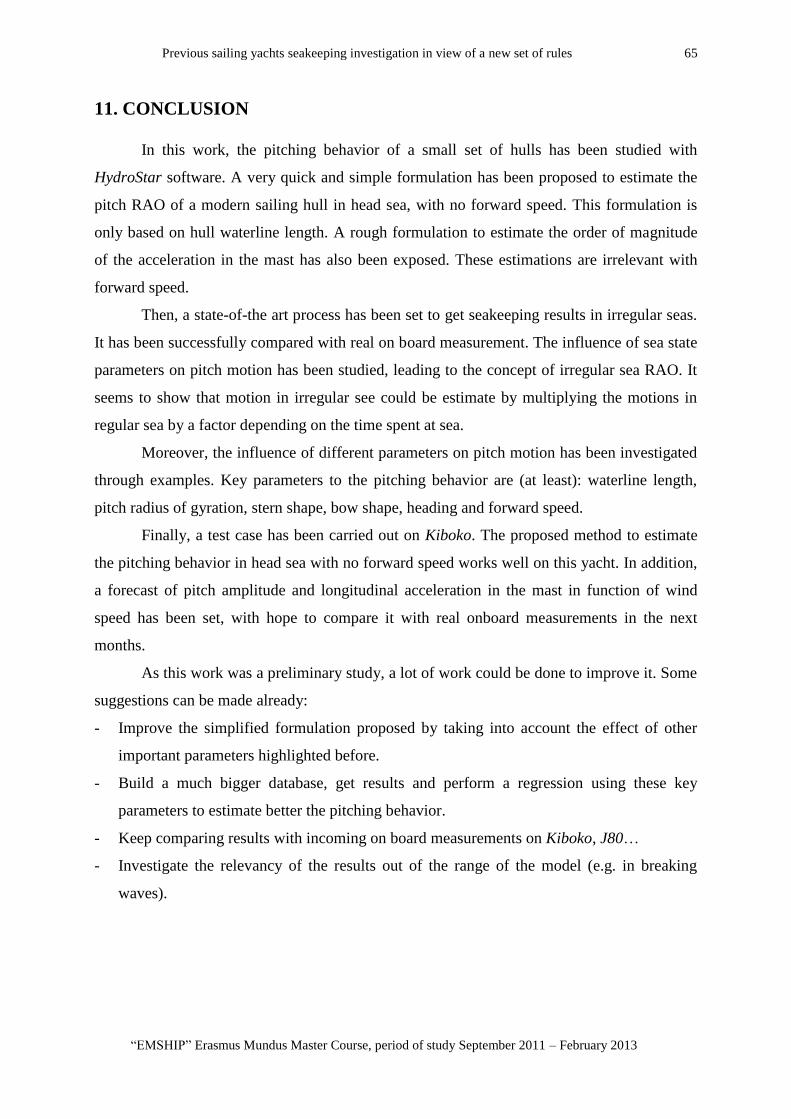
Previous sailing yachts seakeeping investigation in view of a new set of rules 65
“EMSHIP” Erasmus Mundus Master Course, period of study September 2011 – February 2013
11. CONCLUSION
In this work, the pitching behavior of a small set of hulls has been studied with
HydroStar software. A very quick and simple formulation has been proposed to estimate the
pitch RAO of a modern sailing hull in head sea, with no forward speed. This formulation is
only based on hull waterline length. A rough formulation to estimate the order of magnitude
of the acceleration in the mast has also been exposed. These estimations are irrelevant with
forward speed.
Then, a state-of-the art process has been set to get seakeeping results in irregular seas.
It has been successfully compared with real on board measurement. The influence of sea state
parameters on pitch motion has been studied, leading to the concept of irregular sea RAO. It
seems to show that motion in irregular see could be estimate by multiplying the motions in
regular sea by a factor depending on the time spent at sea.
Moreover, the influence of different parameters on pitch motion has been investigated
through examples. Key parameters to the pitching behavior are (at least): waterline length,
pitch radius of gyration, stern shape, bow shape, heading and forward speed.
Finally, a test case has been carried out on Kiboko. The proposed method to estimate
the pitching behavior in head sea with no forward speed works well on this yacht. In addition,
a forecast of pitch amplitude and longitudinal acceleration in the mast in function of wind
speed has been set, with hope to compare it with real onboard measurements in the next
months.
As this work was a preliminary study, a lot of work could be done to improve it. Some
suggestions can be made already:
- Improve the simplified formulation proposed by taking into account the effect of other
important parameters highlighted before.
- Build a much bigger database, get results and perform a regression using these key
parameters to estimate better the pitching behavior.
- Keep comparing results with incoming on board measurements on Kiboko, J80…
- Investigate the relevancy of the results out of the range of the model (e.g. in breaking
waves).

66 Adrien Combourieu
Master Thesis developed at University of Genoa
12. ACKNOWLEDGEMENTS
The author wants to thank the company RINA and in particular Mr. Flavio Faloci for
his valuable help and continuous supervision. The author is thankful to Bureau Veritas and
Mr. Guillaume de Hauteclocque for providing HydroStar software license and technical
support. Mr. Patrick Bot and Mr. Benoit Augier are also acknowledged for the valuable data
they shared with the author about J80 measurements.
This master thesis was developed in University of Genoa under the academic
supervision of Professor Dario Boote and in the frame of the European Master Course in
“Integrated Advanced Ship Design” named “EMSHIP” for “European Education in Advanced
Ship Design”, Ref.: 159652-1-2009-1-BE-ERA MUNDUS-EMMC.
Previous sailing yachts seakeeping investigation in view of a new set of rules 67
“EMSHIP” Erasmus Mundus Master Course, period of study September 2011 – February 2013
13. REFERENCES
1. Fossati, F., Muggiasca, S., (2011), “Experimental investigation of sail aerodynamic
behaviour in dynamic conditions”, Journal of Sailboat Technology, 2011, 2011(03)
2. McRae, B., R. Binns, J., Klaka, K., Dovell, A., “Windward performance of the AME CRC
systematic yacht series”, RINA* International Conference on the Modern Yacht,
Portsmouth, UK, March 1998
3. Augier, B., Bot, P., Hauville, F., Durand, M., (2012), “Experimental validation of
unsteady models for fluid structure interaction: Application to yacht sails and rigs”.
Journal of Wind Engineering and Industrial Aerodynamics, 101 (2012), pp 53–66
4. Augier, B., Hauville, F., Bot, P., Durand, M., (2012), “Numerical investigation of the
unsteady fluid structure interaction of a yacht sail plan”. 4th High Performance Yacht
Design Conference, Auckland, 12-14 March, 2012
5. Rules for the Classification of Yachts Designed for Commercial Use, Part B, 8.4 Masts
and Rigging, RINA
6. HydroStar for experts user manual, Bureau Veritas
7. Southern wind shipyard website: http://www.southernwindshipyard.com/
8. Nautor’s Swan company website: http://www.nautorswan.com
9. Oyster Marine website: http://www.oystermarine.com/
10. J80 association website: http://www.j80.org/
11. Centurion 32 association website: http://www.centurion32.com
*Royal Institute of Naval Architecture
APPENDIX 1
68 Adrien Combourieu
Master Thesis developed at University of Genoa
‘SW” stands for the SW 100 RS ship from Southern Wind shipyard. CAO hull was
provided by RINA. Commercial information can be found on southern wind website
[7].
‘swan 90’ stands for the boat of the same name by Nautor’s Swan. Commercial
information can be found on company website [8]. CAO model was made by the
author.
‘oyster 82’ stands for the yacht of the same name by Oyster Marine. Commercial
information is available on company website [9]. CAO model was made by the author.
‘swan 66’ stands for the boat of the same name by Nautor’s Swan. Commercial
information can be found on company website [8]. CAO model was made by the
author.
‘ref2’ is a hull designed by the author only based on the main dimensions of the hull
used in [1]. No plan was used to design it.
‘AME004’ is an IMS type yacht based on the Delft Systematic Yacht Hull Series II
yacht form. It was designed to copy the reference hull used in [2]. It was given by
RINA.
‘J80’ stands for the famous boat of the same name. It is the reference 8m sailing boat.
The J80 is one of Europe's and North America's best selling sportsboats. More
information can be found on [10]. CAO model was given by RINA.
‘Centurion 32’ stands for the boat of the same name by Wauqiez. CAO model was
made by the author. All information used can be found on [11].
‘Kiboko” stands for the SW 94 ship from Southern Wind shipyard. CAO hull was
provided by RINA. Commercial information can be found on southern wind website
[7]. Confidential information was also given by RINA about this boat.