prgsx global stock fund pagsx global stock … · europe and emerging markets were ... and...
TRANSCRIPT

T. ROWE PRICE
April 30, 2018
PRGSX Global Stock Fund
PAGSX Global Stock Fund– Advisor Class
TRGLX Global Stock Fund– I Class
The fund invests in companies in developed and, to a lesser extent, emerging markets anywhere in the world.
For more insights from T. Rowe Price investment professionals, go to troweprice.com.
SEMIANNUAL REPORT
Proof #5
T. Rowe PRICe GlobAl SToCk Fund
CIo Market Commentary
T. Rowe PRICe GlobAl SToCk Fund
HIGHLIGHTS
n Global growth shares posted gains in a volatile market that favored growth stocks for the six months ended April 30, 2018.
n The Global Stock Fund returned 7.71% during the period and widely outperformed both its benchmark, the MSCI All Country World Index, and its Lipper peer group.
n Our selection of stocks in the consumer discretionary and health care sectors produced many of the portfolio’s top absolute contributors.
n The fund is positioned for a supportive, albeit not robust, economic environment; however, we remain confident in the long-term outlook for individual investment opportunities.
It’s fast—receive your statements and confirmations faster than U.S. mail.
It’s convenient—access your important account documents whenever you need them.
It’s secure—we protect your online accounts using “True Identity” to confirm new accounts and make verification faster and more secure.
It can save you money—where applicable, T. Rowe Price passes on the cost savings to fund holders.*
TO ENROLL:If you invest directly with T. Rowe Price, go to troweprice.com/paperless.
If you invest through an investment advisor, a bank, or a brokerage firm, please contact that organization and ask if it can provide electronic documentation.
Go PaperlessSign up for e-delivery of your statements, confirmations, and prospectuses or shareholder reports.
Log in to your account at troweprice.com for more information.
* Certain mutual fund accounts that are assessed an annual account service fee can also save money by switching to e-delivery.
Proof #5

1
T. Rowe PRICe GlobAl SToCk Fund
CIo Market Commentary
T. Rowe PRICe GlobAl SToCk Fund
dear Shareholder
Global markets experienced an abrupt reversal in early 2018, as a prolonged stretch of slow and steady gains in many equity markets gave way to a spike in volatility. In February, the S&P 500 Index broke its longest streak of positive monthly total returns on record and briefly declined by over 10% from its recent highs, putting it in correction territory. Overseas markets broadly followed Wall Street lower, and global stocks remained volatile through April. Strong results from November through January helped most markets end with gains for the first half of your fund’s fiscal year, however.
Several factors appeared to have unsettled investors, but the impact of tighter monetary policy and fears about heightened trade tensions were primary among them. Data in early February showing faster wage gains in the U.S. fostered speculation that the Federal Reserve might accelerate its pace of interest rate hikes in order to fight inflation. While most other central banks continued to keep short-term rates steady at very low levels, longer-term rates in many countries crept up as economic growth solidified. Investors around the world began to consider how the normalization of monetary policy might potentially impact stock and bond prices.
Uncertainties deepened in early March after the Trump administration surprised many with the announcement of tariffs on imported steel and aluminum, only to later grant select trading partners temporary exemptions. The trade conflict between China and the U.S. intensified, however, with the U.S. announcing additional tariffs on Chinese goods and China responding with its own tariffs in a tit-for-tat escalation that proceeded through April.
World currencies fluctuated amid increased market volatility, geopolitical swings, and concerns about rising U.S. protectionism. The greenback began to strengthen late in the period as the 10-year U.S. Treasury yield broke through 3%; but for the full six months ended April 30, the dollar declined almost 4% against the euro, British pound, and Japanese yen. The rise in other currencies boosted returns for U.S. investors in overseas markets.
Emerging markets, supported by good earnings growth, proved resilient for much of the period and outperformed their developed peers over the last six months. Oil exporters and other commodity producers benefited from rising prices, and improving fiscal conditions lowered borrowing costs in a number of emerging economies. The month of April proved tougher for emerging markets, though, as U.S. yields and the dollar began to rise.
Proof #5

2
T. Rowe PRICe GlobAl SToCk Fund
Notably, the shift in market sentiment beginning in February did not correspond to a widespread deterioration in economic conditions or corporate fundamentals. Indeed, corporate profit growth accelerated across many markets, and the world’s major economies continued to expand in sync for the first time in several years. Market strength in the first three months of the period was largely based on the expectation of this improvement; conversely, weakness in the back half of the period appears to have largely reflected growing skepticism about whether this pace of improvement is sustainable.
Time will tell if the recent turbulence was signaling trouble ahead or if the market was simply consolidating the strong gains over the past several years before moving higher. Among the developments we will be watching closely are election results in the U.S., Europe, and elsewhere, and whether a continuing populist backlash results in a wave of protectionism. On the economic front, the possibility that inflation finally takes hold in developed markets and how consumers and businesses adjust to an end of extreme monetary accommodation will help determine if growth can sustain its momentum. In historical terms, equity and bond valuations remain generally elevated, posing the risk that asset prices won’t keep pace with improving fundamentals over the short term.
Many investors have been asking our view on the recent return to more normal levels of market volatility. It’s important to underscore that volatility, while sometimes unsettling, can be the friend of long-term, patient investors. More volatility can benefit active management, and I am confident that our dedicated, worldwide team of investment professionals are taking advantage of this period to discover new opportunities. Moreover, I have no doubt that your fund’s experienced manager will continue to make the best use of those insights, putting the long-term interests of our shareholders above the short-term instincts that too often drive markets.
Thank you for your continued confidence in T. Rowe Price.
Sincerely,
Robert SharpsGroup Chief Investment Officer
Proof #5
3
T. Rowe PRICe GlobAl SToCk Fund
Management’s discussion of Fund Performance
INVESTMENT OBJECTIVE
The fund seeks long-term growth of capital through investments primarily in the common stocks of established companies throughout the world, including the U.S.
FUND COMMENTARY
Q: How did the fund perform in the past six months?
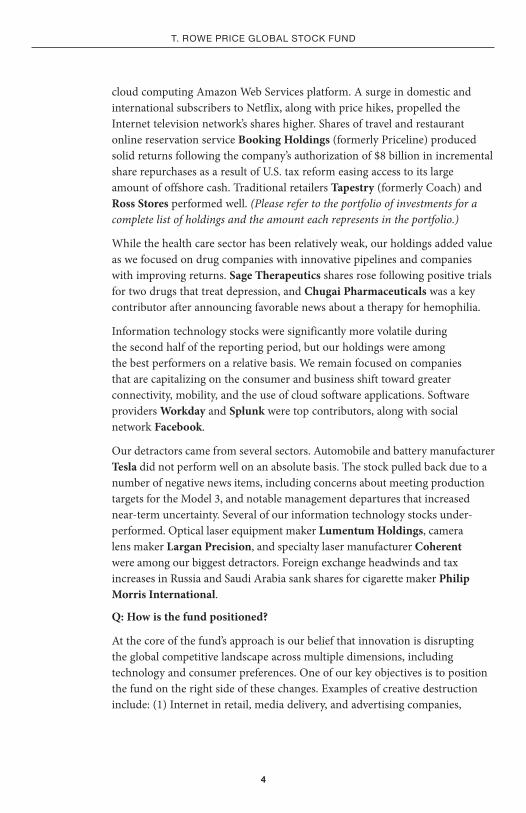
The Global Stock Fund returned 7.71% in the six months ended April 30, 2018. The fund widely outperformed both the MSCI All Country World Index benchmark and the Lipper Global Multi-Cap Growth Funds Average. Returns for the Advisor and I Class shares reflect different fee structures. (Past performance cannot guarantee future results.)
Q: What factors influenced the fund’s performance?
Our stock selections in the consumer discretionary and health care sectors produced many of the portfolio’s top absolute contributors. Our information technology stocks were also solid contributors. Geographically, our holdings in the United States, Japan, and developed Europe were positive relative to the benchmark. Stock selection in Asia Pacific excluding Japan detracted on an
absolute and relative basis. Consumer staples and real estate are two sectors in which we have very limited exposure, and they both detracted from performance.
We have high conviction in certain consumer discretionary stocks, as our focus is concentrated on market disruptors that have the potential to
drive rapid changes and growth via e-commerce. We are attracted to brick-and-mortar retailers that focus on strong management teams that have a sound strategy to grow their businesses in the challenging retail environment. Internet and direct marketing retailers Amazon.com and Netflix were strong absolute contributors. Amazon.com shares rose following a robust holiday season, better-than-expected retail revenue, and continued growth in its
Six-Month Period ended 4/30/18 Total Return
Global Stock Fund 7.71%
Global Stock Fund–Advisor Class 7.58
Global Stock Fund–I Class 7.78
MSCI All Country world Index 3.83
lipper Global Multi-Cap Growth Funds Average 4.79
PERFORMANCE COMPARISON
Proof #5
4
T. Rowe PRICe GlobAl SToCk Fund
cloud computing Amazon Web Services platform. A surge in domestic and international subscribers to Netflix, along with price hikes, propelled the Internet television network’s shares higher. Shares of travel and restaurant online reservation service Booking Holdings (formerly Priceline) produced solid returns following the company’s authorization of $8 billion in incremental share repurchases as a result of U.S. tax reform easing access to its large amount of offshore cash. Traditional retailers Tapestry (formerly Coach) and Ross Stores performed well. (Please refer to the portfolio of investments for a complete list of holdings and the amount each represents in the portfolio.)
While the health care sector has been relatively weak, our holdings added value as we focused on drug companies with innovative pipelines and companies with improving returns. Sage Therapeutics shares rose following positive trials for two drugs that treat depression, and Chugai Pharmaceuticals was a key contributor after announcing favorable news about a therapy for hemophilia.
Information technology stocks were significantly more volatile during the second half of the reporting period, but our holdings were among the best performers on a relative basis. We remain focused on companies that are capitalizing on the consumer and business shift toward greater connectivity, mobility, and the use of cloud software applications. Software providers Workday and Splunk were top contributors, along with social network Facebook.
Our detractors came from several sectors. Automobile and battery manufacturer Tesla did not perform well on an absolute basis. The stock pulled back due to a number of negative news items, including concerns about meeting production targets for the Model 3, and notable management departures that increased near-term uncertainty. Several of our information technology stocks under-performed. Optical laser equipment maker Lumentum Holdings, camera lens maker Largan Precision, and specialty laser manufacturer Coherent were among our biggest detractors. Foreign exchange headwinds and tax increases in Russia and Saudi Arabia sank shares for cigarette maker Philip Morris International.
Q: How is the fund positioned?
At the core of the fund’s approach is our belief that innovation is disrupting the global competitive landscape across multiple dimensions, including technology and consumer preferences. One of our key objectives is to position the fund on the right side of these changes. Examples of creative destruction include: (1) Internet in retail, media delivery, and advertising companies,
Proof #5
5
T. Rowe PRICe GlobAl SToCk Fund
which benefit from market disruption and rapid changes in consumer behavior and the accelerating trend toward e-commerce; and (2) health care companies with promising drugs and distribution pipelines.
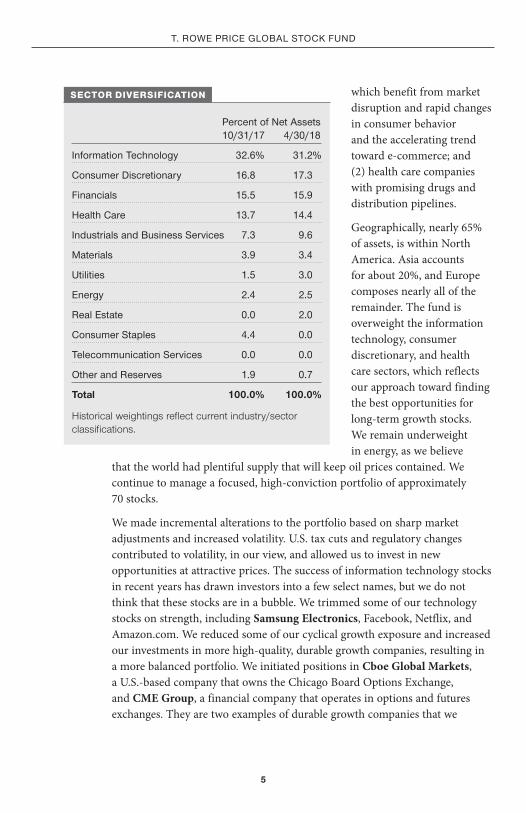
Geographically, nearly 65% of assets, is within North America. Asia accounts for about 20%, and Europe composes nearly all of the remainder. The fund is overweight the information technology, consumer discretionary, and health care sectors, which reflects our approach toward finding the best opportunities for long-term growth stocks. We remain underweight in energy, as we believe
that the world had plentiful supply that will keep oil prices contained. We continue to manage a focused, high-conviction portfolio of approximately 70 stocks.
We made incremental alterations to the portfolio based on sharp market adjustments and increased volatility. U.S. tax cuts and regulatory changes contributed to volatility, in our view, and allowed us to invest in new opportunities at attractive prices. The success of information technology stocks in recent years has drawn investors into a few select names, but we do not think that these stocks are in a bubble. We trimmed some of our technology stocks on strength, including Samsung Electronics, Facebook, Netflix, and Amazon.com. We reduced some of our cyclical growth exposure and increased our investments in more high-quality, durable growth companies, resulting in a more balanced portfolio. We initiated positions in Cboe Global Markets, a U.S.-based company that owns the Chicago Board Options Exchange, and CME Group, a financial company that operates in options and futures exchanges. They are two examples of durable growth companies that we
Percent of net Assets 10/31/17 4/30/18
Information Technology 32.6% 31.2%
Consumer discretionary 16.8 17.3
Financials 15.5 15.9
Health Care 13.7 14.4
Industrials and business Services 7.3 9.6
Materials 3.9 3.4
utilities 1.5 3.0
energy 2.4 2.5
Real estate 0.0 2.0
Consumer Staples 4.4 0.0
Telecommunication Services 0.0 0.0
other and Reserves 1.9 0.7
Total 100.0% 100.0%
Historical weightings reflect current industry/sector classifications.
SECTOR DIVERSIFICATION
Proof #5

6
T. Rowe PRICe GlobAl SToCk Fund
believe offer long-term opportunities. We are underweight industrials because we believe that many of these stocks are at their cyclical peaks and have extended valuations.
Q: What is portfolio management’s outlook?
Given the strong performance in many areas of the market, we are taking a more balanced approach to the growth opportunities that we see. While we remain confident in the long-term growth prospects for companies on the right side of change, we are cognizant that the bull market is more than nine years old now.
As volatility returns to the market, we are carefully monitoring our position sizes as an opportunity to refresh our portfolio toward more quality companies following high expectations around interest rate increases, tax cuts, and regulatory changes that drove markets higher. While we think there is a chance for more cyclical growth, we are taking into consideration that a low-growth world could persist, driven by a number of powerful deflationary forces that include an oversupply of oil, rising automation, and ballooning debt in the developed world. Additionally, we believe the Trump administration’s history of unpredictable proposals and policies regarding trade could result in ongoing spikes in market volatility.
Outside of the U.S., we see a coordinated economic upturn in Europe, Japan, and much of the emerging world that is earlier in its progress relative to the U.S. We are underweight Europe and Japan but remain modestly overweight emerging markets. While gross domestic product growth in China may ease from the prior year’s level, we do not foresee a rapid decline that would destabilize global markets. We believe that risks and opportunities are broadly balanced at this stage of the market cycle and that while volatility is likely to remain elevated, markets may continue to make progress from here with the support of corporate profit growth and a solid economic backdrop.
The views expressed reflect the opinions of T. Rowe Price as of the date of this report and are subject to change based on changes in market, economic, or other conditions. These views are not intended to be a forecast of future events and are no guarantee of future results.
Proof #5

7
T. Rowe PRICe GlobAl SToCk Fund
RISKS OF INTERNATIONAL INVESTING
Funds that invest overseas generally carry more risk than funds that invest strictly in U.S. assets. Funds investing in a single country or in a limited geographic region tend to be riskier than more diversified funds. Risks can result from varying stages of economic and political development; differing regulatory environments, trading days, and accounting standards; and higher transaction costs of non-U.S. markets. Non-U.S. investments are also subject to currency risk, or a decline in the value of a foreign currency versus the U.S. dollar, which reduces the dollar value of securities denominated in that currency.
BENCHMARK INFORMATION
Note: MSCI makes no express or implied warranties or representations and shall have no liability whatsoever with respect to any MSCI data contained herein. The MSCI data may not be further redistributed or used as a basis for other indices or any securities or financial products. This report is not approved, reviewed, or produced by MSCI.
Proof #5
8
T. Rowe PRICe GlobAl SToCk Fund
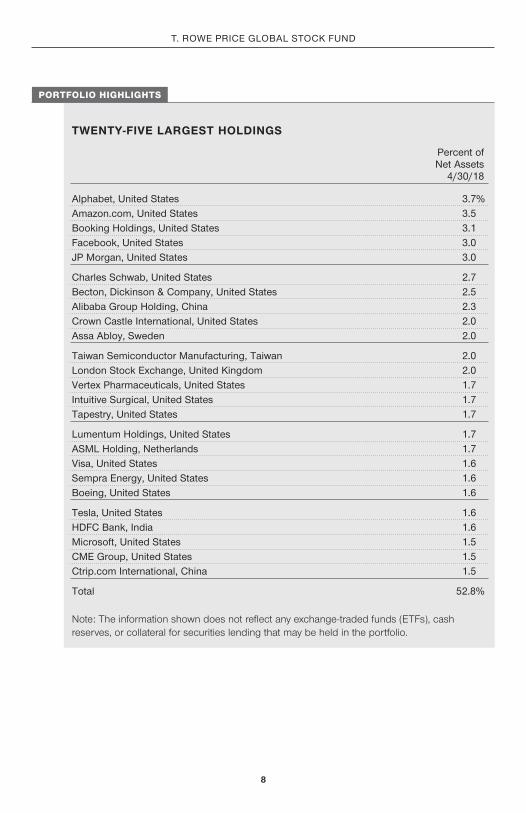
TWENTY-FIVE LARGEST HOLDINGS
Percent of net Assets 4/30/18
Alphabet, united States 3.7%Amazon.com, united States 3.5booking Holdings, united States 3.1Facebook, united States 3.0JP Morgan, united States 3.0
Charles Schwab, united States 2.7becton, dickinson & Company, united States 2.5Alibaba Group Holding, China 2.3Crown Castle International, united States 2.0Assa Abloy, Sweden 2.0
Taiwan Semiconductor Manufacturing, Taiwan 2.0london Stock exchange, united kingdom 2.0Vertex Pharmaceuticals, united States 1.7Intuitive Surgical, united States 1.7Tapestry, united States 1.7
lumentum Holdings, united States 1.7ASMl Holding, netherlands 1.7Visa, united States 1.6Sempra energy, united States 1.6boeing, united States 1.6
Tesla, united States 1.6HdFC bank, India 1.6Microsoft, united States 1.5CMe Group, united States 1.5Ctrip.com International, China 1.5
Total 52.8%
Note: The information shown does not reflect any exchange-traded funds (ETFs), cash reserves, or collateral for securities lending that may be held in the portfolio.
PORTFOLIO HIGHLIGHTS
Proof #5
9
T. Rowe PRICe GlobAl SToCk Fund
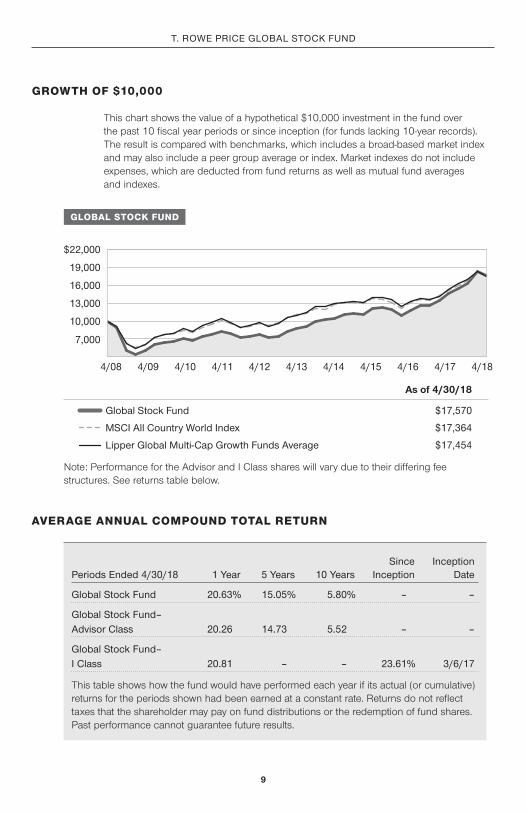
This chart shows the value of a hypothetical $10,000 investment in the fund over the past 10 fiscal year periods or since inception (for funds lacking 10-year records). The result is compared with benchmarks, which includes a broad-based market index and may also include a peer group average or index. Market indexes do not include expenses, which are deducted from fund returns as well as mutual fund averages and indexes.
Since InceptionPeriods ended 4/30/18 1 Year 5 Years 10 Years Inception date
Global Stock Fund 20.63% 15.05% 5.80% – –
Global Stock Fund– Advisor Class 20.26 14.73 5.52 – –
Global Stock Fund– I Class 20.81 – – 23.61% 3/6/17
This table shows how the fund would have performed each year if its actual (or cumulative) returns for the periods shown had been earned at a constant rate. Returns do not reflect taxes that the shareholder may pay on fund distributions or the redemption of fund shares. Past performance cannot guarantee future results.
AVERAGE ANNUAL COMPOUND TOTAL RETURN
GROWTH OF $10,000
10,000
7,000
13,000
16,000
19,000
$22,000
4/184/174/164/154/144/134/124/114/104/094/08
As of 4/30/18
$17,570
$17,364
$17,454
Global Stock Fund
MSCI All Country World Index
Lipper Global Multi-Cap Growth Funds Average
GLOBAL STOCK FUND
Note: Performance for the Advisor and I Class shares will vary due to their differing fee structures. See returns table below.
Proof #5

10
T. Rowe PRICe GlobAl SToCk Fund
Global Stock Fund 0.84%
Global Stock Fund–Advisor Class 1.15
Global Stock Fund–I Class 0.69
The expense ratio shown is as of the fund’s fiscal year ended 10/31/17. This number may vary from the expense ratio shown elsewhere in this report because it is based on a different time period and, if applicable, includes acquired fund fees and expenses but does not include fee or expense waivers.
EXPENSE RATIO
FUND EXPENSE EXAMPLE
As a mutual fund shareholder, you may incur two types of costs: (1) transaction costs, such as redemption fees or sales loads, and (2) ongoing costs, including management fees, distribution and service (12b-1) fees, and other fund expenses. The following example is intended to help you understand your ongoing costs (in dollars) of investing in the fund and to compare these costs with the ongoing costs of investing in other mutual funds. The example is based on an investment of $1,000 invested at the beginning of the most recent six-month period and held for the entire period.
Please note that the fund has three share classes: The original share class (Investor Class) charges no distribution and service (12b-1) fee, the Advisor Class shares are offered only through unaffiliated brokers and other financial intermediaries and charge a 0.25% 12b-1 fee, and I Class shares are available to institutionally oriented clients and impose no 12b-1 or administrative fee payment. Each share class is presented separately in the table.
Actual ExpensesThe first line of the following table (Actual) provides information about actual account values and expenses based on the fund’s actual returns. You may use the information on this line, together with your account balance, to estimate the expenses that you paid over the period. Simply divide your account value by $1,000 (for example, an $8,600 account value divided by $1,000 = 8.6), then multiply the result by the number on the first line under the heading “Expenses Paid During Period” to estimate the expenses you paid on your account during this period.
Hypothetical Example for Comparison PurposesThe information on the second line of the table (Hypothetical) is based on hypothetical account values and expenses derived from the fund’s actual expense ratio and an assumed 5% per year rate of return before expenses (not the fund’s actual return). You may compare the ongoing costs of investing in the fund with other funds by contrasting this 5% hypothetical example and the 5% hypothetical examples that appear in the shareholder reports of the other funds. The hypothetical account values and expenses may not be used to estimate the actual ending account balance or expenses you paid for the period.
Proof #5
11
T. Rowe PRICe GlobAl SToCk Fund
FUND EXPENSE EXAMPLE (CONTINUED)
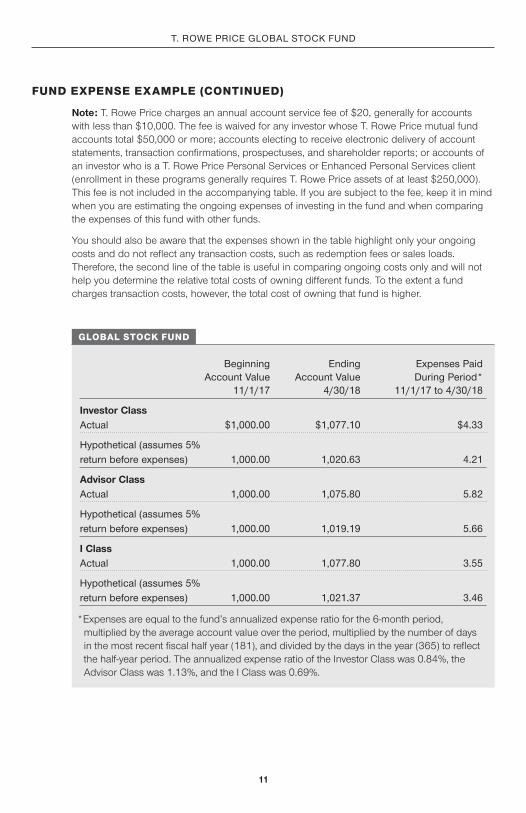
Note: T. Rowe Price charges an annual account service fee of $20, generally for accounts with less than $10,000. The fee is waived for any investor whose T. Rowe Price mutual fund accounts total $50,000 or more; accounts electing to receive electronic delivery of account statements, transaction confirmations, prospectuses, and shareholder reports; or accounts of an investor who is a T. Rowe Price Personal Services or Enhanced Personal Services client (enrollment in these programs generally requires T. Rowe Price assets of at least $250,000). This fee is not included in the accompanying table. If you are subject to the fee, keep it in mind when you are estimating the ongoing expenses of investing in the fund and when comparing the expenses of this fund with other funds.
You should also be aware that the expenses shown in the table highlight only your ongoing costs and do not reflect any transaction costs, such as redemption fees or sales loads. Therefore, the second line of the table is useful in comparing ongoing costs only and will not help you determine the relative total costs of owning different funds. To the extent a fund charges transaction costs, however, the total cost of owning that fund is higher.
beginning ending expenses Paid Account Value Account Value during Period* 11/1/17 4/30/18 11/1/17 to 4/30/18
Investor ClassActual $1,000.00 $1,077.10 $4.33
Hypothetical (assumes 5% return before expenses) 1,000.00 1,020.63 4.21
Advisor ClassActual 1,000.00 1,075.80 5.82
Hypothetical (assumes 5% return before expenses) 1,000.00 1,019.19 5.66
I ClassActual 1,000.00 1,077.80 3.55
Hypothetical (assumes 5% return before expenses) 1,000.00 1,021.37 3.46
* Expenses are equal to the fund’s annualized expense ratio for the 6-month period, multiplied by the average account value over the period, multiplied by the number of days in the most recent fiscal half year (181), and divided by the days in the year (365) to reflect the half-year period. The annualized expense ratio of the Investor Class was 0.84%, the Advisor Class was 1.13%, and the I Class was 0.69%.
GLOBAL STOCK FUND
Proof #5

12
T. Rowe PRICe GlobAl SToCk Fund
Since InceptionPeriods ended 3/31/18 1 Year 5 Years 10 Years Inception date
Global Stock Fund 26.11% 15.86% 6.80% – –
Global Stock Fund– Advisor Class 25.69 15.54 6.51 – –
Global Stock Fund– I Class 26.27 – – 26.80% 3/6/17
The fund’s performance information represents only past performance and is not necessarily an indication of future results. Current performance may be lower or higher than the perfor-mance data cited. Share price, principal value, and return will vary, and you may have a gain or loss when you sell your shares. For the most recent month-end performance, please visit our website (troweprice.com) or contact a T. Rowe Price representative at 1-800-225-5132 or, for Advisor and I Class shares, 1-800-638-8790. The performance information shown does not reflect the deduction of a 2% redemption fee on shares held for 90 days or less. If it did, the performance would be lower.This table provides returns through the most recent calendar quarter-end rather than through the end of the fund’s fiscal period. It shows how the fund would have performed each year if its actual (or cumulative) returns for the periods shown had been earned at a constant rate. Average annual total return figures include changes in principal value, reinvested dividends, and capital gain distributions. Returns do not reflect taxes that the shareholder may pay on fund distributions or the redemption of fund shares. When assessing performance, investors should consider both short- and long-term returns.
QUARTER-END RETURNS
Proof #5

13
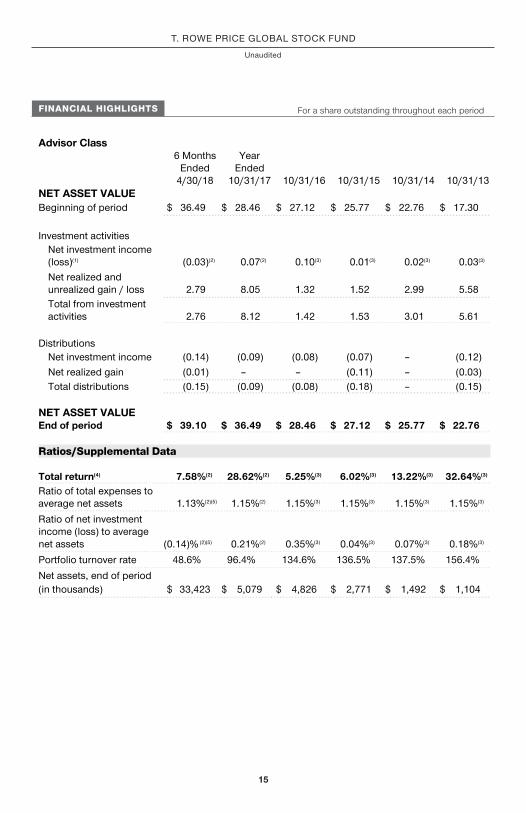
FINANCIAL HIGHLIGHTS For a share outstanding throughout each period
T. Rowe PRICe GlobAl SToCk Fund
unaudited
Investor Class
6 Months Ended
4/30/18
Year Ended
10/31/17 10/31/16 10/31/15 10/31/14 10/31/13 NET ASSET VALUE
Beginning of period $ 36.78 $ 28.68 $ 27.26 $ 25.84 $ 22.83 $ 17.33
Investment activities
Net investment income(1) 0.03(2) 0.16(2) 0.15 0.09 0.08 0.08
Net realized and unrealized gain / loss 2.80 8.12 1.36 1.51 3.00 5.59
Total from investment activities 2.83 8.28 1.51 1.60 3.08 5.67
Distributions
Net investment income (0.13) (0.18) (0.09) (0.07) (0.05) (0.14)
Net realized gain (0.01) – – (0.11) (0.02) (0.03)
Total distributions (0.14) (0.18) (0.09) (0.18) (0.07) (0.17)
NET ASSET VALUE
End of period $ 39.47 $ 36.78 $ 28.68 $ 27.26 $ 25.84 $ 22.83
Ratios/Supplemental Data
Total return(3) 7.71%(2) 29.04%(2) 5.55% 6.27% 13.52% 32.96%
Ratio of total expenses to average net assets 0.84%(2)(4) 0.84%(2) 0.89% 0.89% 0.89% 0.91%
Ratio of net investment income to average net assets 0.14%(2)(4) 0.48%(2) 0.56% 0.33% 0.32% 0.38%
Portfolio turnover rate 48.6% 96.4% 134.6% 136.5% 137.5% 156.4%
Net assets, end of period
(in thousands) $ 854,435 $ 834,130 $ 545,479 $ 517,763 $ 486,426 $ 505,621
Proof #5

14
FINANCIAL HIGHLIGHTS For a share outstanding throughout each period
The accompanying notes are an integral part of these financial statements.
T. Rowe PRICe GlobAl SToCk Fund
unaudited
(1) Per share amounts calculated using average shares outstanding method. (2) Excludes fund level expenses waived ratably across all classes in accordance with SEC rules. (3) Total return reflects the rate that an investor would have earned on an investment in the fund
during each period, assuming reinvestment of all distributions and payment of no redemption or account fees. Total return is not annualized for periods less than one year.
(4) Annualized
Proof #5
15
FINANCIAL HIGHLIGHTS For a share outstanding throughout each period
T. Rowe PRICe GlobAl SToCk Fund
unaudited
Advisor Class
6 Months Ended
4/30/18
Year Ended
10/31/17 10/31/16 10/31/15 10/31/14 10/31/13 NET ASSET VALUE
Beginning of period $ 36.49 $ 28.46 $ 27.12 $ 25.77 $ 22.76 $ 17.30
Investment activities
Net investment income (loss)(1) (0.03)(2) 0.07(2) 0.10(3) 0.01(3) 0.02(3) 0.03(3)
Net realized and unrealized gain / loss 2.79 8.05 1.32 1.52 2.99 5.58
Total from investment activities 2.76 8.12 1.42 1.53 3.01 5.61
Distributions
Net investment income (0.14) (0.09) (0.08) (0.07) – (0.12)
Net realized gain (0.01) – – (0.11) – (0.03)
Total distributions (0.15) (0.09) (0.08) (0.18) – (0.15)
NET ASSET VALUE
End of period $ 39.10 $ 36.49 $ 28.46 $ 27.12 $ 25.77 $ 22.76
Ratios/Supplemental Data
Total return(4) 7.58%(2) 28.62%(2) 5.25%(3) 6.02%(3) 13.22%(3) 32.64%(3)
Ratio of total expenses to average net assets 1.13%(2)(5) 1.15%(2) 1.15%(3) 1.15%(3) 1.15%(3) 1.15%(3)
Ratio of net investment income (loss) to average net assets (0.14)% (2)(5) 0.21%(2) 0.35%(3) 0.04%(3) 0.07%(3) 0.18%(3)
Portfolio turnover rate 48.6% 96.4% 134.6% 136.5% 137.5% 156.4%
Net assets, end of period
(in thousands) $ 33,423 $ 5,079 $ 4,826 $ 2,771 $ 1,492 $ 1,104
Proof #5
16
FINANCIAL HIGHLIGHTS For a share outstanding throughout each period
The accompanying notes are an integral part of these financial statements.
T. Rowe PRICe GlobAl SToCk Fund
unaudited
(1) Per share amounts calculated using average shares outstanding method. (2) Excludes fund level expenses waived ratably across all classes in accordance with SEC rules. (3) See Note 6. Excludes expenses in excess of a 1.15% contractual expense limitation in effect
through 2/28/19. (4) Total return reflects the rate that an investor would have earned on an investment in the fund
during each period, assuming reinvestment of all distributions and payment of no redemption or account fees. Total return is not annualized for periods less than one year.
(5) Annualized
Proof #5

17
FINANCIAL HIGHLIGHTS For a share outstanding throughout each period
T. Rowe PRICe GlobAl SToCk Fund
unaudited
I Class
6 Months Ended
4/30/18
3/6/17(1) Through 10/31/17
NET ASSET VALUE
Beginning of period $ 36.81 $ 31.09
Investment activities
Net investment income(2) 0.06(3) 0.16(3)
Net realized and unrealized gain / loss 2.80 5.56
Total from investment activities 2.86 5.72
Distributions
Net investment income (0.16) –
Net realized gain (0.01) –
Total distributions (0.17) –
NET ASSET VALUE
End of period $ 39.50 $ 36.81
Ratios/Supplemental Data
Total return(4) 7.78%(3) 18.40%(3)
Ratio of total expenses to average net assets 0.69%(3)(5) 0.69%(3)(5)
Ratio of net investment income to average net assets 0.29%(3)(5) 0.75%(3)(5)
Portfolio turnover rate 48.6% 96.4%
Net assets, end of period (in thousands) $ 191,832 $ 13,138
(1) Inception date (2) Per share amounts calculated using average shares outstanding method. (3) See Note 6. Excludes expenses in excess of a 0.05% contractual operating expense limitation in
effect through 2/28/19.
Proof #5
18
FINANCIAL HIGHLIGHTS For a share outstanding throughout each period
The accompanying notes are an integral part of these financial statements.
T. Rowe PRICe GlobAl SToCk Fund
unaudited
(4) Total return reflects the rate that an investor would have earned on an investment in the fund during each period, assuming reinvestment of all distributions and payment of no redemption or account fees. Total return is not annualized for periods less than one year.
(5) Annualized
Proof #5
T. Rowe PRICe GlobAl SToCk Fund
April 30, 2018 (Unaudited)
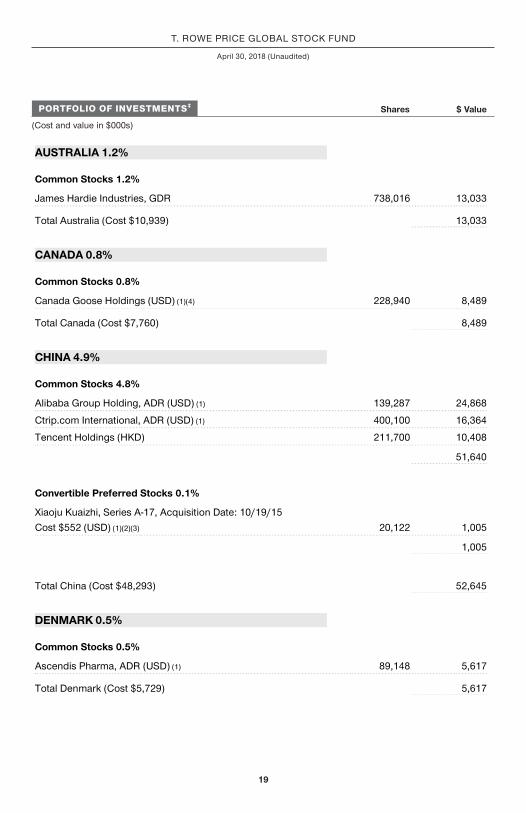
PORTFOLIO OF INVESTMENTS‡ Shares $ Value
(Cost and value in $000s)
19
AUSTRALIA 1.2%
Common Stocks 1.2%
James Hardie Industries, GDR 738,016 13,033
Total Australia (Cost $10,939) 13,033
CANADA 0.8%
Common Stocks 0.8%
Canada Goose Holdings (USD) (1)(4) 228,940 8,489
Total Canada (Cost $7,760) 8,489
CHINA 4.9%
Common Stocks 4.8%
Alibaba Group Holding, ADR (USD) (1) 139,287 24,868
Ctrip.com International, ADR (USD) (1) 400,100 16,364
Tencent Holdings (HKD) 211,700 10,408
51,640
Convertible Preferred Stocks 0.1%
Xiaoju Kuaizhi, Series A-17, Acquisition Date: 10/19/15 Cost $552 (USD) (1)(2)(3) 20,122 1,005
1,005
Total China (Cost $48,293) 52,645
DENMARK 0.5%
Common Stocks 0.5%
Ascendis Pharma, ADR (USD) (1) 89,148 5,617
Total Denmark (Cost $5,729) 5,617
Proof #5

T. Rowe PRICe GlobAl SToCk Fund
Shares $ Value
(Cost and value in $000s)
20
FRANCE 1.8%
Common Stocks 1.8%
Airbus 48,571 5,701
Total 226,406 14,230
Total France (Cost $16,385) 19,931
GERMANY 1.2%
Preferred Stocks 1.2%
Sartorius (5) 84,117 12,921
Total Germany (Cost $8,061) 12,921
INDIA 3.6%
Common Stocks 3.6%
Axis Bank 2,110,614 16,324
HDFC Bank 563,262 16,907
HDFC Standard Life Insurance 744,781 5,769
Total India (Cost $30,528) 39,000
INDONESIA 0.7%
Common Stocks 0.7%
Bank Central Asia 4,887,900 7,729
Total Indonesia (Cost $5,547) 7,729
ITALY 1.0%
Common Stocks 1.0%
Intesa Sanpaolo 2,769,677 10,536
Total Italy (Cost $7,469) 10,536
Proof #5

T. Rowe PRICe GlobAl SToCk Fund
Shares $ Value
(Cost and value in $000s)
21
JAPAN 7.2%
Common Stocks 7.2%
Asics 579,000 10,941
Chugai Pharmaceutical 300,800 15,864
Keyence 12,000 7,317
Nintendo 25,900 10,883
Persol Holdings 422,000 10,031
Recruit Holdings 562,900 12,979
Sumitomo Metal Mining 218,900 9,338
Total Japan (Cost $57,579) 77,353
NETHERLANDS 1.7%
Common Stocks 1.7%
ASML Holding (4) 95,120 18,109
Total Netherlands (Cost $13,968) 18,109
SINGAPORE 0.1%
Common Stocks 0.0%
Flipkart Private Limited, Acquisition Date: 3/19/15 Cost $93 (USD) (1)(2)(3) 819 102
102
Preferred Stocks 0.1%
Flipkart Private Limited, Series A, Acquisition Date: 3/19/15 Cost $32 (USD) (1)(2)(3) 280 35
Flipkart Private Limited, Series C, Acquisition Date: 3/19/15 Cost $56 (USD) (1)(2)(3) 493 62
Proof #5

T. Rowe PRICe GlobAl SToCk Fund
Shares $ Value
(Cost and value in $000s)
22
Flipkart Private Limited, Series E, Acquisition Date: 3/19/15 Cost $105 (USD) (1)(2)(3) 917 114
Flipkart Private Limited, Series G, Acquisition Date: 12/17/14 Cost $627 (USD) (1)(2)(3) 5,235 888
1,099
Total Singapore (Cost $913) 1,201
SPAIN 0.9%
Common Stocks 0.9%
Grifols, ADR (USD) 478,621 9,726
Total Spain (Cost $7,420) 9,726
SWEDEN 3.2%
Common Stocks 3.2%
Assa Abloy, B Shares 1,038,480 21,763
Hexagon, B Shares 224,630 12,970
Total Sweden (Cost $29,948) 34,733
SWITZERLAND 0.7%
Common Stocks 0.7%
Ams 94,495 7,794
Total Switzerland (Cost $7,250) 7,794
TAIWAN 3.2%
Common Stocks 3.2%
Largan Precision 115,000 13,375
Taiwan Semiconductor Manufacturing 2,800,000 21,329
Total Taiwan (Cost $38,635) 34,704
Proof #5

T. Rowe PRICe GlobAl SToCk Fund
Shares $ Value
(Cost and value in $000s)
23
UNITED ARAB EMIRATES 0.6%
Common Stocks 0.6%
DP World (USD) 280,931 6,237
Total United Arab Emirates (Cost $5,112) 6,237
UNITED KINGDOM 2.7%
Common Stocks 2.7%
IQE (1) 5,614,088 8,018
London Stock Exchange 357,807 21,142
Total United Kingdom (Cost $28,997) 29,160
UNITED STATES 63.3%
Common Stocks 63.3%
Alaska Air Group 164,600 10,687
Allegion 104,800 8,088
Alphabet, Class A (1) 38,890 39,613
Amazon.com (1) 24,282 38,029
Becton Dickinson & Company 115,089 26,686
Bluebird Bio (1) 46,263 7,872
Boeing 52,100 17,378
Booking Holdings (1) 15,569 33,909
Cboe Global Markets 65,600 7,005
Charles Schwab 533,017 29,678
CME Group 104,200 16,430
Coherent (1) 39,643 6,669
Crown Castle International, REIT 215,900 21,778
DocuSign (1) 5,493 212
EOG Resources 112,700 13,318
Exact Sciences (1) 155,872 7,795
Facebook, Class A (1) 190,818 32,821
Illumina (1) 64,670 15,581
Proof #5

T. Rowe PRICe GlobAl SToCk Fund
Shares $ Value
(Cost and value in $000s)
24
Intuitive Surgical (1) 42,700 18,821
JPMorgan Chase 296,200 32,221
Lumentum Holdings (1)(4) 370,939 18,714
MarketAxess Holdings 38,449 7,637
Maxim Integrated Products 110,800 6,039
Microsoft 176,500 16,506
Middleby (1)(4) 88,983 11,198
Netflix (1) 44,551 13,920
NextEra Energy 95,000 15,571
Nike, Class B 231,900 15,860
NVIDIA 27,200 6,117
PayPal Holdings (1) 144,765 10,801
Prothena (1)(4) 4,523 54
Ross Stores 136,665 11,049
SAGE Therapeutics (1) 105,928 15,245
Salesforce.com (1) 134,166 16,233
Sempra Energy 156,268 17,471
Splunk (1) 58,990 6,055
Tapestry 349,380 18,786
Tesla (1)(4) 57,669 16,949
Texas Instruments 130,208 13,207
Vertex Pharmaceuticals (1) 123,327 18,889
Visa, Class A 138,100 17,522
Vulcan Materials 126,230 14,099
Workday (1) 87,789 10,960
Total United States (Cost $587,281) 683,473
Proof #5

T. Rowe PRICe GlobAl SToCk Fund
Shares $ Value
(Cost and value in $000s)
25
SHORT-TERM INVESTMENTS 1.0%
Money Market Funds 1.0%
T. Rowe Price Government Reserve Fund, 1.72% (6)(7) 10,660,678 10,661
Total Short-Term Investments (Cost $10,661) 10,661
SECURITIES LENDING COLLATERAL 3.4%
Investments in a Pooled Account through Securities Lending Program with JPMorgan Chase Bank 3.4%
Short-Term Funds 3.4%
T. Rowe Price Short-Term Fund, 1.95% (6)(7) 3,696,714 36,967
Total Investments through Securities Lending Program
with JPMorgan Chase Bank 36,967
Total Securities Lending Collateral (Cost $36,967) 36,967
Total Investments in Securities
103.7% of Net Assets (Cost $965,442) $ 1,120,019
‡
Country classifications are generally based on MSCI categories or another unaffiliated third party data provider; Shares are denominated in the currency of the country presented unless otherwise noted.
(1) Non-income producing (2)
Security cannot be offered for public resale without first being registered under the Securities Act of 1933 and related rules ("restricted security"). Acquisition date represents the day on which an enforceable right to acquire such security is obtained and is presented along with related cost in the security description. The fund has registration rights for certain restricted securities. Any costs related to such registration are borne by the issuer. The aggregate value of restricted securities (excluding 144A holdings) at period-end amounts to $2,206 and represents 0.2% of net assets.
(3) Level 3 in fair value hierarchy. See Note 2. (4)
All or a portion of this security is on loan at April 30, 2018 -- total value of such securities at period-end amounts to $35,592. See Note 3.
(5)
Preferred stocks are shares that carry certain preferential rights. The dividend rate may not be consistent each pay period and could be zero for a particular year.
(6) Seven-day yield (7) Affiliated Company
Proof #5

T. Rowe PRICe GlobAl SToCk Fund
26
ADR American Depositary Receipts GDR Global Depositary Receipts HKD Hong Kong Dollar REIT
A domestic Real Estate Investment Trust whose distributions pass-through with original tax character to the shareholder
USD U.S. Dollar
Proof #5
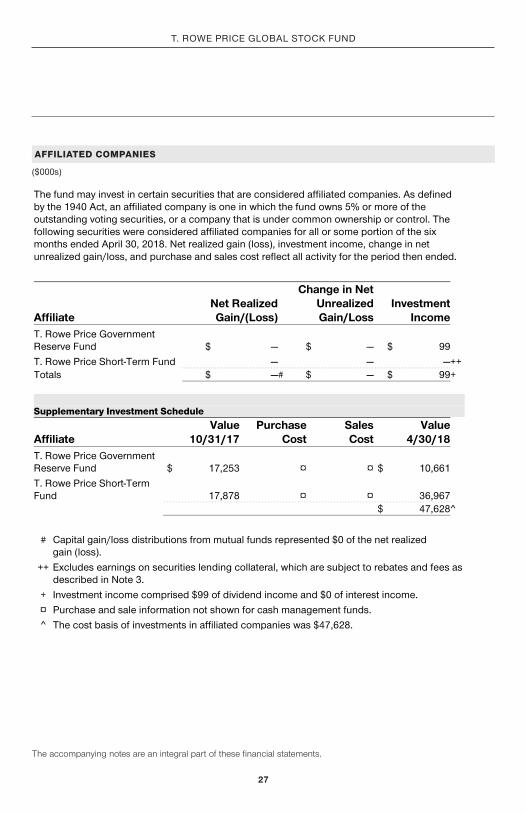
AFFILIATED COMPANIES
($000s)
T. Rowe PRICe GlobAl SToCk Fund
27
The accompanying notes are an integral part of these financial statements.
The fund may invest in certain securities that are considered affiliated companies. As defined by the 1940 Act, an affiliated company is one in which the fund owns 5% or more of the outstanding voting securities, or a company that is under common ownership or control. The following securities were considered affiliated companies for all or some portion of the six months ended April 30, 2018. Net realized gain (loss), investment income, change in net unrealized gain/loss, and purchase and sales cost reflect all activity for the period then ended.
Affiliate
Net RealizedGain/(Loss)
Change in NetUnrealizedGain/Loss
InvestmentIncome
T. Rowe Price Government Reserve Fund $ — $ — $ 99 T. Rowe Price Short-Term Fund — — —++ Totals $ —# $ — $ 99+ Supplementary Investment Schedule Affiliate
Value10/31/17
PurchaseCost
SalesCost
Value4/30/18
T. Rowe Price Government Reserve Fund $ 17,253 ¤ ¤ $ 10,661 T. Rowe Price Short-Term Fund 17,878 ¤ ¤ 36,967 $ 47,628^
# Capital gain/loss distributions from mutual funds represented $0 of the net realized
gain (loss). ++ Excludes earnings on securities lending collateral, which are subject to rebates and fees as
described in Note 3. + Investment income comprised $99 of dividend income and $0 of interest income. ¤ Purchase and sale information not shown for cash management funds. ^ The cost basis of investments in affiliated companies was $47,628.
Proof #5

T. Rowe PRICe GlobAl SToCk Fund
April 30, 2018 (Unaudited)
($000s, except shares and per share amounts)
STATEMENT OF ASSETS AND LIABILITIES
28
Assets
Investments in securities, at value (cost $965,442) $ 1,120,019
Receivable for investment securities sold 10,052
Receivable for shares sold 2,227
Dividends receivable 917
Cash 39
Other assets 2,625
Total assets 1,135,879
Liabilities
Obligation to return securities lending collateral 36,967
Payable for investment securities purchased 15,422
Payable for shares redeemed 624
Investment management fees payable 565
Due to affiliates 46
Other liabilities 2,565
Total liabilities 56,189
NET ASSETS $ 1,079,690 Net Assets Consist of:
Overdistributed net investment income $ (299)
Accumulated undistributed net realized gain 24,181
Net unrealized gain 154,565
Paid-in capital applicable to 27,361,437 shares of $0.01 par value capital stock outstanding; 18,000,000,000 shares of the Corporation authorized 901,243
NET ASSETS $ 1,079,690
Proof #5
T. Rowe PRICe GlobAl SToCk Fund
April 30, 2018 (Unaudited)
The accompanying notes are an integral part of these financial statements.
($000s, except shares and per share amounts)
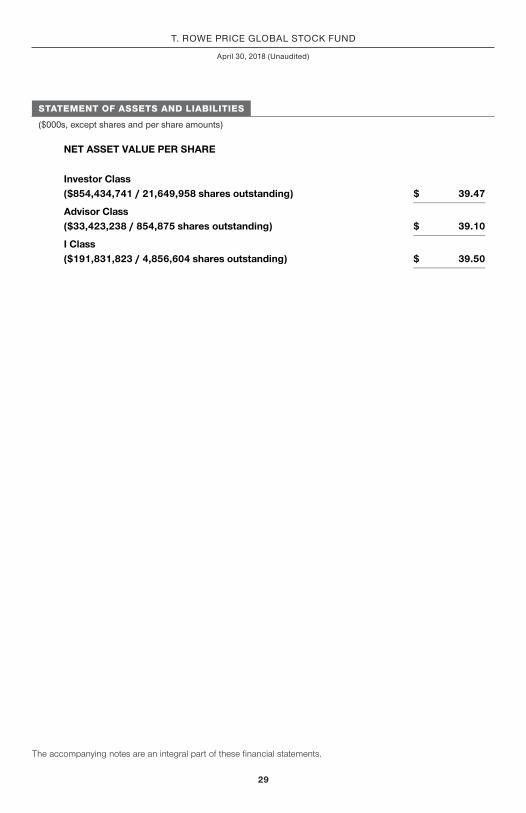
STATEMENT OF ASSETS AND LIABILITIES
29
NET ASSET VALUE PER SHARE Investor Class ($854,434,741 / 21,649,958 shares outstanding) $ 39.47
Advisor Class ($33,423,238 / 854,875 shares outstanding) $ 39.10
I Class ($191,831,823 / 4,856,604 shares outstanding) $ 39.50
Proof #5
T. Rowe PRICe GlobAl SToCk Fund
($000s)
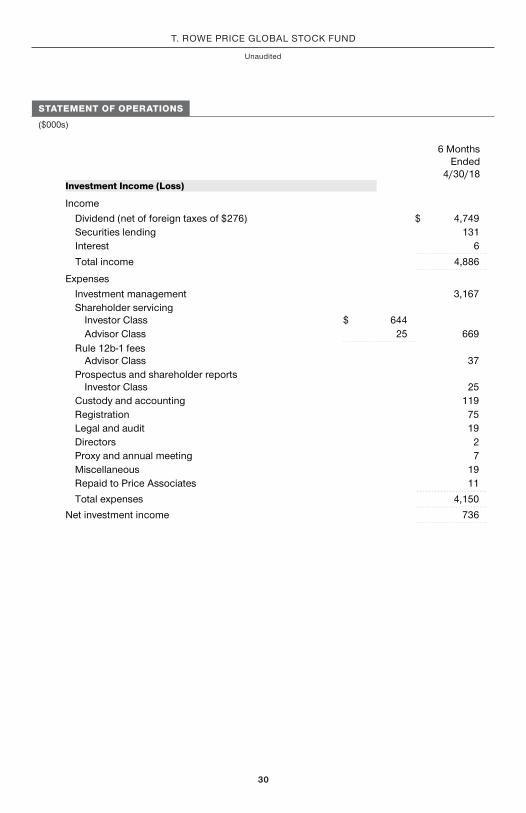
STATEMENT OF OPERATIONS
30
Unaudited
6 Months Ended
4/30/18Investment Income (Loss)
Income Dividend (net of foreign taxes of $276) $ 4,749 Securities lending 131 Interest 6
Total income 4,886
Expenses Investment management 3,167 Shareholder servicing
Investor Class $ 644 Advisor Class 25 669
Rule 12b-1 fees Advisor Class 37
Prospectus and shareholder reports Investor Class 25
Custody and accounting 119 Registration 75 Legal and audit 19 Directors 2 Proxy and annual meeting 7 Miscellaneous 19 Repaid to Price Associates 11
Total expenses 4,150
Net investment income 736
Proof #5
T. Rowe PRICe GlobAl SToCk Fund
($000s)
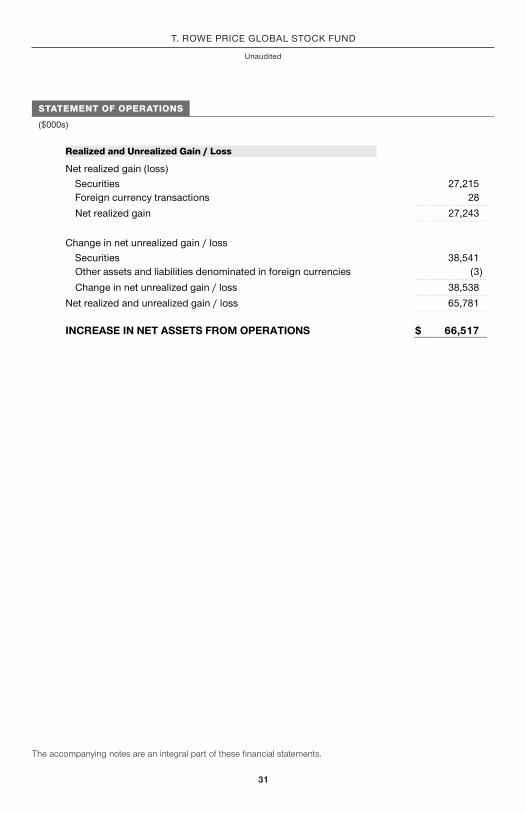
STATEMENT OF OPERATIONS
The accompanying notes are an integral part of these financial statements.
31
Unaudited
Realized and Unrealized Gain / Loss
Net realized gain (loss) Securities 27,215 Foreign currency transactions 28
Net realized gain 27,243 Change in net unrealized gain / loss
Securities 38,541 Other assets and liabilities denominated in foreign currencies (3)
Change in net unrealized gain / loss 38,538
Net realized and unrealized gain / loss 65,781 INCREASE IN NET ASSETS FROM OPERATIONS $ 66,517
Proof #5

T. Rowe PRICe GlobAl SToCk Fund
($000s)
STATEMENT OF CHANGES IN NET ASSETS
32
Unaudited
6 MonthsEnded
4/30/18
Year Ended
10/31/17Increase (Decrease) in Net Assets
Operations Net investment income $ 736 $ 3,227 Net realized gain 27,243 75,046 Change in net unrealized gain / loss 38,538 93,478 Increase in net assets from operations 66,517 171,751
Distributions to shareholders
Net investment income Investor Class (2,972) (3,456) Advisor Class (116) (15) I Class (71) –
Net realized gain Investor Class (229) – Advisor Class (8) – I Class (5) –
Decrease in net assets from distributions (3,401) (3,471) Capital share transactions*
Shares sold Investor Class 170,991 209,596 Advisor Class 32,313 3,168 I Class 186,551 12,069
Distributions reinvested Investor Class 3,064 3,286 Advisor Class 124 15 I Class 66 –
Shares redeemed Investor Class (216,383) (89,284) Advisor Class (5,809) (4,249) I Class (6,797) (910)
Proof #5
T. Rowe PRICe GlobAl SToCk Fund
The accompanying notes are an integral part of these financial statements.
($000s)
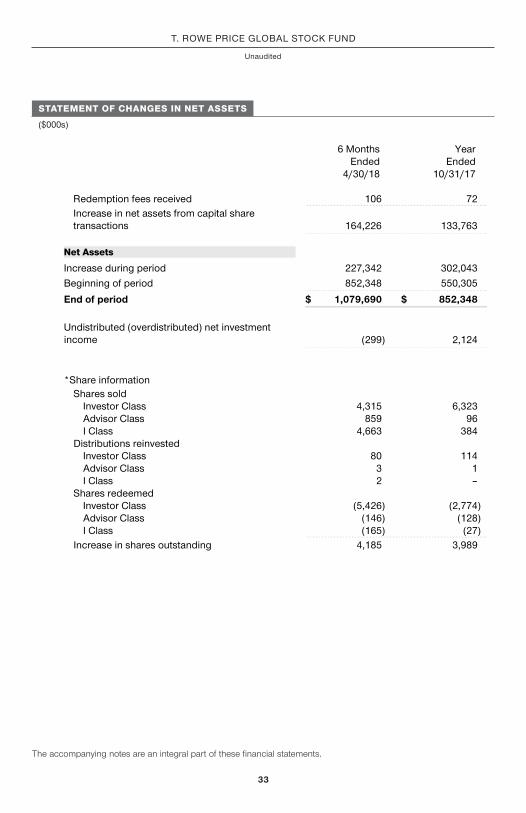
STATEMENT OF CHANGES IN NET ASSETS
33
Unaudited
6 MonthsEnded
4/30/18
Year Ended
10/31/17 Redemption fees received 106 72 Increase in net assets from capital share transactions 164,226 133,763
Net Assets
Increase during period 227,342 302,043 Beginning of period 852,348 550,305
End of period $ 1,079,690 $ 852,348 Undistributed (overdistributed) net investment income (299) 2,124 *Share information
Shares sold Investor Class 4,315 6,323 Advisor Class 859 96 I Class 4,663 384
Distributions reinvested Investor Class 80 114 Advisor Class 3 1 I Class 2 –
Shares redeemed Investor Class (5,426) (2,774) Advisor Class (146) (128) I Class (165) (27)
Increase in shares outstanding 4,185 3,989
Proof #5

T. Rowe PRICe GlobAl SToCk Fund
NOTES TO FINANCIAL STATEMENTS
34
Unaudited
T. Rowe Price International Funds, Inc. (the corporation) is registered under the Investment Company Act of 1940 (the 1940 Act). The T. Rowe Price Global Stock Fund (the fund) is a diversified, open-end management investment company established by the corporation. The fund seeks long-term growth of capital through investments primarily in the common stocks of established companies throughout the world, including the U.S. The fund has three classes of shares: the Global Stock Fund (Investor Class), the Global Stock Fund–Advisor Class (Advisor Class), and the Global Stock Fund–I Class (I Class). Advisor Class shares are sold only through unaffiliated brokers and other unaffiliated financial intermediaries. I Class shares generally are available only to investors meeting a $1,000,000 minimum investment or certain other criteria. The Advisor Class operates under a Board-approved Rule 12b-1 plan pursuant to which the class compensates financial intermediaries for distribution, shareholder servicing, and/or certain administrative services; the Investor and I Classes do not pay Rule 12b-1 fees. Each class has exclusive voting rights on matters related solely to that class; separate voting rights on matters that relate to all classes; and, in all other respects, the same rights and obligations as the other classes.
NOTE 1 - SIGNIFICANT ACCOUNTING POLICIES
Basis of Preparation The fund is an investment company and follows accounting and reporting guidance in the Financial Accounting Standards Board (FASB) Accounting Standards Codification Topic 946 (ASC 946). The accompanying financial statements were prepared in accordance with accounting principles generally accepted in the United States of America (GAAP), including, but not limited to, ASC 946. GAAP requires the use of estimates made by management. Management believes that estimates and valuations are appropriate; however, actual results may differ from those estimates, and the valuations reflected in the accompanying financial statements may differ from the value ultimately realized upon sale or maturity.
Investment Transactions, Investment Income, and Distributions Investment transactions are accounted for on the trade date basis. Income and expenses are recorded on the accrual basis. Realized gains and losses are reported on the identified cost basis. Dividends received from mutual fund investments are reflected as dividend income; capital gain distributions are reflected as realized gain/loss. Dividend income and capital gain distributions are recorded on the ex-dividend date. Income tax-related interest and penalties, if incurred, are recorded as income tax expense. Distributions from REITs are initially recorded as dividend income and, to the extent such represent a return of
Proof #5

T. Rowe PRICe GlobAl SToCk Fund
35
capital or capital gain for tax purposes, are reclassified when such information becomes available. Income distributions are declared and paid by each class annually. Distributions to shareholders are recorded on the ex-dividend date. A capital gain distribution may also be declared and paid by the fund annually.
Currency Translation Assets, including investments, and liabilities denominated in foreign currencies are translated into U.S. dollar values each day at the prevailing exchange rate, using the mean of the bid and asked prices of such currencies against U.S. dollars as quoted by a major bank. Purchases and sales of securities, income, and expenses are translated into U.S. dollars at the prevailing exchange rate on the respective date of such transaction. The portion of the results of operations attributable to changes in foreign exchange rates on investments is not bifurcated from the portion attributable to changes in market prices. The effect of changes in foreign currency exchange rates on realized and unrealized security gains and losses is reflected as a component of security gains and losses.
Class Accounting Shareholder servicing, prospectus, and shareholder report expenses incurred by each class are charged directly to the class to which they relate. Expenses common to all classes, investment income, and realized and unrealized gains and losses are allocated to the classes based upon the relative daily net assets of each class. To the extent any expenses are waived or reimbursed in accordance with an expense limitation (see Note 6), the waiver or reimbursement is charged to the applicable class or allocated across the classes in the same manner as the related expense. The Advisor Class pays Rule 12b-1 fees, in an amount not exceeding 0.25% of the class’s average daily net assets.
Redemption Fees A 2% fee is assessed on redemptions of fund shares held for 90 days or less to deter short-term trading and to protect the interests of long-term shareholders. Redemption fees are withheld from proceeds that shareholders receive from the sale or exchange of fund shares. The fees are paid to the fund and are recorded as an increase to paid-in capital. The fees may cause the redemption price per share to differ from the net asset value per share.
New Accounting Guidance In March 2017, the FASB issued amended guidance to shorten the amortization period for certain callable debt securities held at a premium. The guidance is effective for fiscal years and interim periods beginning after December 15, 2018. Adoption will have no effect on the fund’s net assets or results of operations.
Indemnification In the normal course of business, the fund may provide indemnification in connection with its officers and directors, service providers, and/or private company investments. The fund’s maximum exposure under these arrangements is unknown; however, the risk of material loss is currently considered to be remote.
Proof #5
T. Rowe PRICe GlobAl SToCk Fund
36
NOTE 2 - VALUATION
The fund’s financial instruments are valued and each class’s net asset value (NAV) per share is computed at the close of the New York Stock Exchange (NYSE), normally 4 p.m. ET, each day the NYSE is open for business. However, the NAV per share may be calculated at a time other than the normal close of the NYSE if trading on the NYSE is restricted, if the NYSE closes earlier, or as may be permitted by the SEC.
Fair Value The fund’s financial instruments are reported at fair value, which GAAP defines as the price that would be received to sell an asset or paid to transfer a liability in an orderly transaction between market participants at the measurement date. The T. Rowe Price Valuation Committee (the Valuation Committee) is an internal committee that has been delegated certain responsibilities by the fund’s Board of Directors (the Board) to ensure that financial instruments are appropriately priced at fair value in accordance with GAAP and the 1940 Act. Subject to oversight by the Board, the Valuation Committee develops and oversees pricing-related policies and procedures and approves all fair value determinations. Specifically, the Valuation Committee establishes procedures to value securities; determines pricing techniques, sources, and persons eligible to effect fair value pricing actions; oversees the selection, services, and performance of pricing vendors; oversees valuation-related business continuity practices; and provides guidance on internal controls and valuation-related matters. The Valuation Committee reports to the Board and has representation from legal, portfolio management and trading, operations, risk management, and the fund’s treasurer.
Various valuation techniques and inputs are used to determine the fair value of financial instruments. GAAP establishes the following fair value hierarchy that categorizes the inputs used to measure fair value:
Level 1 – quoted prices (unadjusted) in active markets for identical financial instruments that the fund can access at the reporting date
Level 2 – inputs other than Level 1 quoted prices that are observable, either directly or indirectly (including, but not limited to, quoted prices for similar financial instruments in active markets, quoted prices for identical or similar financial instruments in inactive markets, interest rates and yield curves, implied volatilities, and credit spreads)
Level 3 – unobservable inputs
Observable inputs are developed using market data, such as publicly available information about actual events or transactions, and reflect the assumptions that market participants would use to price the financial instrument. Unobservable inputs are those for which market data are not available and are developed using the best information
Proof #5

T. Rowe PRICe GlobAl SToCk Fund
37
available about the assumptions that market participants would use to price the financial instrument. GAAP requires valuation techniques to maximize the use of relevant observable inputs and minimize the use of unobservable inputs. When multiple inputs are used to derive fair value, the financial instrument is assigned to the level within the fair value hierarchy based on the lowest-level input that is significant to the fair value of the financial instrument. Input levels are not necessarily an indication of the risk or liquidity associated with financial instruments at that level but rather the degree of judgment used in determining those values.
Valuation Techniques Equity securities listed or regularly traded on a securities exchange or in the over-the-counter (OTC) market are valued at the last quoted sale price or, for certain markets, the official closing price at the time the valuations are made. OTC Bulletin Board securities are valued at the mean of the closing bid and asked prices. A security that is listed or traded on more than one exchange is valued at the quotation on the exchange determined to be the primary market for such security. Listed securities not traded on a particular day are valued at the mean of the closing bid and asked prices for domestic securities and the last quoted sale or closing price for international securities.
For valuation purposes, the last quoted prices of non-U.S. equity securities may be adjusted to reflect the fair value of such securities at the close of the NYSE. If the fund determines that developments between the close of a foreign market and the close of the NYSE will affect the value of some or all of its portfolio securities, the fund will adjust the previous quoted prices to reflect what it believes to be the fair value of the securities as of the close of the NYSE. In deciding whether it is necessary to adjust quoted prices to reflect fair value, the fund reviews a variety of factors, including developments in foreign markets, the performance of U.S. securities markets, and the performance of instruments trading in U.S. markets that represent foreign securities and baskets of foreign securities. The fund may also fair value securities in other situations, such as when a particular foreign market is closed but the fund is open. The fund uses outside pricing services to provide it with quoted prices and information to evaluate or adjust those prices. The fund cannot predict how often it will use quoted prices and how often it will determine it necessary to adjust those prices to reflect fair value. As a means of evaluating its security valuation process, the fund routinely compares quoted prices, the next day’s opening prices in the same markets, and adjusted prices.
Actively traded equity securities listed on a domestic exchange generally are categorized in Level 1 of the fair value hierarchy. Non-U.S. equity securities generally are categorized in Level 2 of the fair value hierarchy despite the availability of quoted prices because, as described above, the fund evaluates and determines whether those quoted prices reflect fair value at the close of the NYSE or require adjustment. OTC Bulletin Board securities, certain preferred securities, and equity securities traded in inactive markets generally are categorized in Level 2 of the fair value hierarchy.
Proof #5
T. Rowe PRICe GlobAl SToCk Fund
38
Investments in mutual funds are valued at the mutual fund’s closing NAV per share on the day of valuation and are categorized in Level 1 of the fair value hierarchy. Assets and liabilities other than financial instruments, including short-term receivables and payables, are carried at cost, or estimated realizable value, if less, which approximates fair value.
Thinly traded financial instruments and those for which the above valuation procedures are inappropriate or are deemed not to reflect fair value are stated at fair value as determined in good faith by the Valuation Committee. The objective of any fair value pricing determination is to arrive at a price that could reasonably be expected from a current sale. Financial instruments fair valued by the Valuation Committee are primarily private placements, restricted securities, warrants, rights, and other securities that are not publicly traded.
Subject to oversight by the Board, the Valuation Committee regularly makes good faith judgments to establish and adjust the fair valuations of certain securities as events occur and circumstances warrant. For instance, in determining the fair value of an equity investment with limited market activity, such as a private placement or a thinly traded public company stock, the Valuation Committee considers a variety of factors, which may include, but are not limited to, the issuer’s business prospects, its financial standing and performance, recent investment transactions in the issuer, new rounds of financing, negotiated transactions of significant size between other investors in the company, relevant market valuations of peer companies, strategic events affecting the company, market liquidity for the issuer, and general economic conditions and events. In consultation with the investment and pricing teams, the Valuation Committee will determine an appropriate valuation technique based on available information, which may include both observable and unobservable inputs. The Valuation Committee typically will afford greatest weight to actual prices in arm’s length transactions, to the extent they represent orderly transactions between market participants, transaction information can be reliably obtained, and prices are deemed representative of fair value. However, the Valuation Committee may also consider other valuation methods such as market-based valuation multiples; a discount or premium from market value of a similar, freely traded security of the same issuer; or some combination. Fair value determinations are reviewed on a regular basis and updated as information becomes available, including actual purchase and sale transactions of the issue. Because any fair value determination involves a significant amount of judgment, there is a degree of subjectivity inherent in such pricing decisions, and fair value prices determined by the Valuation Committee could differ from those of other market participants. Depending on the relative significance of unobservable inputs, including the valuation technique(s) used, fair valued securities may be categorized in Level 2 or 3 of the fair value hierarchy.
Proof #5

T. Rowe PRICe GlobAl SToCk Fund
39
Valuation Inputs The following table summarizes the fund’s financial instruments, based on the inputs used to determine their fair values on April 30, 2018:
($000s) Level 1 Level 2 Level 3 Total Value
Quoted Prices
Significant Observable
Inputs
Significant Unobservable
Inputs
Assets
Investments in Securities, except: $ 754,933 $ – $ – $ 754,933
Australia – 13,033 – 13,033
China 41,232 10,408 1,005 52,645
France – 19,931 – 19,931
Germany – 12,921 – 12,921
India – 39,000 – 39,000
Indonesia – 7,729 – 7,729
Italy – 10,536 – 10,536
Japan – 77,353 – 77,353
netherlands – 18,109 – 18,109
Singapore – – 1,201 1,201
Sweden – 34,733 – 34,733
Switzerland – 7,794 – 7,794
Taiwan – 34,704 – 34,704
united Arab emirates – 6,237 – 6,237
united kingdom – 29,160 – 29,160
Total $ 796,165 $ 321,648 $ 2,206 $ 1,120,019
There were no material transfers between Levels 1 and 2 during the six months ended April 30, 2018.
Proof #5

T. Rowe PRICe GlobAl SToCk Fund
40
Following is a reconciliation of the fund’s Level 3 holdings for the six months ended April 30, 2018. Gain (loss) reflects both realized and change in unrealized gain/loss on Level 3 holdings during the period, if any, and is included on the accompanying Statement of Operations. The change in unrealized gain/loss on Level 3 instruments held at April 30, 2018, totaled $328,000 for the six months ended April 30, 2018.
($000s) Beginning Balance11/1/17
Gain (Loss) DuringPeriod
TotalSales
Ending Balance4/30/18
Investments in Securities
Common Stocks $ 86 $ 30 $ (14) $ 102
Preferred Stocks 927 318 (146) 1,099
Convertible Preferred Stocks 1,025 (20) – 1,005
Total level 3 $ 2,038 $ 328 $ (160) $ 2,206
NOTE 3 - OTHER INVESTMENT TRANSACTIONS
Consistent with its investment objective, the fund engages in the following practices to manage exposure to certain risks and/or to enhance performance. The investment objective, policies, program, and risk factors of the fund are described more fully in the fund’s prospectus and Statement of Additional Information.
Emerging Markets The fund may invest, either directly or through investments in T. Rowe Price institutional funds, in securities of companies located in, issued by governments of, or denominated in or linked to the currencies of emerging market countries; at period-end, approximately 13% of the fund’s net assets were invested in emerging markets. Emerging markets generally have economic structures that are less diverse and mature, and political systems that are less stable, than developed countries. These markets may be subject to greater political, economic, and social uncertainty and differing regulatory environments that may potentially impact the fund’s ability to buy or sell certain securities or repatriate proceeds to U.S. dollars. Such securities are often subject to greater price volatility, less liquidity, and higher rates of inflation than U.S. securities.
Restricted Securities The fund may invest in securities that are subject to legal or contractual restrictions on resale. Prompt sale of such securities at an acceptable price may be difficult and may involve substantial delays and additional costs.
Proof #5
T. Rowe PRICe GlobAl SToCk Fund
41
Securities Lending The fund may lend its securities to approved borrowers to earn additional income. Its securities lending activities are administered by a lending agent in accordance with a securities lending agreement. Security loans generally do not have stated maturity dates, and the fund may recall a security at any time. The fund receives collateral in the form of cash or U.S. government securities, valued at 102% to 105% of the value of the securities on loan. Collateral is maintained over the life of the loan in an amount not less than the value of loaned securities; any additional collateral required due to changes in security values is delivered to the fund the next business day. Cash collateral is invested in accordance with investment guidelines approved by fund management. Additionally, the lending agent indemnifies the fund against losses resulting from borrower default. Although risk is mitigated by the collateral and indemnification, the fund could experience a delay in recovering its securities and a possible loss of income or value if the borrower fails to return the securities, collateral investments decline in value, and the lending agent fails to perform. Securities lending revenue consists of earnings on invested collateral and borrowing fees, net of any rebates to the borrower, compensation to the lending agent, and other administrative costs. In accordance with GAAP, investments made with cash collateral are reflected in the accompanying financial statements, but collateral received in the form of securities is not. At April 30, 2018, the value of loaned securities was $35,592,000, including securities sold but not yet settled, which are not reflected in the accompanying Portfolio of Investments; the value of cash collateral and related investments was $36,967,000.
Other Purchases and sales of portfolio securities other than short-term securities aggregated $641,380,000 and $476,863,000, respectively, for the six months ended April 30, 2018.
NOTE 4 - FEDERAL INCOME TAXES
No provision for federal income taxes is required since the fund intends to continue to qualify as a regulated investment company under Subchapter M of the Internal Revenue Code and distribute to shareholders all of its taxable income and gains. Distributions determined in accordance with federal income tax regulations may differ in amount or character from net investment income and realized gains for financial reporting purposes. Financial reporting records are adjusted for permanent book/tax differences to reflect tax character but are not adjusted for temporary differences. The amount and character of tax-basis distributions and composition of net assets are finalized at fiscal year-end; accordingly, tax-basis balances have not been determined as of the date of this report.
Proof #5

T. Rowe PRICe GlobAl SToCk Fund
42
At April 30, 2018, the cost of investments for federal income tax purposes was $965,442,000. Net unrealized gain aggregated $154,566,000 at period-end, of which $172,942,000 related to appreciated investments and $18,376,000 related to depreciated investments.
NOTE 5 - FOREIGN TAXES
The fund is subject to foreign income taxes imposed by certain countries in which it invests. Additionally, certain foreign currency transactions are subject to tax, and capital gains realized upon disposition of securities issued in or by certain foreign countries are subject to capital gains tax imposed by those countries. All taxes are computed in accordance with the applicable foreign tax law, and, to the extent permitted, capital losses are used to offset capital gains. Taxes attributable to income are accrued by the fund as a reduction of income. Taxes incurred on the purchase of foreign currencies are recorded as realized loss on foreign currency transactions. Current and deferred tax expense attributable to capital gains is reflected as a component of realized or change in unrealized gain/loss on securities in the accompanying financial statements. At April 30, 2018, the fund had no deferred tax liability attributable to foreign securities and $4,916,000 of foreign capital loss carryforwards, including $1,637,000 that expire in 2019, $821,000 that expire in 2020, $8,000 that expire in 2021, $2,158,000 that expire in 2022, and $292,000 that expire in 2024.
NOTE 6 - RELATED PARTY TRANSACTIONS
The fund is managed by T. Rowe Price Associates, Inc. (Price Associates), a wholly owned subsidiary of T. Rowe Price Group, Inc. (Price Group). Price Associates has entered into a sub-advisory agreement(s) with one or more of its wholly owned subsidiaries, to provide investment advisory services to the fund. The investment management agreement between the fund and Price Associates provides for an annual investment management fee, which is computed daily and paid monthly. The fee consists of an individual fund fee, equal to 0.35% of the fund’s average daily net assets, and a group fee. The group fee rate is calculated based on the combined net assets of certain mutual funds sponsored by Price Associates (the group) applied to a graduated fee schedule, with rates ranging from 0.48% for the first $1 billion of assets to 0.265% for assets in excess of $650 billion. The fund’s group fee is determined by applying the group fee rate to the fund’s average daily net assets. At April 30, 2018, the effective annual group fee rate was 0.29%.
Proof #5

T. Rowe PRICe GlobAl SToCk Fund
43
The Advisor Class is subject to a contractual expense limitation through February 29, 2020. During the limitation period, Price Associates is required to waive its management fee or pay any expenses (excluding interest, expenses related to borrowings, taxes, brokerage, and other non-recurring expenses permitted by the investment management agreement) that would otherwise cause the class’s ratio of annualized total expenses to average net assets (expense ratio) to exceed its expense limitation of 1.15%. The class is required to repay Price Associates for expenses previously waived/paid to the extent the class’s net assets grow or expenses decline sufficiently to allow repayment without causing the class’s expense ratio (after the repayment is taken into account) to exceed both: (1) the expense limitation in place at the time such amounts were waived; and (2) the class’s current expense limitation. However, no repayment will be made more than three years after the date of a payment or waiver or, in any case, later than February 29, 2020.
The I Class is also subject to an operating expense limitation (I Class limit) pursuant to which Price Associates is contractually required to pay all operating expenses of the I Class, excluding management fees, interest, expenses related to borrowings, taxes, brokerage, and other non-recurring expenses permitted by the investment management agreement, to the extent such operating expenses, on an annualized basis, exceed 0.05% of average net assets. This agreement will continue until February 28, 2019, and may be renewed, revised, or revoked only with approval of the fund’s Board. The I Class is required to repay Price Associates for expenses previously paid to the extent the class’s net assets grow or expenses decline sufficiently to allow repayment without causing the class’s operating expenses (after the repayment is taken into account) to exceed both: (1) the expense limitation in place at the time such amounts were paid; and (2) the class’s current expense limitation. However, no repayment will be made more than three years after the date of a payment or waiver.
Pursuant to these agreements, $11,000 of expenses were repaid to Price Associates during the six months ended April 30, 2018. Including this amount, expenses previously waived/paid by Price Associates in the amount of $5,000 remain subject to repayment by the fund at April 30, 2018.
In addition, the fund has entered into service agreements with Price Associates and two wholly owned subsidiaries of Price Associates, each an affiliate of the fund (collectively, Price). Price Associates provides certain accounting and administrative services to the fund. T. Rowe Price Services, Inc. provides shareholder and administrative services in its capacity as the fund’s transfer and dividend-disbursing agent. T. Rowe Price Retirement Plan Services, Inc. provides subaccounting and recordkeeping services for certain
Proof #5

T. Rowe PRICe GlobAl SToCk Fund
44
retirement accounts invested in the Investor Class and I Class. For the six months ended April 30, 2018, expenses incurred pursuant to these service agreements were $46,000 for Price Associates; $226,000 for T. Rowe Price Services, Inc.; and $55,000 for T. Rowe Price Retirement Plan Services, Inc. The total amount payable at period-end pursuant to these service agreements is reflected as Due to Affiliates on the accompanying Statement of Assets and Liabilities.
The fund may invest its cash reserves in certain open-end management investment companies managed by Price Associates and considered affiliates of the fund: the T. Rowe Price Government Reserve Fund or the T. Rowe Price Treasury Reserve Fund, organized as money market funds, or the T. Rowe Price Short-Term Fund, a short-term bond fund (collectively, the Price Reserve Funds). The Price Reserve Funds are offered as short-term investment options to mutual funds, trusts, and other accounts managed by Price Associates or its affiliates and are not available for direct purchase by members of the public. Cash collateral from securities lending is invested in the T. Rowe Price Short-Term Fund. The Price Reserve Funds pay no investment management fees.
The fund may participate in securities purchase and sale transactions with other funds or accounts advised by Price Associates (cross trades), in accordance with procedures adopted by the fund’s Board and Securities and Exchange Commission rules, which require, among other things, that such purchase and sale cross trades be effected at the independent current market price of the security. During the six months ended April 30, 2018, the aggregate value of purchases and sales cross trades with other funds or accounts advised by Price Associates was less than 1% of the fund’s net assets as of April 30, 2018.
Proof #5

45
T. Rowe PRICe GlobAl SToCk Fund
INFORMATION ON PROXY VOTING POLICIES, PROCEDURES, AND RECORDS
A description of the policies and procedures used by T. Rowe Price funds and portfolios to determine how to vote proxies relating to portfolio securities is available in each fund’s Statement of Additional Information. You may request this document by calling 1-800-225-5132 or by accessing the SEC’s website, sec.gov.
The description of our proxy voting policies and procedures is also available on our corporate website. To access it, please visit the following Web page:
https://www3.troweprice.com/usis/corporate/en/utility/policies.html
Scroll down to the section near the bottom of the page that says, “Proxy Voting Policies.” Click on the Proxy Voting Policies link in the shaded box.
HOW TO OBTAIN QUARTERLY PORTFOLIO HOLDINGS
The fund files a complete schedule of portfolio holdings with the Securities and Exchange Commission for the first and third quarters of each fiscal year on Form N-Q. The fund’s Form N-Q is available electronically on the SEC’s website (sec.gov); hard copies may be reviewed and copied at the SEC’s Public Reference Room, 100 F St. N.E., Washington, DC 20549. For more information on the Public Reference Room, call 1-800-SEC-0330.
Proof #5
46
T. Rowe PRICe GlobAl SToCk Fund
APPROVAL OF INVESTMENT MANAGEMENT AGREEMENT AND SUBADVISORY AGREEMENT
Each year, the fund’s Board of Directors (Board) considers the continuation of the investment management agreement (Advisory Contract) between the fund and its investment advisor, T. Rowe Price Associates, Inc. (Advisor), as well as the continuation of the investment subadvisory agreement (Subadvisory Contract) that the Advisor has entered into with T. Rowe Price Hong Kong Limited (Subadvisor) on behalf of the fund. In that regard, at an in-person meeting held on March 5–6, 2018 (Meeting), the Board, including a majority of the fund’s independent directors, approved the continuation of the fund’s Advisory Contract and Subadvisory Contract. At the Meeting, the Board considered the factors and reached the conclusions described below relating to the selection of the Advisor and Subadvisor and the approval of the Advisory Contract and Subadvisory Contract. The independent directors were assisted in their evaluation of the Advisory Contract and Subadvisory Contract by independent legal counsel from whom they received separate legal advice and with whom they met separately.
In providing information to the Board, the Advisor was guided by a detailed set of requests for information submitted by independent legal counsel on behalf of the independent directors. In considering and approving the Advisory Contract and Subadvisory Contract, the Board considered the information it believed was relevant, including, but not limited to, the information discussed below. The Board considered not only the specific information presented in connection with the Meeting but also the knowledge gained over time through interaction with the Advisor and Subadvisor about various topics. The Board meets regularly and, at each of its meetings, covers an extensive agenda of topics and materials and considers factors that are relevant to its annual consideration of the renewal of the T. Rowe Price funds’ advisory contracts, including performance and the services and support provided to the funds and their shareholders.
Services Provided by the Advisor and SubadvisorThe Board considered the nature, quality, and extent of the services provided to the fund by the Advisor and Subadvisor. These services included, but were not limited to, directing the fund’s investments in accordance with its investment program and the overall management of the fund’s portfolio, as well as a variety of related activities such as financial, investment operations, and administrative services; compliance; maintaining the fund’s records and registrations; and shareholder communications. The Board also reviewed the background and experience of the Advisor’s and Subadvisor’s senior management teams and investment personnel involved in the management of the fund, as well as the Advisor’s compliance record. The Board concluded that it was satisfied with the nature, quality, and extent of the services provided by the Advisor and Subadvisor.
Proof #5

47
T. Rowe PRICe GlobAl SToCk Fund
APPROVAL OF INVESTMENT MANAGEMENT AGREEMENT AND SUBADVISORY AGREEMENT (CONTINUED)
Investment Performance of the FundThe Board took into account discussions with the Advisor and reports that it receives throughout the year relating to fund performance. In connection with the Meeting, the Board reviewed the fund’s net annualized total returns for the 1-, 2-, 3-, 4-, 5-, and 10-year periods as of September 30, 2017, and compared these returns with the performance of a peer group of funds with similar investment programs and a wide variety of other previously agreed-upon comparable performance measures and market data, including those supplied by Broadridge, which is an independent provider of mutual fund data.
On the basis of this evaluation and the Board’s ongoing review of investment results, and factoring in the relative market conditions during certain of the performance periods, the Board concluded that the fund’s performance was satisfactory.
Costs, Benefits, Profits, and Economies of ScaleThe Board reviewed detailed information regarding the revenues received by the Advisor under the Advisory Contract and other benefits that the Advisor (and its affiliates, including the Subadvisor) may have realized from its relationship with the fund, including any research received under “soft dollar” agreements and commission-sharing arrangements with broker-dealers. The Board considered that the Advisor and Subadvisor may receive some benefit from soft-dollar arrangements pursuant to which research is received from broker-dealers that execute the fund’s portfolio transactions. The Board received information on the estimated costs incurred and profits realized by the Advisor from managing the T. Rowe Price funds. The Board also reviewed estimates of the profits realized from managing the fund in particular, and the Board concluded that the Advisor’s profits were reasonable in light of the services provided to the fund.
The Board also considered whether the fund benefits under the fee levels set forth in the Advisory Contract from any economies of scale realized by the Advisor. Under the Advisory Contract, the fund pays a fee to the Advisor for investment management services composed of two components—a group fee rate based on the combined average net assets of most of the T. Rowe Price funds (including the fund) that declines at certain asset levels and an individual fund fee rate based on the fund’s average daily net assets—and the fund pays its own expenses of operations (subject to contractual expense limitations agreed to by the Advisor with respect to the Advisor Class and I Class). Under the Subadvisory Contract, the Advisor may pay the Subadvisor up to 60% of the advisory fee that the Advisor receives from the fund. The Board concluded that the advisory fee structure for the fund continued to provide for a reasonable sharing of benefits from any economies of scale with the fund’s investors.
Proof #5

48
T. Rowe PRICe GlobAl SToCk Fund
APPROVAL OF INVESTMENT MANAGEMENT AGREEMENT AND SUBADVISORY AGREEMENT (CONTINUED)
Fees and ExpensesThe Board was provided with information regarding industry trends in management fees and expenses. Among other things, the Board reviewed data for peer groups that were compiled by Broadridge, which compared: (i) contractual management fees, total expenses, actual management fees, and nonmanagement expenses of the Investor Class of the fund with a group of competitor funds selected by Broadridge (Investor Class Expense Group); (ii) total expenses and actual management fees of the Advisor Class of the fund with a group of competitor funds selected by Broadridge (Advisor Class Expense Group); and (iii) total expenses, actual management fees, and nonmanagement expenses of the Investor Class of the fund with a broader set of funds within the Lipper investment classification (Expense Universe). The Board considered the fund’s contractual management fee rate, actual management fee rate (which reflects the management fees actually received from the fund by the Advisor after any applicable waivers, reductions, or reimbursements), operating expenses, and total expenses (which reflects the net total expense ratio of the fund after any waivers, reductions, or reimbursements) in comparison with the information for the Broadridge peer groups. Broadridge generally constructed the peer groups by seeking the most comparable funds based on similar investment classifications and objectives, expense structure, asset size, and operating components and attributes and ranked funds into quintiles, with the first quintile representing the funds with the lowest relative expenses and the fifth quintile representing the funds with the highest relative expenses. The information provided to the Board indicated that the fund’s contractual management fee ranked in the first quintile (Investor Class Expense Group), the fund’s actual management fee rate ranked in the first quintile (Investor Class Expense Group and Advisor Class Expense Group) and second quintile (Expense Universe), and the fund’s total expenses ranked in the first quintile (Investor Class Expense Group, Advisor Class Expense Group, and Expense Universe).
The Board also reviewed the fee schedules for institutional accounts and private accounts with similar mandates that are advised or subadvised by the Advisor and its affiliates. Management provided the Board with information about the Advisor’s responsibilities and services provided to subadvisory and other institutional account clients, including information about how the requirements and economics of the institutional business are fundamentally different from those of the mutual fund business. The Board considered information showing that the Advisor’s mutual fund business is generally more complex from a business and compliance perspective than its institutional account business and considered various relevant factors, such as the broader scope of operations and oversight, more extensive shareholder communication infrastructure, greater asset flows, heightened business risks, and differences in applicable laws and regulations associated with the Advisor’s proprietary mutual fund business. In assessing the reasonableness
Proof #5

49
T. Rowe PRICe GlobAl SToCk Fund
of the fund’s management fee rate, the Board considered the differences in the nature of the services required for the Advisor to manage its mutual fund business versus managing a discrete pool of assets as a subadvisor to another institution’s mutual fund or for an institutional account, and that the Advisor generally performs significant additional services and assumes greater risk in managing the fund and other T. Rowe Price funds than it does for institutional account clients.
On the basis of the information provided and the factors considered, the Board concluded that the fees paid by the fund under the Advisory Contract are reasonable.
Approval of the Advisory Contract and Subadvisory ContractAs noted, the Board approved the continuation of the Advisory Contract and Subadvisory Contract. No single factor was considered in isolation or to be determinative to the decision. Rather, the Board concluded, in light of a weighting and balancing of all factors considered, that it was in the best interests of the fund and its shareholders for the Board to approve the continuation of the Advisory Contract and Subadvisory Contract (including the fees to be charged for services thereunder).
APPROVAL OF INVESTMENT MANAGEMENT AGREEMENT AND SUBADVISORY AGREEMENT (CONTINUED)
Proof #5

This page intentionally left blank.
Proof #5

This page intentionally left blank.
Proof #5

This page intentionally left blank.
Proof #5

This page intentionally left blank.
Proof #5
201806-488680F113-051 6/18 T. Rowe Price Investment Services, Inc. | 100 East Pratt Street | Baltimore, MD 21202-1009
STOCK FUNDSDomestic Blue Chip GrowthCapital Appreciation‡
Capital OpportunityCommunications & TechnologyDiversified Mid-Cap GrowthDividend GrowthEquity IncomeEquity Index 500Extended Equity Market IndexFinancial ServicesGrowth & IncomeGrowth StockHealth SciencesMid-Cap Growth‡
Mid-Cap Value‡
New America GrowthNew EraNew Horizons‡
QM U.S. Small & Mid-Cap Core Equity
QM U.S. Small-Cap Growth EquityQM U.S. Value EquityReal EstateScience & TechnologySmall-Cap Stock‡
Small-Cap ValueTax-Efficient Equity Total Equity Market IndexU.S. Large-Cap CoreValue
ASSET ALLOCATION FUNDSBalanced Global AllocationMulti-Strategy Total ReturnPersonal Strategy BalancedPersonal Strategy GrowthPersonal Strategy IncomeReal AssetsSpectrum GrowthSpectrum IncomeSpectrum InternationalTarget Date Fundsˆ
BOND FUNDSDomestic TaxableCorporate IncomeCredit OpportunitiesFloating RateGNMA High Yield‡
Inflation Protected BondLimited Duration Inflation
Focused BondNew IncomeShort-Term BondTotal ReturnUltra Short-Term BondU.S. Bond Enhanced IndexU.S. High YieldU.S. Treasury IntermediateU.S. Treasury Long-Term
Domestic Tax-FreeCalifornia Tax-Free BondGeorgia Tax-Free BondIntermediate Tax-Free High YieldMaryland Short-Term Tax-Free BondMaryland Tax-Free BondNew Jersey Tax-Free BondNew York Tax-Free BondSummit Municipal IncomeSummit Municipal IntermediateTax-Free High YieldTax-Free IncomeTax-Free Short-IntermediateVirginia Tax-Free Bond
MONEY MARKET FUNDSTaxableCash Reserves1
Government Money2
U.S. Treasury Money2
MONEY MARKET FUNDS (cont.)Tax-FreeCalifornia Tax-Free Money1
Maryland Tax-Free Money1
New York Tax-Free Money1
Summit Municipal Money Market1
Tax-Exempt Money1
INTERNATIONAL/GLOBAL FUNDSStockAfrica & Middle EastAsia OpportunitiesEmerging EuropeEmerging Markets StockEmerging Markets Value StockEuropean Stock Global ConsumerGlobal Growth StockGlobal IndustrialsGlobal Real EstateGlobal StockGlobal Technology‡
International Concentrated EquityInternational Discovery‡
International Equity IndexInternational StockInternational Value EquityJapanLatin AmericaNew AsiaOverseas StockQM Global Equity
BondDynamic Global BondEmerging Markets BondEmerging Markets Corporate BondEmerging Markets Local Currency
BondGlobal High Income BondGlobal Multi-Sector BondInternational BondInternational Bond (USD Hedged)
T. Rowe Price Mutual Funds This page contains supplementary information that is not part of the shareholder report.
Call 1-800-225-5132 to request a prospectus or summary prospectus; each includes investment objectives, risks, fees, expenses, and other information that you should read and consider carefully before investing.
‡ Subject to certain exceptions, the fund is currently closed to new investors and new accounts.ˆ The Target Date Funds are inclusive of the Retirement Funds, the Target Funds, and the Retirement Balanced Fund.1 Retail Funds: You could lose money by investing in the Fund. Although the Fund seeks to preserve the value of your
investment at $1.00 per share, it cannot guarantee it will do so. Beginning October 14, 2016, the Fund may impose a fee upon the sale of your shares or may temporarily suspend your ability to sell shares if the Fund’s liquidity falls below required minimums because of market conditions or other factors. An investment in the Fund is not insured or guaranteed by the Federal Deposit Insurance Corporation or any other government agency. The Fund’s sponsor has no legal obligation to provide financial support to the Fund, and you should not expect that the sponsor will provide financial support to the Fund at any time.
2 Government Funds: You could lose money by investing in the Fund. Although the Fund seeks to preserve the value of your investment at $1.00 per share, it cannot guarantee it will do so. An investment in the Fund is not insured or guaranteed by the Federal Deposit Insurance Corporation or any other government agency. The Fund’s sponsor has no legal obligation to provide financial support to the Fund, and you should not expect that the sponsor will provide financial support to the Fund at any time.
Proof #5