price stability report, september 2009 · figure 1.1: maastricht price stability criterion figure...
TRANSCRIPT

SEPTEMBER 2009

BANKA SLOVENIJE
2 PRICE STABILITY REPORT
Published by:
BANK OF SLOVENIA
Slovenska 35 1505 Ljubljana
Phone: 01 47 19 000 Fax: 01 25 15 516
This publication is based on figures and information available on 3 September 2009, except where stated otherwise.
This publication is also available in Slovene.
ISSN 1855-1424

BANKA SLOVENIJE
PRICE STABILITY REPORT 3
Table of contents
Summary 9
1 Recent Price Developments 13
2 International Environment and Projection Assumptions 19
3 Economic Trends and the Labour Market 27
4 External Balance and Competitiveness 43
5 Financing Conditions 51
6 Price Projections and Risks 59

BANKA SLOVENIJE
4 PRICE STABILITY REPORT
Figures, tables and boxes
Figures: Figure 1.1: Maastricht price stability criterion Figure 1.2: Headline inflation Figure 1.3: Core inflation Figure 1.4: Range of estimates of the output gap in Slovenia Figure 1.5: Individual price categories Figure 1.6: Food prices in Slovenia and the euro area Figure 1.7: Prices of services in Slovenia and the euro area Figure 1.8: Prices of non-energy industrial goods Figure 1.9: Industrial producer prices on the domestic market Figure 1.10: Industrial producer prices on the domestic market for the US and the euro area Figure 2.1: Business confidence in Slovenia and abroad Figure 2.2: Prices on world commodity markets Figure 2.3: EUR/USD exchange rate and central bank interest rates Figure 3.1: Domestic demand and GDP Figure 3.2: GDP growth projections Figure 3.3: Industrial production Figure 3.4: Contributions to GDP growth by components of spending Figure 3.5: Contributions to year-on-year GDP growth by components Figure 3.6: Seasonally adjusted confidence indicators Figure 3.7: Household consumption and disposable income Figure 3.8: Profit indicator Figure 3.9: Workforce in employment and registered unemployment Figure 3.10: Labour market Figure 3.11: Contributions to employment growth by sector Figure 3.12: Job vacancies and actual employment Figure 3.13: Registered and harmonised unemployment rate Figure 3.14: Contributions to growth in labour costs per employee Figure 3.15: Unit labour costs Figure 3.16: Nominal gross wages Figure 4.1: Current account projections Figure 4.2: Export orders Figure 4.3: Terms of trade Figure 4.4: Harmonised national competitiveness indicators (for 41 countries and 15 euro area countries) Figure 4.5: Competitiveness indicators Figure 4.6: Harmonised price competitiveness indicators (for 41 countries and 15 euro area countries) Figure 4.7: Harmonised competitiveness indicator Figure 5.1: Savings-investment gap Figure 5.2: Financial liabilities to the rest of the world Figure 5.3: Financial claims against the rest of the world Figure 5.4: External debt Figure 5.5: Lending to the domestic private sector Figure 5.6: Interest rates on loans of more than EUR 1 million to non-financial corporations Figure 5.7: Breakdown of household lending Figure 5.8: Interest rates on household deposits of up to 1 year Figure 5.9: Interest rates on consumer loans to households Figure 5.10: Interest rates on housing loans to households Figure 6.1: Inflation projections Figure 6.2: Contributions of components to inflation Figure 6.3: HICP and core inflation
13 13 14 14 16 16 17 17 18 18 21 22 23 28 28 29 29 30 33 33 34 35 35 35 36 37 39 39 40 43 44 45 47 48 48 49 51 54 54 55 56 56 57 57 58 58 59 60 60

BANKA SLOVENIJE
PRICE STABILITY REPORT 5
Tables: Table 1.1: Structure of the HICP and price indicators Table 2.1: Assumptions regarding factors from the international environment Table 3.1: Activity, employment and wages Table 3.2: GDP and components of demand in Slovenia and the rest of the world Table 3.3: Components of domestic demand Table 3.4: Labour cost indicators Table 4.1: Current account Table 6.1: Inflation Table 6.2: Assumed direct effects on inflation of government measures in 2009
15 19 27 28 29 38 43 59 61
Boxes: Box 2.1: Revisions to forecasts of economic activity in the rest of the world for 2009 and 2010 Box 2.2: Monetary policy: continuation of existing and introduction of new non-standard measures after January 2009 Box 3.1: Government measures and the impact of state (fiscal) measures on projections Box 5.1: Risks and uncertainties on financial markets Box 6.1: Medium-term public finance objectives and ageing of the population Box 6.2: Comparison of 2009 and 2010 forecasts with those of other institutions
20 24 31 52 62 65

BANKA SLOVENIJE
6 PRICE STABILITY REPORT
Abbreviations used in the Price Stability Report
AJPES Agency of the Republic of Slovenia for Public Legal Records and Related Services CDS credit default swap CPI consumer price index DARS Motorway Company in the Republic of Slovenia EC European Commission ECB European Central Bank EIB European Investment Bank EIPF Faculty of Law Economic Institute EMU Economic and Monetary Union EONIA Euro OverNight Index Average ERM II European Exchange Rate Mechanism ESA95 European System of Accounts (1995) ESCB European System of Central Banks EU European Union EUR euro EURIBOR euro interbank offered rate Eurostat Statistical Office of the European Communities Fed Federal Reserve GDP gross domestic product HICP harmonised index of consumer prices ILO International Labour Organisation IMAD Institute of Macroeconomic Analysis and Development of the Republic of Slovenia IMF International Monetary Fund iTraxx Crossover indicator of the movement of the credit risk swap premium for companies LTRO long-term refinancing operation MoF Ministry of Finance of the Republic of Slovenia MRO main refinancing operations OECD Organisation for Economic Cooperation and Development OIS Overnight Indexed Swap OPEC Organisation of Petroleum-Exporting Countries PSR Price Stability Report SORS Statistical Office of the Republic of Slovenia ULC unit labour costs USD US dollar

BANKA SLOVENIJE
PRICE STABILITY REPORT 7

BANKA SLOVENIJE
8 PRICE STABILITY REPORT

BANKA SLOVENIJE
PRICE STABILITY REPORT 9
The sharp fall in GDP in the final quarter of last year and the first quarter of this year indicates a recession of extraordinary proportions for Slovenian economy. The contraction in economic activity in 2009 will stand at between 6% and 7%, and will most likely also be seen in a notable break in the trend of potential output. The greatest risks from the March forecasts have materialised. The assumed drop in foreign demand in the March projections, based on available estimates at that time, was around 6.5%. However, foreign demand was down 11.5% in year-on-year terms in the first half of 2009. Therefore, the latest projections assume a fall of nearly 12% in foreign demand. Accordingly, investment, the movement in which was assessed as the highest risk among the components of domestic spending in the previous projections, has declined sharply. The sharp drop in gross investment is mainly the result of a decline in inventories, which was significantly higher than forecast in the pre-vious projections and contributed nearly one-half to the decline in GDP growth in the first half of the year. Recent large fluctua-tions in macroeconomic aggregates also represent a significant risk factor in the projections. According to the available fig-ures, the second half of the year is expected to bring some improvement, while economic growth is expected to remain low in the next two years, at between 1.5% and 2%.
The labour market, where the fall in employment is not expected to ease until 2011, is also adjusting to the decline in eco-nomic activity with a delay. It will take several years to once again reach the pre-crisis level of economic activity, while the recovery will primarily depend on the normalisation of conditions in the international environment, particularly export demand, which is crucial for reviving Slovenian economic growth. In the context of economic activity at a level below potential output and expected low growth in labour costs in the coming period, no pronounced price pressures are expected. However, the most recent developments indicate a rising risk of wage growth. The most significant risks with regard to price growth could occur due to uncertainties regarding the movement of energy and commodity prices.
Although current global economic developments are encouraging, the sustainability of the recovery is not yet certain, and is being maintained by government support. Internal autonomous growth drivers are weak. Significant fluctuations in economic indicators are possible on the road to economic recovery. Risks in the coming years are dependent on the gradual withdrawal of fiscal policy stimulus measures and on a possible sustained rise in unemployment. The strength of the domestic recovery will depend on growth in foreign demand, for which the reestablishment of global equilibrium and stability on the international financial markets is essential. Inflationary risks are balanced.
* * *
Unfavourable economic conditions in the domestic and international environment are reflected in falling inflation, both through commodity prices and via economic activity and demand. In recent months the inflation rate in Slovenia has fallen back in line with the Maastricht price stability criterion. Like the euro area overall, Slovenia recorded negative, albeit merely transitional, year-on-year price growth in the summer due to the base effects of falling oil prices on global markets. Core inflation excluding energy and food prices had fallen by more than two percentage points by autumn, driven mainly by lower aggregate demand and excess production capacities, which have a significant impact on slowing growth in labour costs. Appreciation in the nomi-nal effective exchange rate, higher real interest rates and tightened financing conditions are also acting to dampen prices.
The economic situation in the international environment has improved in recent months, and the financial markets have stabi-lised somewhat since March under the continued influence of government measures, thus providing the basis for renewed positive growth in the next two years. During the summer the fall in global demand contributed to a sharp year-on-year decline in commodity and oil prices, which further eased inflationary pressures from the rest of the world and significantly improved the terms of trade of Slovenian economy. Economic growth forecasts for 2009 for the main trading partners of Slovenia remain
Summary

BANKA SLOVENIJE
10 PRICE STABILITY REPORT
sharply negative. Consensus's August forecasts indicate a 5.8% decline in GDP in Germany, and a 4.3% drop in the euro area overall. The risks of deteriorating conditions in the countries of south-eastern Europe and Russia have also materialised. For-eign demand, which is expected to decline by nearly 12% this year, is down sharply for the aforementioned reasons, with growth not expected to turn positive until the middle of next year. These trends are in line with the latest releases of consumer confidence and economic sentiment indicators. Owing to the sharp fall in commodity and oil prices in the second half of last year, the Slovenian terms of trade will improve by around 3 percentage points on average this year. However, oil prices are expected to rise to approximately USD 80 per barrel over the projection horizon, resulting in a moderate deterioration in terms of trade in the coming years.
The sharp decline in growth in the first half of the year and deteriorating assumptions regarding economic developments in the international environment form the basis for revisions to economic contraction in 2009 to between 6% and 7%. Economic activity contracted by around 9% in the first half of 2009, and is now at the level recorded at the end of 2006. Despite the nota-ble impact of inventory trends, the deepening of negative year-on-year growth rates over the first half of 2009 is primarily a reflection of the further deterioration of conditions in the international environment. Among the components of demand, invest-ment has already declined by one-third in year-on-year terms. There is also a notable decline in imports and exports, while negative quarterly and year-on-year growth rates can also be seen in household consumption. The government is mitigating this contraction through growth in expenditure. The decline in domestic activity is strongly reflected in falling employment, which is expected to continue falling at a rate of between 2% and 3% this year and in 2010. Falling employment will therefore have a significant impact on growth in total labour costs. According to SORS figures, inventories fell sharply in the context of low demand, smaller orders and declining production, and contributed nearly one-half to the year-on-year drop in GDP over the first half of 2009. The baseline scenario of the projections assumes that the lowest quarterly GDP growth rate was achieved in the first quarter of 2009. In line with the expected recovery in foreign demand, economic growth in 2010 and 2011 is expected to be slightly positive, at between 1.5% and 2%. Having declined over the first half of the year, investment spend-ing is expected to recover slightly faster in the second half of 2009, while labour market conditions and negative growth in real disposable income will result in a contraction in household consumption. In 2010 the largest contribution to positive growth is expected to come from investment, which could, on average, offset around one-third of this year's decline.
The current account deficit is expected to narrow to around 1% of GDP in 2009, before beginning to widen again slightly. Alongside a temporary improvement in the terms of trade, a sharper decline in imports of goods than that of exports, owing to lower domestic and export demand, will contribute to such a result. Trade in services is also declining, transport services, which are closely linked to trade in goods, and tourism services recording the sharpest decline. The services surplus will be lower than that achieved in recent years. A smaller deficit in factor income has also had a significant impact on this year's nar-rowing of the current account deficit. Corporate profits and net outflows from FDI will be lower this year owing to the contrac-tion in economic activity. Net outward interest payments will record the sharpest decline, as around 80% of loans raised in the rest of the world since 2004 refer to a variable interest rate. In the context of expected movements in the terms of trade and rising net imports, the current account deficit could once again approach 4% of GDP by 2011.
Slowing lending activity is largely in line with the contraction in economic activity, and with limited access to sources of financ-ing due to the tightened conditions of the financial markets. With the deepening of the financial turmoil, access to funding in the rest of the world, which represented banks’ main resource for financing the corporate sector, has tightened sharply. Over the first half of the year, banks made net debt repayments of nearly EUR 2 billion to banks in the rest of the world, only a por-tion of these loans being replaced with those of shorter maturity. However, loan demand is low owing to the decline in invest-ment and purchases of durables and housing. Year-on-year growth in lending to the private sector has been falling gradually since the end of 2007, when it stood at nearly 35%, to the current rate of just over 5%. Average monthly growth in lending activity has practically stalled this year. However, year-on-year growth will exceed 5% due to the strong base effect from last year.

BANKA SLOVENIJE
PRICE STABILITY REPORT 11
The movement in headline inflation will be under the influence of low core inflation over the medium-term. Inflation will be af-fected by low aggregate demand and economic activity, and low growth in labour costs in the context of falling employment. Energy and commodity prices will have a significant opposing effect on price developments. Core inflation is expected to fall until the beginning of next year, followed by a gradual rise to around 2% by the end of the projection horizon. The base effects from energy prices reversed in August, and will make a positive contribution to headline inflation of around 1 percentage point between October and the end of the year. This effect will be stronger than envisaged in the previous report, so that average annual inflation will stand at slightly more than 1% this year. Nevertheless, the macroeconomic projections and assumptions for the next two years indicate limited inflationary pressures. Such developments will be in line with the price stability targets of the ECB's monetary policy.
Uncertainties regarding future economic developments are lower than in the spring, but remain exceptionally high. Risks re-garding the revision of economic growth projections are largely balanced for 2009, and are on the downside for 2010 and 2011. Uncertainty regarding the sustainability of the expected global economic recovery represents the greatest risk for projec-tions. A slower recovery in the major global economies and a more significant impact on growth in central and south-eastern Europe would mean lower-than-expected growth. It is likely that several years will be required for a sustained recovery in in-vestment and the creation of demand without support measures from monetary and fiscal policy. It should be noted here that the stimulus effect of fiscal policy is merely temporary. The most significant limitation is the ability to finance the government deficit. The markets will pay close attention to the attitude towards the sustainability of financing, which is reflected in the EU by the criteria set out in the Stability and Growth Pact. An additional risk is a sharper transition, at least in part, from a cyclical deterioration in economic conditions in Slovenia to a structural or more sustained deterioration, which would be reflected in higher structural unemployment and lower potential output. Among domestic factors, a great deal of uncertainty is also linked to the movement of household consumption, primarily due to possible delayed adjustments on the labour market. On the other hand, a more rapid reversal in confidence, in output and in the build-up of inventories, in part due to economic policy stimulus measures in Slovenia and the rest of the world, could contribute to a more rapid economic recovery. Recent major fluctuations in investment and inventories represent an obstacle to a clearer picture. Risks for the inflation forecast are balanced. Re-strained price growth is influenced by the possibility of a weaker recovery and the resulting slower growth in labour costs, while a possible rise in commodity prices, and a possible rise in taxes and excise duties due to the need for fiscal consolida-tion could have a counter effect.
* * *
The long-term sustainability of domestic macroeconomic policies is crucial in the current conditions. Through a package of anti-crisis measures, fiscal policy has placed a significant burden on long-term public finance sustainability. Therefore the con-solidation of public finances, in the scope of the Stability and Growth Pact, will be critical to maintaining its long-term credibility. Slovenia is among the group of countries at high risk with regard to the sustainability of public finances, including in terms of its ageing population. A credibly planned consolidation is required for access to unhindered financing and to prevent a rise in risk premiums, which could increase the cost of servicing the public debt. Here the possibility that lower economic growth in the coming years could also affect budget resources should be taken into account. A useful step in this direction is the deci-sion of the Slovenian government to introduce a project approach to the budget establishment. For labour market policy, this means creating a wage policy that promotes quality of work and long-term labour cost trends that are in keeping with the main-tenance of the economy's price and cost competitiveness. An appropriate balance between active and passive labour market policies could be of assistance in this regard. Labour cost flexibility and the training of the unemployed for jobs with higher value-added are essential to prevent a sustained rise in unemployment and a decline in the long-term potential of the econ-omy.
Those responsible for economic policies in the international environment are striving for the establishment of an institutional environment that will prevent the possibility of similar crises occurring again. Therefore, measures are being prepared in the
BANKA SLOVENIJE
12 PRICE STABILITY REPORT
international environment for increased transparency in the functioning of the financial markets, the balanced valuation of fi-nancial assets, corrective mechanisms to prevent the excessive assumption of risks, the formulation of new roles for interna-tional financial institutions and the development of counter-cyclical tools for risk management. The complexity of issues and related risks, and the various views that reflect the interests of key global players offer no promise of a quick solution. The latter will undoubtedly affect the pace of the recovery, and also determine the pace of withdrawal of public funds that are pledged to stimulate demand and economic growth and the stabilisation of the functioning of the financial system.
2003 2004 2005 2006 2007 2008 Sep � Sep � Sep �
Activity, employment and wages real growth, %
GDP 2.8 4.3 4.5 5.8 6.8 3.5 -6.7 -4.7 1.6 -0.3 1.7 -1.3Employment -0.4 0.3 -0.2 1.5 3.0 2.8 -2.7 -0.1 -2.6 -1.9 -0.4 -0.9Disposable income* 1.7 4.3 2.9 4.2 5.6 4.2 -1.4 -0.9 -3.1 -4.2 1.5 -0.6Average employee compensation 7.9 7.8 5.6 5.3 6.4 7.0 2.4 -0.1 1.0 -2.7 3.6 -0.3Productivity 3.2 4.0 4.7 4.2 3.7 0.7 -4.1 -4.7 4.3 1.7 2.1 -0.4ULC (nominal) 4.5 3.7 0.9 1.0 2.6 6.2 6.8 4.9 -3.2 -4.3 1.5 0.1
Contribution to GDP growth percentage pointsDomestic demand, excl. change in inventories 4.1 3.5 3.0 4.9 6.8 4.3 -7.8 … 1.9 … 1.7 …Net exports -1.9 -0.5 2.2 0.2 -1.8 -0.1 2.4 1.5 -0.8 -0.3 -0.1 0.2Inventories 0.6 1.3 -0.7 0.7 1.9 -0.7 -1.4 … 0.5 … 0.1 …
Domestic demand real growth, %Domestic demand 4.8 4.8 2.3 5.6 8.6 3.5 -9.0 -6.2 2.4 -0.1 1.8 -1.6Private consumption 3.3 2.7 2.6 2.9 6.7 2.0 -1.8 -2.7 -0.4 -1.8 2.1 0.1Government spending 2.2 3.4 3.4 4.0 0.7 6.2 3.4 1.3 0.9 -1.2 0.6 -1.9Gross investment 8.1 5.6 3.7 9.9 11.7 7.7 -25.2 … 8.3 … 1.8 …
Balance of payments real growth, %, unless statedExports of merchandise and services 3.1 12.4 10.6 12.5 13.7 2.9 -17.9 -10.9 2.1 0.6 4.0 0.0Imports of merchandise and services 6.7 13.3 6.6 12.2 16.3 2.9 -20.4 -12.5 3.2 1.1 4.1 -0.2Current account: EUR billion -0.2 -0.7 -0.5 -0.8 -1.5 -2.3 -0.5 0.7 -1.2 0.5 -1.4 0.5 as % GDP -0.8 -2.6 -1.7 -2.5 -4.2 -6.2 -1.3 1.9 -3.2 1.2 -3.7 1.2Terms of trade** 0.8 -1.0 -2.0 -0.5 0.6 -1.9 2.8 0.6 -1.9 -0.9 -0.4 -0.4
Prices average annual growth, %Consumer prices (HICP) 5.7 3.7 2.5 2.5 3.8 5.5 1.1 0.7 1.5 -0.3 1.7 -0.6HICP excluding energy 6.0 3.2 1.2 1.7 3.8 4.9 1.9 0.1 1.1 -0.1 1.7 -0.3HICP energy 3.4 7.0 11.9 8.5 3.4 9.4 -3.8 4.4 3.6 -2.7 1.0 -3.7
International environment average annual growth, %, unless stated
Foreign demand*** 5.7 7.5 4.3 8.6 7.4 2.5 -11.8 -5.4 -0.1 -1.0 3.6 -0.5Oil (USD per barrel) 29 38 54 65 73 98 62 12 79 19 82 22Non-oil commodities 11.0 22.5 11.6 29.0 17.1 9.7 -16.4 8.6 16.3 11.3 -4.8 -9.8EMU inflation 2.1 2.1 2.2 2.2 2.1 3.3 0.3 -0.4 1.2 -0.4 2.0 0.0PPI Germany 1.8 1.6 4.4 5.4 1.3 5.4 -3.0 -3.4 0.9 -1.0 2.4 0.4
* Net wages, other employment earnings and social benefits; HICP deflated** Based on national accounts deflators*** Quantitative imports from basket of foreign partners�: Difference between current projections and projections in March 2009 Price Stability Report
Sources: SORS, Bank of Slovenia, Eurostat, Consensus Forecasts, JP Morgan, OECD Outlook
Projections
Figures are taken from annual and quarterly national accounts available on 3 September 2009. Because the annual and quarterly figures are yet to be coordinated, the annual figures may deviate from the quarterly averages
20112009 2010

BANKA SLOVENIJE
Recent Price DevelopmentsPRICE STABILITY REPORT 13
Following high average price growth last year, it has declined sharply this year, primarily owing to external factors. The plummet in economic activity in the in-ternational environment has been reflected in a sharp fall in commodity prices. Domestic economic devel-opments have further driven falling inflation with a slight delay. Average annual growth in consumer prices as measured by the HICP stood at 0.8% over the first eight months of this year, a decrease of 4.7 percentage points on average growth in 2008. The most significant external factor contributing to the lower annual inflation was lower growth in energy and commodity prices, par-ticularly food prices. Among internal factors, the delayed effects of last year's exceptionally high growth in labour costs was still notable at the beginning of this year, de-
spite the drop in economic growth, and was reflected in inflationary pressures linked to the domestic macroeco-nomic environment. Thus core inflation fell more slowly than expected.
For the first time since summer 2007, inflation was once again within the Maastricht price stability crite-rion at the beginning of the second half of 2009. In July 2009 that criterion stood at 2.2%, 0.5 percentage points above the 12-month average HICP growth rate in Slovenia in August. Average inflation in Slovenia ex-ceeded the Maastricht price stability criterion over the first five months of the year, while June's fall in inflation brought it back in line with the Maastricht criterion. The fall in inflation relative to the euro area was primarily a reflection of a stronger impact of factors from the interna-
1 Recent Price Developments
0
1
2
3
4
5
6
7
0
1
2
3
4
5
6
7
2006 2007 2008 2009
Maastricht price stability criterion Slovenia
12-month average of year-on-year growth in the HICP; %
Figure 1.1: Maastricht price stability criterion
Source: Eurostat, Bank of Slovenia
-1
0
1
2
3
4
5
6
7
-1
0
1
2
3
4
5
6
7
2006 2007 2008 2009
HICP – SloveniaHICP – euro area
year-on-year, %
Figure 1.2: Headline inflation
Source: Eurostat

BANKA SLOVENIJE
14Recent Price Developments PRICE STABILITY REPORT
tional environment, lower growth in energy and commod-ity prices, and higher share of energy and food in the consumer basket, and was also linked to trends in aggre-gate demand and economic activity in Slovenia.
Macroeconomic factors and core inflation indicators Core inflation in Slovenia has fallen gradually since the beginning of this year, primarily as a result of a contraction in domestic economic activity. Last year's slowdown in economic activity has turned into a sharp contraction this year. Despite a likely reversal in the level of potential output, large surpluses in production capacity can be seen in economic activity and on the labour mar-ket. Figures also indicate a sharp slowdown in household consumption, which is significantly limiting providers of goods and services with regard to the raising of prices. Growth in the HICP excluding energy and unprocessed food has fallen by 1.5 percentage points since the begin-ning of the year to 1.7% by August. Since this indicator includes the prices of processed food, which have re-corded relatively high growth due to increased excise duties on alcohol and tobacco, core inflation indicators excluding all food prices must also be compared. Growth in the harmonised index of prices excluding energy, food, alcohol and tobacco stood at 1.4% in August, compared with 3.2% at the beginning of the year.
Last year's high growth in labour costs has contrib-uted to a slower fall in core inflation this year. Cur-rent figures for private sector wages already point to a sharper drop. Labour market trends in the first half of this year indicate that negative economic growth is al-ready resulting in a fall in employment. The sharpest fall in employment this year has been recorded in the manu-facturing sector, while there has also been a sustained decline in employment in the construction sector, where the fastest employment growth was recorded in recent years. The fall in employment is also reflected in a rising registered unemployment rate, which stood at 9.1% in
June 2009, compared with 7% at the end of 2008. Of particular note with regard to labour cost trends is the slow pace of public sector adjustment, which was largely set out in wage reforms from 2008. Private sector labour costs, measured by growth in the average gross wage, rose by 2.1% on average over the first six months of this year, while public sector labour costs were up 11.8%.
Among the factors that have further mitigated infla-tionary pressures was the appreciation of the nomi-nal effective exchange rate. The euro's appreciation,
0
1
2
3
4
5
6
7
8
0
1
2
3
4
5
6
7
8
2006 2007 2008 2009
excluding energy, food, alcohol and tobacco (Slovenia)excluding energy, food, alcohol and tobacco (euro area)excluding energy (Slovenia)excluding energy (euro area)
year-on-year, %
Figure 1.3: Core inflation
Source: Eurostat, Bank of Slovenia calculations
HICP:
-12-10
-8-6-4-202468
10
96 97 98 99 00 01 02 03 04 05 06 07 08 09-12-10-8-6-4-20246810
range of estimates based on production functionlog-linear trend (constant growth in potential output)Hodrick-Prescott filter
*The output gap is defined as , where y is the level of actual GDP, and y* is the level of potential output.
Figure 1.4: Range of estimates of output gap in Slovenia*
100*
*�
�y
yy
For more on the calculation of indicators see Box 1.1 in the October 2008 Price Stability Report. Current estimates of the output gap are very uncertain, and reflect only a qualitative estimate of potential output developments.Source: SORS, Bank of Slovenia calculations

BANKA SLOVENIJE
Recent Price DevelopmentsPRICE STABILITY REPORT 15
together with the fall in US dollar oil and food prices, has further reduced input costs for euro area companies. The euro appreciated by 8% against the US dollar from Janu-ary to August, while US dollar oil prices were down around 50% on average over the first eight months of the year.
Financing conditions in Slovenia remain fairly tight due to the turmoil on the financial markets and uncer-tainty regarding future trends of economic growth, while the drop in lending activity is further mitigating longer-term inflationary risks. Real interest rates have risen this year. Inflation has fallen more rapidly in Slove-nia than in the euro area, while the reduction in interest
rates by commercial banks in the euro area has outpaced that of Slovenian commercial banks. Premiums over the EURIBOR have risen sharply, and thus partly offset the decline in financing costs through exceptionally low nomi-nal interest rates owing to stimulus-oriented monetary policy. This was particularly notable in financing condi-tions for non-financial corporations. This, alongside the financial turmoil and associated uncertainties, has acted to further reduce lending activity in Slovenia and the euro area.
Table 1.1: Structure of the HICP and price indicators
Notes: 1 ECB methodology, 2 National accounts figures, 3 Figures for employment compensation from national accounts, 4 Calculated as the diffe-rence between the GDP deflator and unit labour costs. Sources: SORS, Eurostat, Bank of Slovenia calculations
2005 2006 2007 2008 09H1 08Q2 08Q3 08Q4 09Q1 09Q2
HICP 100.0% 2.5 2.5 3.8 5.5 1.1 6.4 6.2 3.1 1.7 0.6Breakdown of HICP: Energy 11.6% 11.9 8.5 3.4 9.4 -7.9 11.7 15.0 -1.2 -6.6 -9.1 Food 22.1% 0.2 2.7 7.1 8.1 2.6 9.9 7.5 4.1 3.0 2.2 processed 15.0% 0.6 2.5 6.3 9.9 2.6 12.7 8.9 5.5 2.4 2.8 unprocessed 7.1% -0.8 3.1 8.7 4.6 2.5 4.7 4.8 1.5 4.2 0.9 Other goods 31.2% -0.3 -0.9 0.3 2.2 1.3 2.6 2.1 2.5 1.9 0.8 Services 35.1% 3.3 3.5 4.9 5.3 3.8 5.5 5.3 4.7 4.1 3.5Core inflation indicatorsHICP excluding energy 88.4% 1.2 1.7 3.8 4.9 2.6 5.6 4.8 3.8 3.0 2.2HICP excluding energy and unprocessed food 81.3% 1.3 1.5 3.4 5.0 2.6 5.7 4.8 4.0 2.9 2.3HICP excluding energy, food, alcohol and tobacco 66.3% 1.5 1.3 2.7 3.8 2.6 4.1 3.8 3.7 3.0 2.2Administered and non-administered prices:1
Administered prices 5.9% 3.4 2.4 2.4 3.1 1.9 3.4 2.7 3.6 2.2 1.7 Non-administered prices 94.1% 2.4 2.6 3.8 5.7 1.1 6.6 6.4 3.1 1.7 0.5Other price indicators: Industrial producer prices on domestic market 2.8 2.4 5.5 5.6 0.5 6.1 6.2 4.2 1.5 -0.4 GDP deflator 1.6 2.1 4.2 3.8 3.1 4.4 3.6 3.0 3.4 2.9 Import prices2 5.0 3.3 1.8 3.6 -6.3 3.9 6.0 2.5 -4.7 -7.9Selected macroeconomic factors: Output gap (HP trend) -1.4 0.2 2.9 3.0 -7.4 4.8 3.3 -0.4 -5.1 -9.6 Unit labour costs3 0.9 1.0 2.6 6.2 13.2 6.5 8.9 10.5 15.0 11.3
Labour costs per employee3 5.6 5.3 6.4 7.0 3.8 9.0 10.0 7.1 4.9 2.6 Productivity3 4.7 4.2 3.7 0.7 -8.3 2.3 1.0 -3.1 -8.8 -7.8
Profit indicator4 0.7 1.0 1.6 -2.3 -8.8 -2.0 -4.9 -6.8 -10.1 -7.6
year-on-year growth in quarter, %
weight
average annual growth, %

BANKA SLOVENIJE
16Recent Price Developments PRICE STABILITY REPORT
Microeconomic factors and the structure of inflation Energy prices recorded the sharpest fall over the first eight months of the year, the fall having begun in the final quarter of last year before deepening this year, with energy prices reaching their low in July. Year-on-year growth in prices stood at -11.9% in July, the fall in prices easing in August to -7.2%. The lower price of oil on the global market has contributed most to this year's lower growth in energy prices. The price of oil averaged USD 56 per barrel over the first eight months of the year,
compared with USD 98 per barrel in 2008. Average year-on-year growth in energy prices over the first eight months of the year stood at -8.2%, down 17.7 percentage points on last year's average. Growth in energy prices would have been even lower had the government not decided to raise excise duties on energy products in the context of falling oil prices on global markets.
Growth in food prices continued to slow over the first eight months of this year, the result of lower demand due to the contraction in economic activity. Average growth in food prices over the first eight months of the year stood at 2.3%, down 5.9 percentage points on last year's average, while outpacing euro area growth by 0.9 percentage points. The fall in food prices in the final quarter of last year has become more pronounced. The easing of prices has continued this year with smaller up-ward fluctuations that were primarily seen in processed food prices, owing to a government decree to raise ex-cise duties on alcohol and alcoholic beverages and to-bacco in March and May. Thus year-on-year growth in processed food prices stood at 2.7% over the first eight months of the year, which is down sharply on last year, but still higher than the euro area's average year-on-year growth of 1.5%. A sharp fall in the prices of food in the form of commodity for further processing has contributed most to the lower growth in unprocessed food prices, which averaged 1.3% over the first eight months of the year, down 3.4 percentage points on last year's average. Global food prices were down 22.8% on average over the first eight months of this year, compared with an average rise of 35.5% in 2008.
Growth in services prices has gradually fallen in line with the movement in domestic aggregate demand and the easing of nominal labour costs. Average growth in services prices over the first eight months of the year stood at 3.6%, down 1.7 percentage points on last year, while outpacing average euro area growth by 1.4 percentage points. Among services, the most notable growth was recorded by prices of hospital services, which rose by 15.0% or 7.1 percentage points more than in the
-15
-10
-5
0
5
10
15
20
-15
-10
-5
0
5
10
15
20
2006 2007 2008 2009
energy other goodsservices foodunprocessed f. processed f.HICP
year-on-year, %
Figure 1.5: Individual price categories
Source: SORS, Bank of Slovenia calculations
-4
-2
0
2
4
6
8
10
12
-4
-2
0
2
4
6
8
10
12
2006 2007 2008 2009
euro areaSlovenia
Figure 1.6: Food prices in Slovenia and the euro areayear-on-year, %
Source: Eurostat, Bank of Slovenia calculations

BANKA SLOVENIJE
Recent Price DevelopmentsPRICE STABILITY REPORT 17
previous year, while prices of recreational and sporting services were up 8.0%. Having recorded growth of 7.0% last year, prices of holiday packages were up merely 2.0% on average over the first eight months of the year, the most notable slowdown.
Prices of non-energy industrial goods have also re-corded lower growth this year. Growth in these prices in Slovenia deviated sharply from euro area growth last year, while the gap has nearly closed this year. Average annual growth in prices of non-energy industrial
goods over the first eight months of the year stood at 0.9%, down 1.3 percentage points on last year's average and 0.2 percentage points higher than euro area growth. Movements in these prices have tracked movements in services prices this year. However, prices of non-energy industrial goods responded faster to falling domestic ag-gregate demand. Contributing most to the decline in price growth were lower prices of clothing and footwear, which were up 1.0% on average over the first eight months of the year, down 3.3 percentage points on last year's aver-age growth. Average growth in the prices of non-energy industrial goods in the euro area stood at 0.7% this year, down 0.1 percentage point on last year's average growth. Deviations in this category from the euro area are primar-ily a reflection of internal macroeconomic factors. Administered prices excluding energy rose by an average of 2.7% over the first eight months of the year, contributing 0.2 percentage points to headline inflation. Prices of district heating rose by 2.6% over the first eight months of this year. Prices of passenger rail-way services within Slovenia were up 3.6% over the first eight months of 2009, while prices of municipal services were up 2.2%.
Producer prices Industrial producer prices on the domestic market rose by an average of 0.3% over the first six months of this year, down 5.3 percentage points on last year's average growth. Euro area prices were down by an average of 4.5%, primarily owing to falling en-ergy prices. This year's fall in commodity prices of 2.8% on average over the first seven months of the year con-tributed most to the lower growth in industrial producer prices. Contributing most to the fall in commodity prices was the negative year-on-year growth in global metal prices, which were down around 48% on average of the first seven months of 2009. Lower average price growth was also recorded by capital goods (0.1%) and consumer goods (0.2%). The highest growth was recorded by en-
-4
-2
0
2
4
-4
-2
0
2
4
2006 2007 2008 2009
euro area
Slovenia
Figure 1.8: Prices of non-energy industrial goodsyear-on-year, %
Source: Eurostat, Bank of Slovenia calculations
0
1
2
3
4
5
6
0
1
2
3
4
5
6
2006 2007 2008 2009
euro area
Slovenia
Figure 1.7: Prices of services in Slovenia and the euro areayear-on-year, %
Source: Eurostat, Bank of Slovenia calculations
BANKA SLOVENIJE
18Recent Price Developments PRICE STABILITY REPORT
ergy prices1, which were up by an average of 7.5% over the first seven months of the year. The prices of con-sumer durables and capital goods recorded the highest growth in the euro area, while energy prices recorded the
sharpest fall, of 10.3% on average. In contrast to Slove-nia and the euro area, US industrial producer prices fell by an average of 3.6% over the first seven months of this year, down sharply on the 6.4% growth recorded in 2008.
-10-8-6-4-202468
10121416
-10-8-6-4-20246810121416
2006 2007 2008 2009
intermediate goodscapital goodsconsumer goodsenergyoverall
year-on-year, %
Source: SORS, Bank of Slovenia calculations
Figure 1.9: Industrial producer prices on the domestic market
1 In contrast to energy prices in the HICP, industrial producer prices do not include prices of refined petroleum products, because they are not manufactured in Slovenia. Thus only the supply of electricity, gas and steam, and the collection, treatment and distribution of water are taken into account.
-25
-20
-15
-10
-5
0
5
10
15
20
25
-25
-20
-15
-10
-5
0
5
10
15
20
25
2006 2007 2008 2009
US - finished goodseuro area overalleuro area - consumer goodseuro area - capital goodseuro area - intermediate goodseuro area - energy
year-on-year, %
Figure 1.10: Industrial producer prices on the domestic market for the US and the euro area
Source: Eurostat, Federal Reserve Bank of St. Louis, Bank of Slovenia calculations

BANKA SLOVENIJE
International Environment and Projection AssumptionsPRICE STABILITY REPORT 19
The first half of this year was characterised by the largest contraction in economic activity around the world and in Slovenia's most important trading part-ners since the Great Depression of the 1930s. The economic crisis deepened further in the first quarter of this year, while figures for the second quarter are some-what more favourable. The euro area economy con-tracted by 4.8% in year-on-year terms over the first half of the year, while the US contracted by 3.6%. Japanese
economy contracted by 8.4% in the first quarter. A sharp contraction in economy activity was also seen in Slove-nia's most important trading partners outside the euro area, Croatia having recorded a drop in economic activity of 6.7%, while Russia and Serbia also recorded falls in GDP of 9.8% and 3.5% respectively in the first quarter. Due to the deepening of the global economic crisis and the associated downward revisions to economic growth forecast in the period to this summer3, the forecast for
2
International Environment and Projection Assumptions2
Table 2.1: Assumptions regarding factors from the international environment
* Quantitative imports from basket of foreign partners �: Difference between current projections and projections in March 2009 Price Stability Report. Sources: Bank of Slovenia, Eurostat, Consensus Forecasts, JP Morgan, OECD Outlook
2004 2005 2006 2007 2008 Sep � Sep � Sep �
annual growth, %, unless stated
Foreign demand* 7.5 4.3 8.6 7.4 2.5 -11.8 -5.4 -0.1 -1.0 3.6 -0.5Oil (USD/barrel) 38 54 65 73 98 62 12 79 19 82 22Non-oil commodities 22.5 11.6 29.0 17.1 9.7 -16.4 8.6 16.3 11.3 -4.8 -9.8EMU inflation 2.1 2.2 2.2 2.1 3.3 0.3 -0.4 1.2 -0.4 2.0 0.0PPI Germany 1.6 4.4 5.4 1.3 5.4 -3.0 -3.4 0.9 -1.0 2.4 0.4
20112009 2010Projections
2 The forecasts were made on the basis of data available and the statistical methodologies applicable on 3 September 2009. The projections of macroeconomic factors in the Price Stability Report are based on assumptions regarding the movement of variables in the international environ-ment and certain domestic factors conditioned by economic policy decisions. Assumptions regarding the movement of variables from the interna-tional environment are summarised from Consensus Forecasts (August 2009), JP Morgan (Global Data Watch, 21 August 2009) and the OECD Outlook (June 2009). The domestic factors under the influence of economic policy and exogenously included in the forecasting process are public sector spending and investment, public sector wages, the movement of administered prices and certain other variables of a fiscal nature. The assumptions used in the projections are not the same as those used by the ESCB in its projections. For the relationship between the Bank of Slovenia projections and those of the ESCB, see the annex in the April 2008 Price Stability Report. 3 For example, the forecast for German economic growth in 2009 stood at -2.5% in February, and at -5.8% in August. The forecast for the euro area in the same period was revised downward from -2.0% to -4.3%, while that for Croatia was revised from -0.6% to -4.7%.

BANKA SLOVENIJE
20International Environment and Projection Assumptions PRICE STABILITY REPORT
Downward revisions to forecasts of economic activity in the rest of the world have continued this year, although they are diminishing. This box illustrates movements in economic growth forecasts for the euro area, US and Eastern Europe for 2009 and 2010, as published by the International Mone-tary Fund (IMF), the European Commission (EC), the Organi-sation for Economic Cooperation and Development (OECD) and Consensus, which compiles monthly averages of fore-casting experts. The cumulative downward revision from January to August 2009 in Consensus's forecast for GDP growth is 2.9 percentage points for the euro area and 0.8 percentage points for the US. Despite slight interim down-ward revisions, the August forecasts for 2010 remained at the level of January's forecasts.
In its interim forecasts at the beginning of this year, the Euro-pean Commission projected a 1.9% decline in GDP in the euro area and a drop of 1.6% in GDP in the US in 2009. Posi-tive growth of 0.4% and 1.7% was forecast for the euro area and the US respectively in 2010. In its interim report at the end of January, the IMF published very similar forecasts to those of the Commission for 2009 and 2010 for the euro area and the US, while Consensus's forecast deviated from the others. At the end of January Consensus forecast a drop in GDP for the euro area for 2009 of 1.4% and 1.8% for the US, while the forecast of growth for 2010 was considerably more optimistic, at 0.8% for the euro area and 2.3% for the US. In
January Consensus also forecast positive growth for the countries of Eastern Europe, where economic growth was forecast at 0.6% for 2009 and 3.1% for 2010.
Revision were made for both years by the Commission and the IMF in their spring forecasts. The Commission forecast a 4.0% decline in GDP for the euro area in 2009 and a 2.9% drop in GDP for the US in 2009, while it forecast a 0.1% con-traction in euro area GDP and 0.9% growth in the US for 2010. Downward revisions by the IMF followed, with 4.2% and 2.8% falls in GDP projected in the euro area and the US respectively for 2009, while it forecast GDP growth of -0.1% in the euro area and 0.9% in the US for 2010. During the same period Consensus also revised its economic growth forecasts downwards, predicting declines in GDP of 3.4% and 2.7% for the euro area and the US respectively, while growth of 0.3% for the euro area and 1.8% for the US was forecast for 2010. Consensus made sharp downward revisions to its forecasts for the countries of Eastern Europe, with a 2.7% decline in GDP envisaged for 2009 and GDP growth of 1.9% in 2010. The reasons for the downward revisions for 2009 and 2010 were the same at all three institutions, as this year's recovery has been slower than expected.
The OECD also published its forecasts in June, in which it predicted a 4.8% decline in GDP for the euro area in 2009 and a 2.8% drop in GDP for the US, while it forecast GDP growth of 0.3% and 1.9% for the euro area and the US re-
Box 2.1: Revisions to forecasts of economic activity in the rest of the world for 2009 and 2010
-6-5-4-3-2-10123456
-6-5-4-3-2-10123456
J.08
Feb.
Mar
.Ap
r.M
ay.
Jun. Jul.
Aug.
Sep.
Oct.
Nov.
Dec.
J.09
Feb.
Mar
.Ap
r.M
ay.
Jun. Jul.
Aug.
EC (euro area)Consensus (euro area)EC (US)Consensus (US)Consensus (Eastern Europe)
Figure 1: Forecasts of economic activity for 2009
Source: Consensus, European Commission (EC)
year-on-year GDP growth, %
-6-5-4-3-2-10123456
-6-5-4-3-2-10123456
J.08
Feb.
Mar
.Ap
r.M
ay.
Jun. Jul.
Aug.
Sep.
Oct.
Nov.
Dec.
J.09
Feb.
Mar
.Ap
r.M
ay.
Jun. Jul.
Aug.
EC (euro area)Consensus (euro area)EC (US)Consensus (US)Consensus (Eastern Europe)
Figure 2: Forecasts of economic activity for 2010
Source: Consensus, European Commission (EC)
year-on-year GDP growth, %

BANKA SLOVENIJE
International Environment and Projection AssumptionsPRICE STABILITY REPORT 21
growth in foreign import demand for 2009 was revised downwards, from 6.4% to -11.8%.
During the summer the deterioration in economic growth forecasts for this year and next came to a halt, an indication that the recession may have bot-tomed out. However, most experts expect a very slow global economic recovery. Governments have re-sponded to lower global economic activity through vari-ous stimulus packages, while central banks have lowered key interest rates. The effects of increased government spending and household consumption stimuli initially con-tributed to an improvement in the economic sentiment and consumer confidence indicators in Germany, the US and in the euro area in the second quarter of this year. Initial releases of GDP figures for the second quarter ex-ceeded expectations, particularly in Germany, France and the US. GDP was up 0.3% in Germany, Slovenia's most important trading partner, primarily as a result of recovering private consumption, and to a great extent owing to government incentives for motor vehicle pur-chases, and growth in investment in the construction sec-tor and government spending. At the same time, how-ever, forecasts regarding the size budget deficits around the world are being revised upwards. In the EU, there are currently 11 Member States in excess general govern-ment deficit procedures. According to estimates, this year
even more Member States, including Slovenia, will ex-ceed the general government deficit ceiling of 3% of GDP. During the summer downward revisions to 2009 economic growth forecasts for the euro area and the US came to a halt owing to the gradual improvement in confi-dence indicators and initial releases of GDP growth fig-ures for the second quarter of this year. Nevertheless, the latest4 forecasts of economic growth for this year remain very low, and stand at -4.3% for the euro area (-5.8% for Germany) and at -2.6% for the US. Negative GDP growth is also expected this year in Slovenia's most important
4 Consensus Forecasts, August 2009.
-50
-40
-30
-20
-10
0
10
20
-50
-40
-30
-20
-10
0
10
20
2006 2007 2008 2009
Sloveniaeuro areaGermany
Figure 2.1: Business confidence in Slovenia and abroad
Source: Eurostat
average balances (seasonally adjusted), percentage
spectively for 2010. In contrast to the OECD, Consensus's June forecasts were slightly more optimistic, with GDP growth of -4.2% for the euro area and -2.8% for the US for this year, and 0.3% and 1.9% for the euro area and the US respectively for next year, the first upward revisions to 2010 growth fore-casts made this year. The upward revision was primarily the result of improving economic sentiment indicators for the euro area and an improving consumer confidence indicator in the US. Consensus continued to revise its forecasts for the coun-tries of Eastern Europe downwards, to -4.3% for 2009 and 1.8% for 2010, according to the latest available figures.
Consensus and the IMF revised their forecasts for next year upwards in July and August, while upward revisions were also
evident in forecasts for this year. In July the IMF forecast a 4.8% decline in GDP for the euro area and a 2.6% drop in GDP for the US, while it forecast GDP growth of -0.3% and 0.8% for the euro area and the US respectively for 2010. Consensus released a more optimistic economic growth fore-cast for both years in August: a 4.3% decline in GDP for the euro area in 2009 and a 2.6% drop in GDP for the US, and GDP growth of 0.6% and 2.3% in the euro area and the US respectively for 2010. The upward revisions to GDP growth forecasts derive primarily from improving indicators in the euro area and the US, and a recovery in industrial production in India and China.
BANKA SLOVENIJE
22International Environment and Projection Assumptions PRICE STABILITY REPORT
trading partners outside the euro area: -4.7% in Croatia, -6.7% in Russia and -4.4% in Serbia. Forecasts for the coming years are very uncertain, as it is currently difficult to assess how long the global economic crisis will last. Most experts expect a slow global economic recovery. Thus Slovenia's most important trading partners are ex-pected to once again record positive, but still relatively low economic growth in 2010. As a result, the forecast of growth in foreign demand was also revised downwards for 2010 and 2011.
Having fallen sharply in the second half of last year, oil prices have risen this year, resulting in a higher assumption regarding the price of oil over the entire projection horizon than in the spring projections. Oil prices reached their peak in the middle of 2008, the price of a barrel (159 litres) of Brent crude reaching nearly USD 135. The second half of the year saw a drop in oil prices, which even OPEC decisions to cut pumping could not prevent, with oil prices falling below USD 40 per barrel at the end of 2008. Oil prices have risen fairly evenly in 2009, despite continued weak outlooks regarding global economic growth. The price of a barrel of oil averaged USD 56 over the first eight months of the year, and aver-aged USD 72 in August, while the rise in euro prices was less notable due to the euro's rise against the US dollar. Current futures rates indicate that the price of a barrel of oil will be USD 10 higher on average in 2010 and 2011 than current market prices. Revived demand in China and India is expected to contribute most to rising oil prices, while demand for oil from wealthier countries is expected to rise only gradually. Movement in oil prices will be affected on the one hand by future decisions of crude oil producing countries regarding output quantities, while the duration of the recession and the pace of recov-ery in the major global economies could have a negative impact on oil prices on the other hand.
Having fallen sharply in the second half of last year, commodity prices have begun to rise this year, and are also expected to rise gradually in the future. Fol-lowing exceptionally high growth in commodity prices in
the first half of 2008, these prices fell sharply in the sec-ond half of the year in line with falling global economic activity. Commodity prices continued to stagnate at previ-ously achieved low levels over the first quarter of this year. They then began rising gradually, and are currently fluctuating at the level recorded at the beginning of the final quarter of 2008. Year-on-year growth in the prices of all commodity groups is sharply negative due to the ex-ceptionally high growth in prices recorded last year. How-ever, positive year-on-year growth can be expected again towards the end of this year as the effect of the high ba-sis wanes. Metal prices have risen most this year, while growth in food prices has slowed considerably. The main reasons for the year-on-year fall in commodity prices in 2009 are the high basis from the first half of 2008 and the contraction in global economic activity. The statistical effect of the high basis from 2008 will have the greatest impact on the assumed movement in commodity prices until the end of the projection horizon, while the expected recovery of the global economy should act to gradually strengthen prices.
Inflation turned negative in the euro area and US dur-ing the summer. Negative price growth is linked to the base effect from energy prices, and will thus be
-100-80-60-40-20
020406080
100120140
-100-80-60-40-20020406080100120140
2005 2006 2007 2008 2009 2010 2011
metals (annual growth, %)commodities (excluding oil, annual growth, %)food (annual growth, %)oil (USD/barrel)
Figure 2.2: Prices on world commodity markets
Source: The Economist, Bloomberg, Bank of Slovenia assumptions
assumptions

BANKA SLOVENIJE
International Environment and Projection AssumptionsPRICE STABILITY REPORT 23
merely short-term. Institutions are forecasting that inflation will fluctuate somewhat below the long-term average. The fall in commodity prices and the contraction in economic activity had the greatest impact on the as-sumption regarding lower euro area inflation, while price growth is expected to be somewhat higher in the US ow-ing to slightly better outlooks regarding economic growth. General year-on-year price growth turned negative in March 2009 in the US, and in June in the euro area. The period of negative price growth in the US and euro area is expected to be relatively short due to the end of the period in which the high energy prices recorded last year had a significant impact on the year-on-year fall in prices. Prices are also expected to rise owing to a recovery in economic growth. However, average year-on-year infla-tion in 2010 is expected to remain below the long-term average. Core inflation has eased in both economies. Core inflation (measured as the consumer price index excluding energy and unprocessed food) in the euro area stood at 1.2% in July in year-on-year terms, while core inflation (measured as the consumer price index exclud-ing energy and food) in the US was 1.5% in the same period. Last year average core inflation stood at 2.4% in the euro area and at 2.3% in the US. Foreign institutions are forecasting growth of 0.3% in the HICP in the euro area for this year, while an average fall in the consumer price index of 0.5% is expected in the US.
Growth in industrial producer prices is falling in line with the drop in the general price level. Euro area in-dustrial producer prices fell by an average of 4.5% over the first seven months of the year, primarily due to the sharp year-on-year fall in energy prices. German indus-trial producer prices fell by an average of 2.1% over the first seven months, the year-on-year decline reaching more than 7% in July. The same prices are expected to fall by around 3% on average in 2009, and to rise only gradually until the end of the projection horizon. Along-side the high basis from the previous year, the lower growth in industrial producer prices was driven by weak domestic and foreign demand.
Key interest rates have remained at historical lows this year, while the majority of central banks have introduced non-standard measures as further stimu-lus as well. Thus conditions on the international fi-nancial markets are easing, a prerequisite for a grad-ual economic recovery. The tightened conditions on the financial markets have required an active role by the cen-tral banks, which have responded in part to the limited functioning of the money market by expanding the range of securities accepted as loan collateral, by extending the period for providing unlimited liquidity and by aggres-sively cutting interest rates. After drastically cutting inter-est rates, sometimes also in coordinated action, in the second half of 2008 and at the beginning of 2009, the frequency and pace of central bank rate cuts eased in the second and third quarters of 2009. After standing at 2.50% at the beginning of the year, the ECB's key inter-est rate has stood at 1.00% since the middle of May. The Federal Reserve began cutting its key interest rate ap-proximately one year before the ECB, its key interest rate standing in the target interval of between zero and 0.25% since December 2008. The Bank of England cut its key interest rate to 0.50% in March 2009. The Bank of Japan last cut its key interest rate in December to 0.10%, where it currently stands. Because nominal rates have for the
0.0
1.0
2.0
3.0
4.0
5.0
6.0
7.0
1.00
1.10
1.20
1.30
1.40
1.50
1.60
1.70
2006 2007 2008 2009
Fed Funds rate, % (lhs)ECB main refinancing rate, % (lhs)EUR/USD (rhs)
Figure 2.3: EUR/USD exchange rate and central bank interest rates
Source: ECB, Federal Reserve

BANKA SLOVENIJE
24International Environment and Projection Assumptions PRICE STABILITY REPORT
To mitigate the negative effects of the financial crisis that could cause disruption in banks' liquidity management in the wider euro area economy, the Eurosystem continued provid-ing unlimited refinancing after January 2009 via open market operations, such as main refinancing operations (MROs) and longer-term refinancing operations (LTROs).1 Damaging ef-fects from the malfunctioning of the money market could arise if banks were to further limit corporate and household lending due to the uncertainty of bank refinancing on the money mar-ket.
Unlimited refinancing was introduced in October 2008, when the Governing Council of the ECB decided that all MROs and LTROs would be conducted via fixed-rate tender procedures with full allotment, in which the interest rate would be known to banks prior to the tender. Banks must always secure the amount borrowed from the Eurosystem with an appropriate amount of collateral, such as securities or bank loans to non-banking sectors. The collateral pool was expanded in parallel with the decision regarding full allotment.2 Unlimited refinanc-ing was originally envisaged until 20 January 2009 (MROs) and until March 2009 (LTROs). However, the Governing Council extended the deadline, initially until 8 April 2009, and then again until it deems this type of open market operations is no longer required, but at least until the beginning of 2010. Since June the Governing Council of the ECB has also of-
fered unlimited one-year refinancing, within the framework of LTROs. Since October 2008 liquidity has been allocated to banks in MROs and LTROs at the ECB's key interest rate, i. e. the MRO minimum bid rate. Since the last interest rate cut on 13 May 2009 that rate stands at 1.00%.
In one-year LTROs, the Governing Council of the ECB re-serves the right to add a premium to the fixed interest rate, but had not done so by September 2009. The amount of LTROs with a maturity of one, three and six months slowly declined between the end of January and June 2009, in part due to the reduced needs of banks (the first, very uncertain signs of a revival in interbank money market lending), and the introduction of one-year LTROs, and in part due to the expec-tations of market participants with regard to the future move-ment of the ECB's key interest rate close to its current level, and the related movement in market interest rates, including the EONIA. Owing to excess liquidity, the EONIA has fluctu-ated below the key interest rate for the majority of the period observed, in recent months typically between 60 and 70 basis points below it.
Together with the amount of MROs, the amount of liquidity supplied via operations has exceeded required liquidity con-siderably, sometimes in amounts of several hundred billion euros.3 The maximum amount of open market operations was achieved on the settlement of the first one-year LTRO at the end of June 2009, when it stood at EUR 897 billion. The one-year operations that the Governing Council of the ECB an-nounced in May 2009 (at the same time it extended the pe-riod of expanded collateral until the end of 2010) will be con-ducted by the Eurosystem on two more occasions, at the end of September and in mid-December 2009. The high amount of the first one-year LTRO (EUR 442 billion) was partially offset by reducing the use of weekly MROs and the gradual reduction in the use of LTROs with maturities of one month, three and six months. In the context of a widespread risk aversion, banks have increased their daily investments of excess liquidity in overnight deposits at the Eurosystem (the so-called marginal deposit facility).
The package of non-standard measures adopted due to the turmoil was supplemented in June by the ECB Governing Council's decision regarding the creation of a portfolio of cov-
Box 2.2: Monetary policy: continuation of existing measures and introduction of new non-standard measures after January 2009
-1,200-1,000
-800-600-400-200
0200400600800
1,0001,2001,4001,600 EUR billion
-1,200-1,000-800-600-400-20002004006008001,0001,2001,4001,600
j f m a m j j a
Deposit facilityBank reservesAutonomous factorsOpen market operations
Figure: Open market operations, deposit facility, bank reserves and autonomous factors in changes to liquidity
Source: ECB
+ increase, - decrease in liquidity

BANKA SLOVENIJE
International Environment and Projection AssumptionsPRICE STABILITY REPORT 25
most part reached their lowest levels, the central banks have enhanced their functioning with non-standard mone-tary policy measures (see Box 2.2). The standard as-sumption that interest rates will be aligned with the cur-rent expectations of the financial markets has been ap-plied in the projections.
The euro has appreciated against the US dollar in 2009, with the exception of the first two months of the
year. The euro averaged USD 1.38 over the first eight months of the year. Following a brief period of the US dollar appreciating against the euro at the beginning of this year, the euro has continuously and gradually risen against the US dollar, the average EUR/USD exchange rate standing at around 1.43 in August. This rate is taken into account in the assumptions until the end of the pro-jection horizon.
ered bonds in the amount of EUR 60 billion. The portfolio, which will be created through the purchase of covered bonds issued in the euro area on the primary and secondary mar-kets between July 2009 and June 2010, is expected to in-crease confidence in the second-largest euro area bond mar-ket (the largest being government bond markets) and support bank lending to the non-banking sectors of the economy. Furthermore, since the beginning of July the European Invest-ment Bank (EIB) has also had access to the Eurosystem's open market operations. Facilitating liquidity management in this way should make it easier for the EIB to implement its programme of additional lending to euro area SMEs.
The non-standard measures also include foreign currency lending to banks. In agreement with the Swiss National Bank and the Federal Reserve System, in 2009 the Eurosystem has continued lending in Swiss francs, which it has extended at least until the end of October 2009, and in US dollars. US dollar lending was extended at least until the end of Septem-ber 2009. Similar to euro lending via MROs and LTROs, the Eurosystem lends US dollars via fixed-rate tender procedures with full allotment. Owing to the gradual normalisation of ac-cess by European banks to short-term refinancing in US dol-lars and Swiss francs, the amount of these operations has gradually but persistently declined. The amount of US dollar operations has been declining since December 2008, and stood at USD 46 billion at the end of August, or less than one-
fifth of the maximum amount achieved at the beginning of December 2008 (USD 293 billion). In Swiss franc operations, the amount declined to EUR 11 billion, or slightly more than 40% of the maximum available amount (EUR 25 billion), be-tween the end of June and the end of August 2009.
1 In normal conditions, e.g. prior to August 2007, the Eurosystem provides banks with liquidity evenly throughout the reserve maintenance period in amounts that it assesses as required liquidity (see note 3 for the definition of required liquidity). For the purpose of mitigating the uncertainty of banks with regard to fulfilment of the minimum reserve requirement, the Eurosys-tem employed a front-loading policy until the end of September 2008: because banks must meet the reserve requirement over the average re-serve maintenance period, the Eurosystem provided banks more then the average (required) amount at the beginning of the period, thus reducing the likelihood that banks would have to find the required liquidity at the end of the period, when they have less time to offset possible deficits. Since the Eurosystem still supplied the required amount of liquidity (no more and no less) on average over the period, the supply was decreased towards the end of the period. Due to the decline in confidence among banks following the collapse of the US bank Lehman Brothers on 15 September 2008, the money market no longer facilitated the refinancing of economically sound (solvent) banks. Therefore, the Eurosystem switched to unlimited refinanc-ing in October 2008. 2 For details of the expansion see the ECB's press release at http://www.ecb.int/press/pr/date/2008/html/pr081015.en.html 3 Required liquidity is defined by the autonomous demand for money issued by Eurosystem, particularly banknotes (i.e. autonomous factors), and the prescribed minimum reserves. Required liquidity averaged EUR 600 billion in the period February to August 2009.
BANKA SLOVENIJE
26International Environment and Projection Assumptions PRICE STABILITY REPORT
BANKA SLOVENIJE
Economic Trends and the Labour MarketPRICE STABILITY REPORT 27
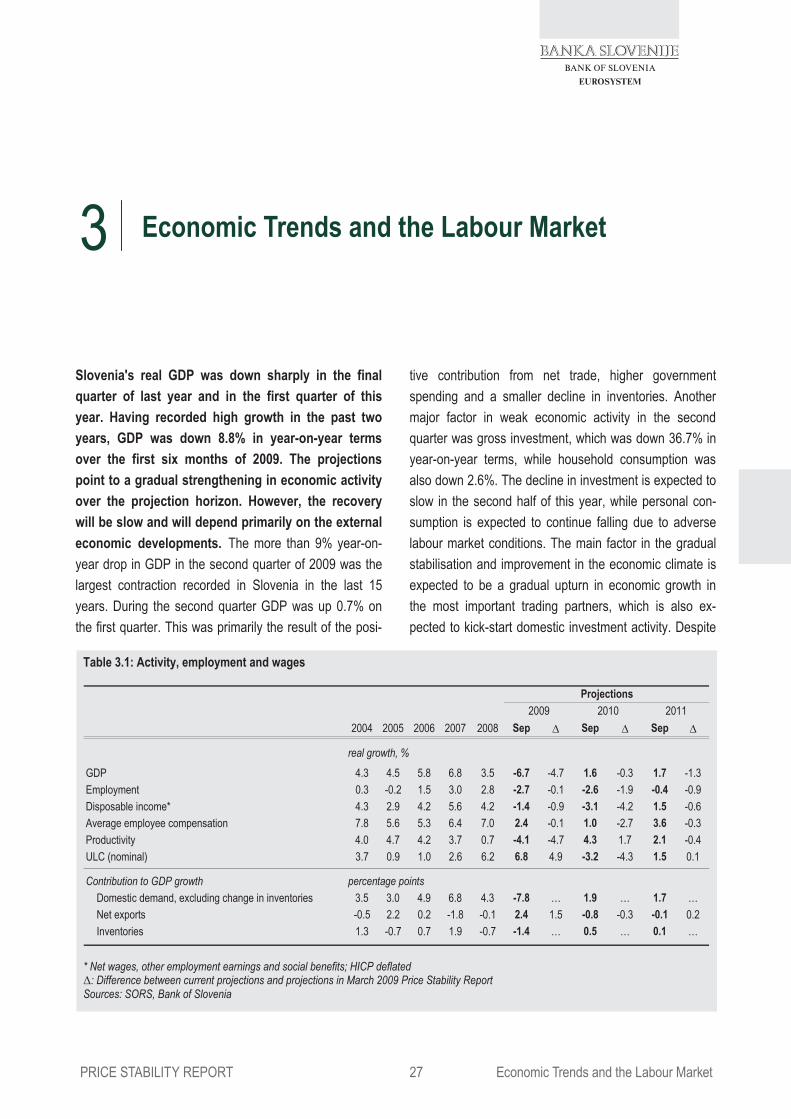
Slovenia's real GDP was down sharply in the final quarter of last year and in the first quarter of this year. Having recorded high growth in the past two years, GDP was down 8.8% in year-on-year terms over the first six months of 2009. The projections point to a gradual strengthening in economic activity over the projection horizon. However, the recovery will be slow and will depend primarily on the external economic developments. The more than 9% year-on-year drop in GDP in the second quarter of 2009 was the largest contraction recorded in Slovenia in the last 15 years. During the second quarter GDP was up 0.7% on the first quarter. This was primarily the result of the posi-
tive contribution from net trade, higher government spending and a smaller decline in inventories. Another major factor in weak economic activity in the second quarter was gross investment, which was down 36.7% in year-on-year terms, while household consumption was also down 2.6%. The decline in investment is expected to slow in the second half of this year, while personal con-sumption is expected to continue falling due to adverse labour market conditions. The main factor in the gradual stabilisation and improvement in the economic climate is expected to be a gradual upturn in economic growth in the most important trading partners, which is also ex-pected to kick-start domestic investment activity. Despite
3 Economic Trends and the Labour Market
Table 3.1: Activity, employment and wages
* Net wages, other employment earnings and social benefits; HICP deflated �: Difference between current projections and projections in March 2009 Price Stability Report Sources: SORS, Bank of Slovenia
2004 2005 2006 2007 2008 Sep � Sep � Sep �
real growth, %
GDP 4.3 4.5 5.8 6.8 3.5 -6.7 -4.7 1.6 -0.3 1.7 -1.3Employment 0.3 -0.2 1.5 3.0 2.8 -2.7 -0.1 -2.6 -1.9 -0.4 -0.9Disposable income* 4.3 2.9 4.2 5.6 4.2 -1.4 -0.9 -3.1 -4.2 1.5 -0.6Average employee compensation 7.8 5.6 5.3 6.4 7.0 2.4 -0.1 1.0 -2.7 3.6 -0.3Productivity 4.0 4.7 4.2 3.7 0.7 -4.1 -4.7 4.3 1.7 2.1 -0.4ULC (nominal) 3.7 0.9 1.0 2.6 6.2 6.8 4.9 -3.2 -4.3 1.5 0.1
Contribution to GDP growth percentage pointsDomestic demand, excluding change in inventories 3.5 3.0 4.9 6.8 4.3 -7.8 … 1.9 … 1.7 …Net exports -0.5 2.2 0.2 -1.8 -0.1 2.4 1.5 -0.8 -0.3 -0.1 0.2Inventories 1.3 -0.7 0.7 1.9 -0.7 -1.4 … 0.5 … 0.1 …
20112009 2010Projections

BANKA SLOVENIJE
28Economic Trends and the Labour Market PRICE STABILITY REPORT
the gradual slowing of the contraction and certain signs of an improving economic climate in Slovenia, the overall decline in GDP will remain significant. Considerable downward revisions have been made to GDP projections for this year, with GDP growth expected to gradually strengthen over the next two years, but to remain rather low.
Real GDP was down 9.3% in year-on-year terms in the second quarter of this year, the breakdown in the decline on the expenditure side tracking that of the first quarter, with a sharp decline in exports and im-ports, and an even more pronounced drop in invest-
ment. The decline in GDP is in line with the sharp drop in economic growth in the EU and with the significant con-traction in euro area activity, the deepest seen since the 1970s. Gross investment recorded the steepest year-on-year decline in real terms in the second quarter at 36.7%, gross fixed capital formation having declined 27.3% in real terms. International trade has fallen sharply on a global level due to effects of the financial turmoil, which can also be seen in figures for Slovenia's trade with the rest of the world. The balance of trade made a positive contribution of 3.1 percentage points to economic growth in the second quarter owing to the significantly sharper year-on-year decline in imports (down 24.8%) than ex-
1.72.8
4.02.8
4.43.6
5.4
3.6
4.9 4.5
5.8
4.3
6.8
3.5
-6.7
1.6
-8
-6
-4
-2
0
2
4
6
8
96 97 98 99 00 01 02 03 04 05 06 07 08 09 10 11-8
-6
-4
-2
0
2
4
6
8
March 2009 projections
year-on-year, %
Figure 3.2: GDP growth projections
Source: SORS, Bank of Slovenia projections
-30
-25
-20
-15
-10
-5
0
5
10
15
20
2005 2006 2007 2008 2009-30
-25
-20
-15
-10
-5
0
5
10
15
20
GDPgross fixed capital formationhouseholdsgovernment
year-on-year growth, %
Sources: SORS; Bank of Slovenia calculations
Figure 3.1: Domestic demand and GDP
Table 3.2: GDP and components of demand in Slovenia and the rest of the world
* 16 countries, ** 27 countries Source: Eurostat, SORS
Q3 Q4 Q1 Q2 Q3 Q4 Q1 Q2 Q3 Q4 Q1 Q2 Q3 Q4 Q1 Q2 Q3 Q4 Q1 Q2 Q3 Q4 Q1 Q2
Euro area* 0.5 -1.7 -4.9 -4.7 0.0 -0.7 -1.4 -0.8 2.3 2.5 2.6 2.2 -1.0 -5.5 -11.0 -10.9 1.4 -6.7 -16.6 -17.1 1.1 -3.8 -12.9 -14.4EU** 0.7 -1.7 -4.8 -4.8 0.4 -0.6 -1.9 -1.7 2.5 2.6 1.9 1.2 -1.0 -5.6 -11.2 -11.6 1.7 -5.9 -15.6 -16.4 1.3 -4.2 -13.6 -15.3US 0.0 -1.9 -3.3 -3.9 -0.7 -1.8 -1.5 -1.8 3.0 3.1 1.9 2.5 -3.9 -7.6 -15.5 -17.2 5.4 -3.4 -11.6 -15.2 -3.3 -6.8 -16.2 -18.6Japan -0.3 -4.5 -8.3 -6.5 0.7 -0.2 -2.7 -1.0 0.5 0.1 0.6 0.9 -4.8 -7.8 -14.1 -14.7 4.0 -12.9 -36.3 -29.3 -0.1 2.6 -15.3 -17.1Slovenia 3.9 -0.8 -8.3 -9.3 0.6 1.1 0.2 -2.6 4.6 5.0 3.8 4.3 4.5 -5.3 -22.5 -27.3 4.2 -6.2 -20.8 -21.3 3.0 -6.6 -22.1 -24.8
year-on-year change, %, seasonally adjusted and adjusted for number of working days
GDP Private consumption Government
spending 2009 2009 2009 2009
Gross investment Exports Imports
2008 2008 2008 2008 2008 20082009 2009

BANKA SLOVENIJE
Economic Trends and the Labour MarketPRICE STABILITY REPORT 29
ports (down 21.3%). Domestic consumption was down sharply in the second quarter, household consumption having contracted by 2.6%. Government spending was up 4.3% in year-on-year terms in the second quarter, a continuation of the growth recorded in the previous two quarters. The sectoral breakdown of the decline in total value-added was similar to that from the first quarter.
Following the favourable economic climate in recent years and a decline over the last three quarters, eco-nomic activity returned to the level recorded at the end of 2006, while quarterly growth strengthened slightly in the second quarter. The level of economic activity recorded a cumulative contraction of nearly 10% over the final quarter of last year and the first half of this year. The slight rise in economic activity in the second quarter, which was based primarily on an improved net trade position, a smaller decline in inventories and in-creased government spending, reflects the still weak con-ditions in the international environment. According to re-leased figures, the sharpest year-on-year decline in GDP was recorded in the second quarter. Taking into account such weak figures for the first half of this year, the rela-tively moderate negative growth from the spring projec-tions is no longer likely; this year's growth will very likely be lower than the euro area average.
In the context of low demand, falling orders and de-clining production, inventories fell sharply and con-tributed significantly to the fall in GDP during the first half of the year. Following such a sharp fall, it is
Table 3.3: Components of domestic demand
�: Difference between current projections and projections in March 2009 Price Stability Report Source: SORS, Bank of Slovenia
2004 2005 2006 2007 2008 Sep � Sep � Sep �
real growth, %Domestic demand 4.8 2.3 5.6 8.6 3.5 -9.0 -6.2 2.4 -0.1 1.8 -1.6Private consumption 2.7 2.6 2.9 6.7 2.0 -1.8 -2.7 -0.4 -1.8 2.1 0.1Government spending 3.4 3.4 4.0 0.7 6.2 3.4 1.3 0.9 -1.2 0.6 -1.9Gross investment 5.6 3.7 9.9 11.7 7.7 -25.2 … 8.3 … 1.8 …
20112009 2010Projections
1.8 1.5 1.5 1.63.5
1.1-0.9 -0.2 1.1
-1.9
2.20.20.4 0.6
0.60.8
1.9 1.3
0.92.5
3.1
2.1
-7.5
1.9 0.5
0.6 1.3
-0.7
0.7
1.9
-0.7
-1.4
0.5 0.1-0.1-0.8
2.4-0.1
-1.8-0.50.1
0.2
0.61.1
0.1 1.6
2.84.3 4.5
5.8
6.8
3.5
-6.7
1.7
-12-10
-8-6-4-202468
1012
2003 2004 2005 2006 2007 2008 2009 2010 2011-12-10-8-6-4-2024681012
inventoriesgross fixed capital formationgovernment spendingnet tradeprivate consumptionGDP
Figure 3.4: Contributions to GDP growth by components of spending
percentage points
Source: SORS, Bank of Slovenia projections
-30
-25
-20
-15
-10
-5
0
5
10
15
2006 2007 2008 2009-30
-25
-20
-15
-10
-5
0
5
10
15
SloveniaEU27Germany
Figure 3.3: Industrial production
Source: Eurostat, Bank of Slovenia calculations
y-o-y growth, %; figures adjusted for the number of working days

BANKA SLOVENIJE
30Economic Trends and the Labour Market PRICE STABILITY REPORT
highly likely that inventories will strengthen some-what by the end of the year. Following a trend of rising growth in inventories since 2005 in line with relatively high average economic growth, which led to the accumu-lation of a high volume of inventories, the decline in the volume of inventories contributed significantly to the con-traction in economic activity in the first quarter of this year. A cyclical decline in inventories began back in the final quarter of last year. However, it is difficult to reliably assess to what extent a downward adjustment is still nec-essary. This assessment is also made difficult by the con-tinuing decline in new orders. It is therefore logical to ex-pect that new output will be at a very low level, likely re-sulting in a very slow increase in inventories. The decline in inventories is also present in other euro area countries this year, the decline in Slovenia having contributed nearly 4 percentage points to the estimated average 8.8% year-on-year fall in GDP over the first half of the year. The decline in industrial inventories in the second quarter slowed relative to the first quarter, which in-creases the likelihood of a gradual reversal in the inven-tory growth rate. Assuming a gradual economic recovery in Slovenia's major trading partners and a gradual in-crease in production, the baseline scenario projects that the decline in inventories will contribute an average of -1.4 percentage points to year-on-year economic growth.
The breakdown of the contraction in value-added over the first half of the year was similar to that re-corded at the end of last year, certain sectors having recorded a particularly sharp drop during the afore-mentioned period. In recent months some indicators point to a stabilisation and the possibility of growth in activity over the next short-term period. Manufac-turing recorded the sharpest year-on-year decline in value-added over the first half of the year, of 21.3%. Hav-ing recorded the highest growth in recent years, value-added in construction was down nearly 13% in year-on-year terms during the first half of 2009. Falling industrial orders from the rest of the world, the low levels of indica-tors of the economic situation and a fresh fall in con-
sumer confidence indicate that economic trends will re-main very weak until the end of the year. A sharp drop in value-added in the first half of the year was recorded by both corporates that depend on domestic demand and by those that produce primarily for foreign markets. Along-side a sharp drop in manufacturing and construction, value-added was also down by around 12% in the retail sector. The financial intermediation sector recorded aver-age growth in value-added of more than 8% during the first half of the year, slightly outpacing the growth re-corded in healthcare, education and public administra-tion.
Government spending and foreign trade are expected to make a positive contribution to economic growth in 2009. Final consumption was down 1% in year-on-year terms in the second quarter of this year, the year-on-year drop in household consumption of 2.6% contributing most to this decline. Relatively high growth in public expendi-ture is expected to make a positive contribution to eco-nomic growth in 2009, while still relatively unfavourable financing conditions and the weak external economic climate will affect the slow recovery in gross investment, similar to the first half of the year. The drop in domestic investment, together with rising unemployment, is contrib-uting to the non-utilisation of existing capacities. It will
Figure 3.5: Contributions to year-on-year GDP growth by components
-10-8-6-4-202468
10
1999
2000
2001
2002
2003
2004
2005
2006
2007
2008
09Q1
09Q2
percentage points
net taxes on productsservicesconstructionindustry excluding constructionagriculture, hunting and fishingGDP
Source: SORS, Bank of Slovenia calculations

BANKA SLOVENIJE
Economic Trends and the Labour MarketPRICE STABILITY REPORT 31
During the financial turmoil and economic crisis, EU Member States, including Slovenia, have adopted a number of meas-ures to shore up demand and confidence, with the aim of mitigating the negative effects of the current economic condi-tions. Alongside the functioning of automatic stabilisers, which themselves had contributed to the widening of general gov-ernment deficits in EU Member States, governments have also adopted a number of measures to support the financial system, the economy and households. According to esti-mates from June's European Commission report1, Member States are expected to earmark 13% of GDP and approve additional funds in the amount of 31% of GDP to prop up the banking sector. The majority of measures relate to guaran-tees for bank liabilities, while other notable measures include liquidity support, capital injections and relief for impaired as-sets. Governments have also adopted a number of measures relating to support of the labour market, household purchas-ing power and incentives for the corporate sector. The effec-tiveness of the measures will depend on several factors, in-cluding the timeliness of their implementation, and their focus and sustainability, as well as the size of fiscal multipliers and the openness of economies. Euro area economic activity was down a further 0.1% in current terms in the second quarter, while expectations regarding this year's economic growth stabilised under the influence of the adopted measures. Nev-ertheless, uncertainties regarding future developments re-main high.
The first measures relating to the financial system were aimed at maintaining trust in and the stability of the financial system, as a condition for its smooth functioning, and thus at the transfer of savings from surplus sectors to deficit sectors of the economy. Last year EU Member States opted for unlimited or increased guarantees for bank deposits in the minimum amount of EUR 50,000 until the end of 2010. This measure was crucial, as it has contributed to maintaining financial stability and rebuilding confidence in the financial sector and the economy in general during a period of height-ened uncertainty and doubt. In August this year the Slovenian government adopted a draft revision to the Banking Act, which will permanently raise the amount of guaranteed de-posits to the net amount of EUR 50,000 in Slovenia, while an unlimited guarantee will remain in effect until the end of 2010.
By mid-September Slovenian banks had taken limited advan-tage of available government measures aimed at stimulating the functioning of the financial markets and lending. The maximum amount of Slovenian government guarantees was set at EUR 12 billion. EUR 1.2 billion in government guaran-tees for loans with a maturity of between one and 10 years are available to banks in the framework of the guarantee scheme for lending to corporates and cooperatives. During the first three tenders, EUR 80 million of the EUR 310 million in guarantees allocated to banks by the government was used. The total amount of lending that banks included in the guarantee scheme reached EUR 257 million. This means that the government assumed on average less than one-third of the risk in an individual transaction. The readiness or needs of bank customers for this type of lending in the current condi-tions likely had a significant impact on the extent of guaran-tees used. Nevertheless, figures for July and August indicate a slight increase in corporate lending relative to the second quarter. On the basis of the guarantee scheme, an additional EUR 50 million in guarantees was approved in September, in which the government assumed a maximum of 35% of the risk. So far in the scope of available measures, two banks have issued government-guaranteed bonds: in mid-July NLB d.d. issued a three-year bond in the amount of EUR 1.5 bil-lion, while Abanka Vipa issued a three-year bond in the amount of EUR 500 million in September. In the middle of July a guarantee scheme for individuals in the amount of EUR 350 million was approved, and is aimed at the most disadvantaged groups of the population that meet the legally prescribed conditions: guarantees in the amount of EUR 300 million are earmarked for temporary workers and young fami-lies seeking to buy their first home, whereby the government assumes the risk in the amount of 50% of the loan, while EUR 50 million in guarantees is earmarked for those that have lost their job since 1 October 2008. Banks that approve loans with a lower total effective interest rate will be given priority in the allocation of guarantees. The first loans within this guarantee scheme should be available to households in October. All of the aforementioned measures are limited in duration, and will be implemented until 31 December 2010, or until all available funds have been exhausted.
A significant portion of measures in Slovenia are aimed at preserving jobs, and thus household income. Their ultimate
Box 3.1: Government measures and the impact of state (fiscal) measures on projections

BANKA SLOVENIJE
32Economic Trends and the Labour Market PRICE STABILITY REPORT
effect will depend on the pace of economic recovery. Labour market measures are aimed at mitigating the adverse effect of the fall in foreign demand on output and employment due to high economic and social costs that are linked to long-term unemployment, and that mean the loss of human capital. Typically, unemployment benefits automatically undergo a sharp rise in unfavourable economic conditions. Payments of unemployment benefits in Slovenia were up 69% in year-on-year terms during the first half of this year. During the same period, the importance and funding of active employment policy programmes have also risen. The government adopted additional labour market measures given the current condi-tions, the key measure being January's adoption of the Partial Subsidisation of Full-Time Employment Act. By the beginning of September, 701 companies with 60,939 employees were included in the measure, fewer than originally estimated. The measure was enhanced by another new measure, the Partial Reimbursement of Payment Compensation Act. By the begin-ning of September, 211 companies with 8,951 employees were included in the measure. Employees must attend train-ing while they are temporarily laid-off. The number of employ-ees is gradually declining, despite the aforementioned meas-ures, while the number of unemployed is rising. Through sub-sidisation measures, the government has for now succeeded in somewhat easing this negative trend, thus helping to pre-serve household income.2 To what extent these two meas-ures have slowed the adjustment of employment and the need for structural adjustment will be seen in the coming months.
Slovenia has issued three bonds this year in the total amount of EUR 4 billion. In line with the amended financing pro-grammes, the funds have been earmarked to finance the implementation of the budget, to finance crisis related meas-ures and to advance financing of the repayment of principals of government sector debt. In the scope of these measures, the government has deposited a portion of the proceeds from the bond issues at banks, and has extended the maturity of government bank deposits to three years in line with the new Public Finance Act. The large volume of new borrowing has had a significant impact on the general government debt, which will considerably exceed 30% of GDP this year. As a result, interest expense will rise significantly in the coming years, as EUR 671 million (around 1.8% of GDP) is expected to be earmarked to service the public debt in 2011, according
to the guidelines for the 2010-2011 budget, compared with EUR 361 million (around 1% of GDP) earmarked for that pur-pose in 2009. In line with the rules approved by Eurostat, the majority of measures to prop up the banking system will be treated as a financial transaction (an impact on the debt, and not on the deficit), or as an implicit liability (no impact on the debt or deficit). In the national accounts, guarantees have no impact on the general government deficit or debt, or only have an effect if a guarantee is exercised. Due to the large volume of guarantees in EU Member States, monitoring of these guarantees will begin during autumn reporting on the general government deficit and debt. For this reason, the monitoring of data will also be important for Slovenia.
With regard to public finances, a priority in the domestic and international institutional environment will be the formation of an exit strategy, taking into account the economic position and the size of the general government deficit and debt. The monitoring of implicit liabilities, which have risen sharply in the last year, will also be necessary. According to current esti-mates, the general government deficit will reach around 6% of GDP this year. Thus Slovenia will become one of the coun-tries in excessive deficit procedures. Therefore, the priority of public finances is to return to the framework set out in the Stability and Growth Pact. In its assessment of Slovenia's Stability Programme update of April this year, in July the EU Council proposed that Slovenia implement measures to sup-port the economy this year, to gradually abolish public finance stimulus in 2010 and to achieve increased consolidation in 2011. It also proposed measures to ensure the sustainability of public finances, particularly with regard to the pension sys-tem. In line with government guidelines, fiscal adjustment in Slovenia should be based on limiting growth in expenditure. In the scope of preparation of the budgets for 2010 and 2011, the government has introduced fiscal rule, whose aim is to maintain unchanged budget expenditure in nominal terms until 2011. To achieve this objective, the government began negotiations with public sector unions to reach agreement on unchanged total wage expenditure next year in nominal terms. Given the imbalance seen this year, in the coming
1 European Commission: Public Finances in EMU, June 2009.
2 Also adopted was the Special Allowance for the Socially Disadvantaged Act, based on which the most socially disadvantaged are paid a special allowance in an amount ranging from EUR 80 to EUR 200. EUR 15 million is envisaged for this measure.

BANKA SLOVENIJE
Economic Trends and the Labour MarketPRICE STABILITY REPORT 33
therefore be some time yet before economic activity re-turns to the level of supply potential, estimates of which are highly uncertain in the current conditions. The contri-bution of net trade is expected to be positive in 2009, as imports have declined faster than exports in the context of lower domestic demand.
Household consumption was down more than 1% in year-on-year terms over the first six months of this year, and is expected to follow a similar trend during the second half of the year. According to the baseline projections, household consumption is expected to lag behind the decline in GDP in the future, and gradually stabilise and strengthen in line with labour market conditions. The continued decline in private sec-tor wage growth due to the contraction in output and in-creasingly less favourable labour market conditions will be an important factor in household consumption this year. Accordingly, consumer confidence indicators were down sharply in the first half of the year, most notably the assessment of the economic situation in Slovenia. Con-sumer expectations regarding future economic trends have also deteriorated. Similar trends in confidence indi-
cators are also characteristic of other EU Member States. Still tight lending conditions, negative wealth effects and possible further tax burdens are also acting to dampen household consumption.
Real disposable income is expected to fall this year due to low nominal wage growth and falling employ-ment, but is expected to gradually stabilise. The level of disposable income is contracting notably this year due to declining average earnings, but even more so due to lower employment, particularly in the private sector. Fal-ling inflation this year and its subdued growth over the projection horizon are having a favourable effect on real disposable income. Total net wages, which represent the majority of disposable income, were up around 5% in year-on-year terms over the first six months of 2009, while certain other components of disposable income are recording significant growth, particularly social transfers due to rising unemployment. The number of registered unemployed rose further in the second quarter, the figure exceeding 88,000 at the end of August. The number of social transfer recipients among households rose during the first half of the year due to continued growth in unem-
-4
-2
0
2
4
6
8
10
2006 2007 2008 2009-4
-2
0
2
4
6
8
10
household consumptiondisposable income indicator*
real year-on-year growth, %
* Adjusted by HICP deflator.Source: SORS; Bank of Slovenia calculations
Figure 3.7: Household consumption and disposable income
-60
-50
-40
-30
-20
-10
0
10
20
30
40
-60
-50
-40
-30
-20
-10
0
10
20
30
40
2006 2007 2008 2009
confidence in manufacturing sectorconfidence in service sectorconsumer confidenceeconomic climate indicator
Figure 3.6: Seasonally adjusted confidence indicators
percentage points
Source: SORS
years fiscal consolidation must exceed the minimum require-ment of the Stability and Growth Pact regarding the improve-ment of the structural deficit in the amount of 0.5% of GDP
annually. Relatively rapid consolidation would preserve Slove-nia's credibility on the international financial markets.
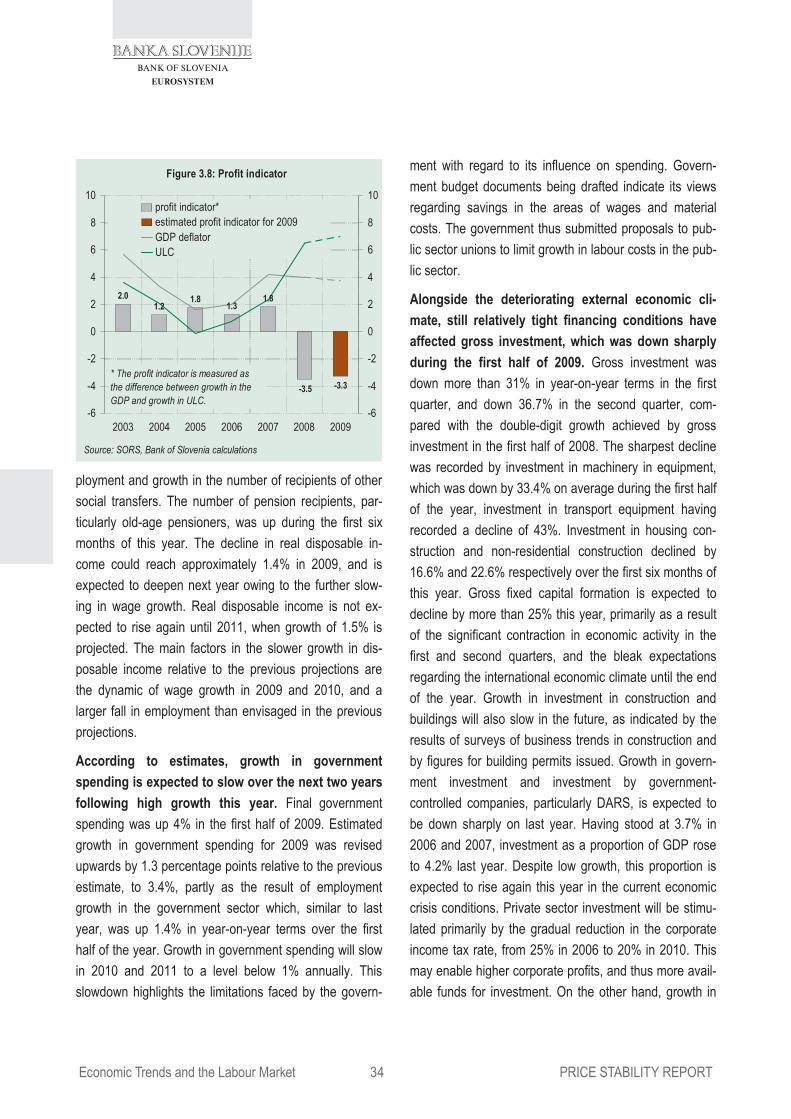
BANKA SLOVENIJE
34Economic Trends and the Labour Market PRICE STABILITY REPORT
ployment and growth in the number of recipients of other social transfers. The number of pension recipients, par-ticularly old-age pensioners, was up during the first six months of this year. The decline in real disposable in-come could reach approximately 1.4% in 2009, and is expected to deepen next year owing to the further slow-ing in wage growth. Real disposable income is not ex-pected to rise again until 2011, when growth of 1.5% is projected. The main factors in the slower growth in dis-posable income relative to the previous projections are the dynamic of wage growth in 2009 and 2010, and a larger fall in employment than envisaged in the previous projections.
According to estimates, growth in government spending is expected to slow over the next two years following high growth this year. Final government spending was up 4% in the first half of 2009. Estimated growth in government spending for 2009 was revised upwards by 1.3 percentage points relative to the previous estimate, to 3.4%, partly as the result of employment growth in the government sector which, similar to last year, was up 1.4% in year-on-year terms over the first half of the year. Growth in government spending will slow in 2010 and 2011 to a level below 1% annually. This slowdown highlights the limitations faced by the govern-
ment with regard to its influence on spending. Govern-ment budget documents being drafted indicate its views regarding savings in the areas of wages and material costs. The government thus submitted proposals to pub-lic sector unions to limit growth in labour costs in the pub-lic sector.
Alongside the deteriorating external economic cli-mate, still relatively tight financing conditions have affected gross investment, which was down sharply during the first half of 2009. Gross investment was down more than 31% in year-on-year terms in the first quarter, and down 36.7% in the second quarter, com-pared with the double-digit growth achieved by gross investment in the first half of 2008. The sharpest decline was recorded by investment in machinery in equipment, which was down by 33.4% on average during the first half of the year, investment in transport equipment having recorded a decline of 43%. Investment in housing con-struction and non-residential construction declined by 16.6% and 22.6% respectively over the first six months of this year. Gross fixed capital formation is expected to decline by more than 25% this year, primarily as a result of the significant contraction in economic activity in the first and second quarters, and the bleak expectations regarding the international economic climate until the end of the year. Growth in investment in construction and buildings will also slow in the future, as indicated by the results of surveys of business trends in construction and by figures for building permits issued. Growth in govern-ment investment and investment by government-controlled companies, particularly DARS, is expected to be down sharply on last year. Having stood at 3.7% in 2006 and 2007, investment as a proportion of GDP rose to 4.2% last year. Despite low growth, this proportion is expected to rise again this year in the current economic crisis conditions. Private sector investment will be stimu-lated primarily by the gradual reduction in the corporate income tax rate, from 25% in 2006 to 20% in 2010. This may enable higher corporate profits, and thus more avail-able funds for investment. On the other hand, growth in
2.01.2
1.81.3
1.8
-3.5 -3.3
-6
-4
-2
0
2
4
6
8
10
-6
-4
-2
0
2
4
6
8
10
2003 2004 2005 2006 2007 2008 2009
profit indicator*estimated profit indicator for 2009GDP deflatorULC
Source: SORS, Bank of Slovenia calculations
* The profit indicator is measured as the difference between growth in the GDP and growth in ULC.
Figure 3.8: Profit indicator

BANKA SLOVENIJE
Economic Trends and the Labour MarketPRICE STABILITY REPORT 35
profits, and thus corporate investment spending, will be limited by unpaid operating liabilities and difficulties in raising loans, which derive from tightened financing con-ditions that are the result of increased risk premiums on the international financial markets and due to the cumula-tive level of debt.
Labour market
The decline in the workforce in employment and the number of paid working hours during the first half of the year indicate the labour market's rapid response in the private sector to the sharp decline in economic activity. Following the significant decline in foreign trade and activity in the manufacturing sector at the end of last year and the beginning of this year, the economic crisis was also strongly reflected in a fall in employment in the majority of other private sector activities. Having risen by more than 2% in year-on-year terms in the final quarter of last year, the workforce in employment in the private sec-tor was down 3.8% in year-on-year terms in June 2009. Year-on-year employment growth in the government sec-tor in the first half of the year mitigated the fall in total employment, which stood at 2.6% in June. The economic crisis was also reflected in the average number of paid
working hours per employee, which was down 1.8% in year-on-year terms over the first half of the year. The negative labour market trends eased in the second quar-ter and at the beginning of the third quarter, as indicated by a slowing decline in the workforce in employment, and thus slowing growth in unemployment. The number of people moving from unemployment to employment was also up sharply.
Employment began to decline back in the third quar-ter of last year in manufacturing, the sector most ex-
-40-35-30-25-20-15-10
-505
10152025303540
-40-35-30-25-20-15-10-50510152025303540
2006 2007 2008 2009
workforce in employment in manufacturingworkforce in employmentregistered unemployment
Figure 3.9: Workforce in employment and registered unemployment
year-on-year change, thousands
Source: SORS, Employment Service, Bank of Slovenia calculations
-140-120-100
-80-60-40-20
020406080
100120
-7-6-5-4-3-2-10123456
2006 2007 2008 2009
workforce in employment – private sector(right scale)workforce in employment – public sector(activities O to R, right scale)deregistered unemployed persons –transition to employmentnewly registered unemployed persons
Figure 3.10: Labour market
year-on-year change, %
Source: SORS, Employment Service, Bank of Slovenia calculations
-3
-2
-1
0
1
2
3
4
-3
-2
-1
0
1
2
3
4
2000 2001 2002 2003 2004 2005 2006 2007 2008 2009
agriculture and fishing industryconstruction servicespublic sector
Source: SORS (national accounts), Bank of Slovenia calculations
Figure 3.11: Contributions to employment growth by sector
percentage points

BANKA SLOVENIJE
36Economic Trends and the Labour Market PRICE STABILITY REPORT
posed to international competition, while the decline accelerated over the first half of this year in the con-text of the deepening economic crisis. Thus in the second quarter, there were 10% or 22,700 fewer employ-ees in manufacturing compared with a year earlier. Em-ployment was down in all manufacturing sub-sectors, except in pharmaceuticals and in the production of coke and refined petroleum products. In addition to the manu-facture of textiles, clothing and leather goods, where the decline in employment has been intense for several years, the largest fall in employment was recorded in export-oriented sectors, such as the manufacture of rub-ber and plastic products, and the manufacture of motor vehicles and electric and other machinery and equip-ment. The fall in employment in export-oriented sectors contributed more than 50% to the overall decline in em-ployment in manufacturing over the first half of the year. In other private sector activities, the decline in employ-ment was intense in transport and storage, and also in agriculture, where the decline was sharper than in previ-ous years. Manufacturing also recorded the sharpest fall in the average number of paid working hours per em-ployee, of 4.5% in year-on-year terms over the first half of the year, which is in part linked to the prevalent propor-tion of industrial companies included in the scheme to subsidise shorter working hours.
Deteriorating labour market conditions were also re-flected in a declining number of registered job vacan-cies and persons entering employment. The growing proportion of part-time jobs in both categories indi-cates the excess supply of labour, which is further increasing labour market flexibility. The fall in the number of job vacancies deepened, particularly in the first quarter, while the number of job vacancies was down just under two-fifths in year-on-year terms over the first eight months of the year. The largest declines were re-corded in manufacturing, retail, transport and storage and real estate. Temporary employment is becoming increas-ingly prevalent due to the excess supply of labour and the uncertain economic conditions. Temporary positions as a
proportion of all job vacancies had risen from an average of 74.5% in 2008 to 78.0% by the second quarter of this year, the proportion rising to 82.0% by August also owing to seasonal factors. The number of persons entering em-ployment has also recorded a similar trend, the year-on-year decline having eased in the second quarter due to the quarterly increase in temporary employment of 4.1%. This dynamic, however, did not improve in July and Au-gust. In the second quarter, the proportion of temporary employees was up more than 1 percentage point on the 2008 average, to 79.4%, and up to 82.2% by August. Having declined sharply in the final quarter of last year, the proportion of unfilled job vacancies, measured as the ratio of the number of new hires to the number of newly registered job vacancies, began to rise towards the end of the first half of 2009.
This year government measures have mitigated the decline in the workforce in employment, which is somewhat reducing households' risk of loss of earn-ings. By the end of August 61,000 employees were in-cluded in the measure to partly subsidise full-time em-ployment, which entered into force in February. With the entry into force of the amended Partial Subsidisation of Full-Time Employment Act on 25 July, the deadline for the submission of applications for subsidies was ex-
-50
-40
-30
-20
-10
0
10
20
30
0
2
4
6
8
10
12
14
16
2006 2007 2008 2009
registered job vacancies*new employment*vacancies as a proportion of unemployed persons (rhs)
Source: Employment Service, Bank of Slovenia calculations
Figure 3.12: Job vacancies and actual employment
%, 3-month moving average; *year-on-year growth
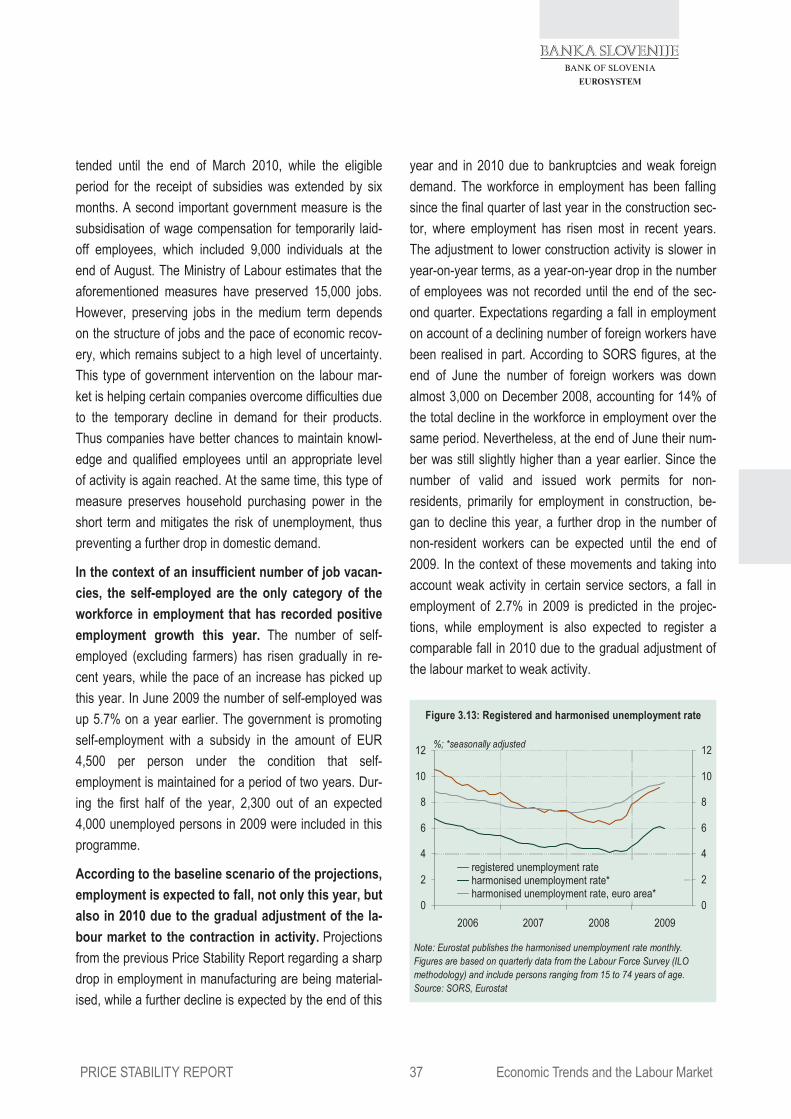
BANKA SLOVENIJE
Economic Trends and the Labour MarketPRICE STABILITY REPORT 37
tended until the end of March 2010, while the eligible period for the receipt of subsidies was extended by six months. A second important government measure is the subsidisation of wage compensation for temporarily laid-off employees, which included 9,000 individuals at the end of August. The Ministry of Labour estimates that the aforementioned measures have preserved 15,000 jobs. However, preserving jobs in the medium term depends on the structure of jobs and the pace of economic recov-ery, which remains subject to a high level of uncertainty. This type of government intervention on the labour mar-ket is helping certain companies overcome difficulties due to the temporary decline in demand for their products. Thus companies have better chances to maintain knowl-edge and qualified employees until an appropriate level of activity is again reached. At the same time, this type of measure preserves household purchasing power in the short term and mitigates the risk of unemployment, thus preventing a further drop in domestic demand.
In the context of an insufficient number of job vacan-cies, the self-employed are the only category of the workforce in employment that has recorded positive employment growth this year. The number of self-employed (excluding farmers) has risen gradually in re-cent years, while the pace of an increase has picked up this year. In June 2009 the number of self-employed was up 5.7% on a year earlier. The government is promoting self-employment with a subsidy in the amount of EUR 4,500 per person under the condition that self-employment is maintained for a period of two years. Dur-ing the first half of the year, 2,300 out of an expected 4,000 unemployed persons in 2009 were included in this programme.
According to the baseline scenario of the projections, employment is expected to fall, not only this year, but also in 2010 due to the gradual adjustment of the la-bour market to the contraction in activity. Projections from the previous Price Stability Report regarding a sharp drop in employment in manufacturing are being material-ised, while a further decline is expected by the end of this
year and in 2010 due to bankruptcies and weak foreign demand. The workforce in employment has been falling since the final quarter of last year in the construction sec-tor, where employment has risen most in recent years. The adjustment to lower construction activity is slower in year-on-year terms, as a year-on-year drop in the number of employees was not recorded until the end of the sec-ond quarter. Expectations regarding a fall in employment on account of a declining number of foreign workers have been realised in part. According to SORS figures, at the end of June the number of foreign workers was down almost 3,000 on December 2008, accounting for 14% of the total decline in the workforce in employment over the same period. Nevertheless, at the end of June their num-ber was still slightly higher than a year earlier. Since the number of valid and issued work permits for non-residents, primarily for employment in construction, be-gan to decline this year, a further drop in the number of non-resident workers can be expected until the end of 2009. In the context of these movements and taking into account weak activity in certain service sectors, a fall in employment of 2.7% in 2009 is predicted in the projec-tions, while employment is also expected to register a comparable fall in 2010 due to the gradual adjustment of the labour market to weak activity.
0
2
4
6
8
10
12
0
2
4
6
8
10
12
2006 2007 2008 2009
registered unemployment rateharmonised unemployment rate*harmonised unemployment rate, euro area*
Note: Eurostat publishes the harmonised unemployment rate monthly. Figures are based on quarterly data from the Labour Force Survey (ILO methodology) and include persons ranging from 15 to 74 years of age.Source: SORS, Eurostat
Figure 3.13: Registered and harmonised unemployment rate
%; *seasonally adjusted

BANKA SLOVENIJE
38Economic Trends and the Labour Market PRICE STABILITY REPORT
During the second quarter of 2009 the number of reg-istered unemployed reached the level recorded in 2006, the period prior to the peak of the economic cycle, while unfavourable trends are expected to con-tinue in 2010. There were 88,106 registered unemployed in August, up 45.2% on a year earlier. According to AJPES figures, in the first half of the year, long-term re-dundancies and the number of unemployed due to bank-ruptcies recorded the sharpest growth as a proportion of newly registered unemployed, while there was no signifi-cant year-on-year change in the proportion of unem-ployed due to the expiry of temporary employment con-tracts. Unemployment recorded the highest growth in the
first quarter, the negative growth later easing. A more rapid rise in the number of unemployed can again be expected in autumn. The number of unemployed actually fell slightly in August in current terms, but the seasonal effect was significantly weaker than in previous years. The number of unemployed is expected to begin rising again, particularly in October, in part due to the seasonal effect of an increased number of person searching for their first job following the completion of studies. The reg-istered unemployment rate exceeded 9% at mid-year, an increase of 2.7 percentage points in year-on-year terms. The survey unemployment rate and the harmonised un-employment rate were up slightly less, by 1.4 percentage
Table 3.4: Labour cost indicators
1 Labour costs include gross wages (SORS), other employment earnings (AJPES), employers' social security contributions and payroll taxes (MoF) 2 National accounts
3 Output per employee - average of the last 10 years: 3.2% Output per employee in the manufacturing sector - average of the last 10 years: 5.8% Unit of output is defined as real GDP/employment and in manufacturing sector as value added in manufacturing/employment in manufacturing; source of data are national accounts Source: SORS, AJPES, Ministry of Finance; Bank of Slovenia calculations
2004 2005 2006 2007 2008 Q208 Q308 Q408 Q109 Q209nominal year-on-year growth, %
Gross wages 5.7 3.6 4.8 5.9 8.3 8.6 9.9 7.1 5.4 4.6
private sector 7.2 3.7 5.5 6.8 7.9 9.4 9.3 4.9 2.7 1.6
public sector 2.7 3.1 3.4 4.0 9.8 6.9 11.8 13.4 12.1 11.5
manufacturing sector 7.2 5.8 5.6 6.9 7.6 9.7 9.3 3.4 0.0 -0.5Labour costs per employee1 7.2 2.1 5.1 4.7 6.3 6.2 6.8 5.2 3.3 1.0
Other employment earnings per employee 14.5 -6.9 9.8 3.2 2.8 1.9 -2.4 2.8 -3.6 -8.6
Gross wages per unit of output 1.7 -1.0 0.5 2.2 7.6 6.1 8.8 10.5 15.6 13.5Gross wages per unit of output (trend)3 2.5 0.4 1.6 2.7 5.1 5.4 6.7 3.9 2.2 1.4
Gross wages per unit of output in the manufacturing sector 1.8 0.0 -3.3 0.0 8.7 6.1 9.6 13.4 19.0 15.9Gross wages per unit of output in the manufacturing sector (trend)3 1.4 0.0 -0.2 1.1 1.9 3.9 3.5 -2.4 -5.9 -6.3Unit labour costs1 3.1 -2.5 0.8 1.0 5.5 3.8 5.7 8.6 13.2 9.6Unit labour costs (trend)1,3 4.0 -1.1 1.8 1.5 3.1 3.0 3.6 2.0 0.0 -2.2Compensation of employees per unit of output2 3.7 0.8 1.0 2.7 5.9 6.5 8.9 10.5 15.0 11.3
Output per employee 4.0 4.7 4.2 3.7 0.7 2.3 1.0 -3.1 -8.8 -7.8
Output per employee - manufacturing sector 5.4 5.8 9.2 6.9 -1.0 3.4 -0.2 -8.8 -16.0 -14.2HICP 3.7 2.5 2.5 3.8 5.5 6.4 6.2 3.1 1.7 0.6GDP deflator 3.4 1.6 2.1 4.2 3.8 4.4 3.6 3.0 3.4 2.9

BANKA SLOVENIJE
Economic Trends and the Labour MarketPRICE STABILITY REPORT 39
points to 5.6% and 1.7 percentage points to 6.1% respec-tively. According to the projections, the survey unemploy-ment rate is expected to exceed 6% this year, and rise to above 7% in 2010.
Having declined in the final quarter of last year, aver-age labour productivity fell further during the first half of 2009, as the number of employees is only gradually adjusting to weaker activity. The decline in labour productivity reached its low in the first quarter, when output per employee was down 8.8% in year-on-year terms. Despite a relatively rapid decline in the num-ber of workers, productivity in manufacturing was down 16.0% in the first quarter in the context of a sharp decline in output. With the stabilisation in output in current terms, the negative year-on-year growth in productivity eased in the second quarter in the context of a continued fall in employment. Output per employee in manufacturing was up 12.8% in current terms in the second quarter in the context of a 3.9% fall in the number of employees relative to the first quarter, slowing the year-on-year fall to 14.2%. This also contributed to a smaller decline in labour pro-ductivity in the economy as a whole, which was down 7.8% in year-on-year terms in the second quarter. A fur-ther easing of the negative year-on-year growth in pro-ductivity is expected until the end of the year owing to the continuing fall in employment and the expected gradual recovery of the economy.
Alongside the gradual fall in employment, the econ-omy has also responded to the recession by adjust-ing labour costs in most private sector activities. Growth in labour costs eased in the final quarter of last year in line with the contraction in activity, while the eas-ing has accelerated sharply with the deepening of the economic crisis. Growth in labour costs per employee fell to 1.0% in year-on-year terms in the second quarter of this year, and was down 5.2 percentage points on a year earlier. Having stood at 7.0 percentage points in the third quarter of last year, the contribution of wages to overall growth in labour costs fell to 3.2 percentage points in the second quarter of this year. This is in line with lower wage
growth in the private sector, where wages in manufactur-ing and in financial and insurance services were already down on a year earlier during the second quarter. Growth in labour costs is also lower due to the abolition of payroll tax, which will contribute around 1 percentage point to the lower growth in labour costs this year. Low dynamics in other employment earnings, whose negative contribution to growth in labour costs increased to 1.7 percentage points in the second quarter, will also contribute to lower labour costs.
-4-2
0246
81012
1416
-4-2
0246
81012
1416
2002 2003 2004 2005 2006 2007 2008 2009
employers' social contributionspayroll taxesother earnings from employmentgross wages
Source: SORS, AJPES, Ministry of Finance, Bank of Slovenia
Figure 3.14: Contributions to growth in labour costs per employee
percentage points
2.6
-3.2
6.8
1.5
3.7
0.9 1.0
6.2
4.5
-6
-4
-2
0
2
4
6
8
03 04 05 06 07 08 09 10 11-6
-4
-2
0
2
4
6
8
ULCproductivityaverage compensation per employee
growth, %
Figure 3.15: Unit labour costs
Source: SORS (national accounts), Bank of Slovenia calculations

BANKA SLOVENIJE
40Economic Trends and the Labour Market PRICE STABILITY REPORT
Despite easing growth in nominal labour costs, growth in unit labour costs in the first quarter was up compared to the end of 2008, before beginning to decline as the year progressed. At 13.5% in the second quarter, year-on-year growth in gross wages per unit of output was down 2.1 percentage points on the first quar-ter. Growth in gross wages per unit of output in manufac-turing was up nearly one-fifth in year-on-year terms in the first quarter, and eased slightly in the second quarter to stand at 15.9%, in line with the year-on-year decline in wages and the stalling level of production. Having jumped to 13.2% in the first quarter, overall growth in labour costs latter approached the level of the final quarter of last year when growth stood at 8.6%. Nevertheless, according to Eurostat figures growth remains high relative to the euro area average, which is bringing a deterioration in the Slovenian economy's international competitiveness. The latest developments signal rising risks of wage growth.
Since the onset of the economic crisis, gradual ad-justment in unit labour costs has resulted in a slower fall in core inflation than would be expected on the basis of the decline in demand. However, indicators adjusted for cyclical trends do indicate adjustments to the harsher conditions, which is vital in terms of maintaining the cost competitiveness of the Slove-nian economy. In the second half of 2008 growth in unit labour costs began to outpace the GDP deflator, the larg-est gap of 9.9 percentage points being achieved in the first quarter of this year. The gap fell to 6.7 percentage points in the second quarter. The unit labour cost trend indicates the inflationary effect of labour costs if eco-nomic growth were close to the long-term average. This indicator began improving back in the final quarter of last year, and had turned negative by the second quarter of 2009, to stand at -2.2%, due to sharply lower growth in labour costs. The indicator of gross wages per trend unit of output also began declining as a result of significantly lower growth in gross wages, and was down 3.7 percent-age points on the average from 2008 by the second quar-ter at 1.4%, its lowest level since 2005. In the manufac-
turing sector, in the second quarter of this year the nega-tive value of this indicator deepened for the third con-secutive quarter.
Public sector wage growth is expected to outstrip private sector wage growth by around 5 percentage points this year, while wage growth in both sectors is expected to be around the same in 2010. Assumptions regarding public sector wage growth have been cut con-siderably compared with the previous Price Stability Re-port. In line with the bases for the drafting of the budget for 2010 and 2011, wage increases of 6.6%, 0.9% and 3.2% were assumed for 2009, 2010 and 2011 respec-tively. Agreement is expected to be reached in negotia-tions between the government and union representatives with regard to how public sector wage growth will be ad-justed to the new macroeconomic conditions. Following January's implementation of the second phase of the changeover to the new wage system, public sector wage growth exceeded 11% in the first half of the year. Growth is expected to fall sharply in the second half of the year on account of base effects linked to the first phase of the changeover to the new wage system last August, and also due to the non-payment of performance bonuses and the decreased amount of performance bonuses for the increased volume of work, which were part of the
-2
0
2
4
6
8
10
12
14
16
-2
0
2
4
6
8
10
12
14
16
2006 2007 2008 2009
totalmanufacturingpublic sector (activities O to R)private sector
Figure 3.16: Nominal gross wages
year-on-year growth, %; 3-month moving average
Source: SORS, Bank of Slovenia calculations

BANKA SLOVENIJE
Economic Trends and the Labour MarketPRICE STABILITY REPORT 41
government's saving measures adopted this February. The postponement of further public sector wage in-creases until a period of more favourable macroeconomic conditions is necessary to ensure the sustainability of public finances: in the first half of this year alone, wages and other public sector employee expenditure were up 14.2% or EUR 245 million (1.4% of GDP over the same period) in year-on-year terms, in the context of a 7.4% drop in general government revenues in the consolidated balance.
Private sector wages have begun to adjust rapidly to the harsher macroeconomic conditions, while the low growth is expected to continue in 2010 and result in a sharp downturn in unit labour costs. In the second quarter of this year, nominal growth in the average gross wage was down 7.8 percentage points on the same pe-riod in 2008 at 1.6%, due to the unfavourable economic conditions. Low growth is also expected in the future, as this year’s year-end bonuses are expected to be lower than last year's due to poor business results. Moreover, only partial implementation of the envisaged 2.3% rise in the basic wage set out in May 2008 collective agreement is expected this August. There will be no wage adjust-ment in January 2010 as previously envisaged, due to low actual and expected inflation. This year's contraction in economic activity will also have a negative effect on wage growth in 2010.

BANKA SLOVENIJE
42Economic Trends and the Labour Market PRICE STABILITY REPORT
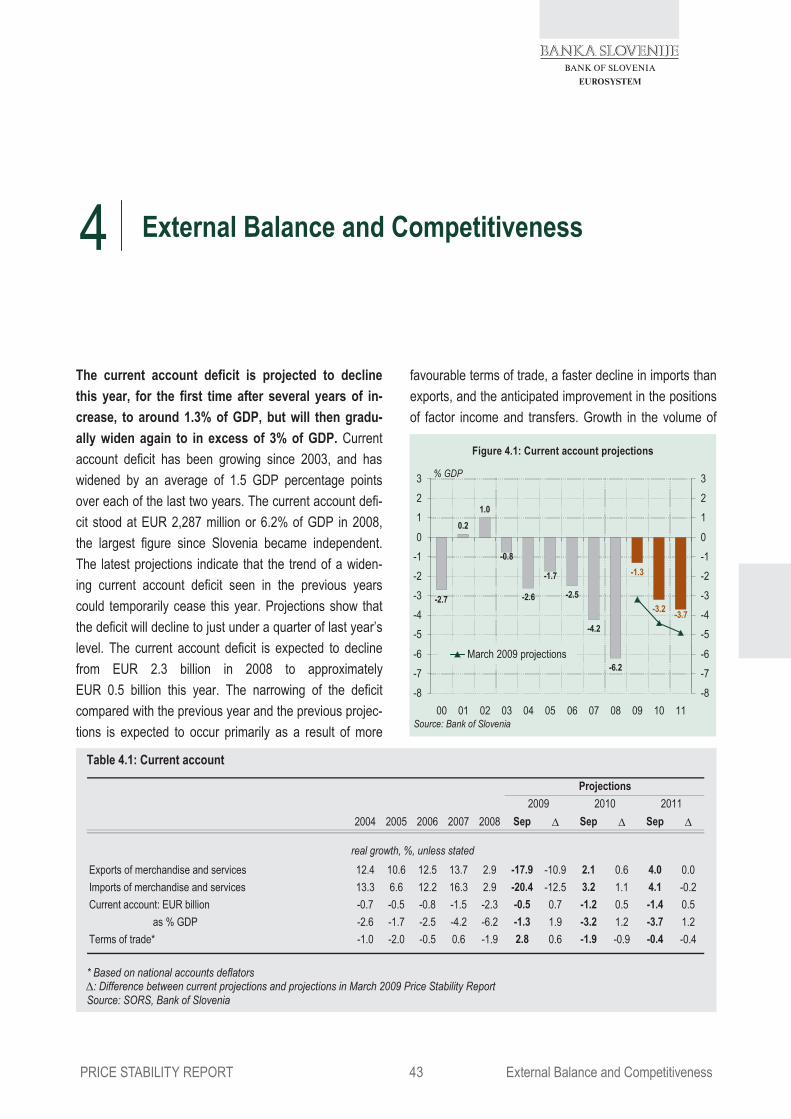
BANKA SLOVENIJE
External Balance and CompetitivenessPRICE STABILITY REPORT 43
The current account deficit is projected to decline this year, for the first time after several years of in-crease, to around 1.3% of GDP, but will then gradu-ally widen again to in excess of 3% of GDP. Current account deficit has been growing since 2003, and has widened by an average of 1.5 GDP percentage points over each of the last two years. The current account defi-cit stood at EUR 2,287 million or 6.2% of GDP in 2008, the largest figure since Slovenia became independent. The latest projections indicate that the trend of a widen-ing current account deficit seen in the previous years could temporarily cease this year. Projections show that the deficit will decline to just under a quarter of last year’s level. The current account deficit is expected to decline from EUR 2.3 billion in 2008 to approximately EUR 0.5 billion this year. The narrowing of the deficit compared with the previous year and the previous projec-tions is expected to occur primarily as a result of more
favourable terms of trade, a faster decline in imports than exports, and the anticipated improvement in the positions of factor income and transfers. Growth in the volume of
4 External Balance and Competitiveness
Table 4.1: Current account
* Based on national accounts deflators �: Difference between current projections and projections in March 2009 Price Stability Report Source: SORS, Bank of Slovenia
2004 2005 2006 2007 2008 Sep � Sep � Sep �
real growth, %, unless statedExports of merchandise and services 12.4 10.6 12.5 13.7 2.9 -17.9 -10.9 2.1 0.6 4.0 0.0Imports of merchandise and services 13.3 6.6 12.2 16.3 2.9 -20.4 -12.5 3.2 1.1 4.1 -0.2Current account: EUR billion -0.7 -0.5 -0.8 -1.5 -2.3 -0.5 0.7 -1.2 0.5 -1.4 0.5 as % GDP -2.6 -1.7 -2.5 -4.2 -6.2 -1.3 1.9 -3.2 1.2 -3.7 1.2Terms of trade* -1.0 -2.0 -0.5 0.6 -1.9 2.8 0.6 -1.9 -0.9 -0.4 -0.4
20112009 2010Projections
-2.6 -2.5
-4.2
-6.2
-3.2
-1.3
0.21.0
-0.8
-3.7
-1.7
-2.7
-8-7-6-5-4-3-2-10123
00 01 02 03 04 05 06 07 08 09 10 11-8-7-6-5-4-3-2-10123
March 2009 projections
% GDP
Figure 4.1: Current account projections
Source: Bank of Slovenia

BANKA SLOVENIJE
44External Balance and Competitiveness PRICE STABILITY REPORT
imports and exports has remained negative in 2009, and has been revised sharply downwards compared with this year’s spring projections, in line with the rapid decline in foreign demand and domestic import demand. Growth in the volume of imports and exports is expected to rise in the coming years, but only in 2011 will it exceed the rate of 2008.
According to forecasts, the largest revisions relative to the most recent projections from this March will occur this year, as the recession is expected to fur-ther reduce both foreign and domestic demand, while year-on-year growth in foreign trade is expected to become sharply negative. After declines of more than 20% in imports and just under 18% in exports in 2009, growth in both is then expected to again be positive, but well below the past rates. The projections for 2009 have been revised sharply downwards from the spring projec-tions. The revisions for 2010 and 2011 are only minor. A major factor in this year’s significant decline in trade is the decline in the re-export of road vehicles, which in 2007 accounted for approximately 5.7% of total exports. Although re-export’s impact on the contribution made by trade to GDP is neutral, given the presumed decline of one-half in the level of these transactions, growth in im-ports and exports could decline further by just under 3 percentage points. Domestic manufacturing that is closely tied to the manufacture and export of intermediate goods is also suffering from the sharp blow of the eco-nomic crisis. Intermediate goods recorded the largest decline among all categories of goods exports in the first half of the year, by more than a third. The question is whether all manufacture of intermediate goods will revive at the end of the crisis, as often large companies take the opportunity in an economic crisis to replace their manu-facturing partners. Price factors will also have a profound effect in reducing the deficit in trade in goods and ser-vices and in the current account. The terms of trade, which deteriorated by just over 2 percentage points last year, are expected to improve cumulatively by just under
1 percentage point during the projection horizon, as a result of fall in energy prices, food prices and other com-modity prices. Given the uncertainties on the energy mar-kets, projections of the terms of trade are exposed to a high level of risk, as are forecasts of the development in net factor income, in which developments on global finan-cial markets are the main factor.
The deficit in goods trade this year and next year is expected to decline sharply compared with both 2008 and the previous projections, and will be the most important factor in the improvement in the current account. The goods trade deficit in 2009 is expected to decline by just over two-thirds from the 2008 figure of EUR 2.7 billion to EUR 1.0 billion or 2.9% of GDP. The improvement is expected to primarily be the result of more favourable terms of trade, and also the relatively larger year-on-year real decline in the pace of goods im-ports than that of exports. In the coming years, growth in goods trade will gradually rise in line with the projected improvement in the international economic activity, and on the export side will move in line with growth in foreign demand. Alongside the lower growth in exports of goods,5 another factor in the slow growth in goods imports will be the decline in industrial production and domestic demand,
5 Manufacture for export depends strongly on imports, as each additional unit of export requires 0.7 units of import on average.
-100
-80
-60
-40
-20
0
20
40
60
-100
-80
-60
-40
-20
0
20
40
60
2006 2007 2008 2009
new orders, foreign market, real*survey on business trends - expected imports**survey on business trends - export orders**
*year-on-year growth, %; **seasonally adjusted balances
Figure 4.2: Export orders
Source: SORS
BANKA SLOVENIJE
External Balance and CompetitivenessPRICE STABILITY REPORT 45
with lower household demand being accompanied by a very moderate investment demand, which had previously been the most dynamic domestic component in GDP growth. Growth in imports and exports of goods is ex-pected to gradually increase after 2009, and over the next two years will range from 3% to 4% on the import side and 2% to 4% on the export side.
Alongside a decline in the costs of servicing the ex-ternal debt, another significant factor in the narrow-ing of the current account deficit is the estimated improvement in the terms of trade. Average euro-denominated oil prices this year are expected to be down over a third on last year’s average. Based on these fore-casts, and assumption of a fall of 16.4% in commodity prices and low inflation in the euro area, import prices are expected to fall by 5.8%, and export prices by 3.1%. The estimated positive effect of the terms of trade in goods and services on the current account is expected to amount to just over EUR 0.7 billion in 2009, which ex-plains more than a third of the decline in the current ac-count deficit compared with 2008. In the context of the projected gradual rise in energy prices and commodity prices, the terms of trade are expected to deteriorate by just under 2% in 2010, and by a further 0.4% in 2011.
The surplus of trade in services is expected to remain a long-term factor in the narrowing of the current ac-count deficit over the projection horizon, even if growth in both imports and exports of services tem-porarily declines this year. The factors affecting growth in imports and exports of services are similar to those affecting trade in goods. A decline in economic activity and lower foreign demand will have the greatest indirect impact on services that are closely linked to goods trade. Of major importance among these are transport services and business and technical services. The most notewor-thy of the latter are foreign trade intermediation, services linked to the handling of goods (receiving, forwarding and warehousing) and other services, associated with the promotion of goods. As a result of a significant slowdown in growth in construction investments, particularly in civil
engineering work, revenues and, above all, expenditure from investment work in Slovenia is also expected to de-cline in the coming years. The financial turmoil and eco-nomic crisis and the anticipated decline in consumer pur-chasing power in Slovenia’s most important trading part-ners is likely to also result in a decline in revenues from tourism. The number of foreign visitors and the number of overnight stays in the first seven months of the year were down around 10% in year-on-year terms. Among main trading partners, only the number of tourists arriving from Italy recorded an increase (3%), while the numbers of tourists arriving from Austria (4%), Germany (15%) and, most of all, France (17%) all fell. Because the crisis brings an increased uncertainty and a decline in dispos-able income in the context of falling employment also in Slovenia, year-on-year growth in tourism expenditure is also declining. Over the first seven months of the year the year-on-year decline was 3%. Given the aforementioned factors, tourism exports could decline by around 11%, a third less than the decline in goods trade. Compared with the previous projections, growth in exports of services is expected to be 8 percentage points lower in 2009 and unchanged in 2010, while growth in imports is expected to be 13 percentage points lower in 2009 and just under 1 percentage point higher in 2010. After 2009, the posi-
1.9
-1.0-2.1
-0.4-1.9
-0.6-2.1
0.60.3
-3.6
1.82.8
0.80.7
-6
-3
0
3
6
9
12
15
98 99 00 01 02 03 04 05 06 07 08 09 10 11-6
-3
0
3
6
9
12
15terms of trade in %export prices of goods and servicesimport prices of goods and services
growth, %
Figure 4.3: Terms of trade
Source: SORS (national accounts), Bank of Slovenia calculations
BANKA SLOVENIJE
46External Balance and Competitiveness PRICE STABILITY REPORT
tive dynamic in trade in services is expected to continue in the coming years. Strengthening investment at home and in the rest of the world means that growth in services is once again expected to outpace that of trade in goods from next year. Should these developments be realised, the surplus of trade in services, which reached a record 4.6% of GDP in 2008, would decline to 4.1% of GDP this year, and would remain around this level until the end of the projection horizon.
The deficit in factor income has widened rapidly in the last few years, primarily as a result of an increas-ing net external debt and rising interest rates until autumn last year. The deficit in factor income stood at EUR 300 million in 2005, but by 2008 had risen more than three-fold to around EUR 1 billion, or 2.8% of GDP. In 2009 the deficit is expected to narrow by over a fifth to EUR 800 million, or 2.2% of GDP. In the next two years the deficit is expected to again widen gradually, reaching about 2.8% of GDP by the end of the projection horizon. In the context of a rise in the employment of foreign work-ers in Slovenia, net labour income has been declining for several years. In 2007 it was down more than a half on the previous year, and in 2008 there was already a net outflow of EUR 4 million. The unfavourable economic conditions at home and in the rest of the world will also have an impact on net labour income, which in the next two years is expected to deteriorate even more than pro-jected in March, recording a net outflow of around 0.1% of GDP. The economic downturn means that companies in Slovenia have begun to lay off foreign workers, many of whom are employed in the construction sector and at companies primarily manufacturing goods for export. These developments will also have an impact on labour income, which will decline on the expenditure side. Rising unemployment in the euro area will have an impact on the receipt side. Among the individual factor income items, there has been an increase in the net outflow of capital income in recent years, as a result of FDI, in-creased borrowing in the rest of the world, and the rise in interest rates on global financial markets until the final
quarter of last year. Interest payments to the rest of the world rose the most on the expenditure side. The rela-tively rapid change from net claims of EUR 0.9 billion at the end of 2005 to a net external debt of EUR 9.8 billion at the end of 2008, and the rise in interest rates on global financial markets were the main factors in the increase in net interest payments during this period. As a result of debt repayment by commercial banks the gross external debt has been declining gradually since October 2008. By the end of this June it had fallen by EUR 2.7 billion from its peak of EUR 40.3 billion in October 2008. The decline in the external debt, and the fall in interest rates on global financial markets as a result of central bank measures to mitigate the adverse effects of the financial turmoil and economic crisis meant that interest payments to the rest of the world in the first half of the year were down EUR 241 million in year-on-year terms at EUR 327 million. Companies under foreign ownership have been increasing their repatriation of profit to parent companies in the rest of the world since 2005. The distribution of profit by companies under majority foreign ownership was slightly more favourable in the first half of the year, 52% of the profit of EUR 310 million being repatriated, and 42% reinvested in the companies. Despite the financial turmoil, among capital income items only receipts from investments in securities have recorded a net inflow this year. Receipts from investments in securities in the first half of the year were down 15% in year-on-year terms, while expenditure was up 15%. Both inward and outward FDI are projected to decline sharply. The decline in eco-nomic activity is also expected to be reflected in the re-turn on FDI, and the net outflow of income from FDI is therefore expected to decline from EUR 470 million in 2008 to around EUR 380 million this year, but is then expected to increase to around EUR 440 million by the end of the projection horizon. Here the current trends in the repatriation of dividends and distributed profit from outward FDI are expected to continue over the projection horizon, with the exception of this year. Despite the ex-pected lower returns, income from investments in foreign

BANKA SLOVENIJE
External Balance and CompetitivenessPRICE STABILITY REPORT 47
debt securities is also expected to act to reduce the defi-cit in factor income in the future. At the end of last year the stock of investments in foreign debt securities was more than twice in excess of the stock of inward invest-ments in domestic debt securities. As a result of govern-ment borrowing via bond issues on the foreign market and bank borrowing on the basis of the government guar-antee scheme, this ratio can be expected to narrow in the future.
The net outflow in current transfers to the rest of the world in the first half of the year was down over a third in year-on-year terms at EUR 100 million. In the context of a smaller increase on the expenditure side, the largest year-on-year increase this year has been re-corded by receipts from official transfers, which were up EUR 35 million at EUR 216 million, reducing the deficit by EUR 25 million to EUR 90 million. The majority of official transfers relate to payments of taxes and social security contributions, and, on the receipt side, subsidies on goods and other output. Flows with the EU budget ac-count for a significant proportion of official transfers. In the first half of the year the realisation of the inflows esti-mated in the 2009 budget revision was 28.5% on the re-ceipt side, and 54.1% on the expenditure side. On the expenditure side there was above-average realisation in the payments for the UK rebate (65%) and the adjust-ments for the Netherlands and Sweden (81%), while on the receipt side 54% of the expected EU funding for the Common Agricultural Policy and 49% of funding for cohe-sion policy were realised. The net position of Slovenia’s state budget against the EU budget in the first half of the year was EUR 4.5 million in surplus. The projections of the net position against the EU budget take into account the figures from the budget memorandums for 2008 and 2009, which envisaged receipts of 1.56% of GDP and expenditure of 1.13% of GDP, equivalent to a net surplus of around EUR 150 million a year. Given the previous experience of realisation, particularly on the receipt side, this surplus was adequately reduced so that the position of receipts and expenditure related to the EU budget is
estimated to be approximately balanced or slightly in sur-plus over the projection horizon. Official transfers other than the net position against the EU budget are expected to record a net deficit of around EUR 100 million each year over the projection horizon. The total deficit in trans-fers amounted to 0.6% of GDP in 2008, but is expected to decline to 0.2% of GDP in 2009 and to remain around this level in the coming years.
Price competitiveness and cost competitiveness indicators
The harmonised competitiveness indicator of the index of the nominal effective exchange rate of the domestic currency has displayed a trend of apprecia-tion in both monthly and year-on-year terms this year, under the influence of large fluctuations in ex-change rates on international financial markets. In 2008 the euro rose most against the pound sterling (by 18.1%), while it depreciated against the US dollar (by 13.3%), the yen (by 25.1%) and the Swiss franc (by 7.3%). In the first seven months of the year the index of the nominal effective exchange rate appreciated by 0.7%. Almost the entire appreciation in the domestic currency has been generated by the end of the first quarter, the
-5
-4
-3-2
-1
0
1
23
4
5
-5
-4
-3-2
-1
0
1
23
4
5
2006 2007 2008 2009
gap between growth in domestic and foreign pricesreal effective exchange rate (HICP)nominal effective exchange rate
Figure 4.4: Harmonised national competitiveness indicators (for 41 countries and 15 euro area countries)
year-on-year growth, %
Source: ECB

BANKA SLOVENIJE
48External Balance and Competitiveness PRICE STABILITY REPORT
overall appreciation then remaining around the same level overall in the next months, as April’s large deprecia-tion of 0.4% was followed by a large appreciation of 0.3% in June. The main factors in this year’s appreciation of the index of the nominal effective exchange rate was the US dollar’s fall of 5.2% against the euro and the yen’s fall of 9.0% against the euro, while over the same period the euro rose by 1.3% against the Swiss franc and 4.3% against the pound sterling. After rising in the first quarter, the year-on-year appreciation in the harmonised index of the nominal effective euro exchange rate fell to 0.1% in April, but rose rapidly in the subsequent months to reach 0.6% by July.
The real effective exchange rate appreciated at the end of last year and the beginning of this year. The real effective exchange rate as measured by unit labour costs in the total economy appreciated by 11.3% in year-on-year terms in the first quarter, the largest quarterly appreciation in the observation period. An early indication of these developments came in the second half of last year as the financial turmoil turned into an economic cri-sis, by the adverse turn in productivity and the rise in unit labour costs per employee. After recording a depreciation of 0.5% in the final quarter of last year, the indicator of the real effective exchange rate as measured by the GDP
deflator again recorded a year-on-year appreciation in the early part of this year, of 1%.
The indicator of the price competitiveness of the Slovenian economy as measured by consumer prices (HICP) has tracked the movements in the index of the nominal effective exchange rate this year, although between May and July its year-on-year appreciation was half that of the latter. The indicator of price com-petitiveness as measured by consumer prices appreci-ated by 1.1% in the first seven months of the year. The main factor in the appreciation in the real effective ex-change rate in that period was the rise in the nominal effective exchange rate of the domestic currency, while domestic prices growing faster than the basket of foreign prices accounted for over a third of the appreciation. As a result of the high basis in the first half of last year, the indicator of the price competitiveness of the Slovenian economy recorded a year-on-year appreciation of 0.3% in July, half that of the simultaneous appreciation of 0.6% in the nominal effective exchange rate, which means that growth in domestic prices was 0.3 percentage points slower than the simultaneous growth of the basket of foreign prices during the same period.
The indicator of price competitiveness in Slovenia has revealed a deterioration in competitiveness this
-6
-4
-2
0
2
4
6
-6
-4
-2
0
2
4
6
2006 2007 2008 2009
SloveniaAustriaItalyGermanyFrance
year-on-year growth, %
Figure 4.6: Harmonised price competitiveness indicators(for 41 countries and 15 euro area countries)
Source: ECB
* The HICP is used as a deflator in the calculation for EU Member States, while the CPI is used for other countries.
-4
-2
0
2
4
6
8
10
12
14
-4
-2
0
2
4
6
8
10
12
14
2006 2007 2008 2009
unit wage costs - manufacturing*unit labour costs - total economy**GDP deflator**export deflator*
year-on-year growth, %
Figure 4.5: Competitiveness indicators
Source: European Commission, ECB
* against other EU27 countries (EC)** against 21 countries and other euro area countries (ECB)

BANKA SLOVENIJE
External Balance and CompetitivenessPRICE STABILITY REPORT 49
year, relative to Slovenia’s most important trading partners. After recording a depreciation in the second half of last year, the indicator of price competitiveness against euro area countries appreciated in the early part of this year, and improved in relative terms between May and July. The monthly appreciation in June was the same as in Slovenia at 0.3% in France and Austria, but higher than Slovenia in Germany (at 0.5%). The depreciation in July stood at 0.1% in Slovenia, France and Italy, and 0.2% in Austria and Germany. There are slightly larger differences between Slovenia and the main trading part-ners in the year-on-year comparisons. Slovenia recorded a year-on-year appreciation in July, while the index of the real effective exchange rate as measured by the HICP or CPI in the main euro area trading partners averaged a year-on-year depreciation of 0.8%. Although Slovenia was the only country to record a year-on-year apprecia-tion in the index of the real effective exchange rate over the first seven months of the year, between April and July this indicator depreciated relative to the main trading part-ners. In Slovenia the year-on-year appreciation rose by 0.4 percentage points between April and July, while the year-on-year depreciation in the main trading partners declined by between 0.8 and 1.1 percentage points dur-ing the same period. The smaller year-on-year apprecia-tion in the price competitiveness indicator in Slovenia relative to the main trading partners is a reflection of year-on-year growth in prices in Slovenia being relatively slower than growth in the basket of foreign prices in the main trading partners, assuming that the effect of the
nominal effective exchange rate is the same.
The developments of price competitiveness indica-tors can also reflect the effects of long-term real con-vergence, which are neutral as far as competitive-ness is concerned. In Slovenia these effects have been relatively moderate since 1995, the long-term trend of appreciation in the real effective exchange rate being taken into consideration. The same assessments can be made by analysing the movements in inter-sectoral rela-tive prices and productivity, which were illustrated in Oc-tober 2008 PSR. Deviations from the long-term trend indicate that there was a turn for the worse in 2007, when the appreciation exceeded the rate that could be related to the process of balanced long-term real convergence.
90
95
100
105
110
90
95
100
105
110
95 96 97 98 99 00 01 02 03 04 05 06 07 08 09
21 countries and 15 euro area countrieslong-term trend
Source: ECB, Bank of Slovenia calculations
Figure 4.7: Harmonised competitiveness indicator
1999Q1 = 100
* deflator: HICP
appreciation
depreciation

BANKA SLOVENIJE
50External Balance and Competitiveness PRICE STABILITY REPORT

BANKA SLOVENIJE
Financing ConditionsPRICE STABILITY REPORT 51
Financial flows with the rest of the world and external debt The narrowing of the savings-investment gap and the current account deficit has since the middle of 2008 indicated the limited possibility of financing the econ-omy via foreign saving. Having reached around 6% of GDP by the end of last year, the savings-investment gap of the economy as a whole had narrowed to less than 4% of GDP by the middle of this year. The savings-investment gaps of the private and public sectors moved in opposite directions during this period. While the private sector gap narrowed in the first half of the year, the sur-plus of investment over saving in the public sector in-creased sharply. The private sector savings-investment gap reached its lowest point in the middle of 2008, and then shrank by around 6 GDP percentage points by the middle of 2009. As the private sector faced tighter condi-tions on its financing from the rest of the world, counter-cyclical government measures aimed at raising spending increased the public sector deficit. The public sector gap as measured by the general government position moved from balanced in the middle of 2008 to a deficit of around 4% of GDP in the middle of 2009.
The smaller savings-investment gap is primarily the result of the significant decline in investment activity by the private sector. Gross investment in the first half of 2009 was down approximately a third in year-on-year terms, which in the context of saving by the private sector and due to the limited access to foreign resources con-
tributed to a narrowing of the national savings-investment gap. Private sector investment declined primarily in re-sponse to the deterioration in the economy, although the decline is also a consequence of excessive investment spending in the last few years.
The altered macroeconomic conditions and the rever-sal in the demand for financing domestic economic activity brought a change in the direction and size of financial flows with the rest of the world. Financing during this period thus proceeded primarily via a re-
5 Financing Conditions
* The public sector savings-investment gap is defined as the deficit in the consolidated public sector position using the ESA95 method-ology. Net borrowing from the rest of the world is defined as the negative of the current account position. The private sector savings-investment gap is the difference between the current account posi-tion and the public sector savings-investment gap.
-8
-6
-4
-2
0
2
4
6
8
-8
-6
-4
-2
0
2
4
6
8
2004 2005 2006 2007 2008 2009
rest of the worldpublic sectorprivate sector
Source: SORS, Bank of Slovenia calculations
Figure 5.1: Savings-investment gap*
% GDP, 1-year average

BANKA SLOVENIJE
52Financing Conditions PRICE STABILITY REPORT
Changes in risk and uncertainty on financial markets affect the behaviour of economic subjects, and thus economic activ-ity, in both the short term and the long term. This finding rests in part on financial accelerator theory,1 or the external finance premium. The external finance premium reflects the assess-ment of the risks that lenders associate with the borrower. The external finance premium depends mostly on the bor-rower’s financial situation. Should the borrower’s financial situation be weak, the external finance premium is raised, which can also lead to a further deterioration in the borrower’s financial situation as a result of the excessive cost of raising loans, by which means the action of the financial accelerator arises. Changes in the financing conditions deriving from changes in risk assessments can therefore strengthen the counter-cyclical effects of monetary policy, which acts on the economy via the so-called credit channel.
During the deepening of the financial turmoil in autumn 2008, risks and uncertainties rose sharply in all segments of finan-cial markets. There was therefore a rise in risk premiums, which form part of the external finance premium. This was seen in high financing costs for corporates, households and the government sector, which was reflected both in increased spreads between yields on high-risk and low-risk2 debt securi-ties and in increased fluctuation in securities prices. In the context of increasing spreads in all segments of the corporate financing market, the largest increases in risk or spread were
recorded by companies in the financial sector, and companies that held low credit ratings before the outbreak of the crisis. The current easing of uncertainty is typical of all market seg-ments, but in some segments the risks expressed as the spreads between high-risk and low-risk investments are al-ready smaller than they had been in the months before Sep-tember 2008.
Indicators point to an easing of risks on the interbank market. Because banks faced major write-downs of bad claims when the turmoil deepened, the solvency of certain financial institu-tions became uncertain. The propensity to lend on the inter-bank market therefore declined, which caused problems with obtaining liquidity, and the volatility of prices on the securities market increased at the same time. The result of these devel-opments was a flight to quality, from higher-risk investments to lower risk investments, which reduced yields on the most liquid government securities. As a result of the breakdown in trust between banks, the intermediation of funds between commercial banks was almost completely paralysed for some time, and the crisis then spread to the other segments of the financial system. The fall in the ECB’s interest rates and the provision of adequate quantities of liquidity helped to normal-ise the functioning of the interbank market, which was re-flected in part in a fall in interest rates on unsecured interbank loans and in spreads on the overnight swap. Since May 2009 the spread between the EURIBOR and the overnight swap
Box 5.1: Risks and uncertainties on financial markets
-50
0
50
100
150
200
250
300
-50
0
50
100
150
200
250
300
2007 2008 2009
Industrial AFinance A/A- Bank A Utility A
Figure 1: Spread between yields on bonds of specific sectors and 10-year Eurobonds
Source: Bloomberg, Bank of Slovenia calculations
basis points
0
200
400
600
800
1,000
1,200
0
200
400
600
800
1,000
1,200
2007 2008 2009
iTraxx Crossover3M OIS Spread
Figure 2: Risks on the interbank market
Source: Bloomberg, Bank of Slovenia calculations
basis points

BANKA SLOVENIJE
Financing ConditionsPRICE STABILITY REPORT 53
rate, the usual measure of risk on the interbank market, has been below the level seen before the financial turmoil deep-ened in autumn 2008. The spread currently stands at around 20 basis points, having averaged around 65 basis points over the first eight months of 2008.
Spreads in the yields on government bonds are also diminish-ing, but remain at a higher level than before the deepening of the financial turmoil. The financial turmoil brought an end to the trend of convergence in spreads on government bonds. Spreads in the yields on government bonds had previously rarely exceeded 30 basis points, even for bonds issued by
countries that had the largest deficits or public debt, but after the deepening of the turmoil in autumn 2008 these spreads rose sharply. The increasing differences in the spreads in the yields on government securities between euro area countries could be a reflection of increased credit risk and assessments of liquidity and the sustainability of public finances and macro-economic (im)balances. During the financial turmoil the spreads in the yields on the government bonds of euro area countries that market participants assess as being particularly vulnerable during the current conditions widened faster and more notably. The premia on Slovenian bond yields are in the lower reaches among comparable government bonds in the 10-year segment, and in the upper reaches in the 3-year seg-ment. The latter is a consequence of the 3-year bond being issued at the beginning of the year, when uncertainties on the markets were still very high. In recent months the differences between the spreads in the yields on government bonds have been diminishing, an indication of diminishing risk, although the spreads and the differences between the spreads remain larger than before the outbreak of the turmoil.
1 Bernanke, Ben S, Mark Gertler, Simon Gilchrist (1999), The Financial Accelerator in a Quantitative Business Cycle Framework, Handbook of Macroeconomics, Volume 1C, Handbooks in Economics, Volume 15. Am-sterdam: Elsevier, pp 1341-93.
2 Usually government securities. German government bonds are customar-ily used as the reference when interest rate spreads between euro area countries are calculated.
0
50
100
150
200
250
300
350
0
50
100
150
200
250
300
350
2007 2008 2009
GreecePortugalItalyIrelandSlovenia
Figure 3: Premium on 3-year government bonds over German bonds
Source: Bloomberg, Bank of Slovenia calculations
basis points
-50
0
50
100
150
200
250
300
350
-50
0
50
100
150
200
250
300
350
2007 2008 2009
GreecePortugalItalyIrelandSlovenia
Figure 4: Premiums on 10-year government bonds over German bonds
Source: Bloomberg, Bank of Slovenia calculations
basis points
0
200
400
600
800
1,000
1,200
1,400
0
200
400
600
800
1,000
1,200
1,400
2007 2008 2009
ItalyPortugalGreeceIrelandiTraxx CrossoverSlovenia
Figure 5: 5-year CDS and 5-year iTraxx Europe Crossover
Source: Bloomberg, Bank of Slovenia calculations
basis points

BANKA SLOVENIJE
54Financing Conditions PRICE STABILITY REPORT
duction of investments, and not via borrowing in the rest of the world. As a result of the high demand for financing via foreign saving, the net financial inflow in-creased in recent years, rising from around 3.4% of GDP in 2005 to approximately 6.5% of GDP in 2008. In 2009 there was a net financial outflow as a result of the rever-sal in access to financing via foreign resources, the out-flow amounting to EUR 104 million in the first quarter and EUR 100 million in the second quarter. The external li-abilities and external claims have both been declining since the middle of 2008, primarily as a result of the eco-
nomic slowdown, the difficulties in accessing financing in the rest of the world and the increased risk of investment in the rest of the world. The net financial outflow in 2009 is primarily the product of the net financial outflow of the private sector, which stood at EUR 900 million in the first quarter and EUR 1,676 million in the second quarter. The government sector recorded net financial inflows of EUR 441 million and EUR 1,162 million during the same peri-ods, primarily as a result of bond issues. The private sec-tor’s liabilities declined by EUR 534 million in the second half of 2008, while its claims declined by EUR 1,298 mil-lion. The private sector thus recorded a net inflow of EUR 764 million. In the first half of 2009 the private sector re-corded a net financial outflow of EUR 2,576 million, pri-marily as a result of a decline of EUR 2,706 million in liabilities, while claims declined by EUR 130 million.
The structure of the private sector’s financial flows in the first half of 2009 remained similar to that in the second half of 2008, but there was a sharp decline everywhere. Of the privates sector’s more important fi-nancial liabilities, there was a decrease in corporate loans from the rest of the world, which amounted to EUR 433 million in the second half of 2008 and EUR 264 mil-lion in the first half of 2009. Inward FDI declined, from EUR 766 million in the second half of 2008 to just EUR 50 million in the first half of 2009. While financial claims also declined in the first quarter of this year, by EUR 342 million, they increased by EUR 212 million in the second quarter. As in the second half of 2008, the main factor in the decline in the private sector’s claims in the first quarter was portfolio investments, in the amount of EUR 431 million, followed by loans to the rest of the world in the amount of EUR 277 million. By contrast, the main factors in the increase in financial claims in the sec-ond quarter were households’ holdings of currency and deposits in the rest of the world, and outward FDI, but these were the only items that remained in relatively sta-ble outflow during the period in question.
As a result of the diminished possibilities of financ-ing domestic economic activity via foreign saving,
-2.0-1.5-1.0-0.50.00.51.01.52.02.53.03.54.0
FDI portfolioinvestments
trade credits loans bankdeposits
-2.0-1.5-1.0-0.50.00.51.01.52.02.53.03.54.0
2007 / H22008 / H12008 / H22009 / H1
Figure 5.2: Financial liabilities to the rest of the world
flows, EUR billion
Source: Bank of Slovenia
-1.0-0.50.00.51.01.52.02.53.03.54.0
FDI portfolioinvestments
trade credits loans bankdeposits
-1.0-0.50.00.51.01.52.02.53.03.54.0
2007 / H22008 / H12008 / H22009 / H1
Figure 5.3: Financial claims against the rest of the worldflows, EUR billion
Source: Bank of Slovenia

BANKA SLOVENIJE
Financing ConditionsPRICE STABILITY REPORT 55
the increase in Slovenia’s net external debt ceased this year. The deepening financial turmoil and economic slowdown, which adversely affected financial flows with the rest of the world, was accompanied by a decline in Slovenia’s gross external claims and gross external debt. In August, just before the financial turmoil deepened, gross external claims stood at EUR 31.7 billion and the gross external debt at EUR 40.0 billion. Gross external claims had fallen to EUR 29.6 billion by the end of 2008 and to EUR 28 billion by the end of June 2009. Similarly, the gross external debt had fallen to EUR 39.1 billion by the end of 2008, and by a further EUR 1.5 billion to EUR 37.6 billion at the end of June 2009. Slovenia’s net exter-nal debt increased further until the end of last year, when it stood at EUR 9.8 billion, its growth ceasing afterwards.
The anticipated easing of conditions on the financial markets and in the global economy is expected to allow for the financing of the savings-investment gap over the projection horizon. The estimated need for financing domestic economic activity in 2009 is around EUR 0.5 billion, and around EUR 1.3 billion in both 2010 and 2011. The need for financing via foreign saving is expected to increase in the coming years simultaneous with the gradual recovery of domestic demand, as a re-sult of which a reversal in direction compared with the
first half of 2009 is expected, along with an increase in the size of financial flows with the rest of the world. The assessment of the feasibility of financing domestic eco-nomic activity via foreign saving in the baseline scenario relies on the hypothesis that conditions on the financial markets will ease over the projection horizon, and the remaining barriers in the intermediation of resources from banks to the rest of the economy will be eliminated, to which the economic policy measures adopted are ex-pected to contribute.
Lending activity and financing conditions
As a result of the tightened financial conditions on foreign financial markets, in the context of a decline in domestic lending, banks have primarily funded themselves this year by borrowing at the Eurosys-tem. The flow of lending to domestic sectors declined sharply in the first seven months of 2009 to EUR 660 million, compared with EUR 3,423 million in the same period last year. Borrowing at the Eurosystem in-creased significantly during this period, amounting to EUR 1,192 million in the first half of 2009. At the same time banks made net repayments of loans from the rest of the world, while deposits by non-residents also de-clined, by virtue of which banks made total debt repay-ments of EUR 2,308 million.
The decline in bank lending activity is a reflection of both supply-side factors and of diminished demand for lending. The decline in demand for lending is in line with the decline in economic activity, the stagnation of the real estate market and the increase in general economic uncertainty. At the same time the financial turmoil meant that conditions for obtaining bank funding on financial markets tightened, and the banks set stricter credit stan-dards for their clients because of increased credit risk. The stock of lending has remained almost unchanged this year, an indication that there is no fresh money flow-ing into the corporate sector.
-10
0
10
20
30
40
50
-10
0
10
20
30
40
50
2006 2007 2008 2009
net external debtexternal liabilitiesexternal claims
Figure 5.4: External debt
Source: Bank of Slovenia
EUR billion

BANKA SLOVENIJE
56Financing Conditions PRICE STABILITY REPORT
Year-on-year growth in bank lending to the private non-financial sector declined from 15% to less than 6% over the first seven months of the year. The de-cline was more the product of lower corporate lending than household lending. Corporate loans are very cycli-cal, as they are closely linked to investment activity, which declined by almost a third during the first half of the year. During the period of high economic growth lending to non-financial corporations outpaced lending to house-holds, and during the economic crisis its decline has also been faster. Year-on-year growth in lending to corporates thus stood at 5.7% in July, compared with a rate of 7.1% for households.
Interest rates on loans to non-financial corporations remained unchanged during the first seven months of 2009, despite the ECB cut its refinancing rate at four occations, while rates in the euro area declined overall. Interest rates on loans of more than EUR 1 mil-lion to non-financial corporations declined in the final quarter of 2008 in response to the fall in the ECB’s refi-nancing rate. Despite the multiple cuts in the ECB’s inter-est rates in 2009, interest rates on corporate loans have remained more or less unchanged at around 5%. This has widened the gap between corporate financing costs in Slovenia and those in the euro area overall, which has
been gradually increasing since the middle of 2007. The slower adjustment to the cuts in the ECB’s refinancing rate in Slovenia could reflect the increased stock of provi-sions held by Slovenian commercial banks and the trans-fer of the associated costs to their clients. The smaller decline in interest rates on loans in Slovenia compared with the euro area overall could also be connected to the shortening of average loan maturities in Slovenia. Short-term loans are more likely to carry a fixed interest rate than to be tied to the EURIBOR, as a result of which in-terest rate cuts by the ECB did not have as great an im-pact in Slovenia as in the euro area overall. At the same time real interest rates have risen in Slovenia as a result of falling inflation, while remaining more or less un-changed in the euro area overall in the context of falls in nominal interest rates and inflation. With inflation almost at zero, real interest rates have practically equalised with nominal rates, in both Slovenia and the euro area overall. The slower adjustment of interest rates in Slovenia than in the euro area overall entails a relatively higher cost burden for Slovenian corporates, in addition to being a factor that is limiting demand for lending.
The current macroeconomic trends and projections point to a gradual increase in year-on-year growth in lending in the coming years. Given the negative eco-
-2
0
2
4
6
8
10
12
-2
0
2
4
6
8
10
12
2005 2006 2007 2008 2009
Slovenia (real)*euro area (real)*Slovenia (nominal)euro area (nominal)
Figure 5.6: Interest rates on loans of more than EUR 1 million to non-financial corporations
* Real interest rates allowing for past inflation (3-month moving average).Source: ECB, Bank of Slovenia
For Slovenia: tolar loans to end of 2006, euro loans since 2007.
%
0
10
20
30
40
50
0
20
40
60
80
100
2000 2001 2002 2003 2004 2005 2006 2007 2008 2009
lending to private sector (y-o-y growth, left scale)ratio of lending to GDP** (right scale)
Figure 5.5: Lending to the domestic private sector
* Private sector comprises non-financial corporations, households and non-monetary financial institutions. ** Ratio of lending to the private sector to the 1-year moving average of nominal GDP.Source: Bank of Slovenia
%

BANKA SLOVENIJE
Financing ConditionsPRICE STABILITY REPORT 57
nomic growth forecast for 2009, year-on-year growth in lending to non-financial corporations can be expected to decline further or to stagnate until the end of the year, but lending will gradually accelerate in line with the recovery of economic growth in the coming years. These forecasts are very uncertain, given the current economic situation in Slovenia and globally.
The slowdown in housing lending is connected with a decline in volume on the real estate market,6 while the slowdown in consumer lending is in line with the movement in private consumption. Year-on-year growth in housing lending gradually declined over the first seven months of the year to stand at 17% in July, having stood at 40% at the beginning of 2008. Growth in con-sumer lending also declined over the same period, from around 30% at the beginning of 2008 to 8% in July 2009. The volume of trading on the real estate market contin-ued to decline in 2009, while prices fell by around 6.5% overall in the first half of 2009. The decline in year-on-year growth in consumer lending is in line with the move-ment in domestic private consumption, growth in which became negative in the first half of 2009.
Interest rates for financing household consumption declined in the first half of 2009, and in Slovenia were lower than the euro area average. The nominal interest rates on consumer loans have declined in line with the ECB’s interest rates since the final quarter of 2008, from 7.7% to 5.4% in July 2009. Real interest rates neverthe-less rose slightly in 2009 as a result of the sharp fall in inflation. The rise in real interest rates since the middle of 2008 is probably one of the reasons for the gradual slow-down in consumer lending during this period. The further significant slowdown in consumer lending in 2009 is also a reflection of other factors, in particular the lower credit-worthiness of households.
Interest rates on housing loans to households fell in the first half of 2009 in line with the fall in interest rates in the euro area. Nominal interest rates on housing
loans to households fell most in the early part of the year, in line with reduction in ECB interest rates, with the fall slowing down afterwards. They stood at around 4% in July, having stood at around 7% in the final quarter of 2008. The spread between interest rates on housing loans in Slovenia and those in the euro area overall also declined during this period. Having averaged 1.2 percent-age points in 2008, the spread declined to 0.9 percentage points during the first seven months of 2009. In the con-
-4
-2
0
2
4
6
-4
-2
0
2
4
6
2006 2007 2008 2009
euro area (real)* Slovenia (real)*euro area (nominal) Slovenia (nominal)
Figure 5.8: Interest rates on household deposits of up to 1 year
* Real interest rates, allowing for past inflation (3-month moving average).Source: ECB, Bank of Slovenia
For Slovenia: tolar deposits to the end of 2006, afterwards euro
%
-10
0
10
20
30
40
50
60
-10
0
10
20
30
40
50
60
2006 2007 2008 2009
household lending - euro areahousehold lending - Sloveniahousing loans - euro areahousing loans - Slovenia
Figure 5.7: Breakdown of household lending
Source: ECB, Bank of Slovenia
year-on-year growth, %
6 Developments on the real estate market are discussed comprehensively in the May 2009 Financial Stability Review.

BANKA SLOVENIJE
58Financing Conditions PRICE STABILITY REPORT
text of a similar fall in nominal interest rates, real interest rates on housing loans to households rose more sharply in Slovenia than the overall euro area average after fal-ling sharply in 2007 and 2008.
Interest rates on household deposits in Slovenia fell sharply in 2009, albeit slightly less than in the euro area overall. The fall was more pronounced at the begin-ning of the year, while in the middle of the year interest rates on household deposits stabilised in Slovenia and in the euro area overall. After peaking at around 5% in the third quarter of 2008, by the middle of 2009 interest rates
have fallen to 2.3% in Slovenia and 2% in the euro area overall. Current inflation rates being taken into considera-tion, real interest rates are again positive in Slovenia, and have equalised with those in the euro area overall. Household deposits have been increasing recently, pri-marily as a result of the financial turmoil and the associ-ated increased risk on investments in other forms of fi-nancial instruments, and due to certain measures to miti-gate its consequences, in particular the unlimited govern-ment guarantee for all deposits.
0
2
4
6
8
10
12
14
0
2
4
6
8
10
12
14
2005 2006 2007 2008 2009
Slovenia (real)*euro area (real)*Slovenia (nominal)euro area (nominal)
Figure 5.9: Interest rates on consumer loans to households
* Real interest rates, allowing for past inflation (3-month moving average).Source: ECB, Bank of Slovenia
For Slovenia: tolar loans to the end of 2006, euro loans since 2007.
%
0
2
4
6
8
10
12
14
0
2
4
6
8
10
12
14
2006 2007 2008 2009
Slovenia (real)*euro area (real)*Slovenia (nominal)euro area (nominal)
Figure 5.10: Interest rates on housing loans to households
* Real interest rates, allowing for past inflation (3-month moving average).Source: ECB, Bank of Slovenia
Variable or fixed interest rate for up to 1 year. For Slovenia: tolar loans until the end of 2006.
%

BANKA SLOVENIJE
Price Projections and RisksPRICE STABILITY REPORT 59
Average annual inflation as measured by the HICP is expected to stand at 1.1% in 2009. Inflation is ex-pected to rise to 1.5% in 2010, and to 1.7% in 2011. Compared with the March projections, this entails an up-ward revision of 0.7 percentage points for this year, and downward revisions of 0.2 and 0.6 percentage points for 2010 and 2011 respectively. The change in the inflation projection for this year is primarily the result of the antici-pated higher oil prices and other commodity prices com-pared with previous projections. Growth in energy prices is expected to be negative this year as a result of base effects, but positive in the coming years. Growth in other prices is expected to decline sharply to 1.9% this year, to decline further to 1.1% in 2010, and to rise to 1.7% in 2011. After a gradual improvement in economic condi-
6 Price Projections and Risks
5.7
3.7
2.5 2.5
3.8
1.7
5.5
1,11.5
7.5
-2
-1
0
1
2
3
4
5
6
7
8
2002 2003 2004 2005 2006 2007 2008 2009 2010 2011-2
-1
0
1
2
3
4
5
6
7
8
contribution of energy pricescontribution of other pricesMarch 2009 HICP projections
average annual inflation (HICP), %
Figure 6.1: Inflation projections
Source: SORS, Bank of Slovenia projections
Table 6.1: Inflation
�: Difference between current projections and projections in March 2009 Price Stability Report Source: Eurostat, Bank of Slovenia
2004 2005 2006 2007 2008 Sep � Sep � Sep �
average annual growth, %Consumer prices (HICP) 3.7 2.5 2.5 3.8 5.5 1.1 0.7 1.5 -0.3 1.7 -0.6 food 1.3 0.2 2.7 7.1 8.1 1.9 -0.3 1.9 0.5 2.0 -0.6 energy 7.0 11.9 8.5 3.4 9.4 -3.8 4.4 3.6 -2.7 1.0 -3.7 other goods 1.8 -0.3 -0.9 0.3 2.2 0.3 -0.2 -0.9 -0.8 0.3 -0.6 services 5.8 3.3 3.5 4.9 5.3 3.3 0.7 2.3 0.3 2.6 0.2
Core inflation indicators (HICP) excluding energy prices 3.2 1.2 1.7 3.8 4.9 1.9 0.1 1.1 -0.1 1.7 -0.3 excluding energy and unprocessed food prices 3.7 1.3 1.5 3.4 5.0 2.1 0.4 1.4 0.1 1.8 -0.2 excluding energy, food, alcohol and tobacco prices 3.9 1.5 1.3 2.7 3.8 1.9 0.3 0.9 -0.2 1.6 -0.2
20112009 2010Projections

BANKA SLOVENIJE
60Price Projections and Risks PRICE STABILITY REPORT
tions at home and in the rest of the world, a gradual rise in price growth is expected over the projection horizon but it will remain in line with the achievement of price sta-bility.
The low growth in energy prices and commodity prices on global markets, the economic slowdown at home and in the rest of the world, and the decline in consumer purchasing power are expected to contrib-ute to lower inflation this year. After recording high growth last year, nominal labour costs slowed this year in
line with the decline in economic activity and the fall in employment. Although the economy is expected to record positive growth in the second half of the year after re-cording positive economic growth in the second quarter, the merely gradual recovery is expected to contribute to an absence of inflationary pressures in the context of a sharp decline in domestic demand, low demand from the rest of the world, falling employment and slowing wage growth,.
Core inflation is also expected to continue slowing gradually and with a delay, although deflation is not expected. The core inflation indicators point to it holding steady over the projection horizon at a level that allows the sustainable achievement of price stability. Year-on-year growth in the HICP excluding energy, food, alcohol and tobacco has been gradually falling since the begin-ning of the year, a slightly larger fall being recorded in July, and the low is expected to be reached at the begin-ning of next year. The main reason is the anticipated moderately negative contribution made by prices of non-energy industrial goods. Average annual growth in this core inflation indicator is expected to stand at 1.9% this year, at 0.9% in 2010 and at 1.6% in 2011. The increased growth in the index in 2011 is expected to be the result of an improvement in the domestic economic climate and aggregate demand. Similar movements over the projec-tion horizon can be expected in the other core inflation indicators.
Conditions in the international environment, particu-larly the developments of energy and commodity prices, are expected to be a major factor in the move-ment of inflation this year. Energy prices, which were a major factor in the fall in year-on-year inflation in the first half of this year, are expected to account for more than 1 percentage point of the annual inflation rate towards the end of this and the beginning of next year. Oil is expected to average around USD 60 per barrel this year, and the price is then expected to gradually rise over the next two years in line with the anticipated movement in global eco-nomic growth. Like oil prices, other commodity prices are
0.81.4 1.1
0.51.2
-0.6
0.5 0.2-0.1
0.40.5
0.10.6
-0.1
0.2
1.9
1.11.2
1.6
1.8
1.20.8 0.9
0.40.5
0.4
1.4
0.1
0.2 1.7
3.7
2.5 2.5
3.8
5.5
1.11.5
-1
0
1
2
3
4
5
6
2004 2005 2006 2007 2008 2009 2010 2011-1
0
1
2
3
4
5
6servicesother goodsprocessed foodunprocessed foodenergyHICP
Figure 6.2: Contributions of components to inflationpercentage points
Note: Sums of components may differ from aggregate values due to rounding.Source: SORS, Bank of Slovenia projections
-2
-1
0
1
2
3
4
5
6
7
-2
-1
0
1
2
3
4
5
6
7
2005 2006 2007 2008 2009 2010 2011
HICPHICP excluding energyHICP excluding energy and unprocessed foodHICP excluding energy, food, alcohol and tobacco
Source: Eurostat, Bank of Slovenia projections
Figure 6.3: HICP and core inflation%

BANKA SLOVENIJE
Price Projections and RisksPRICE STABILITY REPORT 61
expected to record negative average year-on-year growth in 2009. The latter is primarily the result of the high basis from the first half of 2008. Growth in commodity prices is expected to strengthen again in 2010, to average 16.3%. Growth in consumer prices in the euro area is expected to rise slightly in the coming years, reaching around 2.0% by the end of the projection horizon.
In the light of changes in headline inflation projec-tions, projections in individual price categories also changed. The revision to the forecasts for this year is primarily the result of the materialisation of certain risks, those relating to energy prices in particular. The forecast for average growth in energy prices has been revised upwards by 4.4 percentage points, and now stands at -3.8%; the rate is then expected to rise to 3.6% in 2010 before falling to less than 1.0% in 2011. The forecast for growth in prices of non-energy industrial goods has also been revised downwards, while the forecast for growth in services prices has been revised slightly upwards. Growth in food prices is expected to fluctuate at around 2% over the entire projection horizon.
Under the plan for managing regulated prices for 2008 and 2009, the government raised excise duties
on tobacco in May. The significant rise in these excise duties is expected to contribute 0.3 percentage points to inflation. In addition, it also raised the contribution for mandatory reserves of refined petroleum products, and adjusted the prices of certain textbooks. It has been as-sumed that growth in other administered prices will move in line with non-administered prices, as envisaged in the plan for managing regulated prices for 2008 and 2009. The same assumption is applied to the projections of other administered prices for 2010 and 2011. The gov-ernment will draw up a new plan for managing regulated prices for the next two years at the end of 2009.
Risks
The uncertainties surrounding macroeconomic trends remain unusually high. The risks in respect of economic growth forecasts are on the downside in the medium term, while those in respect of inflation forecasts are balanced. Despite some signs of a recov-ery in the global economy and expectations of an emer-gence from the global economic crisis, under the current circumstances it is difficult to forecast how long and how
Table 6.2: Assumed direct effects on inflation of government measures in 2009
Source: Plan for managing regulated prices in 2008 and 2009
Measure changeeffect on HICP
(percentage points)
– Changes in prices of selected textbooks average price increase of 2.6% 0.007
– Changes in prices of railway tickets average price increase of 3.5% 0.007
– Planned increase in contribution to mandatory reserves of refined petroleum products increase in contribution of 10% 0.000
– Changes in network charge and supplements to network charge for electricity transmission increase in final electricity price of 1.4% 0.032
– Change in excise duties on alcoholic beverages average increase in prices of alcoholic beverages of 9% 0.160
– Change in excise duties on tobacco average increase in prices of tobacco products of 9% 0.300
Total effect on inflation 0.506

BANKA SLOVENIJE
62Price Projections and Risks PRICE STABILITY REPORT
Medium-term public finance objectives are determined within the framework of the revised Stability and Growth Pact for each EU Member State with regard to its economic and budg-etary situation. EU Member States set medium-term public finance objectives that represent a safety limit in the sense of maintaining the public finance position within the reference value for the deficit of 3% of GDP. The medium-term objec-tives thus determined allow countries to exercise a counter-cyclical fiscal policy without exceeding the reference value for the budget deficit.1 The reform of the pact, which was con-firmed at the European Council meeting in March 2005, al-lowed the introduction of differentiated medium-term public finance objectives. Thus instead of the previous uniform rules for achieving a balanced public finance position or a surplus, countries can now draw up their own medium-term public finance objectives, taking potential economic growth and general government debt into consideration. Euro area coun-tries and countries in the ERM II that have a low debt and high potential growth – including Slovenia – can set a struc-tural deficit of up to 1% of GDP as their medium-term objec-tive.2 The rules are unchanged for countries with a high debt and low potential economic growth.3
The planned inclusion of contingent liabilities arising from the ageing population in the calculation of the medium-term pub-lic finance objective will make the target tighter for some countries. The reformed pact envisages that the definition of
the objective be updated by taking the estimated contingent liabilities from the ageing population into consideration, thereby giving greater emphasis to the question of long-term sustainability and the size of the debt. The assessment of the ageing costs to be taken into consideration when the me-dium-term objective for fiscal policy is being determined was confirmed by the European Commission4 this April on the basis of coordinated demographic projections and macroeco-nomic assumptions. A final decision on the method for calcu-lating the new medium-term objectives is expected to be taken soon, and Member States are expected to present their new medium-term objectives in the next update of the stability programmes or convergence programmes at the end of this year.
Slovenia belongs to the group of countries that have high estimated ageing costs. Ageing costs include public expendi-ture on pensions, healthcare, long-term care, education and unemployment, and vary markedly from country to country. They reflect differences in demographic trends (differences in birth rates, life expectancy, migration), the characteristics of the national pension systems, the reforms that have been undertaken and other factors. According to the European Commission forecasts, ageing costs in Slovenia will have increased by 12.8 GDP percentage points by 2060, while the increase in the EU as a whole will amount to 4.7 GDP per-centage points, of which approximately a half will be the prod-uct of pension expenditure. The estimated increase in ageing costs in Slovenia is one of the highest in the EU, with only Luxembourg (18 GDP percentage points) and Greece (15.9 GDP percentage points) having a larger increase. In all these countries the main expenditure originates in the (unreformed) pension systems, and to a much lesser extent, in healthcare and long-term care. Slovenia thus belongs to the group of countries with high risk in respect of the sustain-ability of public finances.5 The lowest forecasts for the in-crease in ageing costs were for Estonia and Latvia (0.4 GDP percentage points each), Poland (-2.4 GDP percentage points), and within the euro area, Italy (1.6 GDP percentage points). The projections are subject to uncertainties arising from the macroeconomic assumptions and demographic trends, but public finance stability can only be ensured when the size of pensions is right.6
Box 6.1: Medium-term public finance objectives and ageing of the population
-5
0
5
10
15
20
Luxe
mbou
rgGr
eece
Slov
enia
Cypr
usM
alta
Nethe
rland
sSp
ainIre
land
Belgi
umFi
nland
Slov
akia
euro
are
aGe
rman
yPo
rtuga
lAu
stria
Fran
ce Italy
educationunemploymentlong-term carehealthcarepensions
Figure: Estimated growth in costs of ageing population by group and euro area country until 2060
Source: 2009 Ageing Report: economic and budgetary projections for the EU-27 Member States (2008-2060), European Commission
GDP percentage points

BANKA SLOVENIJE
Price Projections and RisksPRICE STABILITY REPORT 63
deep the recession will be, and what form the economic recovery will take. The outlook for economic growth in the major world economies has improved slightly, primarily as a result of better-than-expected GDP growth in the sec-ond quarter. The comprehensive fiscal measures taken in numerous countries were a major factor in this. It is un-certain what the strategy is for exiting the economic pol-icy measures, and how domestic demand and thus eco-nomic growth will respond to the ending of these meas-ures. It is difficult to judge with certainty the impact of fiscal measures within the economy, and how their influ-
ence spreads from country to country (i.e. what their cross-border effects are). There also remain significant uncertainties surrounding the normalisation of conditions on the financial markets, and surrounding the size of the necessary reduction in bank leverage and the interac-tions between the financial markets and the real sector.
The largest downside risk in respect of economic growth projections comes from assumptions regard-ing the duration and dimensions of the global reces-sion, which could be exacerbated by the occurrence of feedback loops, i.e. the transmission of adverse
In Slovenia the contingent liabilities on the basis of the ageing of the population primarily relate to pensions. More than two-thirds of the total forecast growth in age-related expenditure relates to pensions, and derives from an increase in the age-dependency ratio, which reflects the ageing of the population.
The pension reform of 1999 did not ensure the long-term sustainability of the pension system. The government intends to present proposals for modernising the pension system in the autumn. The changes should head in the direction of an administrative rise in the retirement age in connection with financial incentives for remaining active longer, while at the same time the changes should also relate to the method for calculating and index-linking pensions, to greater transpar-ency and to the establishment of an effective second pillar of pension insurance. The simulations in the update to the Sta-bility Programme of April 2009 show that a rise of one year in the retirement age and the simultaneous introduction of a lower 80% wage-indexation for pensions would entail a de-cline of 2.6 GDP percentage points in ageing costs in the period to 2060, whereby expenditure on pensions would de-cline by 2.1 GDP percentage points.
Slovenia’s new medium-term public finance objective will probably have to be more ambitious that its current objective. At the moment its medium-term objective is defined as a structural deficit of 1% of GDP. With regard to the updated Stability Programme of April 2009, Slovenia failed to achieve its medium-term objective, and will also fail to do so in the 2009 to 2011 period, despite the planned consolidation. The inclusion of ageing costs in the calculation of the objective will probably make the target tougher for Slovenia, which will
necessitate appropriate fiscal consolidation. In addition to reforms to social transfers, measures to reduce the general government debt and raise employment and productivity can also make a contribution. The timeframe for the implementa-tion of the measures is also important, as it has an impact on the inter-generational distribution of the burden. An earlier adjustment or the advance financing of ageing costs, which could only be effected in many euro area countries by means of profound structural surpluses, would generally entail a more even distribution of the burden for different generations than a gradual adjustment.7 A country can modify its medium-term public finance objective when it is carrying out major reforms, for four years in any case, such that the medium-term objective reflects the changes in the general government debt, in potential growth and in fiscal sustainability.
1 During ordinary fluctuations in the economic cycle.
2 The structural deficit: the deficit adjusted for the effects of the cycle and after the elimination of one-off and temporary measures. 3 The medium-term objective for these countries is defined as a structural position close to balance or in surplus.
4 European Commission: 2009 Ageing Report: Economic and budgetary projections for the EU-27 Member States (2008-2060) http://ec.europa.eu/economy_finance/publications/publication14992_en.pdf 5 European Commission: Public Finances in EMU 2008 http://ec.europa.eu/economy_finance/publications/publication12832_en.pdf 6 A pension system reform based on a large decline in the wage replace-ment rate, i.e. the ratio of pensions to wages, can prove to be unsustain-able, as the insufficient earnings require a subsequent upward adjustment or demand other public funding. 7 Ballassone et al: Fiscal sustainability and policy implication for the euro area: ECB Working Paper 994, 2009 http://www.ecb.int/pub/pdf/scpwps/ecbwp994.pdf

BANKA SLOVENIJE
64Price Projections and Risks PRICE STABILITY REPORT
developments between the real sector and the finan-cial sector. The openness of the Slovenian economy means that the reversal of the cycle in global activity and the recovery of global trade will be the most important factors in the recovery of domestic demand. The baseline scenario assumes that the global economy will recover in 2010, but a more sustained global recession would entail economic growth in Slovenia being lower than the fore-cast in the baseline scenario. At the same time it should be noted that conditions on the financial markets deterio-rated extremely rapidly, but interventionist measures of economic policy also followed very rapidly. There is a possibility that under more stable financial conditions the recovery of global economic activity could be faster and stronger than currently expected.
The barriers to obtaining and renewing bank funding from the rest of the world, the decline in leverage in the banking system, and the increase in credit risk could hinder the normalisation of financing, and with it the strengthening of economic activity. Lending to the private non-financial sector has slowed significantly this year, which can be attributed to a combination of factors on both the supply and demand sides, and is in part a reflection of the normalisation process. During the period of high economic growth non-financial corpora-tions and households borrowed substantially to finance their activities and expenditure, but the crisis forced them to reduce borrowing, as a result of both the contraction in investment activity and falling income and asset values. There is a risk that a continuation of low investment activ-ity and household consumption could hinder the recovery of domestic demand.
An exceptionally large decline in economic activity could create a sustained or structural deterioration in economic conditions. There is a risk that future growth in potential output could be lower than before the crisis. This would be evidenced in a rise in long-term unemployment and lower potential output, which would have an adverse impact on economic growth in the me-dium term and long term. How rapidly potential output or
the economic growth trend will return to the pre-crisis level is uncertain, but certain structural adjustments are usually required for this to happen; it is usually the case that they are adopted gradually, have a long implementa-tion time and act with a lag. The competitive position of domestic companies will also be decisive in the re-establishment of sustained economic development. Be-cause Slovenia is a member of the monetary union, it can influence competitiveness exclusively via domestic ad-justment mechanisms, in particular in the labour and products market.
The structural deterioration in conditions on the la-bour market and the increase in the budget deficit and general government debt represent a central risk in respect of the possibility of even lower private con-sumption over the entire projection horizon. The la-bour market is adjusting gradually to the deterioration in economic conditions, which is customary, given its imper-fect flexibility. The adjustments are being mitigated by government measures, such as the subsidisation of work hours and wage compensation for workers temporarily laid off, which can have a positive bridging effect when the deterioration in the labour market is short-term. When the deterioration in the labour market is long-lasting, these measures are unsustainable, which entails the risk of a delayed sharper fall in employment after the meas-ures cease. This would have an adverse impact on dis-posable income and thus on consumption in the coming years. Wage movements are also uncertain, the existing social agreement expiring in 2010, while wage agree-ments are also due to expire. Private sector wages are to a great extent adjusting to the deterioration in economic conditions, and their growth will thus depend primarily on the economic recovery. Public sector wages will be most dependent on budgetary limitations, which could be greater than expected, as a result of which public sector wage cuts have not been ruled out. Developments on the real estate market and securities market also remain deeply uncertain, as does the wealth effect on private consumption.

BANKA SLOVENIJE
Price Projections and RisksPRICE STABILITY REPORT 65
Among domestic factors, the risk relating to projec-tions of fixed capital formation and inventories, which have fluctuated sharply recently, is also sig-nificant. The risk relating to their projections is very high, because of these large fluctuations. After several years of rapid growth, investment in the first half of 2009 was down 25% in year-on-year terms, while the decline in inventories accounted for almost a half of the decline in GDP. It is customary for inventories to exhibit cyclicity in economic cycles, but the decline in inventories in the first half of this year was exceptional, which is increasing the risk in respect of the projections. A faster reversal in con-
fidence, output and inventory build-up – partly in re-sponse to the economic policy stimulus measures at home and in the rest of the world – could contribute to a faster economic recovery than envisaged in the baseline scenario. Investment linked to government projects could also stimulate economic growth, but their realisation will depend on available budget funds and on the efficiency of disbursements of EU money.
The necessary fiscal adjustments represent a risk in respect of economic growth in the medium term, as the necessary consolidation of public finances could act to curb economic activity. The anticipated deterio-
Forecasts for Slovenia are compiled by domestic and interna-tional institutions. It is useful to compare forecasts because they highlight differences in thinking concerning future eco-nomic trends, despite the forecasts not being directly compa-rable, as they are drawn up in different periods and therefore do not take into account the same information. Furthermore, the forecasts are based on different assumptions with regard to both exogenous variables in the international environment and economic policy actions.
Under the current circumstances, forecasts depend very heavily on the exact moment that they are drawn up, as the last year has seen exceptional downward revisions in eco-nomic growth forecasts in the rest of the world, which have slowed slightly in recent months (see Box 2.1). This pace of revision is having a significant impact on forecasts of eco-nomic activity for Slovenia. Although the forecasts were cut
significantly in the early part of the year, and mostly predicted negative economic growth, they were cut further after the release of data for the first quarter of 2009. All the institutions are forecasting that Slovenia’s GDP will decline by more than 5% this year. All the institutions are also forecasting a very slow economic recovery in 2010, growth remaining well below its long-term average.
The majority of the institutions are forecasting a significant decline in the current account deficit this year, and are of the opinion that the current account deficit in 2010 will be larger than this year, but significantly smaller than in 2008.
The majority of the institutions are forecasting that inflation will average approximately 1% in 2009, while in 2010 there is expected to be a gradual rise in inflation, although it is ex-pected to nevertheless remain at a relatively low level.
Box 6.2: Comparison of 2009 and 2010 forecasts with those of other institutions
Table: Comparison of forecasts for Slovenia, and change from previous forecasts
�: difference between current and previous projections, percentage points Sources: Bank of Slovenia, EIPF, IMAD, Consensus Economic Forecasts, OECD; Bank of Slovenia calculations
new � new � new � new � new � new �
Bank of Slovenia Sep 09 / Mar 09 -6.7 -4.7 1.6 -0.3 1.1 0.7 1.5 -0.3 -1.3 1.9 -3.2 1.0
EIPF Sep 09 / Mar 09 -5.4 -4.5 1.0 -0.8 0.8 0.9 1.3 -2.9 -1.0 -0.5 -2.7 2.4IMAD Sep 09 / Mar 09 -7.3 -3.3 0.9 -0.1 1.0 0.6 1.5 -0.1 -0.2 2.0 0.0 3.5Consensus Forecasts Sep 09 / Mar 09 -5.9 -5.4 0.6 -0.7 1.0 -1.1 2.1 -0.6 -2.2 2.5 -2.2 2.1OECD Jun 09 -5.8 … 0.7 … 0.8 … 1.6 … … … … …
Publication ofnew/previous
forecast 20092009
GDPannual growth, %
Inflationannual average, %
2010 2010 2009 2010
Current accountas % GDP

BANKA SLOVENIJE
66Price Projections and Risks PRICE STABILITY REPORT
ration in macroeconomic conditions and the discretionary government measures anticipated to a great extent to mitigate the consequences of the financial turmoil and economic crisis could force the general government defi-cit past the allowed ceiling of 3% of GDP. Although short-term fiscal measures are welcome in mitigating the con-sequences of the global economic crisis, they could have an adverse impact on the economic recovery and eco-nomic growth in the medium term. The necessary adjust-ments could stifle confidence and with it consumption and investment in the coming years. In the event of numerous government bond issues the pressure on yields would build up, increasing uncertainties surrounding the possi-bility of financing the debt in the rest of the world. The rise in interest will expand the general government deficit and debt, particularly if the economic recovery is pro-tracted and there is insufficient budget revenue. Deviating from a balanced public finance position is a particularly high risk in Slovenia because of the unfavourable demo-graphic structure, which in the future will require more funding for pensions and healthcare. Structural adjust-ments to the public finances are therefore vital (cuts in
expenditure in particular), which could also have a tem-porary adverse impact on economic growth (see Box 3.1).
On the inflation side the uncertainties are closely tied to the economic recovery, the movement of commod-ity prices, conditions on the labour market and the potential rise in taxes and excise duties for the pur-poses of fiscal consolidation. Domestic demand has a decisive impact on the movement of inflation, although forecasts of this impact are usually uncertain. Should the risks of a sustained deterioration in the labour market be realised, growth in prices could also be lower over the medium term. By contrast, should the recovery be stronger than envisaged in the baseline scenario, the inflationary pressures on the demand side could rapidly return. At the same time inflationary pressures could strengthen in the event of a rise in commodity prices or should wage growth increase in the context of an im-provement in the economy or fail to adjust to harsher economic conditions as envisaged in the baseline sce-nario. The latest developments indicate a rising risk of wage growth.