priced out – how new zealand lost its housing affordability
DESCRIPTION
Priced Out – How New Zealand Lost Its Housing Affordability looks at long-term trends in housing regulation and social circumstances as well as the changing roles of local and central governments.TRANSCRIPT
PRICEDOUT
HOW NEW ZEALANDLOST ITS HOUSING
AFFORDABILITYMICHAEL BASSETT
LUKE MALPASS
© The New Zealand Initiative 2013
Published byThe New Zealand Initiative, PO Box 10147, Wellington 6143, New Zealandwww.nzinitiative.org.nz
Views expressed are those of the authors and do not necessarily reflect the views ofThe New Zealand Initiative, its staff, advisors, members, directors or officers.
ISBN: 978-0-9922565-1-7
Research report 2 (RR2) - Housing affordability series 1
Typeset by Aeroshop
Printed by Wickliffe Solutions
Cover photo by Brigitte Masters
cwww.nzinitiative.org.nz
The New Zealand Initiative is an independent public policy think tank supported by chief executives of major New Zealand businesses. We believe in evidence-based policy and are committed to developing policies that work for all New Zealanders.
Our mission is to help build a better, stronger New Zealand. We are taking the initiative to promote a prosperous, free and fair society with a competitive, open and dynamic economy. We develop and contribute bold ideas that will have a profound, positive, long-term impact.
Priced OutHow New Zealand lost its housing affordability
Michael Bassett and Luke Malpass

AcknowledgementsThe authors wish to acknowledge and thank all those who participated in interviews, reviewed or commented on this report. Any errors remain our own.
Michael Bassett
Michael was educated in Auckland, New Zealand, and at Duke University where he took a PhD in modern American history. He then taught American, European and New Zealand history at the University of Auckland for eleven years. He was elected to the Auckland City Council and to New Zealand’s Parliament in the 1970s, serving over a period of six years in the 1980s as Minister of Health, Local Government, Internal Affairs, Civil Defence and Arts and Culture in the governments headed by David Lange and Geoffrey Palmer. He was the minister responsible for reducing 750 local authorities to 93 in 1989.Since retiring from politics in 1990 Michael has been J.B. Smallman Professor of History at the University of Western Ontario, a lecturer at Auckland’s Medical School, and New Zealand’s Fulbright Professor of New Zealand History at Georgetown University in Washington DC. He sat for ten years (1994-2004) on New Zealand’s Waitangi Tribunal dealing with the claims of indigenous Maori. For six years he wrote a regular political commentary for New Zealand’s Fairfax papers, winning the Qantas Media Award for Best Political Columnist in 2004.He has published twelve books on New Zealand’s political history and specializes in biography. He is at work on two more books, one on the Auckland City Council 1989-2010 and a study of New Zealand’s 24 prime ministers.Michael was awarded the Queen’s Service Order for Community Services in 1992.
Priced Out
About the Authors
Luke Malpass
Luke is a Research Fellow at the New Zealand Initiative. Luke joined The New Zealand Initiative from Sydney, where he was a freelance consultant and weekly columnist for the Australian Financial Review. Prior to this he spent three years as a Policy Analyst with the Centre for Independent Studies. Luke holds a first class Bachelor of Arts Honours degree in Politics from the University of Otago.

Priced Out
New Zealand’s housing affordability problems are well documented. Barely a week passes when housing in New Zealand is not in the news: either because prices are rising, or as in 2008–09 when prices briefly fell and many people were upset about paying too much for a house.
This report examines the development of housing in New Zealand since the early 1900s, the current state of the housing market, and its journey to this point.
New Zealand is suffering a shortfall of houses caused by anti-development attitudes, tighter building regulations, and artificial restrictions on land supply. Some of these attitudes reflect the rising discipline of urban planning: a discipline pregnant with questionable assumptions, some of which have proved to be self-defeating.
This stands in marked contrast to New Zealand’s post World War II attitude to building and construction. Housing was a key plank of New Zealand’s post World War II welfare state. The state, through State Advances Corporation 3% loans and a corporatist approach to building and construction, ensured that New Zealand enjoyed very high rates of building and higher levels of private homeownership than had previously been the case.
Despite a richer and larger population, New Zealand’s rates of building since the 1980s have not reached the levels of the 1960s and 1970s. As a result, New Zealand’s new house building is lagging with a shortfall of at least 10,000 new houses annually – a shortfall that is continuing to grow.
The trend can be explained by several key changes to New Zealand’s economy, culture and legislative arrangements in the past half century.
First, the economy slowed down quite drastically from 1974 onwards. There was less government money available through the State Advances Corporation to stimulate the construction of new homes for first-home buyers. This fading of government stimulation was accompanied by the formation of new types of family units (or family households) – partly due to cultural change, partly due to welfare and partly due to a rise in divorce and remarriage rates. The number of new houses built dropped from a record 34,400 in 1974 to 24,200 in 1978. Although the economy improved in the 1990s and early 2000s, housing completions have seldom reached the rate of new household formation.
Second, since the 1970s, there has been a misplaced fear of urban sprawl. Less than 1% of New Zealand is built upon even after including landfill and roads. Fears of ‘using up all our farmland’ are grossly exaggerated.
Third, this fear of ‘urban sprawl’ has resulted in urban limits and restrictive and prescriptive zoning, which have conferred a virtual monopoly market power on landowners near the city fringes. Regardless of how many thousands of sections of land are available within urban limits, they are only worth the developer opening them up at a certain price. The experience of Auckland’s Metropolitan Urban Limit (MUL) is similar to that of Portland, Oregon, with land outside the city limits costing nine times less than within city limits.
Fourth, as New Zealand has become more prosperous, green agendas of more affluent New Zealanders have trumped traditional egalitarian social aspirations, such as suburban homeownership.
Executive Summary
i
Executive Summary
Although a slim majority of New Zealanders now think rising house prices are undesirable, the current policy quagmire has created a situation where the interests of those who are lucky enough to own property are often opposed to the interests of non-owners or younger people seeking to get a first step on the property ladder.
However, it should also be remembered that since the 1980s, houses in New Zealand have not only become more expensive but they are also much bigger with a far greater square footage and better insulation and fittings. These improvements are partly the result of changes to government and local authority rules in recent years. As a result, many first-home buyers now have an unrealistic expectation of what standard of house is available at what price.
Changing the face of the housing market will require political will and perseverance as well as overcoming a central part of New Zealand’s economy that sees investment in housing as a way, or indeed the best way, to make individual wealth.We should remember that individuals can get wealthy off housing, but the country cannot.
ii
Priced Out
iii
List of figures, tables and boxes iv
Part I: The state of play 1
Affordable housing in New Zealand: History, facts and myths 1 The state of the market 2 Government failure, not market failure 4 What this report is NOT 5 International comparisons 6
Part II: Government in the business of building 9
Planning in New Zealand: The beginnings 9 “We must organise the distribution of our population.” The Town and Country Planning Act 1953 10 Post World War II: Government in the business of building 11 The State Advances Corporation and government-backed loans 12 A culture of construction: Government-subsidised house building and loans 12
Part III: Economic change alters the market 15
Costs begin to rise 15 The changing face of cultures and households 16 Household completions subside 18 When the money dried up 19 Trends in local planning: The rise of the planners 20 The compact cities cult 21 Auckland’s Metropolitan Urban Limit 23 Death by a thousand cuts: Levies, fees and development contributions 26 Rising costs 27
The current situation: Owners versus buyers 28
Conclusions 30
Bibliography 31
Contents

vwww.nzinitiative.org.nz ivwww.nzinitiative.org.nz
List of Tables and Figures
List of Figures, Tables and Boxes
Figure 1. Net capital stock by asset type 2 Figure 2. House prices, real and nominal 3 Figure 3. Massey Home Affordability Index 4 Figure 4. House price indexes 6 Figure 5A. Real house price index in the Anglosphere (1997, Q1 =100) 7 Figure 5B. House prices across a range of countries since the 1970s 8 Figure 6. Floor area per new dwelling consented 14 Figure 7. New Zealand dwelling stock 2006, by stock added per decade 17 Figure 8. Land prices as a share of house price 23 Figure 9A. Land value effects of Auckland’s MUL 25 Figure 9B. Portland’s urban growth boundary 25
Table 1. Demographia Housing Affordability Survey 2012 5 Table 2. Forecast shortfalls in housing completions 19
Box 1. Urban sprawl: a short history in New Zealand 10 Box 2. Capitalisation of the Family Benefit and 3% loans 17 Box 3. All of our land is being used up! 21

Priced Out

1www.nzinitiative.org.nz
1.The State of Play
‘Affordable housing’ is New Zealand’s public policy problem du jour. Of all the ‘cost of living’ political issues, it is the one that hits the average person the hardest. New Zealand’s house prices have increased by a staggering amount over the past 30 years, aided by a mixture of policies and social and cultural changes that have forced up the price of building or buying a house.
Housing affordability in New Zealand is a serious national economic issue. High house prices and the resulting high mortgages are key contributors to New Zealand’s high levels of private debt. But the economic cost is not the only issue. The cultural value of homeownership is also important: the number of people not owning their own home is considered, rightly or wrongly, a national problem.
As with many settler societies, particularly in the Anglosphere, New Zealanders identify with and believe in landownership to an extent that people from Europe fail to understand, or do not regard as so important. For much of our history, the government has encouraged this affinity with a variety of policy prescriptions: opening up cheap land, extending low interest loans, capitalising government benefits for equity-strapped households, etc. More recently, the accommodation supplement has performed a less direct role. New
Zealand’s high level of homeownership is believed to have contributed to social stability and safer communities, and is a key aspect of the national mythology of egalitarianism.
However, for the past four decades, and the past 10 years in particular, house prices have risen inexorably. This is undesirable for two reasons:
1. New Zealanders’ attachment to property has resulted in high levels of national indebtedness, making New Zealand one of the most privately indebted nations in the developed world.
2. High house prices make it very difficult for many people, particularly those on lower incomes, to own their own home.
While a rational response might be, ‘big deal, homeownership in Europe is low where many people rent as a more sensible economic choice’, this response doesn’t automatically work here. New Zealanders will not stop seeking to buy a house just because it is expensive – and it is important to note that the relatively low rate of poverty among New Zealand’s elderly is partly due to the freehold homeownership that occurred decades ago when houses were acquired at a much lower cost.
Affordable housing in New Zealand: History, facts and myths
2
Priced Out
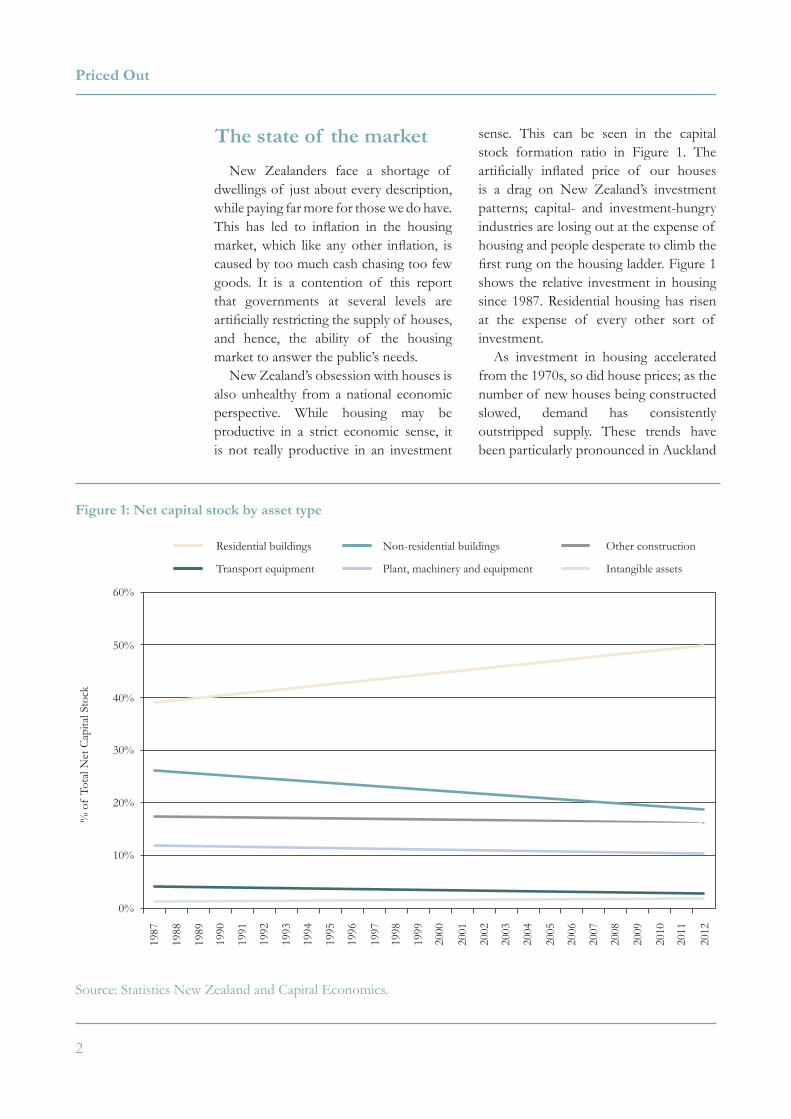
New Zealanders face a shortage of dwellings of just about every description, while paying far more for those we do have. This has led to inflation in the housing market, which like any other inflation, is caused by too much cash chasing too few goods. It is a contention of this report that governments at several levels are artificially restricting the supply of houses, and hence, the ability of the housing market to answer the public’s needs.
New Zealand’s obsession with houses is also unhealthy from a national economic perspective. While housing may be productive in a strict economic sense, it is not really productive in an investment
sense. This can be seen in the capital stock formation ratio in Figure 1. The artificially inflated price of our houses is a drag on New Zealand’s investment patterns; capital- and investment-hungry industries are losing out at the expense of housing and people desperate to climb the first rung on the housing ladder. Figure 1 shows the relative investment in housing since 1987. Residential housing has risen at the expense of every other sort of investment.
As investment in housing accelerated from the 1970s, so did house prices; as the number of new houses being constructed slowed, demand has consistently outstripped supply. These trends have been particularly pronounced in Auckland
Figure 1: Net capital stock by asset type
Source: Statistics New Zealand and Capital Economics.
The state of the market
60%
50%
40%
30%
10%
20%
0%
Residential buildings
Transport equipment
Non-residential buildings
Plant, machinery and equipment
Other construction
Intangible assets
% o
f To
tal N
et C
apita
l Sto
ck
1987
1988
1989
1990
1991
1992
1993
1994
1995
1996
1997
1998
1999
2000
2001
2002
2003
2004
2005
2006
2007
2008
2009
2010
2011
2012

3www.nzinitiative.org.nz
where prices between 1995 and 2011 compared to the rest of New Zealand increased by 260% in the lowest quartile of housing and by between 230% and 150% in the medium and upper quartiles, respectively.1
Of course the issue is not only one of rising house prices. What do we know about house price to income ratios? Two of the more useful measures of this ratio are the Massey Housing Affordability Index which uses a mixture of average weekly earnings, interest rates and house prices to calculate its index (a low index shows improved affordability). This graph shows the mix of real payment a household might have to make and how it changes over time. As can be seen in
Figure 3, it is wildly varying over time, but in 2008 was at a similar level to 1989. The second is the Demographia Annual Housing Affordability Survey.
The Demographia Housing Affordability Survey calculates a ‘median multiple’, a number reached by dividing a region’s median house price by median household income. It calculates how many years’ annual household income is necessary to buy a house. The Demographia survey puts the affordable housing level at a median multiple of 3, which puts most New Zealand cities in the unaffordable category on this measure. Auckland rates 6.4 and Christchurch 6.3. This measure is particularly useful because it is linked to regional income and gives
Figure 2: House prices, real and nominal
Source: New Zealand Productivity Commission, Statistics New Zealand, and Quotable Value Limited.
1 Housing Affordability Inquiry. Housing Affordability. Wellington: New Zealand Productivity Commission, 2012, p. 2.
1. The State of Play
1971
1973
1975
1977
1979
1981
1983
1985
1987
1989
1991
1993
1995
1997
1999
2001
2003
2005
2007
2009
250
200
150
100
0
50
Inde
x (b
ase:
200
0Q1=
100)
Nominal Real

4
Priced Out
a view of housing affordability as felt by consumers in different regions.
The Demographia Housing Affordability Survey calculates a ‘median multiple’, a number reached by dividing a region’s median house price by median household income. It calculates how many years’ annual household income is necessary to buy a house. The Demographia survey puts the affordable housing level at a median multiple of 3, which puts most New Zealand cities in the unaffordable category on this measure. Auckland rates 6.4 and Christchurch 6.3. This measure is particularly useful because it is linked to regional income and gives a view of housing affordability as felt by consumers in different regions.
One of the problems in discussions of housing in New Zealand, and most other nations in the Anglosphere, is the use of the term ‘housing market’. The housing market deals with probably the single-largest asset most New Zealanders will invest in during their lifetime. We tend to think of the housing market as a sector relatively free of restriction: you can buy a house as long as you can raise the necessary finance. If you wish to build a house, you find yourself some land, or a plot in a new subdivision, and build on it.
However, this perception is inaccurate in today’s world. There is nothing approaching a free market in housing: it is a market largely created and manipulated by government – whether from Wellington or by local councils.
Figure 3: Net capital stock by asset type
Source: New Zealand Productivity Commission, Massey University Real Estate Analysis Unit.
Government failure, not market failure
Feb
1989
Dec
198
9
Oct
199
0
Aug
199
1
Jun
1992
Apr
199
3
Feb
1994
Dec
199
4
Oct
199
5
Aug
199
6
Jun
1997
Apr
199
8
Feb
1999
Dec
199
9
Oct
200
0
Aug
200
1
Apr
200
3
Feb
2004
Dec
200
4
Oct
200
5
Aug
200
6
Jun
2007
Apr
200
8
Feb
2009
Dec
200
9
Oct
201
0
Aug
201
1
Jun
2002
45
40
35
30
25
20
15
10
5
0
Inde
x
Auckland New Zealand

5www.nzinitiative.org.nz
InternationalAffordability
Rank
Major Market
Affordabflity Rank
National Affordability
RankNation
Metropolitan Market Median Multiple
Median Price
Median Household
Income
299 71 8 NZ Auckland 6.4 $464,400 $72,500
298 7 NZ Christchurch 6.3 $354,600 $55,900
265 5 NZ Dunedin 5.2 $249,700 $47,900
241 2 NZ Hamilton-Waikato 4.8 $303,900 $62,700
241 2 NZ Napier-Hastings 4.8 $265,300 $55,200
216 1 NZ Palmerston North-Manawatu 4.1 $231,700 $56,800
290 6 NZ Tauranga-Western Bay of Plenty 5.9 $334,100 $56,600
255 4 NZ Wellington 5.1 $370,000 $72,000
Median 5.2
Table 1: Demographia Housing Affordability Survey 2012
Sources: The Ninth Annual Demographia Housing Affordability Survey.
Government controls many of the factors that determine the parameters of housing supply. Building conditions, consents, the Resource Management Act, zonings, and development fees – all are relevant to the market. As this report will show, for much of New Zealand’s history, government has also directed the demand side of the housing market.
Of course, some of this is unavoidable and indeed often desirable. No one wants there to be no regulations around housing, few people are keen for open sewage to be floating down their roads, or for there to be leaky homes, a problem with which New Zealand has had much recent experience.
Saying that the housing market is significantly influenced by government is a statement of fact. Talk of ‘market failure’ to describe the housing market is glib and ignores government failures. While noting that the housing market is
significantly influenced by government, there are structural issues that need to be addressed. Figure 4 shows the increase in house prices according to different methods of measurement.
This report is NOT an inquiry or stocktake into the building industry, but it will refer to the complex character of the New Zealand housing market. Regional variations in policy, compliance and governance make the sector impervious to generalisations. New Zealand’s building supply chain is often considered a major culprit in the high housing costs. On its own, this is an unsatisfactory explanation and an excuse for government to heavily regulate successful companies just for being successful. The Productivity
1. The State of Play
What this report is NOT

6
Priced Out
Commission’s report and a BRANZ report in 2008 found that New Zealand houses were, on average, 15% to 25% more expensive to build than Australian houses, and that this could mostly be explained by the ‘cottage industry’ nature of New Zealand’s building sector and New Zealanders’ preference for buying bespoke homes.2 3 That also does not take into account New Zealand’s more difficult geography on which to build, or the earthquake regulations that New Zealand has developed, both of which add to the costs of building. Nor its climate that in the 1990s saw overseas roof designs fail to handle New Zealand’s rain. Provided there is free entry into the market for new suppliers of building products, regulation cannot meaningfully achieve much more.
Nor is this report an in-depth study of the effects of capital gains, credit markets, and cheap loans. The basic problem in the housing market is of demand and supply.
In most other markets, demand spikes are met by increased supply, albeit with a lag. To a substantial extent, supply response is controlled by central and local government regulatory regimes, and the associated building and development industries that operate alongside. In other words, capital gains and access to loans influence demand. The big question is: why does the supply of housing not respond to demand for housing?
New Zealand houses are not only expensive compared to income but their prices too have been rising. Other Anglosphere countries have had similar housing bubbles to New Zealand. Figure 4A shows the massive boom in the Irish housing sector that began in 1997 (followed by its spectacular collapse), and
Figure 4: House price indexes
2 Ibid, pp. 170–180.
3 Page, I.C. New House Price Modelling. Study Report 196. BRANZ: Porirua City, 2008.
Source: BRANZ.
International Comparisons
REINZSection
New House + Section
QVNZ
CGPI
Inde
x, b
ase
1000
Mar
ch 1
992
1992
1993
1994
1995
1996
1997
1998
1999
2000
2001
2002
2003
2004
2005
2006
2007
2008
5000
4500
4000
3500
3000
2500
2000
1500
1000
March

7www.nzinitiative.org.nz
the general price inflation within housing markets. It is interesting to note that the United States, with generally fewer zoning restrictions, and notwithstanding the recent subprime mortgage crisis, has not experienced anything like the sharp upturn in house prices that New Zealand and Australia have. This sample, however, is limited to Anglosphere societies, three of which are relatively young. Figure 4B, drawing on Bank of International Settlements (BIS) data, shows a slightly different picture.
Figure 4a shows the effects of house price inflation in these English speaking countries. However a look at figure 4B reveals the extent to which rampant house price rises in the past twenty years has not been a universal trend. It is important to note that both Switzerland and Germany have had relatively stable prices for a long period of time. The figures in 4B are real house prices adjusted for inflation: they
represent the real and growing value of housing over time. Clearly not all nations consider rampant house price inflation normal.
Figure 5A: Real house price index in the Anglosphere (1997, Q1=100)
Source: OECD.
1. The State of Play
AustraliaUSA Great Britain
Ireland New Zealand
1997
1998
1999
2000
2001
2002
2003
2004
2005
2006
2007
2008
2009
140
100
160
200
240
280
320

8
Priced Out
Figure 5B: Real house prices across a range of countries since the 1970s
Source: Bank for International Settlements/authors’ calculations.
UK
Australia
Spain
Switzerland
Ireland
New Zealand
Germany
USA
200
150
250
300
350
400
450
Bas
e 19
76(4
) = 1
00
100
50
0
Mar
197
0M
ay 1
971
Jul 1
972
Sep
1973
Nov
197
4Ja
n 19
76M
ar 1
977
May
197
8Ju
l 197
9Se
p 19
80
Nov
198
8Ja
n 19
90M
ar 1
991
May
199
2Ju
l 199
3Se
p 19
94N
ov 1
995
Jan
1997
Mar
199
8M
ay 1
999
Jul 2
000
Sep
2001
Nov
200
2Ja
n 20
04M
ar 2
005
May
200
6Ju
l 200
7Se
p 20
08N
ov 2
009
Jan
2011
Nov
198
1Ja
n 19
83M
ar 1
984
May
198
5Ju
l 198
6Se
p 19
87
Mar
201
2
House prices deflated by the CPI

9www.nzinitiative.org.nz
2.Government in the Business of Building
As late as the mid-1950s, there were few planning regulations in New Zealand. District planning schemes were just starting to emerge in most urban areas. They envisaged the classification of land according to its best use. Anyone wanting to make a major departure from a district scheme after approval required permission from the local authority. Constructing a house on one’s own land was still a fairly easy proposition with only a few basic rules to follow: height restrictions, minimum ceiling levels, and six feet (later two metres) from the section boundary so as to not inconvenience neighbours. In areas with small sections, side walls had to be constructed with non-flammable material like corrugated iron in case of fire, which was a recurring nightmare in settler societies. Some sanitary requirements were also introduced. After a bubonic plague scare in Auckland in 1900, the British Empire’s first Minister of Health dispatched his medical officers to examine conditions in the infected parts of the rapidly growing city. They reported back about unsanitary practices in overcrowded areas in central Auckland, and about suburban problems where artesian water was being drawn in areas close to long-drop toilets. This endangered freshwater cleanliness, and contributed to diarrhoea
that often killed infants.4 Governments enforced stricter health requirements, especially after the influenza epidemic of 1918. Yet, as late as 1940, the results of a national housing survey showed 44,000 homes or 20% of the total housing stock in New Zealand lacking essential amenities such as power and running water.5
Before the 1950s, most housing rules emanated from the central government rather than local authorities. The central government, however, had been trying to delegate. The Housing Act 1919 specified sums of government money that local authorities could borrow to erect workers’ dwellings. But only city councils in bigger cities like Auckland and Wellington erected houses to sell to workers.6 Several main city mayors experimented with affordable housing but retreated after finding that ratepayer subsidies would be needed.7 From the early years of the twentieth century, councils were under pressure to construct sewerage systems rather than emptying night soil into harbours on the outgoing tide. Eventually central government extended subsidies for sewerage plants so local authorities could undertake the necessary infrastructure work, and most councils embarked on sewerage schemes. Infant mortality statistics rapidly improved. Only a few extremists questioned such requirements on local authorities and house builders.
In the early years of the twentieth
Pomare. M. Etahi Mate Rere. Report of the Department of Health Wellington: Department of Public Health, 1902.
4 Bassett, Michael. Sir Joseph Ward: A Political Biography. Auckland: Auckland University Press, 1993, pp. 118–120.
5 New Zealand. New Zealand Official Year Book. Auckland: Statistics New Zealand, 1990, pp. 514–516.
6 A substantial number of houses were erected in the early 1920s on Old Mill Road and its side streets near what became Auckland Zoo.
7 Goldsmith, Paul and Michael Bassett. The Myers Auckland: David Ling, 2007, pp. 86–87.
Planning in New Zealand: The beginnings

10
Priced Out
century when municipal reform and town planning were being discussed in the United States and Europe, New Zealanders also began to contemplate them. But no town planning Act existed here until 1926. That legislation required boroughs and towns containing 1,000 people or more to appoint a director of town planning who would draw up a scheme and have it approved by central government’s Public Works Department no later than 1931. However, most councils were unable to recruit town planners and were given repeated extensions to register their schemes. Then World War II intervened. By 1953 only 17 councils, out of 100 or more that ought to have possessed planning systems, actually had one.8 In any event, the role of town planning was vague. The 1926 Act specified that a borough or city should plan “in such a way as will most effectively tend to promote its healthfulness, amenity, convenience, and advancement”.9
“We must organise the distribution of our population,” proclaimed the Town and Country Planning Act 1953. The shortage of town planners slowed the introduction of district and regional schemes. As late as 1956, only the University of Auckland taught a course in planning. It had one recognised town planner on its staff and he was located within the architecture department. He taught a paper called ‘Architectural Civics’ covering a broad sweep of planning since the Roman times; the value of plans and how they should be prepared; and street layout, zoning and open spaces.10 By the mid-1960s, Auckland possessed a separate planning department, but only three lecturers. Councils still employed few planners, who tended to be imports from the United Kingdom, where the concept of planning had been developing apace since Britain’s Town and Country Planning Act 1947.
Passage of New Zealand’s Town and Country Planning Act 1953 acted as a
Box 1: Urban sprawl: a short history in New Zealand
The negative perception of urban sprawl is not new to this country, and environmentally concerned observers were not the first to object to it. As early as the 1950s, there was parliamentary concern with ‘ribbon developments’ (developments forming like a ribbon along main roads out of cities).
In fact, back then the concern was not so much with taking up farmland or environmental impacts, but that the government was not in control. The National Government minister, W.S. Goosman, declared: “People can’t just do as they want!”
Concerned with the rising costs of infrastructure, voters soon began demanding better services. Moreover, urban sprawl went against the tenor of the Town and Country Planning Act – a benevolent piece of legislation whereby towns and settlements could be neatly and efficiently planned.
8 New Zealand. New Zealand Official Year Book. Auckland: Statistics New Zealand, 1954, p. 1062.
9 New Zealand Statutes 1926, Town Planning Act 1926. 1926 No. 52.
10 The University of New Zealand Calendar 1956, p. 174.
“We must organise the distribution of our population.”The Town and Country Planning Act 1953
11www.nzinitiative.org.nz
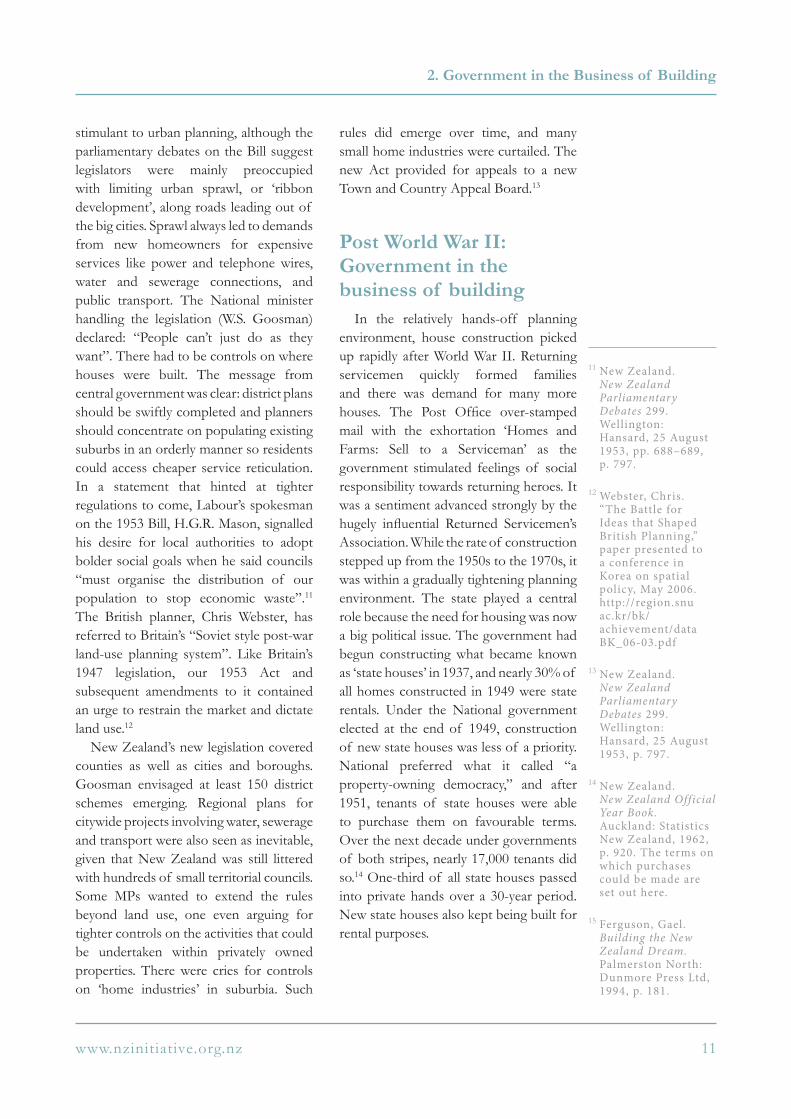
stimulant to urban planning, although the parliamentary debates on the Bill suggest legislators were mainly preoccupied with limiting urban sprawl, or ‘ribbon development’, along roads leading out of the big cities. Sprawl always led to demands from new homeowners for expensive services like power and telephone wires, water and sewerage connections, and public transport. The National minister handling the legislation (W.S. Goosman) declared: “People can’t just do as they want”. There had to be controls on where houses were built. The message from central government was clear: district plans should be swiftly completed and planners should concentrate on populating existing suburbs in an orderly manner so residents could access cheaper service reticulation. In a statement that hinted at tighter regulations to come, Labour’s spokesman on the 1953 Bill, H.G.R. Mason, signalled his desire for local authorities to adopt bolder social goals when he said councils “must organise the distribution of our population to stop economic waste”.11 The British planner, Chris Webster, has referred to Britain’s “Soviet style post-war land-use planning system”. Like Britain’s 1947 legislation, our 1953 Act and subsequent amendments to it contained an urge to restrain the market and dictate land use.12
New Zealand’s new legislation covered counties as well as cities and boroughs. Goosman envisaged at least 150 district schemes emerging. Regional plans for citywide projects involving water, sewerage and transport were also seen as inevitable, given that New Zealand was still littered with hundreds of small territorial councils. Some MPs wanted to extend the rules beyond land use, one even arguing for tighter controls on the activities that could be undertaken within privately owned properties. There were cries for controls on ‘home industries’ in suburbia. Such
rules did emerge over time, and many small home industries were curtailed. The new Act provided for appeals to a new Town and Country Appeal Board.13
In the relatively hands-off planning environment, house construction picked up rapidly after World War II. Returning servicemen quickly formed families and there was demand for many more houses. The Post Office over-stamped mail with the exhortation ‘Homes and Farms: Sell to a Serviceman’ as the government stimulated feelings of social responsibility towards returning heroes. It was a sentiment advanced strongly by the hugely influential Returned Servicemen’s Association. While the rate of construction stepped up from the 1950s to the 1970s, it was within a gradually tightening planning environment. The state played a central role because the need for housing was now a big political issue. The government had begun constructing what became known as ‘state houses’ in 1937, and nearly 30% of all homes constructed in 1949 were state rentals. Under the National government elected at the end of 1949, construction of new state houses was less of a priority. National preferred what it called “a property-owning democracy,” and after 1951, tenants of state houses were able to purchase them on favourable terms. Over the next decade under governments of both stripes, nearly 17,000 tenants did so.14 One-third of all state houses passed into private hands over a 30-year period. New state houses also kept being built for rental purposes.
11 New Zealand. New Zealand Parliamentary Debates 299. Wellington: Hansard, 25 August 1953, pp. 688–689, p. 797.
12 Webster, Chris. “The Battle for Ideas that Shaped British Planning,” paper presented to a conference in Korea on spatial policy, May 2006. http://region.snu ac.kr/bk/ achievement/data BK_06-03.pdf
13 New Zealand. New Zealand Parliamentary Debates 299. Wellington: Hansard, 25 August 1953, p. 797.
14 New Zealand. New Zealand Official Year Book. Auckland: Statistics New Zealand, 1962, p. 920. The terms on which purchases could be made are set out here.
15 Ferguson, Gael. Building the New Zealand Dream. Palmerston North: Dunmore Press Ltd, 1994, p. 181.
2. Government in the Business of Building
Post World War II: Government in the business of building
12
Priced Out
Government involvement with private construction stepped up during the 1950s. In 1949, state assistance financed 19% of all new homes constructed; by 1954, 33.6% of all new homes benefitted from a State Advances loan.15 As yet, there was no entrenched lobby organisation like Britain’s Campaign for the Protection of Rural England, and planners were still few and far between. Developers were encouraged by the government, popular sentiment, and local authorities to acquire and open up tracts of land, some of it Crown leasehold land on the periphery of big cities, to house baby boomers. Dick White, managing director of Neil Homes and a member of the Master Builders Federation, recalls that local authorities willingly cooperated with developers in the 1950s and early 1960s. House construction was performed in a more orderly and efficient manner than before because it was being done on a larger, coordinated scale. Initially, the developers would arrange with the Crown to build on leasehold sections and the end buyer would pay the lease. Then insurance companies became involved, purchasing the leasehold land from the Crown and entering into a commercial arrangement with the intended homeowner.16 Gradually, extended motorway systems linked suburbs within Auckland and Wellington, making travel to work easier. The opening of the Auckland Harbour Bridge in 1959 led to rapid house construction north of the bridge, mainly for first-home buyers. Wellington’s Ngauranga Gorge motorway and the Hutt expressway opened up areas like Paparangi, Titahi Bay, Naenae, Upper Hutt and Wainuiomata.
The 1960s and early 1970s were a golden age for first-home buyers. In the
Auckland region, Panmure, West Tamaki and Pakuranga-Howick were developed. Fletcher Construction Ltd alone built 1,000 homes in Pakuranga.17 When British immigrants flowed into the country in the early 1970s, many of them looking to buy in west Auckland, the demand for new houses skyrocketed. White recalls Bill Fraser, the Minister of Housing (1972–74) in the third Labour Government, threatening to invite Australian building firms to New Zealand if local contractors did not step up the pace of construction of houses on around 1,000 square feet blocks of land on the outskirts of the big cities.18 In the early 1970s, ministers were more involved in the housing market than at any time in the country’s history. Finance for housing was their biggest political challenge.
After the Advances to Settlers Act 1894, governments borrowed in London and on-lent to people at rates of interest lower than what local commercial banks were charging so they could buy farms and get a foot on the housing ladder. Then came the Workers’ Dwellings Act 1905, which enabled houses to be built and rented, leased or sold to workers who earned less than £156 ($312) per annum. The income threshold was the average wage for a skilled worker.19 The Advances to Workers Act 1906 provided cheap loans to urban workers for housing if their income was £186 ($372) per annum or less.20 These acts were consolidated in 1913 and administered by the Department of State Advances.21 State involvement in housing increased under the Savage and Fraser Labour governments after 1935 with further assistance to those wanting
16 Personal interview with Dick White, former managing director of Neil Homes, 19 October 2012.
17 Auckland. A Brief History of Auckland’s Urban Form. Auckland: Auckland Regional Council, 2010, pp. 16–17.
18 Personal interview with Dick White, former managing director of Neil Homes, 16 October 2012; Ferguson, Gael. Building the New Zealand Dream. Palmerston North: Dunmore Press Ltd, 1994, pp. 238–239.
19 New Zealand. New Zealand Official Year Book. Auckland: Statistics New Zealand, 1914, p. 743, pp. 812–813.
20 Ferguson, Gael. Building the New Zealand Dream. Palmerston North: Dunmore Press Ltd, 1994, Chapter 2. The income limit was raised to £200 in 1906.
21 The Department of State Advances became the State Advances Corporation in 1965, which was then incorporated, along with the Housing Division of the Ministry of Works, into the Housing Corporation of New Zealand in 1974.
The State Advances Corporation and government-backed loans
A culture of construction: Government-subsidised house building and loans
13www.nzinitiative.org.nz
to build homes. After 1937 came ‘state houses’ for renting to workers.22 In 1958, government assistance to first-home buyers took a quantum leap forward. Walter Nash’s Labour government passed the Family Benefit (Home Ownership) Act that came into force on 1 April 1959. It enabled young couples to capitalise the Family Benefit payable to mothers for children under the age of 16, and use it, along with the 3% loans from State Advances, to build first homes. Initially, each family could capitalise a maximum of $2,000. In the year to 31 March 1961, 11,442 applications for capitalisation were approved. That number subsided a little during the 1960s but it averaged more than 7,500 each year into the mid-1970s.23
In Auckland, Hamilton, Tauranga, Wellington and Christchurch, construction firms working closely with the State Advances Corporation began specialising in first-home building. The corporation initially specified that sections could not exceed £750 ($1,500) to qualify for capitalisation. Neil Homes, Universal Homes, Reid Housing (“This is the house that Reid built” went the TV jingle), Beazley Homes, and other construction firms acquired tracts of land in areas like Mt Roskill, Green Bay, Te Atatu, Massey, Glenfield, Beachaven, Otara, Tauranga, Paparangi, Wainuiomata and Waimairi County. Taking advantage of the state finance available to young couples, Neil Homes alone constructed 20,000 first homes of around 1,000 square feet (90 to 100 square metres) over a 30-year period, adding considerably to the total housing stock in Auckland, Hamilton and Whangarei.24 Keith Hay Homes did not invest in land, preferring to construct at its bases and truck the houses to sites arranged by the purchaser.25 With so many new dwellings coming on to the market for first-home buyers, the pressure on the prices of existing housing stock remained
fairly steady except when property prices across the country surged for several years in the early 1970s as rising inflation and immigration numbers increased housing demand.
Initially, local authorities left individual home buyers to pay for their own service connections, but this was gradually pushed aside in favour of requiring developers to reticulate the new areas being opened up. Footpaths, water and sewerage connections, electricity and phone reticulation were much cheaper when done on a larger, more coordinated scale. By the late 1960s, local authorities mandated reticulation to be done for the sale of house sections to proceed. The cost was added to the end price of the section, or to the total price if it was a package including a house. Buyers were now expected to pay upfront for the complete product whereas previously they would have acquired the extra services over time as they felt they could afford them.
By 1977, a ‘standard house’ of about 90 to 100 square metres standing on a section priced at $6,970 cost an average of $18,650 to build.26 Figure 5 shows how the average consented floor space has greatly increased since then. The era of the £750 ($1,500) section had long gone. By the mid-1970s, 7% to 8% of New Zealand’s workforce was engaged in residential building and allied sectors. Forestry, the concrete industry, non-metallic and metallic fittings makers, carpenters, electricians and plumbers – all were affected by the surge in house building.27 Neil Homes alone employed 600 people at several building sites.28 There was other new building too, but entry-level construction dominated the market and remained a hot political issue because of its ripple effect on the rest of the housing market.
22 Ferguson, Gael. Building the New Zealand Dream. Palmerston North: Dunmore Press Ltd, 1994, Chapter 3.
23 New Zealand. New Zealand Official Year Book. Auckland: Statistics New Zealand, 1962, p. 186; 1970, p.183.
24 Personal interview with Dick White, former managing director of Neil Homes, 16 October 2012.
25 Personal interview with David Hay, managing director of Keith Hay Homes, 5 November 2012. Formed in 1938, the company built 22,000 houses over 60 years.
26 New Zealand. New Zealand Official Year Book. Auckland: Statistics New Zealand, 1977, p. 465.
27 Ibid, p. 463.
28 Personal interview with Dick White, former managing director of Neil Homes, 19 October 2012.
2. Government in the Business of Building

14
Priced Out
Figure 6: Floor area per new dwelling consented
Source: Statistics New Zealand.
Floo
r are
a (m
sq)
1974
1976
1978
1980
1982
200
180
160
140
120
100
March
1984
1986
1988
1990
1992
1994
1996
1998
2000
2002
2004
2006
2008

15www.nzinitiative.org.nz
3.Economic Change Alters the Market
29 Areas where mass building had taken place in the 1950s, 1960s and early 1970s, such as Te Atatu, Ranui and Massey, were originally little more than dormitory suburbs from which people travelled across the city to work.
30 New Zealand. New Zealand Official Year Book. Auckland: Statistics New Zealand, 1977, p. 466; 1970, p. 532.
31 Personal interview with Dick White, former managing director of Neil Homes, 19 October 2012. David Hay, managing director of Keith Hay Homes, said 2012 was the best year for Keith Hay Homes in a personal interview, 5 November 2012.
32 New Zealand. New Zealand Official Year Book. Auckland: Statistics New Zealand, 1977, p. 463.
33 Ferguson, Gael. Building the New Zealand Dream. Palmerston North: Dunmore Press Ltd, 1994, p. 239.
After 1963, New Zealand’s birth rate began to subside. Although government assistance to first-home buyers increased under the Kirk-Rowling Government between 1972 and 1975, the number of buyers of new homes on the cities’ peripheries started a gentle downwards trajectory. This was further depressed by the Holyoake Government’s slowdown of housing finance during the 1967–68 recession, and the first oil price shock in 1973. The latter lifted petrol prices and made commuting to work by car more expensive. Peripheral suburbs temporarily lost their allure to indebted young families because little attention had been given to locating industry and jobs within many of the early developments. More attention was now given to providing employment opportunities within new subdivisions.29 The Labour Government’s renewed efforts to stimulate the building industry after 1972 saw new house construction pick up, but building costs rose as shortages of building supplies caused problems. In 1975, the total number of completed units reached 34,400, the highest annual figure since World War II.30 White recalled it as Neil Homes’ best ever year when the firm completed approximately 20 houses every week.31 The proportion of inner suburban flats on infill sections also rose. Flats in established suburbs had been 5.5% of total new houses in 1960; they reached 35% in 1975. Denuded parts of Auckland’s inner city, starting with the
urban renewal project in Freeman’s Bay in the early 1970s, were densely re-settled with houses and units. Some people sought to reduce transport costs and get a roof over their heads for an affordable price.32 Sections were smaller on average.
But as historian Gael Ferguson has observed, Labour’s policies between 1972 and 1975 “proved to be the swan-song of the approach first developed in the 1950s. They interrupted a longer-term decline in state lending”.33 New Zealand’s economic malaise was starting to have an impact on families and housing. The sliding terms of trade after 1973 reduced the number of second jobs and overtime, thereby depressing total family incomes. This made it harder to get a first step on the housing ladder. Nobody realised it at the time, but the country was entering a 20-year recession. The inflation rate kept rising as central government spent to the hilt while growth declined into stagflation. Excessive borrowing and declining productivity became inter-locking parts of New Zealand’s economic malaise. From the early 1960s, the inflation rate exceeded the OECD average for almost 30 years and skyrocketed after 1978. Rising prices flowed through to housing. When the Family Benefit was increased to $6 per child per week in 1979, the maximum that could be capitalised was lifted to $3,000, but passing the means test for concessional loans was now more difficult to pass. Robert Muldoon’s National Government after 1975 had cut back the amount of money loaned by the
Costs begin to rise

16
Priced Out
Housing Corporation, and raised interest rates.34 Lending at concessional rates was available only to people who earned average or below average wages, so the numbers uplifting state loans declined.
Muldoon’s Minister of Works and Housing from 1978–82, Derek Quigley, significantly altered the housing market with his decision to change the Housing Corporation’s (formerly State Advances Corporation) lending rules in April 1979. Henceforth, capitalisation and state loans could be spent on existing houses as well as on new homes. Quigley recalls that all ministers were required early in 1979 to reduce spending by 3%, and since the demand for new houses was such that they were now more expensive than existing homes, he decided to give first-home buyers the choice of buying an existing home in an older, and usually more central, suburb.35 Sensible as that explanation seems, it severely affected on those companies concentrating on first-home construction. Not even the introduction of a Housing Corporation $4,000 suspensory loan to buyers who chose to build a new home arrested the decline in first-home construction. Fletcher Construction’s residential section contracted.36 Neil Homes, which had been a darling of the share market a few years earlier, shifted its emphasis towards acquiring land, providing building supplies, and constructing pensioner villages (which were still subsidised).37 The company continued to buy blocks of land on the perimeters of cities, but its construction of houses for first-home buyers slowed. Other first-home builders also altered their direction as housing finance diminished.
In the financial year 1984–85, two-thirds of all Housing Corporation loans extended to first-home buyers were used to buy existing houses.38 But apart from an upward blip in 1979 when the rules were
changed, the numbers capitalising the family benefit and uplifting a concessional loan declined. In 1977, 2,663 first-home buyers qualified compared to 2,445 in 1982.39 Lifting the maximum amount that could be capitalised to $4,000 did little to stimulate the house building market until the Lange Labour Government altered the range of loans available to first-home buyers. Inflation raged temporarily as interest rate controls were removed. A total of 9,019 families capitalised benefits in 1985–86 before the system was abolished on 1 October 1986 and replaced by what became known as Homestart lending. Under the new scheme, up to $12,000 could be extended for five years to assist average and below average income earners into a new or an existing house.40 But in the year to March 1987, first-home buyers still preferred to purchase existing homes over new constructions by a margin of 10:2.41
Besides the falling birth rate, another demographic shift was having a big impact on housing demand. The Domestic Purposes Benefit (DPB), which was payable mostly to women with dependants but no spouse, came into effect on 1 April 1974. The number of recipients rose from 17,231 on 31 March 1975 to 56,548 a decade later, and to 96,335 by 30 June 1993. More than 113,000 recipients were on the DPB in December 2003, nearly all of them women living alone with their children.42 As an institution, marriage was declining as divorce rates accelerated and partnerships collapsed more frequently. The number of divorces increased from 3,347 in 1971 to 10,037 in 1998.43 With only one benefit coming into the household, and, for a handful
34 Ibid, pp. 241–242.
35 Personal interview with Derek Quigley, 31 October 2012.
36 Goldsmith, Paul. Fletchers: A Centennial History of Fletcher Building. Auckland: David Ling, 2009, p. 224.
37 Personal interview with Dick White, former managing director of Neil Homes, 16 and 19 October 2012.
38 New Zealand. New Zealand Official Year Book. Auckland: Statistics New Zealand, 1986–87, p. 539.
39 Ibid, 1983, p. 181.
40 Ibid, 1987–88, p. 185; 1988–89, pp. 626–627. Family Benefits were abolished in December 1990.
41 Ibid, 1988–89, p. 626.
42 Ibid, 1977, p. 150; 1986–87, p. 209; 1994, p. 145; 2004, p. 121.
43 Ibid, 1977, p. 112; 2000, p.123.
The changing face of cultures and households
17www.nzinitiative.org.nz
Box 2: Capitalisation of the Family Benefit and 3% loans
New Zealand’s historically high rate of homeownership was partly the result of government subsidies through capitalisation of the Family Benefit and 3% loans extended by the State Advances/Housing Corporation. Between the early 1960s and the mid-1970s, there were on average 7,500 capitalisations and 3% loans for newly built homes per year. Since these houses and loans were for first-home buyers, they increased urban expansion and helped contribute to many run-down inner city neighbourhoods. With the aspirational young taking the subsidy and abandoning the cities for the periphery, inner city house prices were driven down and prices of suburban homes remained relatively stable.
While there are many policy actions government could take to make housing more affordable and to help the housing market, New Zealand’s abnormally high rate of homeownership is most likely a thing of the past. Although levels of ownership can be increased through the right policies, the percentage of homeownership is now back to where it was in 1916, after which time government progressively got involved in providing houses and housing subsidies.
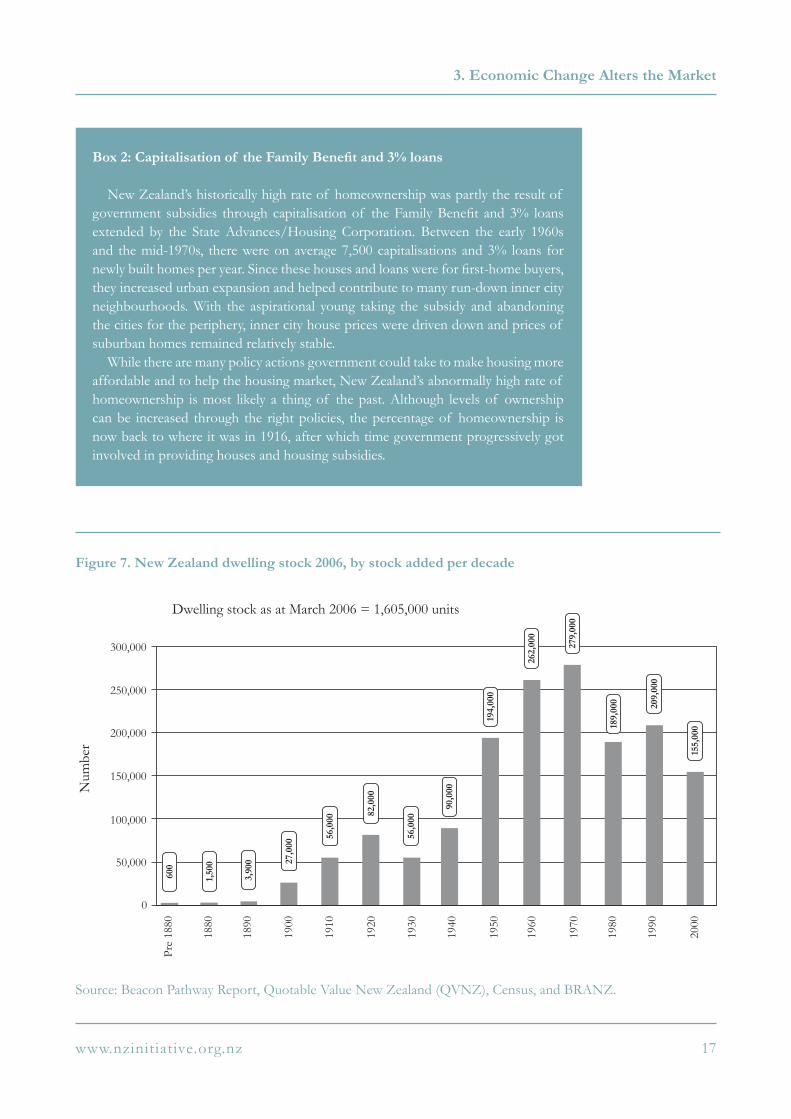
Figure 7. New Zealand dwelling stock 2006, by stock added per decade
Source: Beacon Pathway Report, Quotable Value New Zealand (QVNZ), Census, and BRANZ.
3. Economic Change Alters the Market
Pre
1880
1880
1890
1900
1910
1920
1930
1940
1950
1960
1970
1980
1990
2000
0
100,000
150,000
200,000
250,000
300,000
Num
ber
279,
000
262,
000
194,
000
90,0
00
56,0
00
82,0
00
56,0
00
27,0
00
3,90
0
1,50
0
600
189,
000 209,
000
155,
000
50,000
Dwelling stock as at March 2006 = 1,605,000 units

18
Priced Out
of women if they were lucky, half the proceeds of a broken marriage, the ability to buy a new home retreated steadily for this growing segment of the population. Another less significant trend saw people in their late teens and early 20s leaving home and renting before marriage. This, too, increased household formation and overall demand for accommodation. Not surprisingly, the average number of adults living in a New Zealand house subsided. A rising number of dwellings were occupied by only one person, a trend that continues to this day. At the end of World War II, there were on average 4.42 inhabitants per dwelling; by 2006 the average number per household stood at 2.7.44 In effect, there were more households wanting roofs over their heads even though many of them could not contemplate purchasing or building. Governments devised an ever more complex array of means-tested benefits to assist those whose choices kept confining them to rental accommodation. These social trends increased the pressure for building new houses and state support to renters.
While all this was going on, the number of new homes built each year plateaued at between 14,000 and 15,000 across the country during the early 1980s, rising slightly above 20,000 during the Lange-Palmer Labour governments, and subsiding again in the 1990s.45 Figure 7 shows the amount of housing completions per decade, and how they have contributed to the total housing stock. The sale of education to foreigners after changes to the Immigration Act in 1986 saw many small high-rise units – some as small as 28 square metres – built near universities and language institutes. Auckland’s inner-city
resident population increased by 500% to more than 17,000 between 1991 and 2006.46 At the end of 2005, The New Zealand Herald estimated that as many as 9,000 inner-city apartments had been constructed in central Auckland, some of them now empty because several language institutes were in financial trouble.47 Under the Clark Labour Government elected in 1999, the number of new dwellings constructed each year rose – averaging 23,000 before sliding with the onset of the global financial crisis in 2007–08.48 In 2011, 15,832 new dwellings were completed.49 However, an estimated 22,000 new households were formed that year.50 It was now many years since construction levels had approximated the rate of demand for new houses. Not surprisingly, the number of people renting had been going up for many years. About 20% of the population rented in the 1970s; 29.3% by 1996; and 33.1% by 2006.51 Table 2 shows the estimated increase in the number of households and potential shortfall of houses.
As new house construction gradually subsided, a smaller portion of the workforce was involved in building – from almost 8% in the mid-1970s down to a little over 6% by the onset of the global financial crisis in 2007–08.52 In 1977, nearly 50% of all existing houses had been constructed since 1953, a significant percentage of them driven by the availability of state assistance.53 The fall in building for first-home buyers meant the average size of the houses edged upwards to 125 square metres by 1990.54 The total stock of cheaper, smaller homes was no longer expanding rapidly. Eventually, the price of existing smaller, cheaper houses started to climb. A complex supply and demand problem was emerging – the number of newly completed homes in 2011 was only 46% of the number built 35 years earlier, yet the number of households
44 Ibid, 2010, p. 407.
45 Ibid, 1986–87, p. 536; 1994, p. 426.
46 Auckland. A Brief History of Auckland’s Urban Form. Auckland: Auckland Regional Council, 2010, p. 25.
47 Gibson, Anne. “Apartments Fail to Sell.” The New Zealand Herald 21 October 2005: B2–3; Gibson, Anne. “Tenants Shun CBD’s Shoebox Apartments.” The New Zealand Herald 1 November 2005: A4.
48 New Zealand. New Zealand Official Year Book. Auckland: Statistics New Zealand, 2010, p. 417.
49 New Zealand. New Zealand Housing Report 2009/2010: Structures, Pressures and Issues. Wellington: Department of Building and Housing, 2010, p. 40.
50 Ibid, p. 21.
51 New Zealand. New Zealand Official Year Book. Auckland: Statistics New Zealand, 2010, p. 407.
52 Ibid, 2008, p. 419; 2010, p. 414.
53 Ibid, 1977, p. 465.
54 Ibid, 1990, p. 513.
Household completions subside

19www.nzinitiative.org.nz
needing a roof over their heads had risen significantly in the interim.55
While efforts were made in the early 1980s to control building costs in the hope that more homes would be constructed, a growing shortage of state finance plus rising inflation gradually changed the building industry. Muldoon’s Wage-Price Freeze imposed in June 1982 did not restrain land prices, and section costs kept rising.56 With the economic difficulties besetting the country, the government no longer had enough money to keep lending for housing on the scale that had applied in earlier times. The Housing Corporation resorted more and more to operating a mortgage guarantee system introduced in 1977. It guaranteed up to 90% of the funds raised privately by first-home buyers.57 In 1984–85, the Housing Corporation issued 4,124 guarantees.58 Borrowing money privately, however,
remained difficult for those who had little equity. The government’s Reserve Ratio system dating from the war years required trading and trustee banks and other lending institutions to invest substantial tranches of money in government stock. This meant that most lending institutions suffered from a perennial shortage of money for home lending until the Reserve Ratio system was abolished at the end of 1984. By then, interest rates were skyrocketing because the Lange Labour Government removed interest rate controls and loosened a rigidly controlled economy back into a less regulated state. Bank and insurance company money became available, but at interest rates many first-home buyers could not afford. The process of economic readjustment in the 1980s exacerbated some of the already worrying trends in affordable housing. New ‘standard homes’ that had done so much in the past to moderate prices across the housing sector did not increase as rapidly as before and were not moderating overall prices in the way they
Table 2: Forecast shortfalls in housing completions
Source: Statistics New Zealand and Department of Building and Housing estimates using data from Infometrics.
55 Ibid, 1988–89, p. 623.
56 Ibid, 1985, p. 537.
57 Ibid.
58 Ibid, 1986–87, p. 539.
PeriodExpected increase in the number of
households
Expected increase in the number of new dwellings that would
add to supply
Shortfall/surplus
2006-2009 66,000 55,734 -10,266
2009-2011 45,000 28,419 -16,581
2011-2016 112,800 98,028 -14,772
2016-2021 108,000 97,397 -10,603
2021-2026 104,000 89,946 -14,054
2026-2031 99,000 101,322 2,322
3. Economic Change Alters the Market
When the money dried up

20
Priced Out
once had done. While the number of first homes constructed rose in the late 1980s, not all those wanting to take the first step on the housing ladder got there. A gap between demand and supply remained. Finance was part of the problem. The total price of any home now required so many more times the average wage that servicing the borrowing costs was beyond the capacity of many average income families to contemplate. There can be no surprise that the section of the population that prefers to rent has been rising steadily.
Under the Local Government Act 1974, local authorities were authorised to provide housing loans and subdivide council-owned land for housing. They could also sell or lease allotments and apply to their local authority’s loans board to borrow to purchase land for subdivision. These legislative provisions amplified rules that had existed since 1919. However, while local authorities were verbally encouraged to assist with housing, only a couple in Hawke’s Bay plus the Auckland City Council ventured into housing. In 1938, the Labour Party firebrand John A. Lee regretted the lack of oversight on local authorities, which had constructed only 800 houses in 20 years.59 In the financial year 1982–83, only 128 local authority housing loans were approved and a paltry 78 in 1984–85.60 Central government claimed to want local authority cooperation on housing, but provided incentives only for the construction of pensioner accommodation. In any event, after many years of an involved state, most councils regarded housing for first-home buyers a social responsibility of central government. Councils showed little appetite for getting involved in what
would inevitably require a ratepayer-funded bureaucracy to administer.61
Nothing had happened since the 1920s to convince councils that involvement in housing would be anything but a drag on their ratepayers.
Worse still, by 1980, at the very time when housing needed more stimulation, or at least a freer approach from government and local authorities if it was to keep up with rising demand, planners and legislators contrived to make new house building more difficult. Planning became more dirigiste, not less. Before 1989, there were 235 territorial local authorities plus 22 regional councils and hundreds of special purpose bodies. By the 1980s, most of them, particularly the bigger city and regional councils, employed planners. Their plans ‘zoned’ land within a district. Zones protected existing uses of the land, and slowed changes to its use. Universities were now churning out planners. They offered degrees and post-graduate degrees in planning. Questionable theories seemed to be the dominant source of inspiration. The outlines for courses were pregnant with a ‘we know best’ set of assumptions. The 2012 first-year course outlines for students at the University of Auckland use the words “equity in the allocation of resources” and “sustainable development”. In the hands of planners, the buzz term ‘sustainability’ seemed in practice to mean more intensive use of brownfields land. The University of Auckland offered a paper on planning, gender and equity. Concern about technical issues was being replaced by social agendas and theories about the ideal shape of societies.
While the provision of housing for low income people had traditionally been a bipartisan political cause, environmental and Greens agendas advocated by more affluent people started to trump traditional working class social aspirations. Economic growth, which had done
59 Lee, John A. Socialism in New Zealand. London: T.W. Laurie, 1938.
60 New Zealand. New Zealand Official Year Book. Auckland: Statistics New Zealand, 1986–87, p. 542.
61 Bassett, Michael. History of Auckland City Council 1989–2010. Forthcoming. Chapters 9 and 10.
Trends in local planning: The rise of the planners
21www.nzinitiative.org.nz
so much to open up opportunities for ordinary people, was pushed aside. These new agendas became more obvious at the council level after the passage of the Town and Country Planning Act 1977 by Robert Muldoon’s National Government. The new legislation consolidated several amendments passed since 1953 and took into account the work of a review committee in the early 1970s. Section 3 in the 1977 Act widened the purpose of the 1953 Act. It sought to encourage “the wise use and management of resources” and “the direction and control of the development of a region, district or area in such a way as will most effectively promote and safeguard the health, safety, convenience, and the economic, cultural, social and general welfare of the people and the amenities of every part of the region, district or area”. Environmental and conservation considerations featured in the legislation’s goals. Although less than 1% of New Zealand’s total land mass was lived upon, councils were expected to avoid ‘unnecessary’ expansion of
urban areas on to adjoining productive land. As 22 regional and unitary councils now covered New Zealand, the 1977 Act specifically recognised regional plans. They were mandatory and binding on the various territorial district schemes in a region. The appeal board was reconstituted as a tribunal. As a New Zealand Business Roundtable paper noted, the purpose of town and country planning had moved well beyond land use controls to “set[ting] the direction and control of virtually all forms of development”.62 The 1977 Act was a charter for those with wider social and environmental agendas.
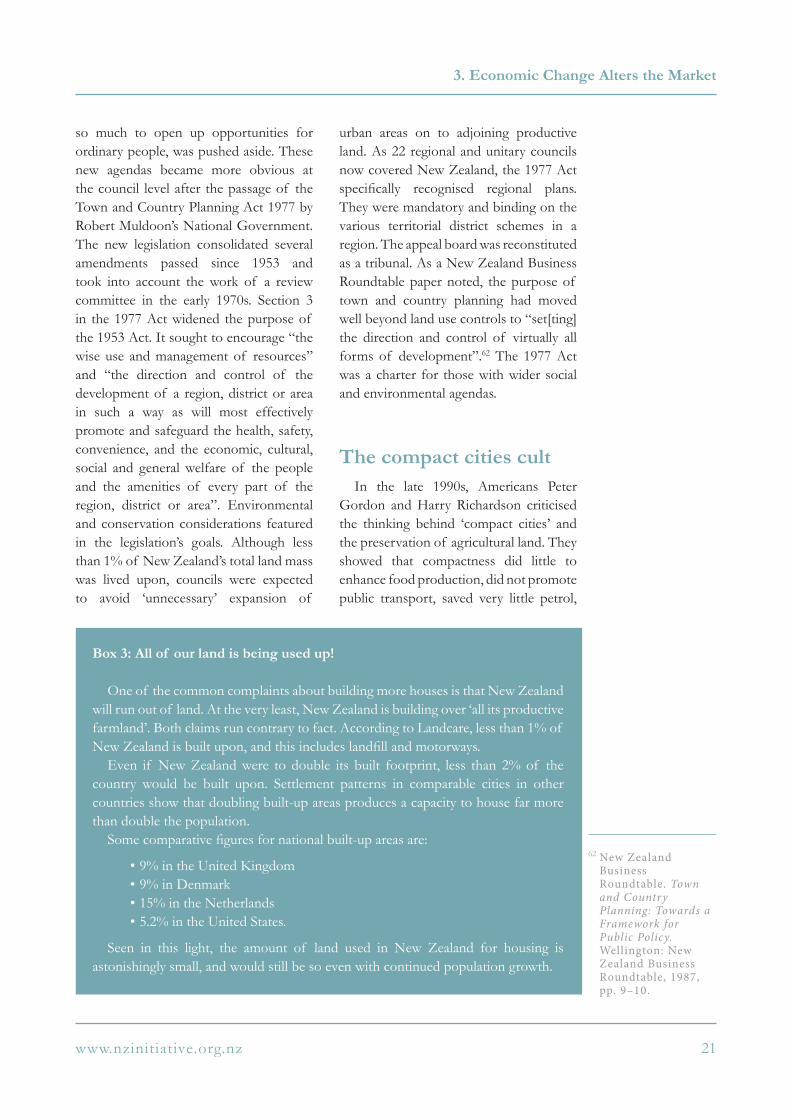
In the late 1990s, Americans Peter Gordon and Harry Richardson criticised the thinking behind ‘compact cities’ and the preservation of agricultural land. They showed that compactness did little to enhance food production, did not promote public transport, saved very little petrol,
Box 3: All of our land is being used up!
One of the common complaints about building more houses is that New Zealand will run out of land. At the very least, New Zealand is building over ‘all its productive farmland’. Both claims run contrary to fact. According to Landcare, less than 1% of New Zealand is built upon, and this includes landfill and motorways.
Even if New Zealand were to double its built footprint, less than 2% of the country would be built upon. Settlement patterns in comparable cities in other countries show that doubling built-up areas produces a capacity to house far more than double the population.
Some comparative figures for national built-up areas are:
• 9% in the United Kingdom • 9% in Denmark • 15% in the Netherlands • 5.2% in the United States.
Seen in this light, the amount of land used in New Zealand for housing is astonishingly small, and would still be so even with continued population growth.
3. Economic Change Alters the Market
The compact cities cult
62 New Zealand Business Roundtable. Town and Country Planning: Towards a Framework for Public Policy. Wellington: New Zealand Business Roundtable, 1987, pp. 9–10.

22
Priced Out
and was not popular with first-home buyers, most of whom preferred suburban living to intensification.63 New Zealand economists Grant Scobie and Veronica Jardine had come to similar conclusions in a substantial paper produced in 1987.64 In 2005, an English study by Alan Evans and Oliver Hartwich cited British research arriving at similar conclusions.65 There is no reason to believe New Zealanders would behave in radically different ways to the Americans or the British. Indeed, we know from their behaviour prior to the 1953 legislation that many preferred urban sprawl and living away from city centres. It is true that after the oil shocks of the 1970s, as many as 30% of home seekers chose to construct flats or infill housing near city centres, but new subdivisions on the periphery remained popular with first-home buyers. Of nearly 60,000 residential consents issued in the Auckland region between 2000 and 2005, three-quarters were outside the zones earmarked for high-density housing.66 Jobs were now emerging in new subdivisions and people worked out that a traditional one-storey house on the periphery of the city was cheaper to construct per square metre than a multi-storey unit nearer the city centre, and it had at least some land around it for children to play on.67 The policy of intensification, however, continued to be applied by councils. According to the planners of the Auckland Regional Council (ARC), it was “to ensure that Auckland retains a high quality living environment by promoting compact urban environments that have high [class] amenities and are well integrated with the transport system”.68 Little evidence was provided that the public preferred such a policy because the facts told otherwise. Out-of-date assertions kept being made in defence of intensification alleging that peripheral city developments were all ‘dormitory suburbs’ lacking employment
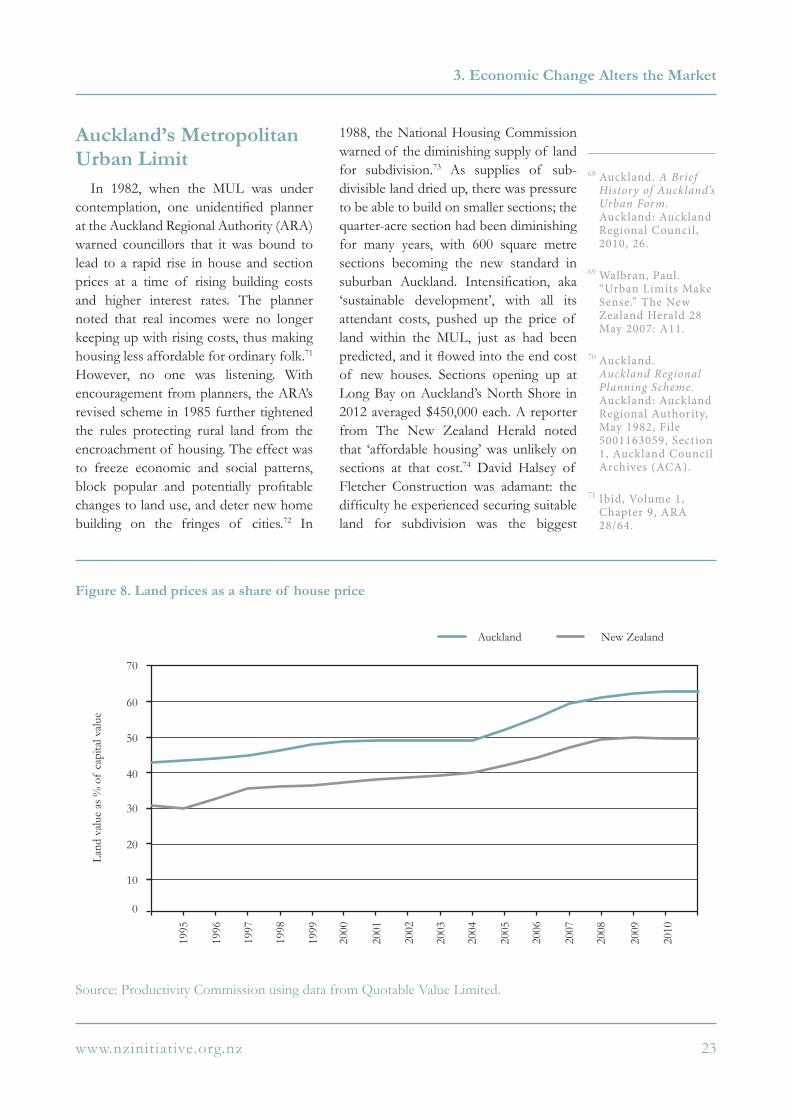
opportunities.69 Unfortunately, New Zealand’s social theorists seldom rethink their nostrums or adjust to changing demands or cater to existing realities. Academic departments and whole industries can emerge around ideas regardless of how poorly they stand up to sustained scrutiny. It has most certainly become the case with local authority planning in New Zealand. Intensification is still treated reverentially by our planners, but there is growing evidence that the current approach hurts rather than helps the most deserving. Figure 8 shows the increase in land prices as a percentage of a total house price in Auckland and across the country since 1995. Land as a percentage of the build price has increased from around 40% to 60% of the price of a house.
After passage of the Town and Country Planning Act 1977, regional planning clapped apace. The Auckland Regional Authority’s regional plan of 1982 built on the first Regional Planning Scheme of 1974, producing what came to be known as a Metropolitan Urban Limit (MUL) of the kind that was so common circling many British towns and cities. The Brookby and Clevedon valleys to the south of Auckland, and the land beyond the Massey-Hobsonville ridge to the west, were protected, as were the greenfields around Silverdale to the north.70 Land outside the MUL could be released, as some eventually was at Westgate, Hobsonville, Flat Bush, Papakura, Karaka and Silverdale, but only after developers, the territorial local authority, and what was then the ARC between 1989 and 2010 had all agreed it was needed, and lengthy and expensive hearings had taken place.
63 Gordon, Peter and Harry W. Richardson. “Are Compact Cities a Desirable Goal?” Journal of the American Planning Association 63.1 (Winter 1997): 95–106.
64 New Zealand Business Roundtable. Town and Country Planning: Towards a Framework for Public Policy Wellington: New Zealand Business Roundtable, 1987.
65 Evans, Alan and Oliver Hartwich. Unaffordable Housing: Fables and Myths. London: Policy Exchange, 2005.
66 Cumming, Geoff. “The Vanishing Dream of Home Ownership. The New Zealand Herald: 27 October 2007: B2–3; Maré, David C., Andrew Coleman, and Ruth Pinkerton. “Patterns of Population Location in Auckland.” Motu Working Paper 11 06. Wellington: Motu Economic and Public Policy Research, 2011, p.14.
67 Personal interview with David Halsey of Fletcher Construction Ltd, 5 November 2012.
23www.nzinitiative.org.nz
In 1982, when the MUL was under contemplation, one unidentified planner at the Auckland Regional Authority (ARA) warned councillors that it was bound to lead to a rapid rise in house and section prices at a time of rising building costs and higher interest rates. The planner noted that real incomes were no longer keeping up with rising costs, thus making housing less affordable for ordinary folk.71 However, no one was listening. With encouragement from planners, the ARA’s revised scheme in 1985 further tightened the rules protecting rural land from the encroachment of housing. The effect was to freeze economic and social patterns, block popular and potentially profitable changes to land use, and deter new home building on the fringes of cities.72 In
1988, the National Housing Commission warned of the diminishing supply of land for subdivision.73 As supplies of sub-divisible land dried up, there was pressure to be able to build on smaller sections; the quarter-acre section had been diminishing for many years, with 600 square metre sections becoming the new standard in suburban Auckland. Intensification, aka ‘sustainable development’, with all its attendant costs, pushed up the price of land within the MUL, just as had been predicted, and it flowed into the end cost of new houses. Sections opening up at Long Bay on Auckland’s North Shore in 2012 averaged $450,000 each. A reporter from The New Zealand Herald noted that ‘affordable housing’ was unlikely on sections at that cost.74 David Halsey of Fletcher Construction was adamant: the difficulty he experienced securing suitable land for subdivision was the biggest
Figure 8. Land prices as a share of house price
Source: Productivity Commission using data from Quotable Value Limited.
3. Economic Change Alters the Market
Auckland’s Metropolitan Urban Limit
68 Auckland. A Brief History of Auckland’s Urban Form. Auckland: Auckland Regional Council, 2010, 26.
69 Walbran, Paul. “Urban Limits Make Sense.” The New Zealand Herald 28 May 2007: A11.
70 Auckland. Auckland Regional Planning Scheme. Auckland: Auckland Regional Authority, May 1982, File 5001163059, Section 1, Auckland Council Archives (ACA).
71 Ibid, Volume 1, Chapter 9, ARA 28/64.
New ZealandAuckland
Land
val
ue a
s %
of
capi
tal v
alue
1995
1996
1997
1998
50
40
30
20
10
0
1999
2000
2001
2002
2003
2004
2005
2006
2007
2008
2009
2010
60
70

24
Priced Out
impediment to building affordable homes. He blamed the MUL and associated planning nostrums.75
Figures 8A shows the area of the MUL and notes that it does affect the price of land: its value differs by a factor of ten across the border. Figure 8B shows a similar effect in Portland, Oregon. Auckland is not the only city that has experienced this phenomenon. It can be witnessed just about anywhere with a stiff urban/metro limit and population growth.
Between 1980 and 2010, the Auckland region absorbed more than 300,000 more people without significantly extending the MUL.76 Planners argued that more intensive land use required additional recreational space and general community facilities. Development levies had been provided for in the Local Government Act 1974 and more specifically detailed in the Resource Management Act 1991. Swathes of new housing and apartment buildings within a confined area of land led planners to argue for higher levies to acquire more open space, which was not always easy to find. In the Long Bay subdivision, significant tranches of land were put aside for reserves, but land is hard to come by in densely populated areas of the city centre. Not surprisingly, developers complain about being levied for the acquisition of land that cannot be found!77
As apartments mushroomed within the centre of Auckland City from the 1990s, the council set out to spend $117 million acquiring and improving public spaces, and to have developers pay 60% of that sum. Planners estimated the new impost would add 5% to the total cost of a development, with the cost being passed on to the end buyer of an apartment.78 The developer would have to pay the levy before a building consent could be issued. Although the Resource Management Act 1991 set fairly strict rules about the
relationship between levies collected and how they were spent, councils have sought the widest interpretation of the rules. In 2002, for instance, Auckland City Council intended to spend 60% in a ward from which the money was collected while 40% could be pooled for citywide projects.79 Four years later the council proposed to levy extra money for transport, parks and storm-water facilities. Developers estimated that the extra levy would add another $950 to the cost of a new household unit and strongly opposed the proposal.80 Some even considered such imposts as nothing but an extra source of revenue for councillors to spend on whatever they thought fit. From 2005 to 2009, Auckland City Council raised $58 million in developer contributions, all of which was added to the price of the new homes.81 Similar levies were applied in subdivisions on the periphery of cities, pushing up the price of land and anything built on it.
The impact of the MUL and its planning consequences became more pronounced, and in the 1990s land costs started rising more rapidly than the cost of the house constructed thereon. There are areas in Auckland’s inner suburbs where the value of the land quadrupled between 1994 and 2011 while the value of the house less than doubled. In 1998, the MUL around Auckland completely closed and that event has been the principal cause of rising land values within the circle. From time to time, complex and lengthy planning hearings occur and the MUL is cautiously extended; the amount of new land freed up is always too little, too late; and the legal costs and the other imposts are passed on to users of land freed up for housing. Many developers who could not afford the delays and the costs involved in widening the MUL simply departed the scene.
72 New Zealand Business Roundtable. Town and Country Planning: Towards a Framework for Public Policy. Wellington: New Zealand Business Roundtable, 1987, p.14.
73 New Zealand. Housing in New Zealand: Provision and Policy at the Crossroads. Wellington: National Housing Commission, 1988, p. xv, p. 11.
74 Gibson, Anne. “Lon Bay Housing Project Claims First Sales.” The New Zealand Herald 8 November 2012: B4.
75 Personal interview with David Halsey of Fletcher Construction Ltd, 5 November 2012.
76 Auckland. A Brief History of Auckland’s Urban Form. Auckland: Auckland Regional Council, 2010, p. 23.
77 McIlroy, Campbell. “Council Reviews developers’ levy,” The National Business Review 26 October 2001, p.3.
78 Auckland. Background Paper on Developer Contributions. Auckland: Auckland City Council, 31 July 1997: AKC 317/511f.
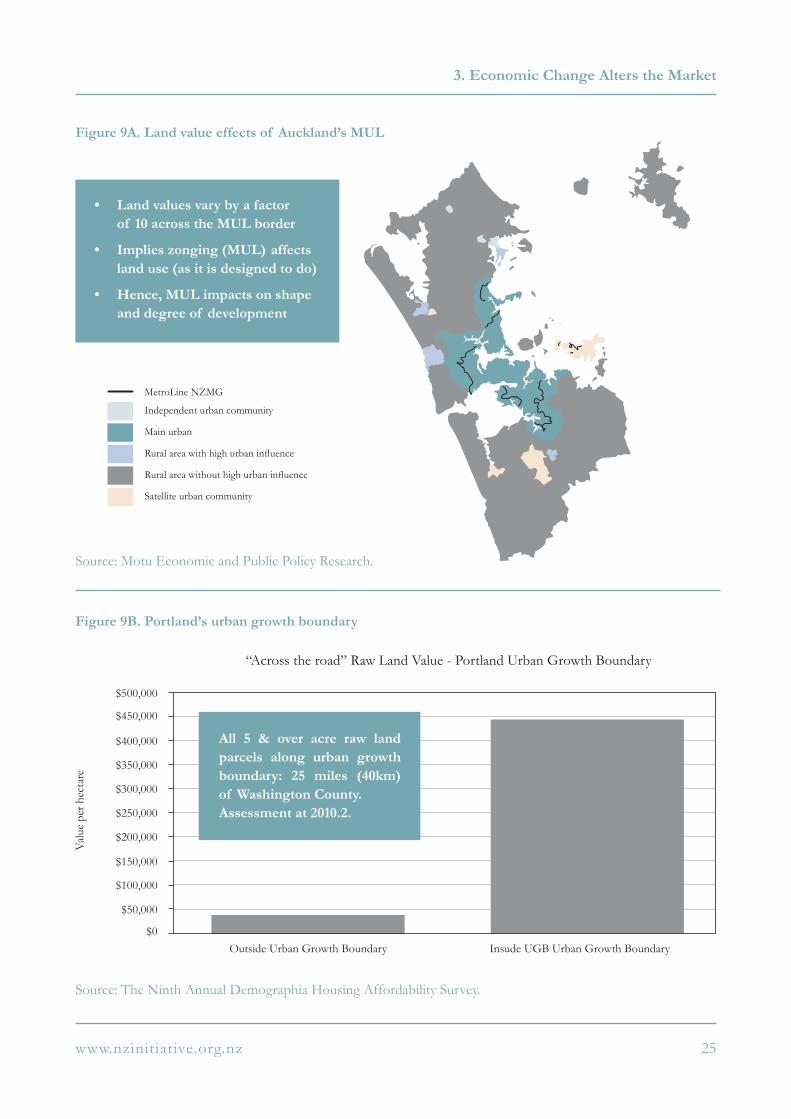
25www.nzinitiative.org.nz
Figure 9B. Portland’s urban growth boundary
Source: The Ninth Annual Demographia Housing Affordability Survey.
Figure 9A. Land value effects of Auckland’s MUL
Source: Motu Economic and Public Policy Research.
3. Economic Change Alters the Market
• Land values vary by a factor of 10 across the MUL border
• Implies zonging (MUL) affects land use (as it is designed to do)
• Hence, MUL impacts on shape and degree of development
MetroLine NZMG
Independent urban community
Main urban
Rural area with high urban influence
Rural area without high urban influence
Satellite urban community
Val
ue p
er h
ecta
re
$250,000
$200,000
$150,000
$100,000
$50,000
$0
$300,000
$350,000
$400,000
$450,000
$500,000
Outside Urban Growth Boundary Insude UGB Urban Growth Boundary
“Across the road” Raw Land Value - Portland Urban Growth Boundary
All 5 & over acre raw land parcels along urban growth boundary: 25 miles (40km) of Washington County.Assessment at 2010.2.

26
Priced Out
Meantime, governments tinkered around the edges of the problem. They tried in the late 1980s and 1990s to restrain the seemingly inexorable rise in building costs. A Building Industry Authority created under the Building Act 1991 produced new building codes. The codes approved alternative materials and designs, resulting in a discernible plateauing of the average building cost per square metre from the late 1980s.82 However, we also now know that some of these changes that enabled the use of untreated timber and smaller eaves on houses were key factors in the discovery of thousands of leaky homes a few years later. A new Building Act 2004 again tightened the rules and promised a thorough review of the Building Code. Moreover, some new codes required better insulation and double glazing in colder areas, thereby adding to a house’s end cost. The government’s building controls were now funded by a building consent levy of $1.97 for every $1,000 of building work on projects exceeding $20,000.83 This levy, like all the others, was on top of the local authority’s consent charges, development levies, and inspection fees – adding as much as $40,000 to the price of a new house. Included in this were the charges levied by Auckland’s Watercare. One developer found the costs of connecting water and sewerage reach an exorbitant $20,000 for each house in his development. Council costs for roads, footpaths, drains, and so on average about $85,000 per section, meaning that the rock bottom price of the cheapest land before building in Auckland these days is around $300,000. The world of the easily affordable first home for young families
has vanished. Neither the government nor local authorities and their planners seem to spend much time thinking about the affordability of new dwellings. The post-war patriotism that gave urgency to the housing boom during the 1950s and 1960s has long since evaporated.
By the mid-1990s, a few important barriers to affordable housing were being lowered. The economic reforms of the 1980s and early 1990s were at last bringing beneficial results. Productivity gains were most noticeable. By 1993, inflationary pressures had been largely squeezed out of the economy. Along with labour market reforms, they enabled New Zealand to perform better than most within the OECD. New Zealand’s Treasury noted in 2004:
“New Zealand’s economic growth performance has improved since the early 1990s. Its average annual GDP per capita growth since the early 1990s has been higher than the growth rate for the total OECD. In the eleven years to 2002, New Zealand’s average annual per capita growth was around 2.25% compared with the OECD average of 1.75%.” 84
The Labour government elected at the end of 1999 ran surpluses for its first few years, although high spending, especially on state services, gradually saw productivity gains from the 1980s and 1990s wither. State investment in new house construction rose as the government introduced new lending options. Much government assistance, however, was directed at accommodation supplements for renters and to lower income people with mortgages. In June 2003, nearly 252,000 people received some form of housing supplement.85 These grants helped people caught by the modern realities of expensive housing in a rising market; the $2 billion spent on
79 Auckland. Development Levies. Auckland: Auckland Council Archives: AKC 317/233a.
80 Orsman, Bernard. “Developers Howl at Threat of Levies Rise.” The New Zealand Herald 6 June 2006: A2.
81 Auckland. Auckland City Council Minutes. Auckland: Auckland Council, 10 December 2009: AKC 100/124.
82 New Zealand. New Zealand Official Year Book. Auckland: Statistics New Zealand, 1994, p. 424.
83 Ibid, 2008, p. 420.
84 New Zealand. New Zealand’s Economic Growth: An Analysis of Performance and Policy. Wellington: The Treasury, 2004, p. 4.
85 New Zealand. New Zealand Official Year Book. Auckland: Statistics New Zealand, 2004, p. 382.
Death by a thousand cuts: Levies, fees and development contributions
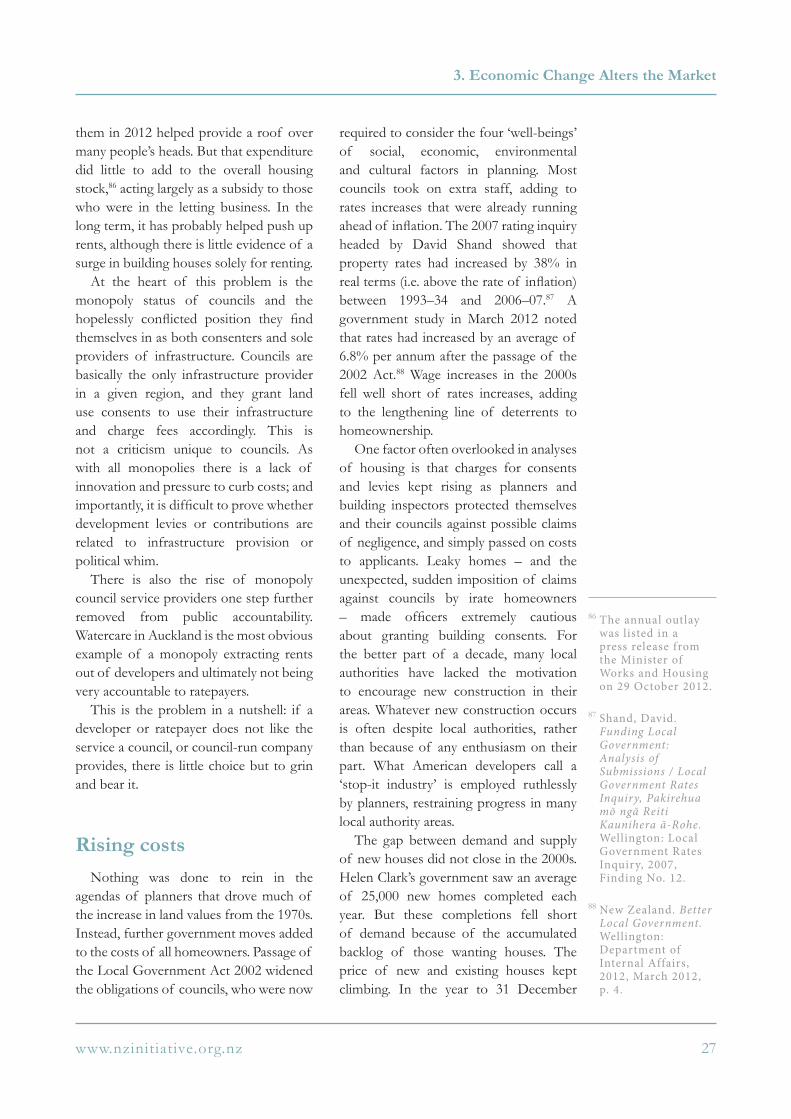
27www.nzinitiative.org.nz
them in 2012 helped provide a roof over many people’s heads. But that expenditure did little to add to the overall housing stock,86 acting largely as a subsidy to those who were in the letting business. In the long term, it has probably helped push up rents, although there is little evidence of a surge in building houses solely for renting.
At the heart of this problem is the monopoly status of councils and the hopelessly conflicted position they find themselves in as both consenters and sole providers of infrastructure. Councils are basically the only infrastructure provider in a given region, and they grant land use consents to use their infrastructure and charge fees accordingly. This is not a criticism unique to councils. As with all monopolies there is a lack of innovation and pressure to curb costs; and importantly, it is difficult to prove whether development levies or contributions are related to infrastructure provision or political whim.
There is also the rise of monopoly council service providers one step further removed from public accountability. Watercare in Auckland is the most obvious example of a monopoly extracting rents out of developers and ultimately not being very accountable to ratepayers.
This is the problem in a nutshell: if a developer or ratepayer does not like the service a council, or council-run company provides, there is little choice but to grin and bear it.
Nothing was done to rein in the agendas of planners that drove much of the increase in land values from the 1970s. Instead, further government moves added to the costs of all homeowners. Passage of the Local Government Act 2002 widened the obligations of councils, who were now
required to consider the four ‘well-beings’ of social, economic, environmental and cultural factors in planning. Most councils took on extra staff, adding to rates increases that were already running ahead of inflation. The 2007 rating inquiry headed by David Shand showed that property rates had increased by 38% in real terms (i.e. above the rate of inflation) between 1993–34 and 2006–07.87 A government study in March 2012 noted that rates had increased by an average of 6.8% per annum after the passage of the 2002 Act.88 Wage increases in the 2000s fell well short of rates increases, adding to the lengthening line of deterrents to homeownership.
One factor often overlooked in analyses of housing is that charges for consents and levies kept rising as planners and building inspectors protected themselves and their councils against possible claims of negligence, and simply passed on costs to applicants. Leaky homes – and the unexpected, sudden imposition of claims against councils by irate homeowners – made officers extremely cautious about granting building consents. For the better part of a decade, many local authorities have lacked the motivation to encourage new construction in their areas. Whatever new construction occurs is often despite local authorities, rather than because of any enthusiasm on their part. What American developers call a ‘stop-it industry’ is employed ruthlessly by planners, restraining progress in many local authority areas.
The gap between demand and supply of new houses did not close in the 2000s. Helen Clark’s government saw an average of 25,000 new homes completed each year. But these completions fell short of demand because of the accumulated backlog of those wanting houses. The price of new and existing houses kept climbing. In the year to 31 December
86 The annual outlay was listed in a press release from the Minister of Works and Housing on 29 October 2012.
87 Shand, David. Funding Local Government: Analysis of Submissions / Local Government Rates Inquiry, Pakirehua mō ngā Reiti Kaunihera ā-Rohe. Wellington: Local Government Rates Inquiry, 2007, Finding No. 12.
88 New Zealand. Better Local Government. Wellington: Department of Internal Affairs, 2012, March 2012, p. 4.
3. Economic Change Alters the Market
Rising costs

28
Priced Out
2004, the average sale price of a house was 14.5% higher than a year earlier, which in turn had risen 20% on the previous year.89 A brief dip occurred in 2008, but prices resumed their upward march. Interest rates rose in the first buoyant years of the century, and then ebbed. In 2009–10, they dropped to unprecedentedly low levels on all mortgages, and have stayed there. However, the global financial crisis reduced economic activity on many fronts, and there has been no surge in the construction of affordable new homes. Many young people are hunkering down and unwilling to take risks. In 2013, the pressure on existing housing seems greater than ever. In the Auckland region, where an estimated 13,000 new houses are required each year, absurdly high prices are being paid each week for very ordinary homes, while only 4,000 new houses are being added to the total housing stock each year.90
As all housing gradually grew more expensive, one can see with hindsight that the MUL favoured those who possessed houses over younger people chasing them. The MUL boosted the value of the house and especially the section. It made it more difficult for the potential entrant to the market to mount the first step. Someone in an inner suburb of Auckland who bought a home for, say, $70,000 in 1975, lived in it for 37 years, and did little but basic maintenance on it might find the house worth $1.5 million plus today. Someone in, say, Torbay on Auckland’s North Shore, who built a ‘standard house’ (land and section) in 1969 for $16,000 and did basic maintenance would find the property worth about $1 million today. The malign effects of the MUL that planners
produced – believing that constraining the boundaries of urbanisation would work to the advantage of ordinary people, save transport costs, and restrain unnecessary local authority outlays – are absolutely clear. The MUL has benefitted mostly older people who hath, and hurt younger people who hath not. The MUL favours the old and the rich and it punishes the younger and the poorer. Local authorities and planners refuse to acknowledge that the MUL has resulted in high house prices and even higher land prices, thus damaging housing prospects for young people. New Zealand is not alone. Alan Evans and Oliver Hartwich wrote in 2007 about Britain:
“It is obvious that when house prices rise one group is made better off, that is most existing home owners, but another group is made worse off: would-be future home owners and those existing home owners who will want, in the future, to move into larger properties.” 91
Of the various reasons for the current shortage of affordable housing, the negative attitudes of local authorities stand out. These attitudes are determined partly by planners and officials and partly by political pressures. Nearly everywhere, local authority officials and councillors own their own homes. They are already on the housing ladder, and represent the comfortable, seldom the needy. Nor do planners, officials or councillors consider the extent to which their lengthy delays over consents affects economic activity. At its most basic, a slower building trade means fewer jobs within the local authority and across the wider community. Councils talk about the importance of job growth in their areas, but are slow to remove the barriers they themselves have created. And as prices of existing houses rise steadily, delays in new house building only help existing homeowners. The practical effect
89 New Zealand. New Zealand Official Year Book. Auckland: Statistics New Zealand, 2006, p. 417; 2004, p. 380.
90 TV ONE’s 6pm news reported that 10,000 new houses were needed each year in Auckland. TV ONE. 6pm News. 28 October 2012. Finance minister Bill English’s press release the next day said it was 13,000 each year.
91 Evans, Alan and Oliver Hartwich. The Best Laid Plans: How Planning Prevents Economic Growth. London: Policy Exchange, 2007, p. 28.
The current situation: Owners versus buyers
29www.nzinitiative.org.nz
on those wanting to buy is that because the market is essentially rigged, extra money keeps being invested in real estate, rather than in more productive parts of the economy. As Evans and Hartwich have shown in their British study, inflexible plans that disregard change stifle progress.92 Councils must shoulder their share of responsibility for these failures.
Other considerations worry local authorities. Councillors have gone along with planners and officials because of several factors that have prejudiced them against involvement in housing. The Building Industry Authority’s relaxation of construction rules, and the resulting leaky homes crisis, landed local authorities with huge unexpected costs. By 2007, 80,000 New Zealanders were living in ‘leakies’ expected to cost $4 billion to fix.93 Many councils paid out on claims and it was not until May 2010 that the government finally produced a formula to cover costs for fixing leaky homes. Local authorities’ share of the total cost will be 25%, an impost no council could have anticipated a decade earlier.94 As a result, councils are now even more wary of involving in housing, and there has been a noticeable toughening up at the council level on inspections during the construction phase of all buildings for fear that any slips could lay the council open to claims. But delays and sometimes petty requirements at the consent stage also irritate developers and add to costs. The easy-going cooperation, and the relatively relaxed arrangements between central government, local authorities and developers of the 1950s and 1960s, has completely vanished. Such cooperation is unlikely to be revived without fundamentally changing the thinking about housing and considering the incentives under which councils operate to attract first-home builders.
92 Ibid, p. 48.
93 Phare, Jane. “Leaks Drove Me to Suicide Bids.” The Herald on Sunday 16 December 2007: 10–11.
94 Auckland. Auckland City Council Minutes. Auckland: Auckland Council, 23 September 2010: AKC 100/126.
3. Economic Change Alters the Market
30
Priced Out
Conclusions
This review of affordable housing explains the many factors instrumental in slowing construction, thus producing today’s shortage of new homes. The availability of affordable mortgages; the efforts of home building companies; the state of the economy at any particular moment; and the cooperation, or otherwise, of local authorities and planners – all have played a part in producing a situation where widely available new housing has given way to unaffordable housing for those wanting to take the first step up the homeownership ladder.
In its timely March 2012 Housing Affordability Inquiry, the New Zealand Productivity Commission identified three areas requiring attention if New Zealand is to improve housing affordability, remove impediments to homeownership, and provide appropriate rental accommodation for those who will never otherwise realistically be able to mount the homeownership ladder:
• increasing the supply of land for housing and following a less constrained approach to urban planning
• pursuing opportunities to achieve scale and reduce costs in land development and construction in a manner similar to the activities of the major home builders of the 1950s and 1960s
• introducing a regulatory framework to facilitate and encourage cost-reduction and quality enhancing innovation, and where the benefits of regulation can be achieved at least cost.95
To be realistic about these goals, we need a government and local authorities prepared to face up to the current housing crisis and pursue solutions relentlessly to fix it.
This report has attempted to outline the scope and historical development of the housing problem in New Zealand. The difficulty with this area is that it is multi-faceted and has many different inputs. Is it the building industry? Is the problem with developers? Or local and central government attitudes to development? Were New Zealand’s previous levels of homeownership only achievable with direct government intervention in the housing market, particularly in financing? Is it the provision of infrastructure?
In truth, each of these aspects plays a role in why New Zealand housing is so unaffordable. The question for policymakers and politicians alike is which combination of policy changes will make the greatest amount of difference? Clearly there is a big mismatch of incentives between various parts of the current housing market. We need a mentality conducive to house building. Given that the fundamental problem is that the market cannot respond to spikes in demand (or even constant demand) in the way other markets do, surely there should be some attempts at unshackling of the housing market.
Our next housing report will examine different jurisdictions around the world at the ground level, and see how other markets with more stable prices and affordable housing achieve this.
95 Housing Affordability Inquiry. Housing Affordability. Wellington: New Zealand Productivity Commission, 2012, p. 19.
31www.nzinitiative.org.nz
Conclusions Bibliography
Auckland. A Brief History of Auckland’s Urban Form. Auckland: Auckland Regional Council, 2010.
Auckland. Auckland City Council Minutes. Auckland: Auckland Council, 23 September 2010: AKC 100/126.
Auckland. Auckland City Council Minutes. Auckland: Auckland Council, 10 December 2009: AKC 100/124.
Auckland. Auckland Regional Authority. Auckland: Auckland Council Archives ARA 28/64.
Auckland. Auckland Regional Planning Scheme. Auckland: Auckland Regional Authority, 1982.
Auckland. Background Paper on Developer
Contributions. Auckland: Auckland City Council, 31 July 1997: AKC 317/511f.
Auckland. Development Levies. Auckland: Auckland Council Archives: AKC 317/233a.
Bassett, Michael. History of Auckland City Council 1989–2010. Forthcoming.
Bassett, Michael. Sir Joseph Ward: A Political Biography. Auckland: Auckland University Press, 1993.
Cumming, Geoff. “The Vanishing Dream of Home Ownership. The New Zealand Herald. 27 October 2007: B2–3.
Evans, Alan and Oliver Hartwich. The Best Laid Plans: How Planning Prevents Economic Growth. London: Policy Exchange, 2007.
Evans, Alan and Oliver Hartwich. Unaffordable Housing: Fables and Myths. London: Policy Exchange, 2005.
Ferguson, Gael. Building the New Zealand Dream. Palmerston North: Dunmore Press Limited, 1994.
Gibson, Anne. “Tenants Shun CBD’s Shoebox Apartments.” The New Zealand Herald. 1 November 2005: A4.
Gibson, Anne. “Apartments Fail to Sell.” The New Zealand Herald. 21 October 2005: B2–3.
Gibson, Anne. “Long Bay Housing Project Claims First Sales.” The New Zealand Herald. 8 November 2012: B4.
Goldsmith, Paul and Michael Bassett. The Myers. Auckland: David Ling, 2007.
Goldsmith, Paul. Fletchers: A Centennial History of Fletcher Building. Auckland: David Ling, 2009.
Gordon, Peter and Harry W. Richardson. “Are Compact Cities a Desirable Goal?” Journal of the American Planning Association. 63.1 (1997): 95–106.
Halsey, David. Personal interview. 5 November 2012.
Hay, David. Personal interview. 5 November 2012.
Housing Affordability Inquiry. Housing Affordability. Wellington: New Zealand Productivity Commission, 2012.
Lee, John A. Socialism in New Zealand. London: T.W. Laurie, 1938.
Maré, David C. Andrew Coleman, and Ruth Pinkerton. “Patterns of Population Location in Auckland.” Motu Working Paper. 11-06. Wellington: Motu Economic and Public Policy Research, 2011.

32
Priced Out
New Zealand Business Roundtable. Town and Country Planning: Towards a Framework for Public Policy. Wellington: New Zealand Business Roundtable, 1987.
New Zealand Statutes 1926. Town Planning Act 1926. 1926 No. 52.
New Zealand. Report of the Department of Health. Wellington, 1902.
New Zealand. Affordable Housing Action Well Underway. Wellington: Minister of Works and for Housing, 29 October 2012.
New Zealand. Better Local Government. Wellington: Department of Internal Affairs, 2012.
New Zealand. Govt responds to Housing Affordability Report. Wellington: Minister of Finance, 29 October 2012.
New Zealand. Housing in New Zealand: Provision and Policy at the Crossroads. Wellington: National Housing Commission, 1988.
New Zealand. New Zealand Housing Report 2009/2010: Structures, Pressures and Issues. Wellington: Department of Building and Housing, 2010.
New Zealand. New Zealand Official Year Book. Auckland: Statistics New Zealand, 1914, 1954, 1962, 1970, 1977, 1983, 1985, 1986–87, 1987–88, 1988–89, 1990, 1994, 2000, 2004, 2006, 2008, 2010.
New Zealand. New Zealand Parliamentary Debates 299. Wellington: Hansard, 25 August 1953.
New Zealand. New Zealand’s Economic Growth: An Analysis of Performance and Policy. Wellington: The Treasury, 2004.
Orsman, Bernard. “Developers Howl at Threat of Levies Rise.” The New Zealand Herald. 6 June 2006: A2.
Page, I.C. New House Price Modelling. Study Report 196. BRANZ: Porirua City, 2008.
Phare, Jane. “Leaks Drove Me to Suicide Bids.” The Herald on Sunday. 16 December 2007: 10–11.
Pomare. M. Etahi Mate Rere. Report of the Department of Health. Wellington: Department of Public Health, 1902.
Quigley, Derek. Personal interview. 31 October 2012.
Shand, David. Funding Local Government: Analysis of Submissions / Local Government Rates Inquiry, Pakirehua mo nga Reiti Kaunihera a-Rohe. Wellington: Local Government Rates Inquiry, 2007.
The University of New Zealand. Calendar 1956.
TV ONE. 6pm News. 28 October 2012.
Walbran, Paul. “Urban Limits Make Sense.” The New Zealand Herald 28 May 2007: A11.
Webster, Chris. “The Battle for Ideas that Shaped British Planning,” paper presented to a conference in Korea on spatial policy, May 2006. http://region.snu.ac.kr/bk/achievement/data/BK_06-03.pdf
White, Dick. Personal interview. 16 and 19 October 2012.

$15.00ISBN: 978-0-9922565-1-7
The New Zealand Initiative
PO BOX 10147
Wellington 6143
www.nzinitiative.org.nz