pricewaterhouse coopers...
TRANSCRIPT
Independent Pricing and Regulatory Tribunal
Ambulance Service of NSW Funding Model: A Comparison with Other National and International Ambulance Services May 2005
pwc Review of NSW Ambulance Service Funding Model
Disclaimer This Report has been prepared by PricewaterhouseCoopers (PwC) at the request of the Independent Pricing and Regulatory Tribunal (“IPART”) in our capacity as advisors in accordance with the Scope (see section 1.2 of this Report) and the Terms and Conditions contained in the Consultant Agreement between IPART and PwC. The information, statements, statistics and commentary (together the “Information”) contained in this report have been prepared by PwC from publicly available material (e.g. Annual Reports and Budget Papers) material provided by stakeholders and from discussions held with stakeholders. The Consultants may in their absolute discretion, but without being under any obligation to do so, update, amend or supplement this document. PwC have based this report on information received or obtained, on the basis that such information is accurate and, where it is represented by management as such, complete. The Information contained in this report has not been subject to an Audit. The information must not be copied, reproduced, distributed, or used, in whole or in part, for any purpose other than detailed in our Consultant Agreement without the written permission of IPART and PwC. Comments and queries can be directed to:
Scott Lennon Director PricewaterhouseCoopers 201 Sussex Street Sydney NSW 2000 Phone: (02) 8266 2765 Email: [email protected]
pwc Review of NSW Ambulance Service Funding Model
Contents
Acronyms 3 1 Introduction 4 2 NSW Ambulance Service Funding Model 8 3 A Review of National and International Jurisdictions 21 4 Summary Comparison of Revenue Models of Nine
Ambulance Services 52 5 Conclusions and Reform Options 55
pwc Review of NSW Ambulance Service Funding Model
Acronyms
ACC Accident Compensation Corporation (NZ) ACT Australian Capital Territory ADAS Alexandra and District Ambulance Service (Vic) AHS Area Health Services (NSW) ASV Ambulance Service Victoria AWE Average Weekly Earnings CAC Community Ambulance Cover (Qld) CPI Consumer Price Index CSO Community Service Obligation (a form of subsidy contract) DHB District Health Board (NZ) DVA Commonwealth Department of Veteran Affairs FTE Full Time Equivalent GGE General Government Entity GP General Practitioner HIL Health Insurance Levy (NSW) IPART Independent Pricing and Regulatory Tribunal (NSW) LAS London Ambulance Service MAA Motor Accident Authority (NSW) MAS Metropolitan Ambulance Service (Vic) NCP National Competition Policy NHS National Health Service (UK) NSW New South Wales NZ New Zealand OSR Office of State Revenue (NSW) PC Productivity Commission PCT Public Care Trusts (UK) PTS Patient Transport Service PwC PricewaterhouseCoopers QAS Queensland Ambulance Service RAV Rural Ambulance Service (Vic) SA South Australia SAAS South Australian Ambulance Service SDRO State Debt Recovery Office (NSW) TAS Tasmanian Ambulance Service TNT Treat and Not Transport UK United Kingdom WA Western Australia
pwc Review of NSW Ambulance Service Funding Model
Introduction 4
1 Introduction
1.1 Background The New South Wales (NSW) Department of Health (NSW Health) recently requested an independent review of the fee and funding structure of the NSW Ambulance Service (the Service) under an initiative to address current cost recovery and efficiency issues. This was commissioned to the Independent Pricing and Regulatory Tribunal (IPART), pursuant to section 9(1)(b) of the Independent Pricing and Regulatory Tribunal Act 1992 (NSW).
The key outputs sought from IPART’s review include:
• A detailed analysis of revenue and charging structures of the Ambulance Service, taking into account the system-wide effects of implementing different fee structures.
• A cost index to quantify changes in the cost of providing medical and transport operations undertaken by the Ambulance Service and to sustain services into the future.
The IPART review aims to recommend appropriate pricing and fee reforms which will acknowledge current industry issues, and deliver cost effective outcomes. The full terms of reference of the IPART study are available on their website www.ipart.nsw.gov.au.
1.2 Outcomes and Objectives of this Report IPART commissioned independent consultants PricewaterhouseCoopers (PwC) to undertake the first component of the review. Hence, this Report seeks to ensure IPART is better informed of, and that thorough consideration is given to, all feasible funding reform options.
In order to achieve this outcome, this Report will:
• outline the sources, size and nature of funding of a selection of national and international ambulance services;
• compare and contrast the sources, sizes and nature of funding of ambulance services in other jurisdictions with those of the Ambulance Service of NSW; and
• recommend potentially beneficial changes to improve the sustainability of the Ambulance Service of NSW funding model in light of interstate and international experiences.
pwc Review of NSW Ambulance Service Funding Model
Introduction 5
1.3 Current Trends in the Australian Ambulance Industry Ambulance services are an integral part of the wider health system. They provide essential services which reduce pain and suffering, and can reduce the rates of mortality and morbidity of patients. This in turn can lead to lower long term treatment costs. Ambulance services have a number of roles including:
• provision of emergency pre-hospital patient care;
• transport in response to sudden injury and illness;
• retrieval of emergency patients;
• standby service at sports events;
• accredited rescue services; and
• gaining access to emergency pre-hospital patients (for example, in confined spaces and hazardous environments).
In Australia, the State and Territory Governments are responsible for organising the provision of ambulance services. Each jurisdiction operates as a standalone entity. National coordination is mainly limited to a few cross border agreements which outline the provision of services and allocation of cost recovery in border areas.
In 2003/04 Ambulance services had an average nationwide cost of $433.03 per response.1 Funding to cover these costs is derived from a variety of sources. The four main funding sources are:
• government appropriation or community service obligation payments;
• ambulance subscription schemes;
• transport fees; and
• bulk agreements with hospitals, Area Health Services (AHS), the Department of Veterans Affairs (DVA) and State based motor accident agencies such as the NSW Motor Accident Authority (MAA).
The provision of public health care services, including ambulance services, can be very costly with direct user charges often recovering only a small proportion of total cost. The total costs of the primary State and Territory ambulance service organisations in Australia were $1,166 million in 2003/04, with direct user charges funding only $266 million.2 Consequently, health services are usually provided and subsidised by the Government.
1 Productivity Commission 2005, Report of Government Services 2005, Table 8A.20; and Table 8A.26; based on a total national cost of $1.17 billion, and 2.69 million responses. 2 Productivity Commission 2005, Report of Government Services 2005, p.8.38
pwc Review of NSW Ambulance Service Funding Model
Introduction 6
In general, basic public health care is regarded as an essential service, or a ‘merit good’, that should be accessible to all members of the community, regardless of an individual user’s ability to pay. This is based on the premise that people have a right of access, but are unable to purchase an adequate level of the good without sufficient subsidisation.3 Therefore, governments fund the majority of costs for ambulance and other public health services.
In recent years there has been an increase in the demand for Ambulance services across Australia. Total responses in Australia have increased by 9.5 per cent between 2001/02 and 2003/04 alone.4 This can be attributed to a number of factors such as the ageing population, centralisation of specialist hospital services and rising hospital activity levels (eg greater use of day surgery). These factors are discussed further in Section 2.1 of this report. This increase in demand has contributed to an increase in funding requirements. Nationally, real total funding increased by an average annual growth rate of 5.8 per cent between 1999/2000 and 2003/04. Across jurisdictions, real funding increased each year, as well as overall, in Victoria, Queensland, Western Australia, Tasmania and the Northern Territory; for all other jurisdictions, real funding did not increase every year, but it did increase overall between 1999/2000 to 2003/04.5
A combination of rising demand and a large number of fee exempt patients contribute to a heavy reliance on Government funding. Therefore, there is a clear need to reform current revenue arrangements in order to ensure sustainable Government funding levels meet future demand. These ongoing concerns have provided the impetus for a number of Ambulance service reviews that have generally focused on improving cost recovery and efficiency, whilst still maintaining or improving service performance.
1.4 Approach and Methodology This Report compares and contrasts the funding models of ambulance services in the following five Australian jurisdictions:
• Victoria;
• Queensland;
• South Australia (SA);
• Western Australia (WA); and
• Tasmania.
3 The Allen Consulting Group 1999, Review of the Ambulance Services Act 1986, p.8 4 Productivity Commission 2005, Report of Government Services 2005, Table 8A.20 5 Productivity Commission 2005, Report of Government Services 2005, p.8.38
pwc Review of NSW Ambulance Service Funding Model
Introduction 7
In order to ensure a diverse range of funding models are considered ambulance services from the following three international jurisdictions are also analysed:
• New Zealand’s (NZ) St John’s Ambulance Service;
• United Kingdom’s (UK) London Ambulance Service (LAS); and
• Canada’s British Columbia Ambulance Service (BCAS).
This inter-jurisdictional review of ambulance services is based on information from a range of sources, such as:
• cost and revenue data provided by the Service;
• personal communications with and data provided directly by ambulance services in other Australian jurisdictions and abroad;
• academic databases such as Econlit and ProQuest 5000;
• comprehensive internet and media searches;
• publicly available literature on each Ambulance Service (e.g. Government Budget Papers, Annual Reports, National Competition Policy (NCP) Reviews) and other reporting agencies such as the Productivity Commission; and
• drawing on our network of professional contacts gained though our previous commissions with NSW Health and the Service to identify relevant analysis and in-house data.
Funding information for the financial year 2003/04 was extracted and collated into a comparative format. The funding models in each jurisdiction were compared on the basis of size, source and nature components.
Analysis and discussion focuses on interstate and international funding arrangements where they are significantly different to the NSW funding model. Where appropriate, we have recommended some potential options for reforming the existing NSW Ambulance funding model.
1.5 Structure of the Report This report is structured into the following chapters:
• Chapter 2: details the size, source, and nature of funding, and summarises the cost structure of the NSW Ambulance Service;
• Chapter 3: provides a snapshot of the operations of the comparative ambulance services, and details the size, source and nature of funding in these jurisdictions;
• Chapter 4: compares the differences between the funding models used in other jurisdictions with that of the NSW Service; and
• Chapter 5: recommends more detailed evaluation of some different revenue and funding approaches as used in other jurisdictions as a basis for possible changes to the NSW funding model.
pwc Review of NSW Ambulance Service Funding Model
NSW Ambulance Service Funding Model 8
2 NSW Ambulance Service Funding Model
2.1 A Snapshot of the NSW Ambulance Service
The Service covers all urban areas and the vast majority of rural areas of NSW,6 with a combination of road and air ambulance services. The Service is a statutory authority, managed by a Board of Directors that reports to the Minister for Health. The Chief Executive Officer of the Service reports to the Service Board, and to the Director-General of NSW Health. In 2003/04, the Service made 928,000 responses7. At June 2004, the Service’s resources include:
• 290 ambulance stations and response locations;
• approximately 1,250 ambulances vehicles;
• contracted air-ambulance service with five fixed wing aircraft and nine helicopter aero-medical services; and
• a total staff (Full Time Equivalent (FTE)) of approximately 3,300.8
In order to manage the 290 ambulance stations which are located across rural and metropolitan NSW, the Service is separated into the following four main divisions and 14 smaller sectors:
• Sydney Division: Central Sydney Sector; Wentworth and Western Sector; South Western Sector; and Northern Sydney Sector;
• Northern Division: Central Coast Sector; Hunter Sector; Mid North Coast Sector; Northern Rivers Sector;
• Western Division: Macquarie and Far West Sector; Mid-West Sector; New England Sector; and
• Southern Division: Greater Murray Sector; South Eastern Sector and Illawarra Sector.
During 2003/04, total responses increased by 3.6 per cent state wide, and 4.7 per cent in the Sydney metropolitan area. Over the past five years total responses have an even high compound annual growth rate of 7.2 per cent (see Table 1). The rates of growth in responses are substantially above recent rates of population growth (1.1 per cent). Factors driving this strong growth in ambulance responses include strong growth in hospital activity and output levels, the ageing population and the community making greater use of the Service. Hence, assuming there are no significant changes in the health system, the Service offering or its pricing, it appears likely that the number of responses will continue to grow between 4 and 7 per cent per annum. The Service uses a relatively conservative forecast total annual demand growth rate of 4 per cent.
6 Remote parts of NSW are covered by the Royal Flying Doctor Service. 7Ambulance Service of NSW, 2003/04 Annual Report, NSW p.2 Responses measured as individual ambulance resource dispatched to call(s) for assistance or transport. 8 IPART 2005, Review of Financial Aspects of the Ambulance Service of NSW: An Issues Paper, March 2005, NSW pp.3-4.
pwc Review of NSW Ambulance Service Funding Model
NSW Ambulance Service Funding Model 9
This estimate is based on a forecast rate of growth for incidents (3.7 per cent) and responses (4.7 per cent).9
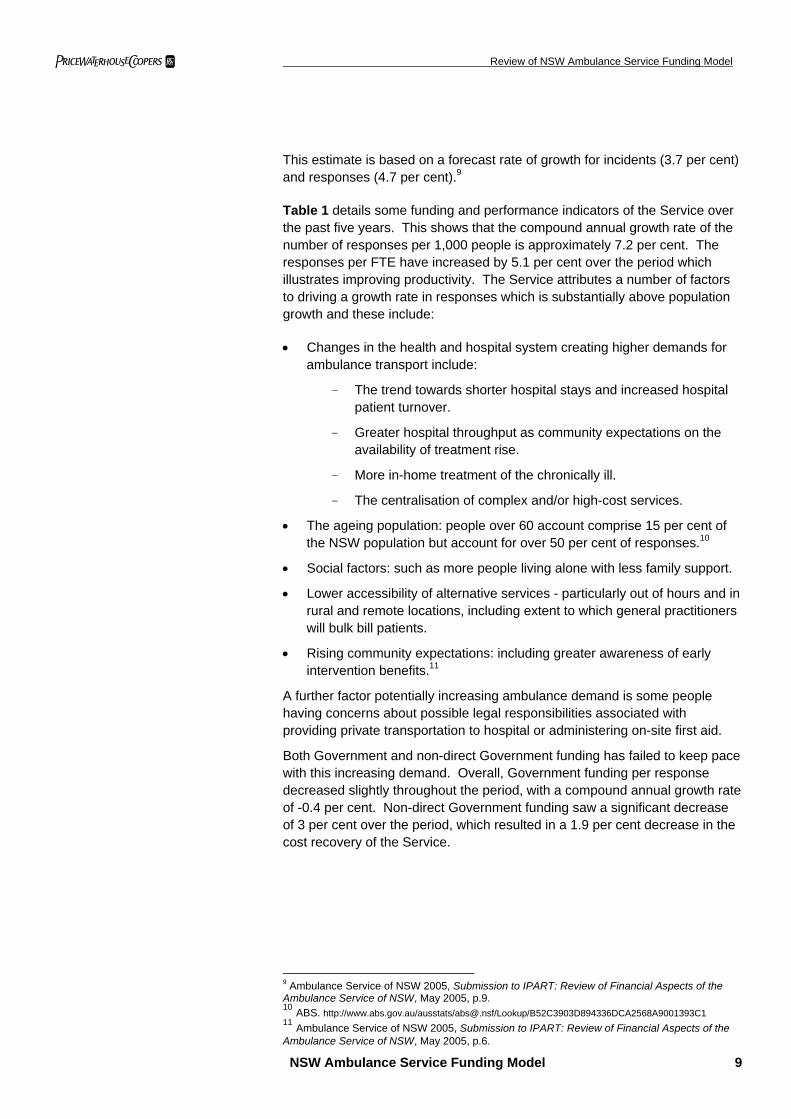
Table 1 details some funding and performance indicators of the Service over the past five years. This shows that the compound annual growth rate of the number of responses per 1,000 people is approximately 7.2 per cent. The responses per FTE have increased by 5.1 per cent over the period which illustrates improving productivity. The Service attributes a number of factors to driving a growth rate in responses which is substantially above population growth and these include:
• Changes in the health and hospital system creating higher demands for ambulance transport include:
- The trend towards shorter hospital stays and increased hospital patient turnover.
- Greater hospital throughput as community expectations on the availability of treatment rise.
- More in-home treatment of the chronically ill.
- The centralisation of complex and/or high-cost services.
• The ageing population: people over 60 account comprise 15 per cent of the NSW population but account for over 50 per cent of responses.10
• Social factors: such as more people living alone with less family support.
• Lower accessibility of alternative services - particularly out of hours and in rural and remote locations, including extent to which general practitioners will bulk bill patients.
• Rising community expectations: including greater awareness of early intervention benefits.11
A further factor potentially increasing ambulance demand is some people having concerns about possible legal responsibilities associated with providing private transportation to hospital or administering on-site first aid.
Both Government and non-direct Government funding has failed to keep pace with this increasing demand. Overall, Government funding per response decreased slightly throughout the period, with a compound annual growth rate of -0.4 per cent. Non-direct Government funding saw a significant decrease of 3 per cent over the period, which resulted in a 1.9 per cent decrease in the cost recovery of the Service.
9 Ambulance Service of NSW 2005, Submission to IPART: Review of Financial Aspects of the Ambulance Service of NSW, May 2005, p.9. 10 ABS. http://www.abs.gov.au/ausstats/[email protected]/Lookup/B52C3903D894336DCA2568A9001393C1 11 Ambulance Service of NSW 2005, Submission to IPART: Review of Financial Aspects of the Ambulance Service of NSW, May 2005, p.6.
pwc Review of NSW Ambulance Service Funding Model
NSW Ambulance Service Funding Model 10
Table 1 Key Performance Indications of the NSW Service from 1999/00 – 2003/04
1999/00 2000/01 2001/02 2002/03 2003/04 Compound Annual Growth
Rate % Responses 655,190 718,697 858,827 895,718 928,073 7.2
No. of Staff (FTEs) 2,997 2,942 2,983 3,162 3,301 2.0
Responses / FTE 219 244 288 283 281 5.1
Responses / 1,000 people 98 107 128 134 139 7.2
Gov't Funding / Response ($s of day) $276 $278 $241 $251 $271 -0.4
Non-direct Gov’t Funding / Response ($s of day)
$99 $86 $77 $83 $85 -3.0
Cost Recovery %* 26.4 23.6 24.3 25.0 24.0 -1.9 Source: Ambulance Service of NSW Annual Reports from 2000/01 – 2003/04. Notes: *Cost Recovery is the proportion of cost recovered by all revenue streams with the exception of direct Government appropriations.
The Service has introduced a number of initiatives over the period from 1999/00 to 2003/04 to address the increasing demand for services which has changed the nature of the Service and increased the number of responses per incident with some additional capital and recurrent funding requirements. Some of the initiatives include:
• placing ambulance resources at the busiest locations in peak periods;
• introduction of Rapid Responders who are able to make an early assessment of the patient; and
• expansion of the non-emergency patient transport service to free up front line resources from non-emergency transport demands.12
12 NSW Health Department 2004, Annual Report 2003/04, p.41.
pwc Review of NSW Ambulance Service Funding Model
NSW Ambulance Service Funding Model 11
2.2 Source and Size of Funding
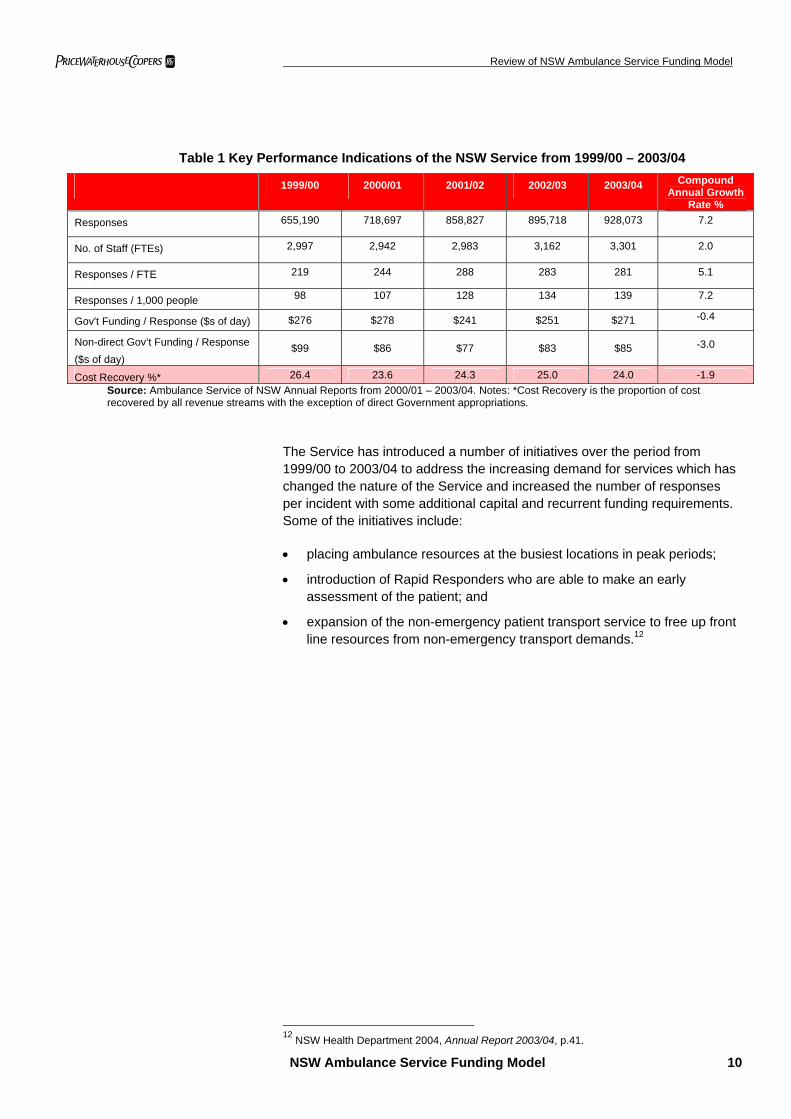
In 2003/04, the Service received $366.8 million in total revenue. The Service has three primary funding sources:
• NSW Government funding, (77.3 per cent);
• transport fees (payment by patients, and other bulk agreements with hospitals, accident authorities, etc.), (20.8 per cent); and
• grants, contributions, and other revenue streams, (1.9 per cent).
Table 2 shows the amount of revenue from each funding source over the past three financial years. This clearly shows that Government funding has consistently been the largest source of funding. In 2003/04, NSW has one of the highest levels of direct and indirect Government funding as a proportion of total funds. Only Tasmania is more reliant on Government funding (83 per cent), whilst WA is the least reliant (18 per cent).13
Table 2: Funding of the Ambulance Service of NSW, 2002/03 –2003/04
FUNDING SOURCE 2001/02 $ mill
2002/03 $ mill
2003/04 $ mill
Compound Annual Growth Rate %
Transport Fees 63.7 72.0 72.5 4.4 Investment income 0.8 1.0 1.1 11.2 Other grants, donations and contributions 1.4 0.9 2.2 16.3 Other revenue 0.6 1.3 3.5 80.0 Total Direct (non-NSW Govt) Revenue 66.4 75.2 79.3 6.1 NSW Health recurrent allocations 198.1 215.8 236.9 6.1 NSW Health capital allocations 9.2 9.1 14.2 15.6 Acceptance by the Crown of employee superannuation benefits 15.6 17.1 18.7
6.2
Total NSW Government Contributions 222.9 242.0 269.9 6.6
TOTAL FUNDING 289.1 317.2 349.2 6.5
Source: Ambulance Service of NSW, Annual Report 2003/04, pp 30-39; Annual Report 2002/03, pp.40-55. Note: This table excludes miscellaneous revenue; including gains on asset disposal, net increase in Asset Valuation Reserve, reduction in owner’s equity.
This table also indicates that transport fees and other revenue, i.e. non-direct Government funding, has remained moderately stable at around 22 per cent of total revenue. Total Government contributions have had a compound annual growth rate of 6.6 per cent between 2001/02 and 2002/03. This level of growth is higher than the 4.4 per cent increase in transport fees over the same period. The Service also has a relatively low cost recovery level, which is 21.6 per cent, based on total costs of $366.8 million in 2003/04. Therefore, it is evident that under the current funding model the Service will be likely to have a substantial and growing dependence on Government funding.
13 Productivity Commission 2005, Report of Government Services 2005, p.8.39. Note: All estimates from the Productivity Commission (PC) report do not include Government contributions from Acceptance by the Crown Entity of employee superannuation benefits. Therefore, financial quotes from the PC report are lower than those quoted from Annual Reports.
pwc Review of NSW Ambulance Service Funding Model
NSW Ambulance Service Funding Model 12
2.3 Funding Approach
2.3.1 Government Funding
The Service is a budget-dependent General Government Entity (GGE). The NSW Treasury provides consolidated fund appropriations to NSW Health to meet both recurrent and capital expenditures of the Department and its agencies. NSW Health subsequently determines the size of the appropriation to the Service. NSW Treasury may also provide one-off funds for particular initiatives to the Service via NSW Health. For instance the 2003/04 Budget Papers allocated $2.6 million as the first component of a four year enhancement to recruit an additional 230 ambulance officers and staff for rural NSW.14
The yearly budget allocation to NSW Health is calculated based on the net cost of the Service, which is the difference between total expenses and retained revenue. For the year ending 30 June 2004, the net cost of NSW Health was $8.43 billion compared with $7.63 billion in 2002/03, a rise of 9.5 per cent.15
The appropriations to the Service are comprised of recurrent and capital allocations. The amount of recurrent funding is negotiated between NSW Health and the Service based on appropriations in pervious years, plus adjustments for wage rises and Consumer Price Index (CPI), and often less some productivity gain. The recurrent Government funding meets the large gap between non-direct Government revenue and the total cost of the Service. However, the size of the appropriation may not always cover the full deficit of the Service every year. A modest gap between the Government subsidy or appropriation and the total cash deficit is sometimes established in order to provide the Service with more incentive to manage cost growth, and cover such a gap via improvements in productivity and cash flow management techniques.
Capital funding is also provided to support specific infrastructure improvement programs, e.g. new ambulance stations in particular locations. There is also some adjustment to recurrent support where capital grants give rise to new operating costs (e.g. opening new ambulance stations).
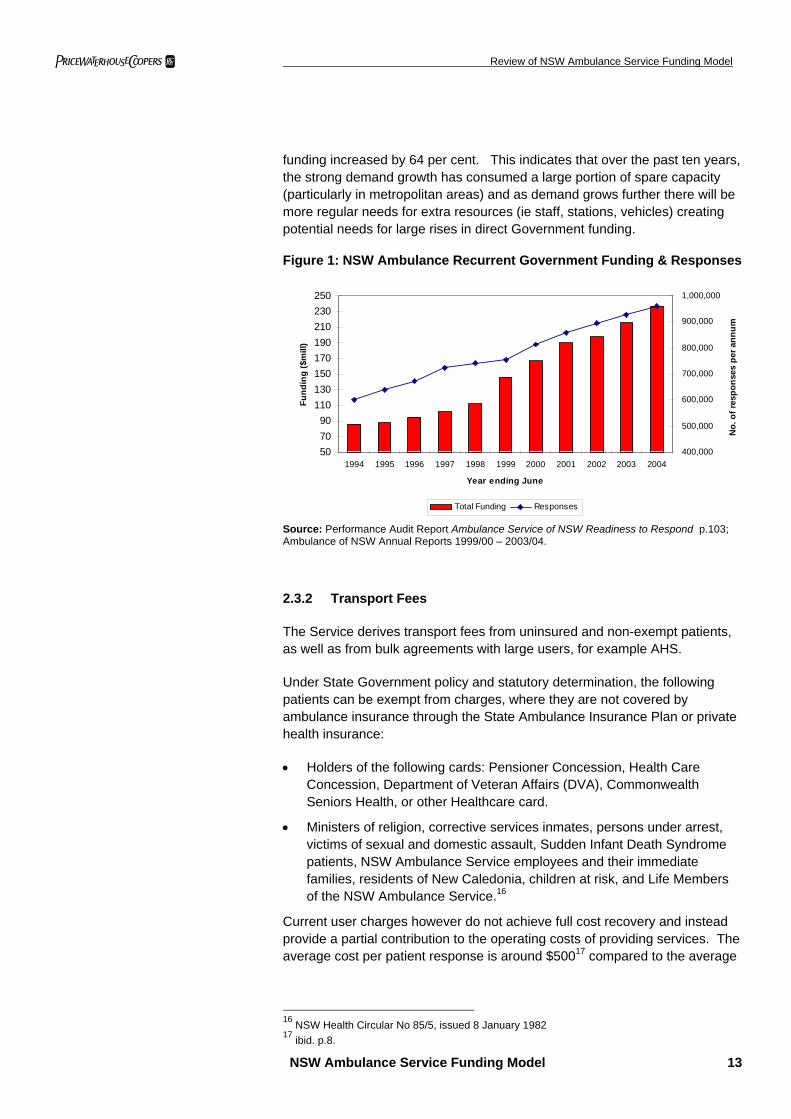
With a history of Government funding levels being set based on prior year funding levels (plus some adjustments for cost and wages growth), there will be some challenges changing to some form of new performance or demand based Government funding approach. As illustrated in Table 2, NSW Government funding growth has been below the rate of growth in increases in demand over the past five years. Because the Service has over 75 per cent of its cost being fixed in nature, it has been able to handle the strong demand growth with lower levels of growth in Government funding. Figure 1 shows the growth in the number of responses and the growth in NSW Government recurrent funding over the period 1994 to 2004. Over this period the number of responses increased by 82 per cent, and NSW Government recurrent
14 NSW Treasury, Budget Papers 2003/04: Budget Paper 3; p.10-8. 15 NSW Department of Health 2004, Annual Report 2003/04, p.54.
pwc Review of NSW Ambulance Service Funding Model
NSW Ambulance Service Funding Model 13
funding increased by 64 per cent. This indicates that over the past ten years, the strong demand growth has consumed a large portion of spare capacity (particularly in metropolitan areas) and as demand grows further there will be more regular needs for extra resources (ie staff, stations, vehicles) creating potential needs for large rises in direct Government funding.
Figure 1: NSW Ambulance Recurrent Government Funding & Responses
507090
110130150170190210230250
1994 1995 1996 1997 1998 1999 2000 2001 2002 2003 2004
Year ending June
Fund
ing
($m
ill)
400,000
500,000
600,000
700,000
800,000
900,000
1,000,000
No.
of r
espo
nses
per
ann
um
Total Funding Responses
Source: Performance Audit Report Ambulance Service of NSW Readiness to Respond p.103; Ambulance of NSW Annual Reports 1999/00 – 2003/04.
2.3.2 Transport Fees
The Service derives transport fees from uninsured and non-exempt patients, as well as from bulk agreements with large users, for example AHS.
Under State Government policy and statutory determination, the following patients can be exempt from charges, where they are not covered by ambulance insurance through the State Ambulance Insurance Plan or private health insurance:
• Holders of the following cards: Pensioner Concession, Health Care Concession, Department of Veteran Affairs (DVA), Commonwealth Seniors Health, or other Healthcare card.
• Ministers of religion, corrective services inmates, persons under arrest, victims of sexual and domestic assault, Sudden Infant Death Syndrome patients, NSW Ambulance Service employees and their immediate families, residents of New Caledonia, children at risk, and Life Members of the NSW Ambulance Service.16
Current user charges however do not achieve full cost recovery and instead provide a partial contribution to the operating costs of providing services. The average cost per patient response is around $50017 compared to the average
16 NSW Health Circular No 85/5, issued 8 January 1982 17 ibid. p.8.
pwc Review of NSW Ambulance Service Funding Model
NSW Ambulance Service Funding Model 14
charge to non-exempt patient responses of $196.18 This outcome is due to the relatively low charges and the negligible price differential between primary and non-primary services, which is less than two per cent.
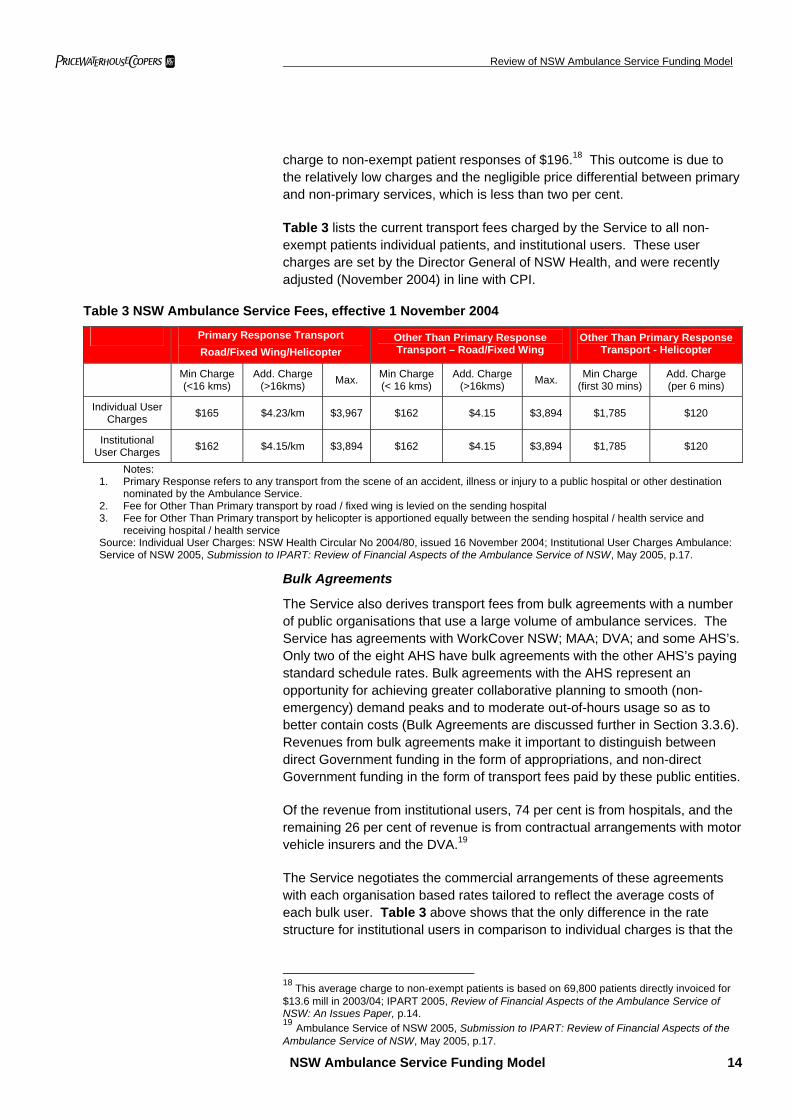
Table 3 lists the current transport fees charged by the Service to all non-exempt patients individual patients, and institutional users. These user charges are set by the Director General of NSW Health, and were recently adjusted (November 2004) in line with CPI.
Table 3 NSW Ambulance Service Fees, effective 1 November 2004
Primary Response Transport Road/Fixed Wing/Helicopter
Other Than Primary Response Transport – Road/Fixed Wing
Other Than Primary Response Transport - Helicopter
Min Charge (<16 kms)
Add. Charge (>16kms) Max. Min Charge
(< 16 kms) Add. Charge
(>16kms) Max. Min Charge (first 30 mins)
Add. Charge (per 6 mins)
Individual User Charges $165 $4.23/km $3,967 $162 $4.15 $3,894 $1,785 $120
Institutional User Charges $162 $4.15/km $3,894 $162 $4.15 $3,894 $1,785 $120
Notes: 1. Primary Response refers to any transport from the scene of an accident, illness or injury to a public hospital or other destination
nominated by the Ambulance Service. 2. Fee for Other Than Primary transport by road / fixed wing is levied on the sending hospital 3. Fee for Other Than Primary transport by helicopter is apportioned equally between the sending hospital / health service and
receiving hospital / health service Source: Individual User Charges: NSW Health Circular No 2004/80, issued 16 November 2004; Institutional User Charges Ambulance: Service of NSW 2005, Submission to IPART: Review of Financial Aspects of the Ambulance Service of NSW, May 2005, p.17.
Bulk Agreements
The Service also derives transport fees from bulk agreements with a number of public organisations that use a large volume of ambulance services. The Service has agreements with WorkCover NSW; MAA; DVA; and some AHS’s. Only two of the eight AHS have bulk agreements with the other AHS’s paying standard schedule rates. Bulk agreements with the AHS represent an opportunity for achieving greater collaborative planning to smooth (non-emergency) demand peaks and to moderate out-of-hours usage so as to better contain costs (Bulk Agreements are discussed further in Section 3.3.6). Revenues from bulk agreements make it important to distinguish between direct Government funding in the form of appropriations, and non-direct Government funding in the form of transport fees paid by these public entities.
Of the revenue from institutional users, 74 per cent is from hospitals, and the remaining 26 per cent of revenue is from contractual arrangements with motor vehicle insurers and the DVA.19
The Service negotiates the commercial arrangements of these agreements with each organisation based rates tailored to reflect the average costs of each bulk user. Table 3 above shows that the only difference in the rate structure for institutional users in comparison to individual charges is that the
18 This average charge to non-exempt patients is based on 69,800 patients directly invoiced for $13.6 mill in 2003/04; IPART 2005, Review of Financial Aspects of the Ambulance Service of NSW: An Issues Paper, p.14. 19 Ambulance Service of NSW 2005, Submission to IPART: Review of Financial Aspects of the Ambulance Service of NSW, May 2005, p.17.
pwc Review of NSW Ambulance Service Funding Model
NSW Ambulance Service Funding Model 15
primary response transport is marginally lower than the individual user charges.
The nature of the coverage of each service agreements and the actual fee structure for each institutional users often differs. For example the DVA accepts responsibility for the majority of ambulance services for its beneficiaries. However, the DVA declines payment for the journey for patients between a health facility and their home. The Service reports that many veterans are unaware of this DVA policy, and are often unable to pay for such journeys that often involve long distances and high charges. DVA also does not accept responsibility for payment in respect to services to veterans who qualify for exemption from State charges, e.g. pensioners.20
Number of Potentially Liable Patients
Given the extent of exemptions and the fact that those exempted comprise a large proportion of users, there is a limited pool of patients from which the Service can recover transport charges. Of the 928,000 responses in 2003/04, 753,300 patients were transported and / or treated. However, only 20 per cent were charged directly. This substantially narrows the paying customer base, making it significantly challenging to boost non-direct NSW Government revenue and the rate of cost recovery. This is due partly to the following trends:
• Almost 50 per cent of total patients treated are pensioners and people with healthcare cards. Whilst this category of patient only represents 22.2 per cent of the NSW population,21 they account for half of the Service volume.
• Another 44.2 per cent of NSW population have private health cover,22 and are thus are also exempt from direct payment to the Service. Consequently, the Service did not receive direct payment for the 59,900 privately insured patients treated in 2003/04. However, these people contribute indirectly through the Health Insurance Levy (HIL) that NSW Treasury receives from health insurance providers in NSW with the cost of this HIL being built into premiums. Whilst 42.2 per cent of NSW residents are insured, they comprised only 7 per cent of total responses.
• On the assumption that only a small percentage of Commonwealth Government funded pensioners and other exempt patients have private health cover, this implies that only 33.6 per cent of the NSW population are eligible to be directly invoiced for the use of ambulance services. In 2003/04, approximately 1 per cent of the NSW population were charged for their use of ambulance services, contributing approximately 4 per cent of ambulance revenue in that year.23
20 Ambulance Service of NSW 2005, Submission to IPART: Review of Financial Aspects of the Ambulance Service of NSW, May 2005, p.20. 21 ABS National Regional Profile NSW 2002. 22 Private Health Insurance Administration Council (PHIAC) 2004, PHIAC A New South Wales Report, p.3 23 Ambulance Service of NSW 2005, Submission to IPART: Review of Financial Aspects of the Ambulance Service of NSW, May 2005, p.16.
pwc Review of NSW Ambulance Service Funding Model
NSW Ambulance Service Funding Model 16
• Of the patients who are directly charged, approximately 47 per cent fail to pay the invoice, which resulted in $6.3 million in bad and doubtful debts in 2003/04.24 However, this propensity for such a high percentage of bad debts is a common feature amongst most Australian ambulance services.
Therefore there is scope for the Service to improve the cost reflectivity its charges and to consider broadening the number of patients who can potentially be invoiced so as to improve the levels of cost recovery.
Bad and Doubtful Debts
The Service has 47 per cent of bad debts off direct user charges creating a revenue loss of $6.3 million in 2003/04. This has decreased from 54 per cent in 2000.25 Ambulance providers often see their services as a debt prone sector as a large number of patients simply do not have the capacity to pay. The Service also faces some challenges in deciding whether to charge patients who may have suffered significant trauma or misfortune. However, as a range of welfare recipients are generally exempt from invoices, the extent of bad debts should arguably be lower. Overall, the amount of the loss from bad debts will rise further if charges are increased or exemptions reduced and bad debt procedures are not altered.
The Service currently outsources debt collection to a private sector agency, which employs a process of a series of reminder letters, culminating in a solicitors Letter of Demand. However, after this point no further action is pursued and it would appear that some regular users are aware of the Service’s strategy of not fully pursuing debts. According to the Service, the average cost of recovering a debt currently exceeds the average outstanding fees.
The Service also reports being constrained by Government ownership, from fully using conventional commercial techniques of debt recovery. Whilst the NSW bad debt outcome is similar to other States, this should not prevent consideration of new techniques to improve debt recovery.
PwC suggests that the Service should review techniques used by other entities such as for parking fines, utilities bills, mobile telephone accounts, etc. There is also probably scope to examine using the services of the State Debt Recovery Office (SDRO) to assess whether outstanding invoices can be added to other Government charges, for example vehicle registration or driver’s license fees. The SDRO administers the NSW fine enforcement system and is responsible for the receipt and collection of outstanding fines and debts providing services to a range of State and Local Government agencies. As the vast majority of these bad debtors are not substantially dependent on welfare payments, these ambulance accounts should have a some prospect of debt recovery.
24 IPART 2005, Review of Financial Aspects of the Ambulance Service of NSW: An Issues Paper, March 2005, p.15. 25 Ambulance Service of NSW 2005, Submission to IPART: Review of Financial Aspects of the Ambulance Service of NSW, May 2005, p.21.
pwc Review of NSW Ambulance Service Funding Model
NSW Ambulance Service Funding Model 17
2.3.3 NSW Government Ambulance Subscription Scheme
NSW previously had the State Ambulance Insurance Plan subscription scheme, however it was effectively replaced by the HIL in 1982 (see section 2.3.4 below for details). It covered members for all emergency, and most non-emergency ambulance services in NSW in return for an annual fee. Uniquely, revenue from the subscription scheme was directed to Consolidated Revenue, rather than hypothecated to the Service.
No new memberships are being issued. However, there is a small amount of revenue being collected from the subscription scheme from people who have maintained their membership. Membership was priced at approximately $50 per single and $100 per couple / family per annum.
The introduction of the Commonwealth Government 30 per cent rebate on private health insurance in 1999 meant that private Ambulance Only cover became even more price attractive than the previous subscription scheme. For example, MBF offers single Ambulance Only cover for $35.10 ($24.55 after the rebate), and family cover is $70.25 ($49.15 after the rebate).26
2.3.4 Private Health Insurance Levy
In 1982 the NSW Government established a Health Insurance Levy (HIL) on all NSW residents who took out basic hospital cover with private health insurers. This effectively displaced the NSW Ambulance subscription scheme. Under the Health Insurance Levies Act 1982 (NSW), organisations carrying out a health insurance business in NSW are required to pay a levy for contributors unless the contributors are pensioners.
The current HIL rate from 1 February 2005 is $1.03 per week per single, which amounts to $53.56 per annum.27 In 2003/04, the levy raised $98 million for the Office of State Revenue (OSR), and is budgeted to raise $102 million in 2004/05.28 The levy is paid directly to NSW Treasury Consolidated Revenue by health insurers. Therefore, the NSW Ambulance Service does not directly receive the levy from Treasury. Instead the HIL revenue contributes to consolidated revenue, from which the Service receives an appropriation via NSW Health. However, in their submission to the IPART Issues Paper, the Service claims that in 2003/04 $100 million of the total ambulance funding was from the HIL.29 This implies that the HIL revenue is effectively, just not officially, hypothecated to the Service.
26 MBF; http://mbf.com.au/main/products/ambulance/ 27 NSW Treasury; Office of State Revenue www.osr.nsw.gov.au 28 NSW Treasury, Budget Papers 2003/04: Budget Paper 2; p.3-16 29 Ambulance Service of NSW 2005, Submission to IPART: Review of Financial Aspects of the Ambulance Service of NSW, May 2005, p.15.
pwc Review of NSW Ambulance Service Funding Model
NSW Ambulance Service Funding Model 18
As discussed above, approximately 44.2 per cent of the NSW population have private health insurance. This has risen from a low of 30.2 per cent in 199830 prior to the introduction of a range of Commonwealth Government incentives designed to increase participation in private health insurance. These incentives include:
• Lifetime Cover
• Federal Government 30 per cent rebate on private health insurance
• Medicare levy surcharge for uninsured higher income earners
The effect of the HIL is that residents in NSW who have private health insurance are exempt from ambulance user charges. This means that unlike other jurisdictions without a HIL, privately covered patients are not required to pay an ambulance invoice and then obtain a refund from the health insurer. Insurers do not pay the HIL for people with Ambulance Only cover, such policy holders receive the service and then make an insurance claim.
Arguably, HIL is administratively simpler than a subscription scheme, and as it is mandatory for those with private health insurance it captures a higher proportion of the population. As more NSW residents participate in health insurance, in response to the Commonwealth incentives, the proportion of the NSW population eligible to pay ambulance user charges diminishes.31 However, revenue from the HIL will fluctuate depending on factors such as the extent of Commonwealth Government policy support for private health insurance and the size of health insurance premium rises.
30 PHIAC website: http://www.phiac.gov.au/statistics/membershipcoverage/hosquar.htm 31 Ambulance Service of NSW 2005, Submission to IPART: Review of Financial Aspects of the Ambulance Service of NSW, May 2005, p. 16.
pwc Review of NSW Ambulance Service Funding Model
NSW Ambulance Service Funding Model 19
2.4 Cost Structure
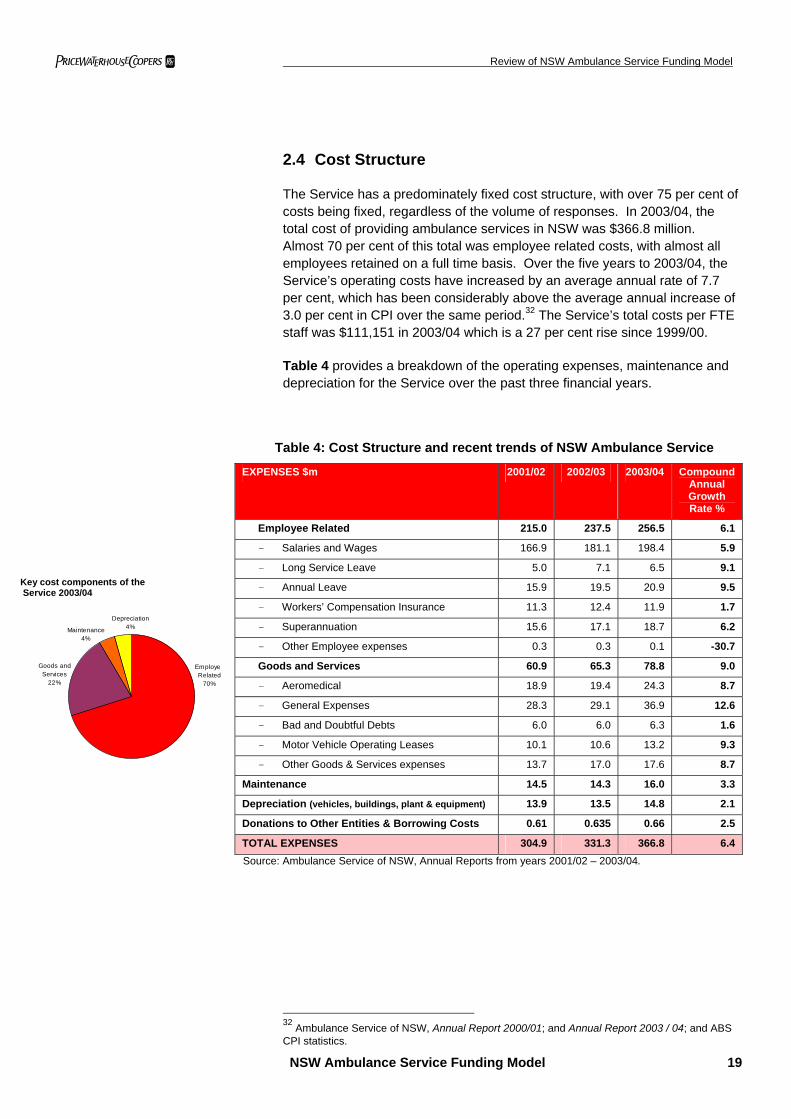
The Service has a predominately fixed cost structure, with over 75 per cent of costs being fixed, regardless of the volume of responses. In 2003/04, the total cost of providing ambulance services in NSW was $366.8 million. Almost 70 per cent of this total was employee related costs, with almost all employees retained on a full time basis. Over the five years to 2003/04, the Service’s operating costs have increased by an average annual rate of 7.7 per cent, which has been considerably above the average annual increase of 3.0 per cent in CPI over the same period.32 The Service’s total costs per FTE staff was $111,151 in 2003/04 which is a 27 per cent rise since 1999/00.
Table 4 provides a breakdown of the operating expenses, maintenance and depreciation for the Service over the past three financial years.
Table 4: Cost Structure and recent trends of NSW Ambulance Service
EXPENSES $m 2001/02 2002/03 2003/04 Compound Annual Growth Rate %
Employee Related 215.0 237.5 256.5 6.1
- Salaries and Wages 166.9 181.1 198.4 5.9
- Long Service Leave 5.0 7.1 6.5 9.1
- Annual Leave 15.9 19.5 20.9 9.5
- Workers’ Compensation Insurance 11.3 12.4 11.9 1.7
- Superannuation 15.6 17.1 18.7 6.2
- Other Employee expenses 0.3 0.3 0.1 -30.7
Goods and Services 60.9 65.3 78.8 9.0
- Aeromedical 18.9 19.4 24.3 8.7
- General Expenses 28.3 29.1 36.9 12.6
- Bad and Doubtful Debts 6.0 6.0 6.3 1.6
- Motor Vehicle Operating Leases 10.1 10.6 13.2 9.3
- Other Goods & Services expenses 13.7 17.0 17.6 8.7
Maintenance 14.5 14.3 16.0 3.3
Depreciation (vehicles, buildings, plant & equipment) 13.9 13.5 14.8 2.1
Donations to Other Entities & Borrowing Costs 0.61 0.635 0.66 2.5
TOTAL EXPENSES 304.9 331.3 366.8 6.4 Source: Ambulance Service of NSW, Annual Reports from years 2001/02 – 2003/04.
32 Ambulance Service of NSW, Annual Report 2000/01; and Annual Report 2003 / 04; and ABS CPI statistics.
Key cost components of the Service 2003/04
EmployeRelated
70%
Depreciation4%Maintenance
4%
Goods and Services
22%
pwc Review of NSW Ambulance Service Funding Model
NSW Ambulance Service Funding Model 20
There are significant differences in average costs for each category of patient in NSW.33 However, the transport fees structure fails to reflect these differences, reducing the capacity of the Service to recover cost, for example:
• In city areas, the costs per emergency patient are around double those per non-emergency patient transported by ambulance, and triple those per non-emergency patient transported by a designated ‘patient transport vehicle’.
• The cost per rural patient is 50 per cent or more higher than the costs per patient in the metropolitan area, (excluding rescue cases).
Ambulance services conducted after hours also have a greater cost due to higher labour rates. In rural areas, ambulance officers are on-call after hours, and are paid for approximately seven hours each time they respond to a call. This places some incentive to shift services to after hours, greatly increasing the costs of the Service and further decreasing potential cost recovery. There could be some merit in introducing an after hours charge on non-emergency services in order to provide a price signal of the higher costs of these Services. Clearly, emergency services should not be subject to an after hours charge. However, such arrangements could increase the propensity to transport non-emergency patients during business hours.
33 IPART 2005, Review of Financial Aspects of the Ambulance Service of NSW: An Issues Paper, March 2005, p.9.
pwc Review of NSW Ambulance Service Funding Model
A Review of National and International Jurisdictions 21
3 A Review of National and International Jurisdictions
3.1 A Snapshot of Interstate and International Services
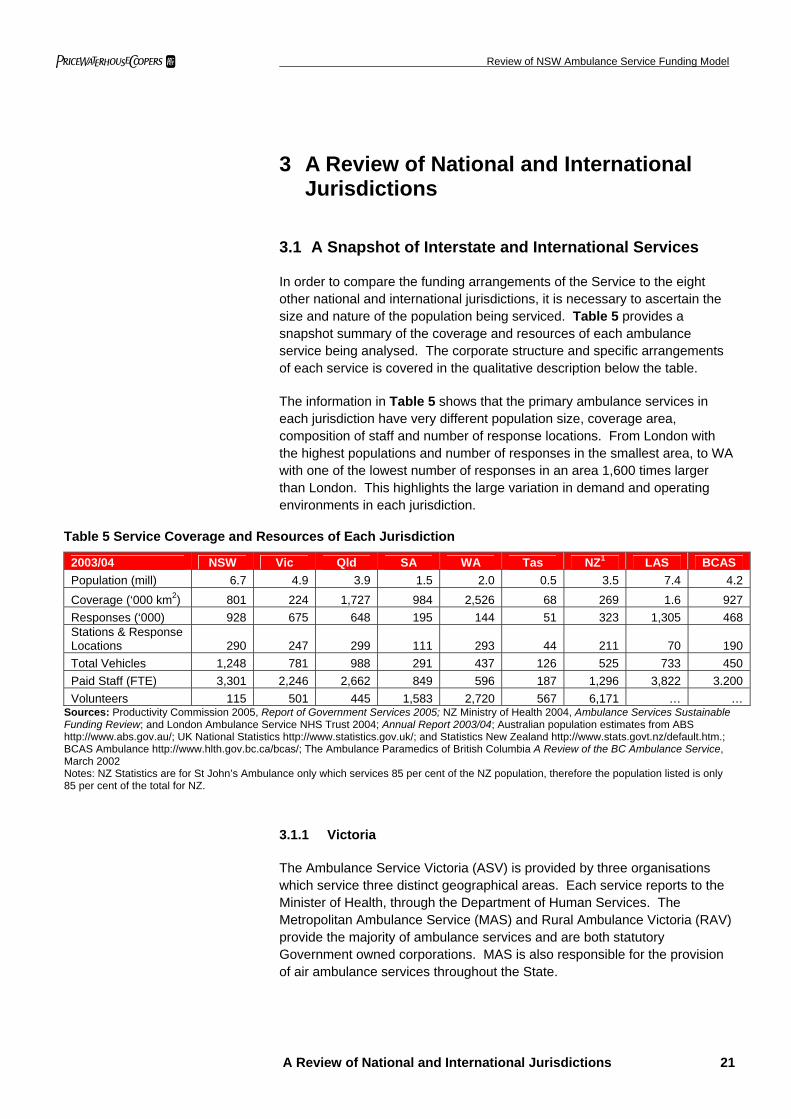
In order to compare the funding arrangements of the Service to the eight other national and international jurisdictions, it is necessary to ascertain the size and nature of the population being serviced. Table 5 provides a snapshot summary of the coverage and resources of each ambulance service being analysed. The corporate structure and specific arrangements of each service is covered in the qualitative description below the table.
The information in Table 5 shows that the primary ambulance services in each jurisdiction have very different population size, coverage area, composition of staff and number of response locations. From London with the highest populations and number of responses in the smallest area, to WA with one of the lowest number of responses in an area 1,600 times larger than London. This highlights the large variation in demand and operating environments in each jurisdiction.
Table 5 Service Coverage and Resources of Each Jurisdiction
2003/04 NSW Vic Qld SA WA Tas NZ1 LAS BCAS Population (mill) 6.7 4.9 3.9 1.5 2.0 0.5 3.5 7.4 4.2 Coverage (‘000 km2) 801 224 1,727 984 2,526 68 269 1.6 927 Responses (‘000) 928 675 648 195 144 51 323 1,305 468 Stations & Response Locations 290 247 299 111 293 44 211 70 190 Total Vehicles 1,248 781 988 291 437 126 525 733 450 Paid Staff (FTE) 3,301 2,246 2,662 849 596 187 1,296 3,822 3.200 Volunteers 115 501 445 1,583 2,720 567 6,171 … …
Sources: Productivity Commission 2005, Report of Government Services 2005; NZ Ministry of Health 2004, Ambulance Services Sustainable Funding Review; and London Ambulance Service NHS Trust 2004; Annual Report 2003/04; Australian population estimates from ABS http://www.abs.gov.au/; UK National Statistics http://www.statistics.gov.uk/; and Statistics New Zealand http://www.stats.govt.nz/default.htm.; BCAS Ambulance http://www.hlth.gov.bc.ca/bcas/; The Ambulance Paramedics of British Columbia A Review of the BC Ambulance Service, March 2002 Notes: NZ Statistics are for St John’s Ambulance only which services 85 per cent of the NZ population, therefore the population listed is only 85 per cent of the total for NZ.
3.1.1 Victoria
The Ambulance Service Victoria (ASV) is provided by three organisations which service three distinct geographical areas. Each service reports to the Minister of Health, through the Department of Human Services. The Metropolitan Ambulance Service (MAS) and Rural Ambulance Victoria (RAV) provide the majority of ambulance services and are both statutory Government owned corporations. MAS is also responsible for the provision of air ambulance services throughout the State.
pwc Review of NSW Ambulance Service Funding Model
A Review of National and International Jurisdictions 22
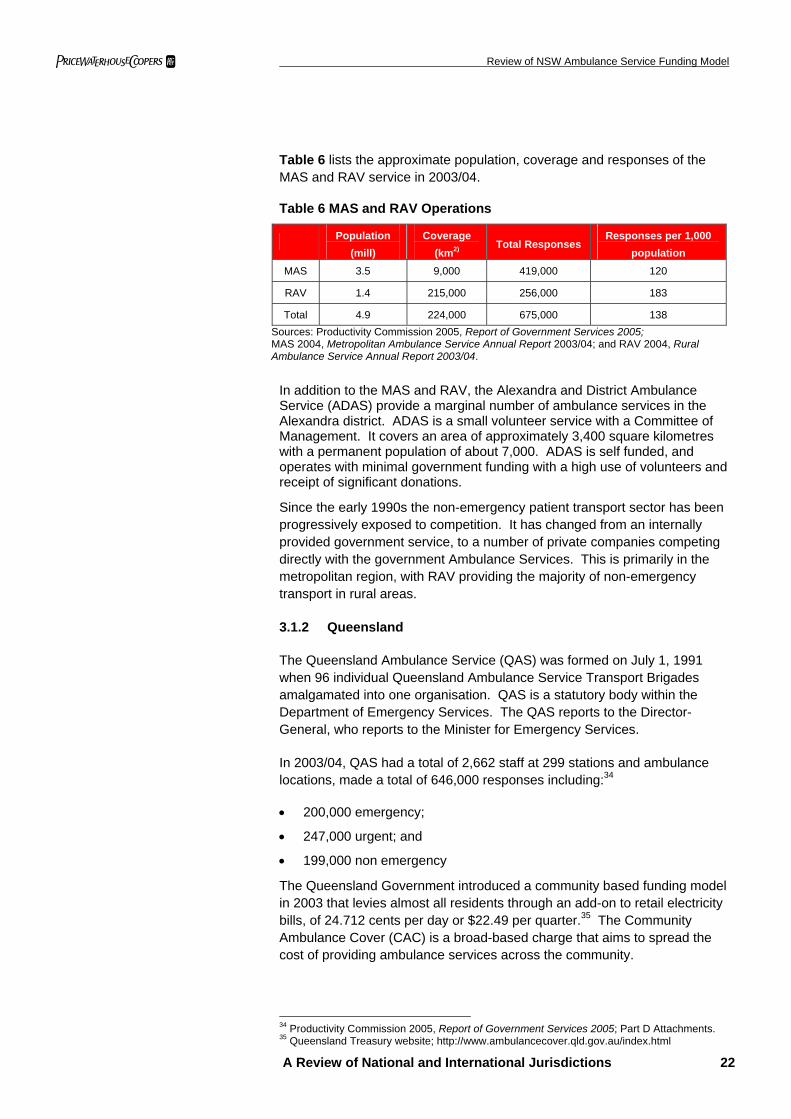
Table 6 lists the approximate population, coverage and responses of the MAS and RAV service in 2003/04.
Table 6 MAS and RAV Operations
Population
(mill) Coverage
(km2) Total Responses
Responses per 1,000 population
MAS 3.5 9,000 419,000 120
RAV 1.4 215,000 256,000 183
Total 4.9 224,000 675,000 138 Sources: Productivity Commission 2005, Report of Government Services 2005; MAS 2004, Metropolitan Ambulance Service Annual Report 2003/04; and RAV 2004, Rural Ambulance Service Annual Report 2003/04.
In addition to the MAS and RAV, the Alexandra and District Ambulance Service (ADAS) provide a marginal number of ambulance services in the Alexandra district. ADAS is a small volunteer service with a Committee of Management. It covers an area of approximately 3,400 square kilometres with a permanent population of about 7,000. ADAS is self funded, and operates with minimal government funding with a high use of volunteers and receipt of significant donations.
Since the early 1990s the non-emergency patient transport sector has been progressively exposed to competition. It has changed from an internally provided government service, to a number of private companies competing directly with the government Ambulance Services. This is primarily in the metropolitan region, with RAV providing the majority of non-emergency transport in rural areas.
3.1.2 Queensland
The Queensland Ambulance Service (QAS) was formed on July 1, 1991 when 96 individual Queensland Ambulance Service Transport Brigades amalgamated into one organisation. QAS is a statutory body within the Department of Emergency Services. The QAS reports to the Director-General, who reports to the Minister for Emergency Services.
In 2003/04, QAS had a total of 2,662 staff at 299 stations and ambulance locations, made a total of 646,000 responses including:34
• 200,000 emergency;
• 247,000 urgent; and
• 199,000 non emergency
The Queensland Government introduced a community based funding model in 2003 that levies almost all residents through an add-on to retail electricity bills, of 24.712 cents per day or $22.49 per quarter.35 The Community Ambulance Cover (CAC) is a broad-based charge that aims to spread the cost of providing ambulance services across the community.
34 Productivity Commission 2005, Report of Government Services 2005; Part D Attachments. 35 Queensland Treasury website; http://www.ambulancecover.qld.gov.au/index.html
pwc Review of NSW Ambulance Service Funding Model
A Review of National and International Jurisdictions 23
The introduction of the CAC meant that all Queensland residents are now exempt from a direct invoice for specific ambulance usage. A benefit of the CAC is that it largely eliminates bad debts.
In 2003/04, the CAC recovered 32.2 per cent of the QAS’s total costs. Additionally, the average annual compound growth rate of responses in Queensland between 2001/02 – 2003/04 is 5 per cent. This is the largest response growth rate of the Australian jurisdictions being analysed, (the lowest being -0.2 per cent in WA), implying the removal of a direct price signal with the introduction of the CAC can stimulate demand.
3.1.3 South Australia
The South Australian Ambulance Service (SAAS) is the trading name of SA St John’s Ambulance service, which is empowered and required to provide ambulance services in South Australia under the Ambulance Services Act 1992 (SA). SAAS is an Incorporated Association under the Associations Incorporations Act 1985 (SA). This Act saw the formal acceptance of government responsibility for the Ambulance Service – as distinct from the previous practice of providing deficit funding for the St Johns Council.36
There are two members of the association; St John Priory and the Minister of Health. St John Priory has delegated its authority to nominate and appoint directors of the Ambulance Board to the Minister.37 As an incorporated body, the SAAS reports to the Minister for Health.
SAAS was recently reclassified into the general government sector, which means that assets and liabilities have been included in the State budget for the first time in 2003/04. This reclassification improved the net worth of the general government sector by $38 million in 2003/04.38
SAAS provides services to the 1.5 million people of South Australia, with 111 stations and response locations across an area of 984,377 square kilometres. In 2003/04, SAAS made 195,000 responses, which is a total of 130 responses per 1,000 people.39
36 SA Department of Justice 2003, Review of the South Australian Ambulance Service, Final Report prepared by Lizard Drinking, SA, p.11. 37 SAAS 2004, SA Ambulance Service Annual Report 2003/04, p.6. 38 Government of South Australia 2004, State Budget 2004-05: SA Budget Paper 3, pp.3.22; 5.3. 39 SAAS 2004, SA Ambulance Service Annual Report 2003/04, p.13.
pwc Review of NSW Ambulance Service Funding Model
A Review of National and International Jurisdictions 24
3.1.4 Western Australia
All emergency ambulance services in WA are provided by St John Ambulance which is an incorporated not-for-profit organisation. WA Department of Health has a $100 million 5 year contract with St John’s to provide ambulance services for the whole state.
This service covers 2,525,500 square kilometres, and is the largest area covered by any single ambulance service in the world. This is divided into two divisions; the Perth Metropolitan and the Country Region. There were a total of 144,000 cases in WA during 2003/04, of which 57.4 per cent are emergency and urgent responses, which is considerably lower than the 68.3 per cent in NSW. This translates into a total of 72 responses per 1,000 people, which is lower than most of other States. This is possibly due to a combination of relatively lower level of accessibility in non-metro areas and a demand moderation impact of the introduction in 2001/02 of a $50 co-payment for non-emergency ambulance transport.
There is also a privately owned and run service, Advance Life Ambulance Service that provides non-emergency transport and first aid training in W.A.
3.1.5 Tasmania
The Tasmanian Ambulance Service (TAS) is the major provider of ambulance services, and is a division of the Department of Health and Human Services in Tasmania. All Ambulance services are regulated through the Ambulance Service Act 1982 (Tasmania).
The TAS operates from 44 stations State wide with a fleet of approximately 70 ambulance vehicles. The TAS is dependent on volunteer labour, of a total of 754 staff only 187 (24.8 per cent) are paid full time employees. There are 567 volunteer officers who work alongside paramedics in 14 locations, as well as from 23 wholly volunteer stations.
The Community and Rural Health Division of the Department of Health and Human Services manage the ambulance services in Queenstown and Scottsdale which are attached to rural health facilities. In Oatlands, the local government has taken on the responsibility for the provision of ambulance services. The service is staffed and operated by the Oatlands Multipurpose Centre. The service is funded through an ambulance levy imposed on ratepayers with the Community and Rural Health Division meeting any deficit.
There are also some independent and private ambulance services in Tasmania, including the Glamorgan Ambulance Service and St John’s.
pwc Review of NSW Ambulance Service Funding Model
A Review of National and International Jurisdictions 25
3.1.6 New Zealand
Ambulance services in New Zealand (NZ) are supplied by non-government providers, District Health Boards (DHBs) and private providers. There are approximately 211 stations and ambulance response locations in NZ. The service providers can be broadly categorised as:
• Non-Government: St John’s Ambulance provide 85 per cent of all ambulance services, through 5 divisions, with a total of 1,296 paid ambulance and operational staff and 6,171 volunteers. St Johns Ambulance in NZ have 176 stations and 525 ambulance and operational vehicles. In 2003/04, St John’s NZ made approximately 322,820 responses. The Free Wellington Ambulance Service is a charitable trust, which treated 39,771 patients, from 8 stations in 2003/04.
• Government: three of the 21 District Health Boards (DHB) in NZ, which are responsible for planning, funding, providing and monitoring health and disability services, also provide some ambulance services. DHBs account for less than 5 per cent of total incidents attended.40
• Private: there are a few private providers of non-emergency transport in NZ.
In 2002/03, all Ambulance Services in NZ made approximately 242,000 responses, which equates to 78 responses per 1,000 of the population
Due to the large majority of ambulance services provided by non-government ambulance services, there is a lack of aggregated data on the three types of service providers. Hence, this report will focus on the outcomes and funding arrangements of the non-government sector, particularly St John’s Ambulance.
Overall, the NZ Ambulance Services recorded a cash flow surplus of $6.7 million in 2002/03.41 Although the non-government ambulance services have had a surplus in recent years, it appears that there is a net deficit in revenue from ambulance activities alone. St John’s financial performance indicates a net deficit of $0.249 million in 2002/03, compared with an overall surplus of $6.3 million.42
3.1.7 Canada
In Canada the Provinces are given authority over the delivery of health care, including ambulance services, in accordance with section 92 of the Constitution Act 1867. The majority of Provinces and Territories have decentralised the provision and funding of ambulance services to a municipal level. Therefore, the bulk of Canadian ambulance services are provided by a large number of small private and public operators, that are funded by a mixture of government funding, fundraising and commercial activities.
40NZ Ministry of Health 2004, Ambulance Services Sustainable Funding Review, Wellington, p.11. 41 ibid, p.11. 42ibid, p.26.
pwc Review of NSW Ambulance Service Funding Model
A Review of National and International Jurisdictions 26
Recent developments in the ambulance services in Ontario are an example of the problems that can emerge from the fragmentation and inefficiencies from having a large number of operators in one area. In 1997 the Ontario Government decided to shift the responsibility for the delivery and funding of ambulance services from the Province to upper-tier municipalities. This was intended to decrease the funding requirement from the Provincial Government, who hoped to shift 100 per cent of funding to the municipalities. However, the transition from Province to municipality was more complex than anticipated, with many municipalities opposing the proposition.43 By 1999 cost responsibility was reallocated, with the Ontario Government assuming 50 per cent. Overall, Ontario has had mixed success in decreasing the costs by shifting ambulance services to a municipal level.
British Columbia (BC) is the only Province that operates and funds province wide ambulance services in Canada. The BCAS was created in 1974 in order to “address the disparity in delivery of emergency medical services in the province.”44 The Government of BC, via the Ministry of Health Services, assumes full responsibility for the funding and provision of ambulance services. Due to this similarity of the provincially operated BCAS in comparison to other municipal ambulance service in Canada, the BCAS has been selected as the most useful comparator in this jurisdiction.
The BCAS services a population of 4.2 million, in an area over 926,000 km2. BCAS covers the large majority of the province, however some of the more isolated and rural areas are not covered. In 2003/04 the BCAS made a total of 468,000 responses with 3,200 staff.
3.1.8 United Kingdom
The health system in the United Kingdom (UK) is managed by National Health Services (NHS) in each country. The UK Department of Health allocates funding to each NHS. The level of funding to each NHS is determined on a weighted capitation45 basis to ensure that each funding share reflects the relative health needs of the population. It takes into account the population level, age, gender, and geographical needs.
Public Care Trusts (PCT) are responsible for the commissioning of health care on behalf of their resident population. Hence, unlike Australia where the majority of the health system is managed on a State / Territory level, PCTs are local health organisations which work with local authorities to address local health needs. PCTs are allocated 75 per cent of NHS Budget, and primarily provide and plan secondary care, which includes emergency ambulance services.
This decentralisation of health management is based on the premise that local organisations are in the best position to assess the needs of each community, and can best ensure the effective operation of health providers. 43 The Ambulance Paramedics of British Columbia 2002, A Review of the British Columbia Ambulance Service, March 2002, 28. 44 ibid., p.2. 45 Capitation is a method of payment for health services in which an individual or institutional provider is paid a fixed, per capita amount for each person served without regard to the actual number or nature of services provided to each person.
pwc Review of NSW Ambulance Service Funding Model
A Review of National and International Jurisdictions 27
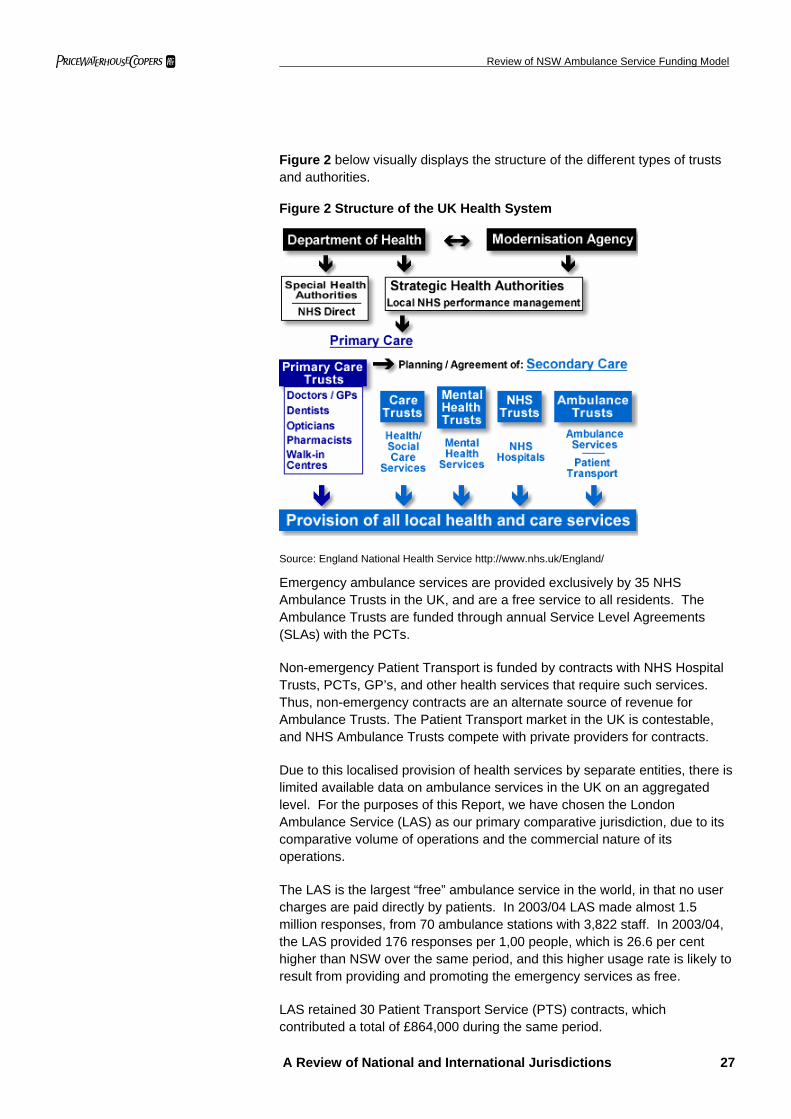
Figure 2 below visually displays the structure of the different types of trusts and authorities.
Figure 2 Structure of the UK Health System
Source: England National Health Service http://www.nhs.uk/England/
Emergency ambulance services are provided exclusively by 35 NHS Ambulance Trusts in the UK, and are a free service to all residents. The Ambulance Trusts are funded through annual Service Level Agreements (SLAs) with the PCTs.
Non-emergency Patient Transport is funded by contracts with NHS Hospital Trusts, PCTs, GP’s, and other health services that require such services. Thus, non-emergency contracts are an alternate source of revenue for Ambulance Trusts. The Patient Transport market in the UK is contestable, and NHS Ambulance Trusts compete with private providers for contracts.
Due to this localised provision of health services by separate entities, there is limited available data on ambulance services in the UK on an aggregated level. For the purposes of this Report, we have chosen the London Ambulance Service (LAS) as our primary comparative jurisdiction, due to its comparative volume of operations and the commercial nature of its operations.
The LAS is the largest “free” ambulance service in the world, in that no user charges are paid directly by patients. In 2003/04 LAS made almost 1.5 million responses, from 70 ambulance stations with 3,822 staff. In 2003/04, the LAS provided 176 responses per 1,00 people, which is 26.6 per cent higher than NSW over the same period, and this higher usage rate is likely to result from providing and promoting the emergency services as free.
LAS retained 30 Patient Transport Service (PTS) contracts, which contributed a total of £864,000 during the same period.
pwc Review of NSW Ambulance Service Funding Model
A Review of National and International Jurisdictions 28
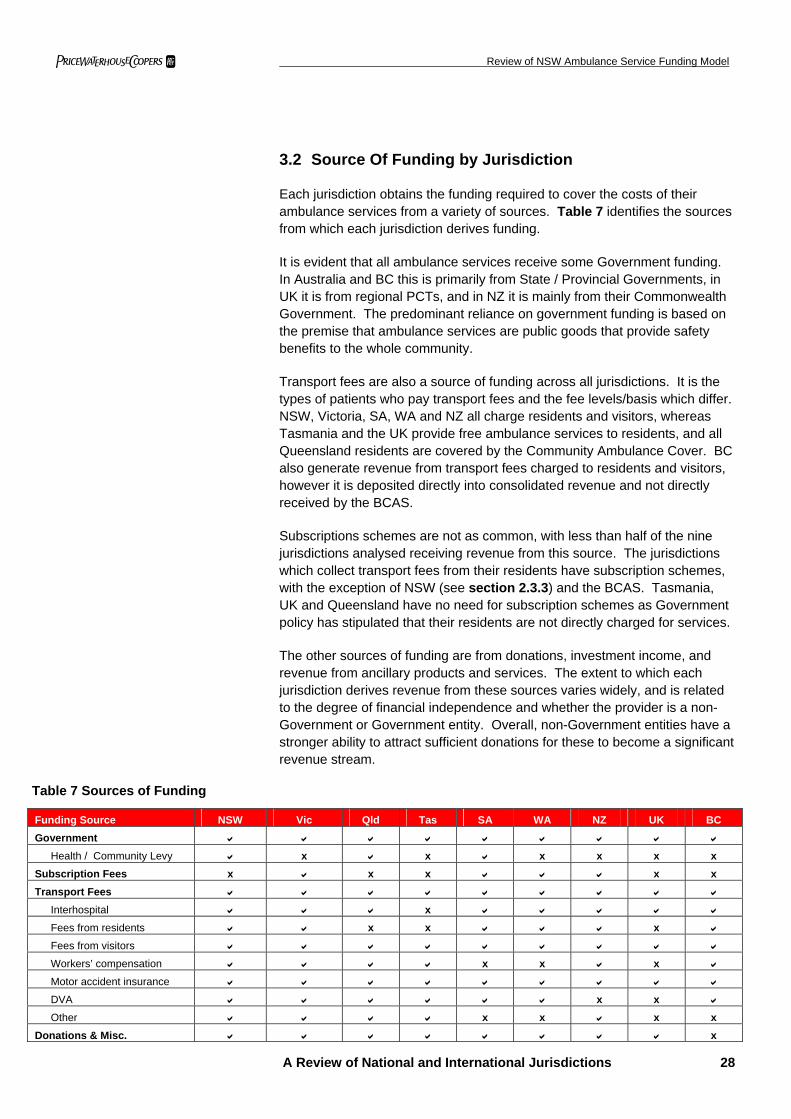
3.2 Source Of Funding by Jurisdiction
Each jurisdiction obtains the funding required to cover the costs of their ambulance services from a variety of sources. Table 7 identifies the sources from which each jurisdiction derives funding.
It is evident that all ambulance services receive some Government funding. In Australia and BC this is primarily from State / Provincial Governments, in UK it is from regional PCTs, and in NZ it is mainly from their Commonwealth Government. The predominant reliance on government funding is based on the premise that ambulance services are public goods that provide safety benefits to the whole community.
Transport fees are also a source of funding across all jurisdictions. It is the types of patients who pay transport fees and the fee levels/basis which differ. NSW, Victoria, SA, WA and NZ all charge residents and visitors, whereas Tasmania and the UK provide free ambulance services to residents, and all Queensland residents are covered by the Community Ambulance Cover. BC also generate revenue from transport fees charged to residents and visitors, however it is deposited directly into consolidated revenue and not directly received by the BCAS.
Subscriptions schemes are not as common, with less than half of the nine jurisdictions analysed receiving revenue from this source. The jurisdictions which collect transport fees from their residents have subscription schemes, with the exception of NSW (see section 2.3.3) and the BCAS. Tasmania, UK and Queensland have no need for subscription schemes as Government policy has stipulated that their residents are not directly charged for services.
The other sources of funding are from donations, investment income, and revenue from ancillary products and services. The extent to which each jurisdiction derives revenue from these sources varies widely, and is related to the degree of financial independence and whether the provider is a non-Government or Government entity. Overall, non-Government entities have a stronger ability to attract sufficient donations for these to become a significant revenue stream.
Table 7 Sources of Funding
Funding Source NSW Vic Qld Tas SA WA NZ UK BC Government
Health / Community Levy x x x x x x Subscription Fees x x x x x Transport Fees
Interhospital x
Fees from residents x x x Fees from visitors
Workers’ compensation x x x Motor accident insurance
DVA x x Other x x x x
Donations & Misc. x
Review of NSW Ambulance Service Funding Model
A Review of National and International Jurisdictions 29
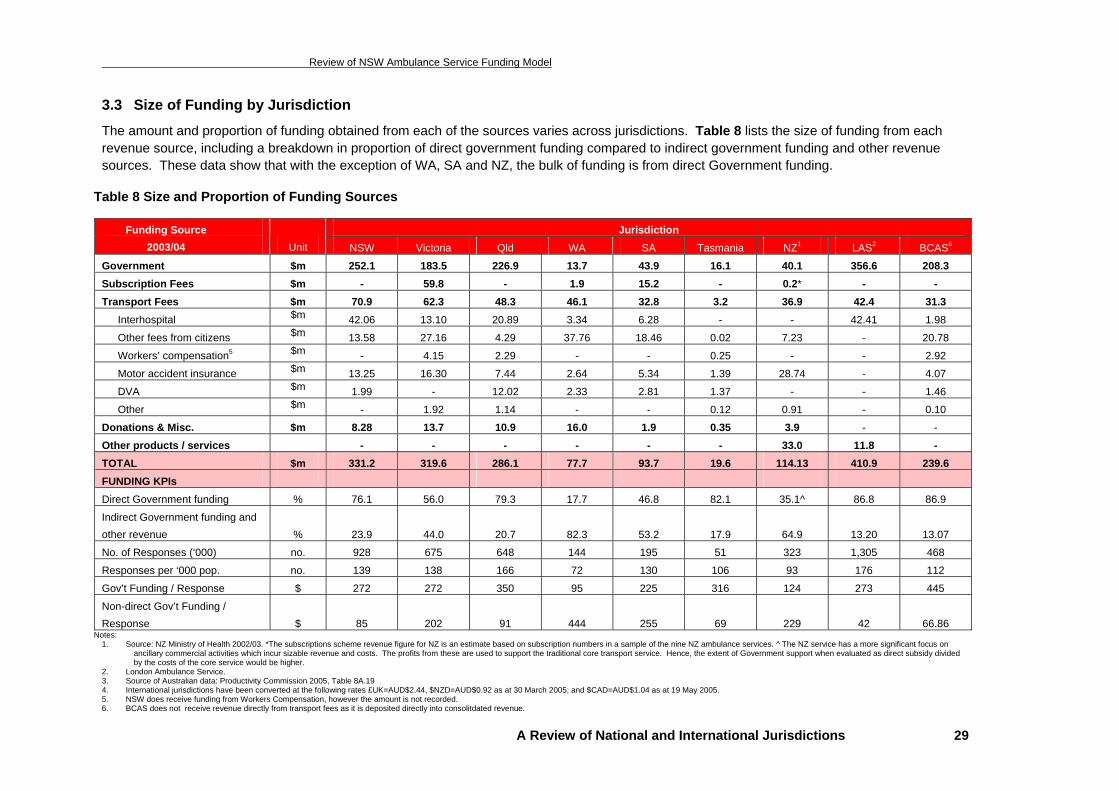
3.3 Size of Funding by Jurisdiction
The amount and proportion of funding obtained from each of the sources varies across jurisdictions. Table 8 lists the size of funding from each revenue source, including a breakdown in proportion of direct government funding compared to indirect government funding and other revenue sources. These data show that with the exception of WA, SA and NZ, the bulk of funding is from direct Government funding.
Table 8 Size and Proportion of Funding Sources
Notes: 1. Source: NZ Ministry of Health 2002/03. *The subscriptions scheme revenue figure for NZ is an estimate based on subscription numbers in a sample of the nine NZ ambulance services. ^ The NZ service has a more significant focus on
ancillary commercial activities which incur sizable revenue and costs. The profits from these are used to support the traditional core transport service. Hence, the extent of Government support when evaluated as direct subsidy divided by the costs of the core service would be higher.
2. London Ambulance Service. 3. Source of Australian data: Productivity Commission 2005, Table 8A.19 4. International jurisdictions have been converted at the following rates £UK=AUD$2.44, $NZD=AUD$0.92 as at 30 March 2005; and $CAD=AUD$1.04 as at 19 May 2005. 5. NSW does receive funding from Workers Compensation, however the amount is not recorded. 6. BCAS does not receive revenue directly from transport fees as it is deposited directly into consolitdated revenue.
Jurisdiction Funding Source 2003/04 Unit NSW Victoria Qld WA SA Tasmania NZ1 LAS2 BCAS6
Government $m 252.1 183.5 226.9 13.7 43.9 16.1 40.1 356.6 208.3 Subscription Fees $m - 59.8 - 1.9 15.2 - 0.2* - - Transport Fees $m 70.9 62.3 48.3 46.1 32.8 3.2 36.9 42.4 31.3
Interhospital $m 42.06 13.10 20.89 3.34 6.28 - - 42.41 1.98
Other fees from citizens $m 13.58 27.16 4.29 37.76 18.46 0.02 7.23 - 20.78
Workers’ compensation5 $m - 4.15 2.29 - - 0.25 - - 2.92
Motor accident insurance $m 13.25 16.30 7.44 2.64 5.34 1.39 28.74 - 4.07
DVA $m 1.99 - 12.02 2.33 2.81 1.37 - - 1.46
Other $m - 1.92 1.14 - - 0.12 0.91 - 0.10
Donations & Misc. $m 8.28 13.7 10.9 16.0 1.9 0.35 3.9 - -
Other products / services - - - - - - 33.0 11.8 - TOTAL $m 331.2 319.6 286.1 77.7 93.7 19.6 114.13 410.9 239.6
FUNDING KPIs Direct Government funding % 76.1 56.0 79.3 17.7 46.8 82.1 35.1^ 86.8 86.9
Indirect Government funding and other revenue % 23.9 44.0 20.7 82.3 53.2 17.9 64.9 13.20 13.07
No. of Responses (‘000) no. 928 675 648 144 195 51 323 1,305 468
Responses per ‘000 pop. no. 139 138 166 72 130 106 93 176 112
Gov’t Funding / Response $ 272 272 350 95 225 316 124 273 445
Non-direct Gov’t Funding / Response $ 85 202 91 444 255 69 229 42 66.86
pwc Review of NSW Ambulance Service Funding Model
A Review of National and International Jurisdictions 30
Some of the key funding model and operating characteristics illustrated in Table 8 include:
• Wide variation in the degree of dependence on direct Government subsidies from high dependence (NSW, Queensland, Tasmania, LAS and BCAS), to moderate dependence (Victoria, SA and NZ) to relatively lower dependence (WA). The smaller services with private or charitable sector operators generally have a lower reliance on government funding. This appears due to a combination of factors such as lower costs (eg more use of volunteers), a better ability to invoice and collect user charges and a stronger capacity to attract donations.
• Victoria, WA, SA, and NZ operate Subscription Schemes which generate a significant revenue stream. Such schemes often require exceptional marketing to become a significant revenue stream. This is due to the following factors, membership is voluntary, the private sector often has cheaper alternatives and (unlike private insurance) they do not have an ability to access a Commonwealth Government 30% rebate. Additionally, in NSW a substantial part of the likely subscription participant market is removed by the operation of the HIL which covers all residents with private health insurance for ambulance costs.
• The extent of costs recovered via transport charges varies significantly. A key factor is the level of exemptions provided. Tasmania, Queensland and London do not recover transport charges from residents with these costs being funded by their Government (in turn partially funded by the CAC in Queensland). NSW does not charge pensioners, health care card holders or people with private health insurance cover (the insured being funded via the separate HIL).
• Most jurisdictions (except Tasmania, BCAS and NZ) generate significant revenue from inter-hospital movements. Whilst such revenue streams arguably shift some of the Government subsidy requirement from ambulance services to public hospitals, inter-hospital charges provide an important market signal to ensure usage is contained to appropriate instances.
• Most jurisdictions generate some revenue streams from accident and/or workers compensation insurance providers. New Zealand has the greatest relative use of such revenue streams via charges to the ACC which comprise 21.4% of revenue.
• WA and New Zealand generate substantial donation revenue streams due to their better ability to attract such funding due to their operation by the St John’s organisation.
• New Zealand and to a lesser extent WA, generate significant revenue from ancillary services such as medical alarms and training courses which acts to reduce their reliance on direct Government funding.
• The level of responses (per 1,000 people) varies with relatively lower response rates recorded by the St John’s operated entities in WA and NZ of 72 and 93 per 1,000 people respectively. These lower rates may be due to a combination of a $50 co-payment in WA for non-emergency movements and a relatively lower level of service coverage. SA, Victoria and NSW have broadly similar responses per 1,000 residents (ranging from 130 to 141 per 1000 people).
pwc Review of NSW Ambulance Service Funding Model
A Review of National and International Jurisdictions 31
• Queensland and London have the highest response rate of (166 and 177 per 1,000 people respectively) which is likely to be mainly driven by not collecting user charges from patients, and its promotion as a free service in London.
• The direct Government funding per response is lowest in WA and NZ at $95 and $124 due to factors mentioned above. Other jurisdictions with Government operated services have higher direct government funding requirements. These range from $225 in SA, $272 in NSW and Victoria, to $416 per response in Queensland and $445 in BC. BCAS reported the highest government funding per response as they have the least diversified model of all jurisdictions. The BCAS relies on government capital and recurrent funding, with transport fees deposited directly into Treasury. The higher government funding cost in Queensland is mainly due to:
- The CAC funding being channelled via Government and reducing non-government revenue (with residents being exempt from direct charges); and
- The fixed cost nature of providing an extensive service network i.e. NSW and Queensland have a similar volume of resources, (NSW has 2,983 staff and 290 stations; and Queensland has 2,425 staff and 299 stations), however Queensland has 27 per cent less responses.
Review of NSW Ambulance Service Funding Model
A Review of National and International Jurisdictions 32
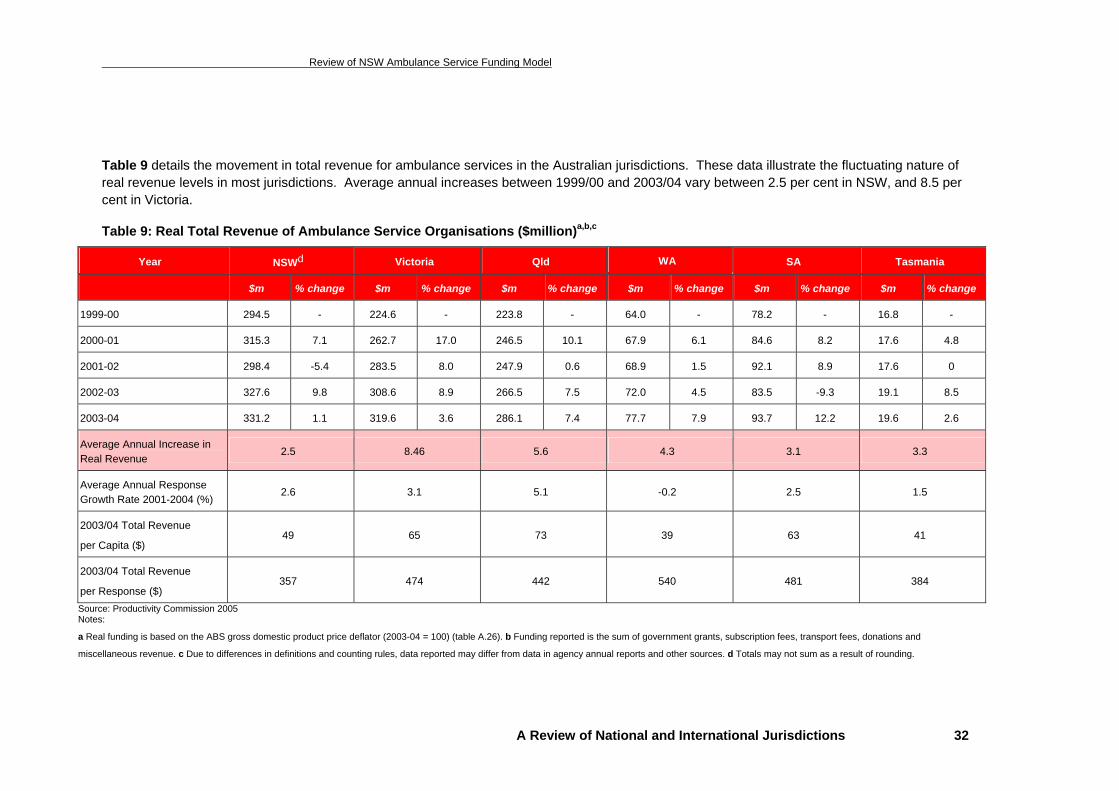
Table 9 details the movement in total revenue for ambulance services in the Australian jurisdictions. These data illustrate the fluctuating nature of real revenue levels in most jurisdictions. Average annual increases between 1999/00 and 2003/04 vary between 2.5 per cent in NSW, and 8.5 per cent in Victoria.
Table 9: Real Total Revenue of Ambulance Service Organisations ($million)a,b,c
Year NSWd Victoria Qld WA SA Tasmania
$m % change $m % change $m % change $m % change $m % change $m % change
1999-00 294.5 - 224.6 - 223.8 - 64.0 - 78.2 - 16.8 -
2000-01 315.3 7.1 262.7 17.0 246.5 10.1 67.9 6.1 84.6 8.2 17.6 4.8
2001-02 298.4 -5.4 283.5 8.0 247.9 0.6 68.9 1.5 92.1 8.9 17.6 0
2002-03 327.6 9.8 308.6 8.9 266.5 7.5 72.0 4.5 83.5 -9.3 19.1 8.5
2003-04 331.2 1.1 319.6 3.6 286.1 7.4 77.7 7.9 93.7 12.2 19.6 2.6
Average Annual Increase in Real Revenue
2.5 8.46 5.6 4.3 3.1 3.3
Average Annual Response Growth Rate 2001-2004 (%)
2.6 3.1 5.1 -0.2 2.5 1.5
2003/04 Total Revenue
per Capita ($) 49 65 73 39 63 41
2003/04 Total Revenue
per Response ($) 357 474 442 540 481 384
Source: Productivity Commission 2005 Notes:
a Real funding is based on the ABS gross domestic product price deflator (2003-04 = 100) (table A.26). b Funding reported is the sum of government grants, subscription fees, transport fees, donations and
miscellaneous revenue. c Due to differences in definitions and counting rules, data reported may differ from data in agency annual reports and other sources. d Totals may not sum as a result of rounding.
pwc Review of NSW Ambulance Service Funding Model
A Review of National and International Jurisdictions 33
The key funding model trends over the past five years in the six Australia states being considered (as illustrated in Table 9) include:
• Cost growth creating a need for real rises in total revenue. NSW recorded the lowest real rise in total revenue of 2.5% pa whilst Victoria has had the largest rise in real total revenue averaging 8.5% pa.
• Some significant year to year variability in total revenue due to changes in funding approaches, rising demand and the need to increase capacity with subsequent rises in operating costs.
• Average annual response growth of between -0.2% (WA) and 5.1% (Vic). The simple 5 year annual average across the six states is 2.4%. The demand moderation in WA being mainly due to the introduction of a universal $50 co-payment for all non-emergency movements.
• Total revenue by ambulance service per capita for 2003/04 varies from:
- A low of $39 in WA achieved by a combination of a more efficient cost operation and lower response rates.
- A high of $73 per capita in Queensland (due to factors discussed in the text following Table 8).
• Total revenue by ambulance service per response for 2003/04 varies from a low of $357 in NSW to a high of $540 per response in WA. The key drivers in the NSW result are potentially a combination of some economies of scale and relatively higher response rate.
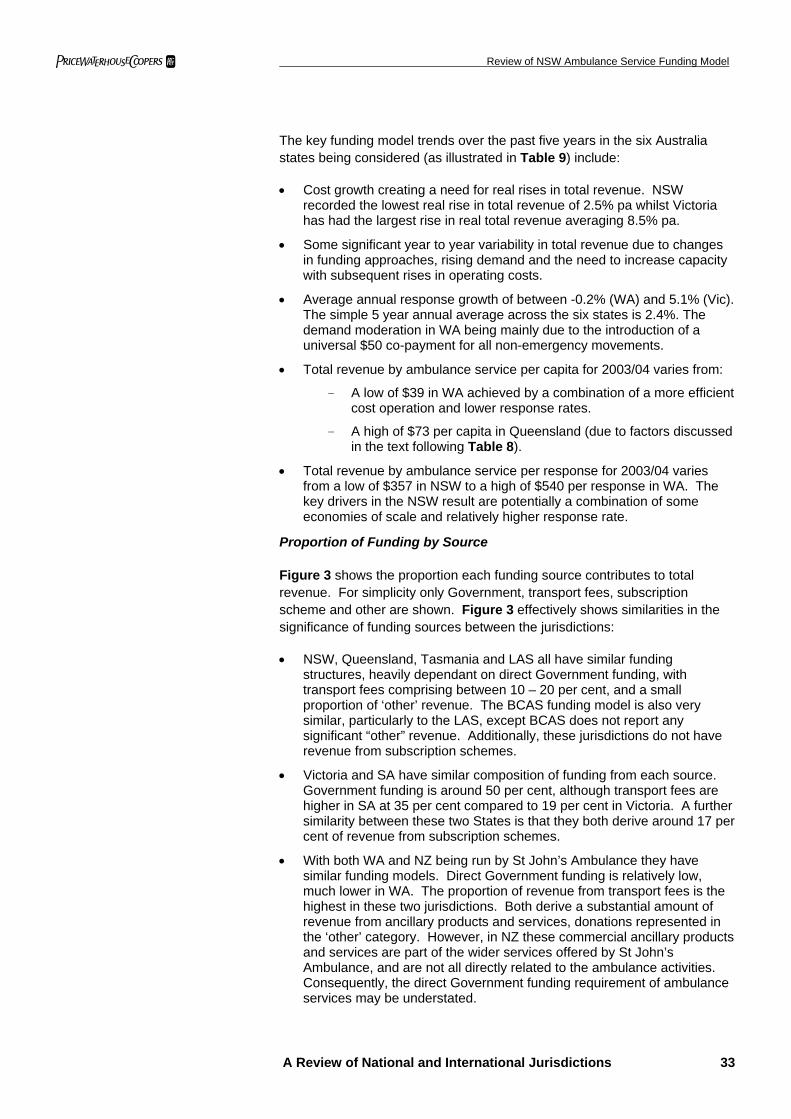
Proportion of Funding by Source
Figure 3 shows the proportion each funding source contributes to total revenue. For simplicity only Government, transport fees, subscription scheme and other are shown. Figure 3 effectively shows similarities in the significance of funding sources between the jurisdictions:
• NSW, Queensland, Tasmania and LAS all have similar funding structures, heavily dependant on direct Government funding, with transport fees comprising between 10 – 20 per cent, and a small proportion of ‘other’ revenue. The BCAS funding model is also very similar, particularly to the LAS, except BCAS does not report any significant “other” revenue. Additionally, these jurisdictions do not have revenue from subscription schemes.
• Victoria and SA have similar composition of funding from each source. Government funding is around 50 per cent, although transport fees are higher in SA at 35 per cent compared to 19 per cent in Victoria. A further similarity between these two States is that they both derive around 17 per cent of revenue from subscription schemes.
• With both WA and NZ being run by St John’s Ambulance they have similar funding models. Direct Government funding is relatively low, much lower in WA. The proportion of revenue from transport fees is the highest in these two jurisdictions. Both derive a substantial amount of revenue from ancillary products and services, donations represented in the ‘other’ category. However, in NZ these commercial ancillary products and services are part of the wider services offered by St John’s Ambulance, and are not all directly related to the ambulance activities. Consequently, the direct Government funding requirement of ambulance services may be understated.
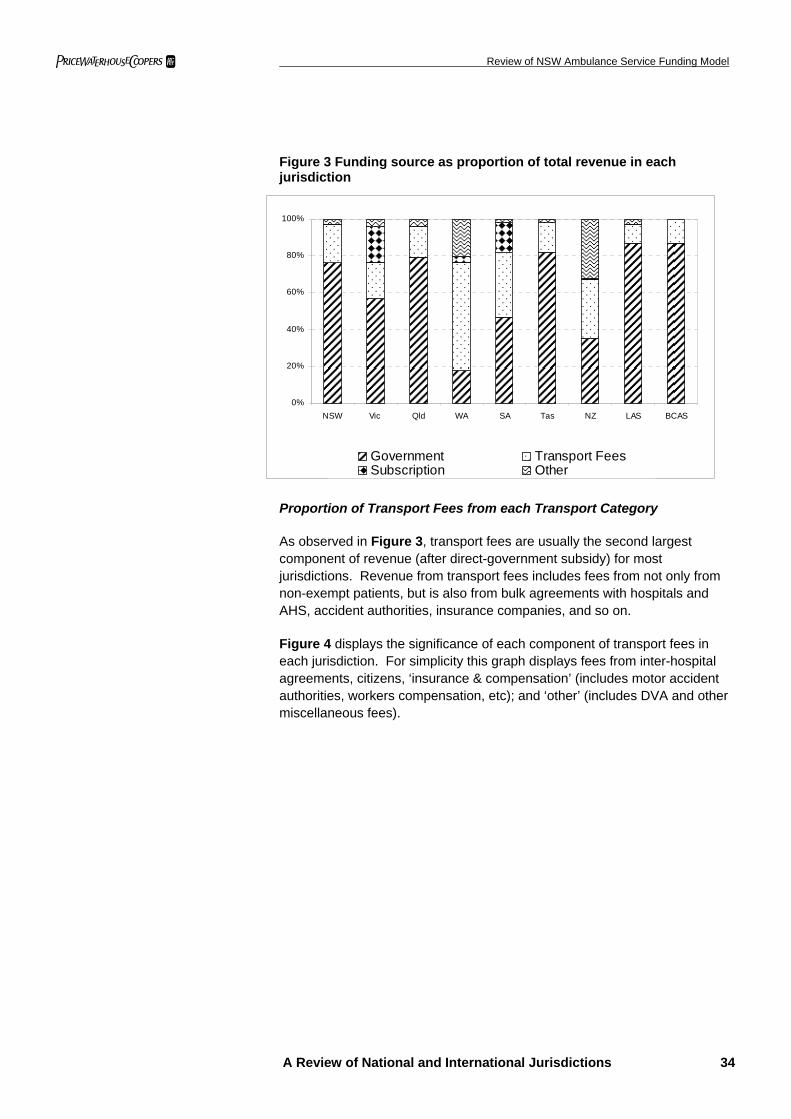
pwc Review of NSW Ambulance Service Funding Model
A Review of National and International Jurisdictions 34
Figure 3 Funding source as proportion of total revenue in each jurisdiction
0%
20%
40%
60%
80%
100%
NSW Vic Qld WA SA Tas NZ LAS BCAS
Government Transport FeesSubscription Other
Proportion of Transport Fees from each Transport Category
As observed in Figure 3, transport fees are usually the second largest component of revenue (after direct-government subsidy) for most jurisdictions. Revenue from transport fees includes fees from not only from non-exempt patients, but is also from bulk agreements with hospitals and AHS, accident authorities, insurance companies, and so on.
Figure 4 displays the significance of each component of transport fees in each jurisdiction. For simplicity this graph displays fees from inter-hospital agreements, citizens, ‘insurance & compensation’ (includes motor accident authorities, workers compensation, etc); and ‘other’ (includes DVA and other miscellaneous fees).
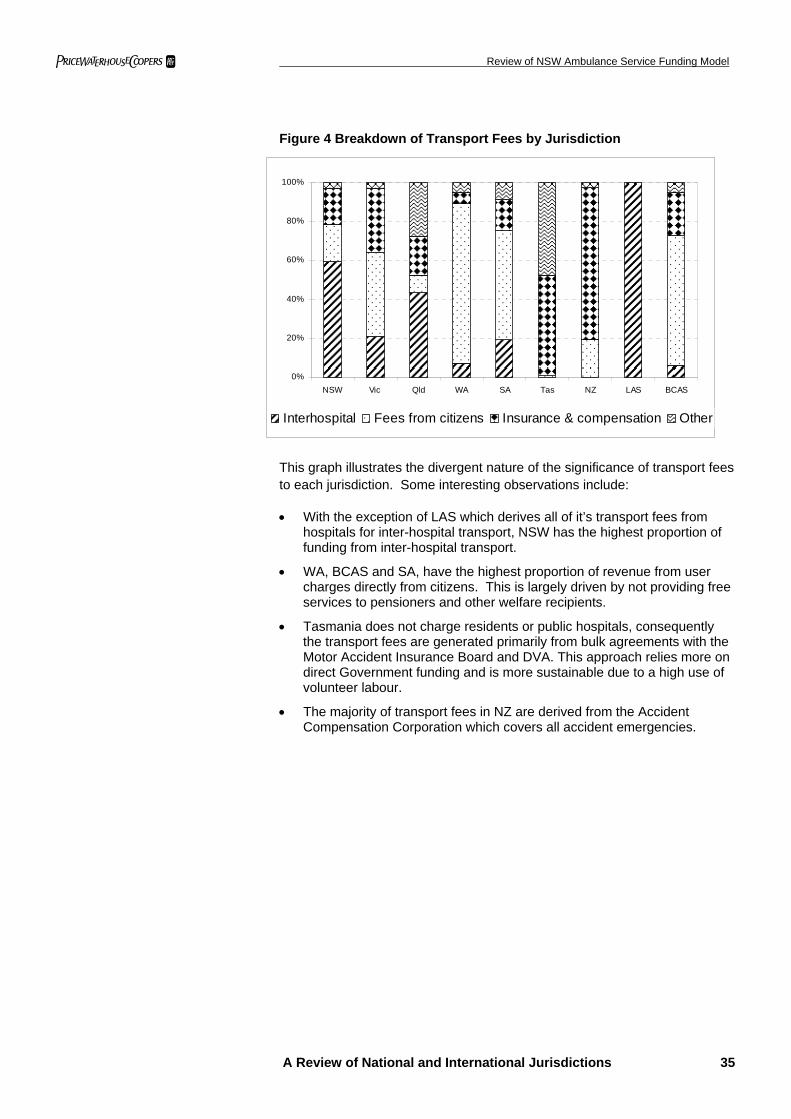
pwc Review of NSW Ambulance Service Funding Model
A Review of National and International Jurisdictions 35
Figure 4 Breakdown of Transport Fees by Jurisdiction
0%
20%
40%
60%
80%
100%
NSW Vic Qld WA SA Tas NZ LAS BCAS
Interhospital Fees from citizens Insurance & compensation Other
This graph illustrates the divergent nature of the significance of transport fees to each jurisdiction. Some interesting observations include:
• With the exception of LAS which derives all of it’s transport fees from hospitals for inter-hospital transport, NSW has the highest proportion of funding from inter-hospital transport.
• WA, BCAS and SA, have the highest proportion of revenue from user charges directly from citizens. This is largely driven by not providing free services to pensioners and other welfare recipients.
• Tasmania does not charge residents or public hospitals, consequently the transport fees are generated primarily from bulk agreements with the Motor Accident Insurance Board and DVA. This approach relies more on direct Government funding and is more sustainable due to a high use of volunteer labour.
• The majority of transport fees in NZ are derived from the Accident Compensation Corporation which covers all accident emergencies.
pwc Review of NSW Ambulance Service Funding Model
A Review of National and International Jurisdictions 36
3.4 Nature of Funding by Jurisdiction
3.3.1 Government
Ambulance services in each of the nine jurisdictions derive a significant proportion of revenue from direct Government funding. The nature of this funding depends on whether the provider is a General Government Entity (GGE) or a non-government entity. The funding arrangements for GGEs can fall into the following categories:
• budget dependent: funded either by taxation or appropriations. Any amount not spent within the year is returned to Treasury; e.g. NSW Health; or
• non-budget dependent: are generally a little more financially self-sufficient and do not receive a direct appropriation but may instead receive a Community Service Obligation (CSO) via a GGE budget dependent agency, e.g. Department of Housing; or
• public trading enterprises (PTEs): are a further category of government agency which covers government owned business and state owned corporations.
Non-Government or private (eg St John’s) entities generally contract with the Government to provide emergency services. This can either be on a case basis, historical funding, or a mixture of the two, such as case-mix funding.
Budget Dependent GGE’s
Services in NSW, Queensland, Tasmania and SA are all budget dependent GGE’s. Generally, the Budget Committee of Cabinet in these states individually reviews and approves recurrent, capital spending and appropriations from State Treasury consolidated funds to each respective Health / Emergency Services portfolio. Generally, the Government will outline a broad strategy and policy direction, and will only allocate specific funds for particular ambulance initiatives, such as for programs to increase the number of ambulance officers in rural areas. Thus, each Health / Emergency Services Ministerial portfolio determines the specific appropriation to the ambulance services which is based on a deficit funding approach.
The institutional arrangements of the BCAS reflect the Australian budget dependent GGE’s. The BCAS operates as a branch of the Emergency Health Services Commission. The BCAS received recurrent and capital allocations from the Ministry of Health. The ambulance service in BC ambulance service is one of the few health services delivered by the Ministry of Health, with the majority of other services delivered by Health Authorities and “partners.”46
46 Ministry of Health Services 2003/04 Annual Service Plan Report, p.13.
pwc Review of NSW Ambulance Service Funding Model
A Review of National and International Jurisdictions 37
PTE’s
The MAS and RAV in Victoria are Statutory Government owned corporations, and are categorised as PTE’s. They are funded through three year Service Agreements, which were introduced in 2003-04. The Service Agreements make clear distinctions between:
• base funding;
• funding for new services and growth funding; and
• adjustments to funding for wages, CPI and productivity improvements.
Through these Service Agreements, RAV and MAS receive recurrent funding, which meets a proportion of their costs and an annual allocation for capital projects. The budget allocation reflects the total accrual cost of the program, including new government initiatives, depreciation, capital charge and provision for leave accruals.
This arrangement allows surplus accumulation which enables greater flexibility to manage pressures and risks over the three year life of the agreement. In 2003/04, the Victorian Ambulance Services both recorded an operating surplus, $1.2 million for MAS,47 and $9.6 million for RAV.48
MAS and RAV have financial objectives for each three year period. For 2003-06 the financial objectives are49:
• maintenance of a current asset ratio50 of at least 0.7;
• maintenance of an accrual break-even or surplus position, after exclusion of capital income and depreciation; and
• a trade creditors ratio51 of 2.0
Government funding arrangements for Ambulance Trusts in the UK are very similar to Victoria. Each Ambulance Trust develops Service Level Agreements for emergency services with PCTs. Unlike budget dependent entities, Service Level Agreements can be performance based, and Ambulance Trusts in the UK which meet the required ‘star rating’ can be eligible for increased funding.
In addition to the Service Level Agreements, the Department of Health provides a capital allocation to the Ambulance Trusts each year. In 2001/02 this capital allocation totalled £9 million.52
Similar to the financial objectives in Victoria, the UK Department of Health has specific financial statutory duties which it imposes on all NHS Trusts, which include:
47 MAS 2004, Metropolitan Ambulance Service Annual Report 2003/04, p.59 48 RAV 2004, Rural Ambulance Service Annual Report 2003/04, p. 12 49 Department of Human Services 2003, Ambulance Service policy and Funding Guidelines 2003-2006, p18. 50 current asset ratio = current assets / current liabilities 51 trade creditors ratio = ((Notes payable + Trade liabilities) x 360) / Sales 52 UK Department of Health, Departmental Report 2004, April 2004.
pwc Review of NSW Ambulance Service Funding Model
A Review of National and International Jurisdictions 38
• to break even on an income and expenditure basis;
• to absorb the cost of capital at a rate of 6% of average relevant net assets;
• a duty under resource accounting and budgeting to break even each and every year;
• to remain within the Capital Resource Limit (CRL) set for each NHS Trust by the Department of Health; and
• to remain within the External Financing Limit (EFL) set for each NHS Trust by the Department of Health.53
Therefore, Ambulance Trusts need to ensure that they maintain effective cost accounting in order to meet these statutory financial duties, which differs considerably from the current deficit funding in NSW. In 2003/04 the LAS met only three of these statutory duties.
Non-Government Entities
Ambulance services in WA and NZ are primarily provided by St John’s Ambulance which is a non-government entity. Government funding in these jurisdictions is provided on a contractual basis to fund emergency ambulance services. St John’s WA have recently entered into a new service agreement with the WA Department of Health which has increased funding support in order to increase services, and has introduced case related payment into the contract. WA is the only jurisdiction being examined in which Government funding has not increased as a proportion of total revenue. Between 1999/00 and 2003/04 Government funding actually decreased by a total of 22 per cent as a proportion of total revenue.
In NZ, each road and air ambulance provider contracts with the Ministry of Health, the ACC and DHBs to provide the following three categories of ambulance services:
• Accident emergency: is covered by the Accident Compensation Corporation (ACC), which has bulk agreements with each road and air ambulance provider with a set fee for each claimant transported. The ACC is a Crown entity which provides ‘no-fault’ coverage for personal injury for all NZ citizens, residents and temporary visitors to NZ. In exchange, there is no right to sue for personal injury damages.
• Non-accident (medical) emergency: The Ministry of Health contracts with each road and ambulance service provider for a set amount which nominally represents the non-accident case share of the capacity required to respond to emergencies, inclusive of necessary air ambulance responses.
• Inter-hospital transfers: Are the responsibility of health agencies, primarily the DHBs, however the Ministry of Health contracts for transfers by road in some areas.
Road and air ambulance providers argue that entirely fee-for-service arrangements conflicts with their need to maintain a capacity to respond without the certainty of revenue.54 53 UK Department of Health 2004, Departmental Report 2004, p.105
pwc Review of NSW Ambulance Service Funding Model
A Review of National and International Jurisdictions 39
3.3.2 Transport Fees
Ambulance services are usually free for patients who are:
• members of subscription schemes or private health insurance;
• injured in transport or workplace accidents;
• transported between hospitals; or
• primarily health care holders (e.g. people dependent on Government welfare payments).
In most jurisdictions, patients who do not fall within these exempt categories are directly invoiced. The method for calculating the direct charge varies considerably. Most services average the costs between rural and metropolitan regions, but differentiate between emergency and non-emergency. Each jurisdiction has a different combination of fixed and variable fees, which could be distance or time based.
An appraisal of whether distance or time is a more reflective measure of how variable costs change depends on the extent to which labour costs vary for longer or most complex incidents. If labour costs generally do not rise, then the additional costs are contained mainly to vehicle utilisation and running costs which makes distance travelled a reasonable proxy for quantifying variable costs. However, if longer responses often result in overtime payments or other labour allowances then an excess waiting time charge could be appropriate. This would improve incentives to ensure a timely handover and acceptance of patients at health facilities to enable Service officers to move on to servicing their next allocated job. As overtime is a significant cost for the Service, there may be merit in considering a combination of a distance charge plus an excess waiting time charge to as to improve the cost reflectivity of charges.
Table 10 details the fees charged in each jurisdiction for emergency and non-emergency primary response transport. It can be seen that with the exception of NZ and BCAS, the majority of user charges are higher in all other jurisdictions, for both emergency and non-emergency services in comparison to NSW.
54 NZ Ministry of Health 2004, Ambulance Services Sustainable Funding Review, Wellington, pp.24-25.
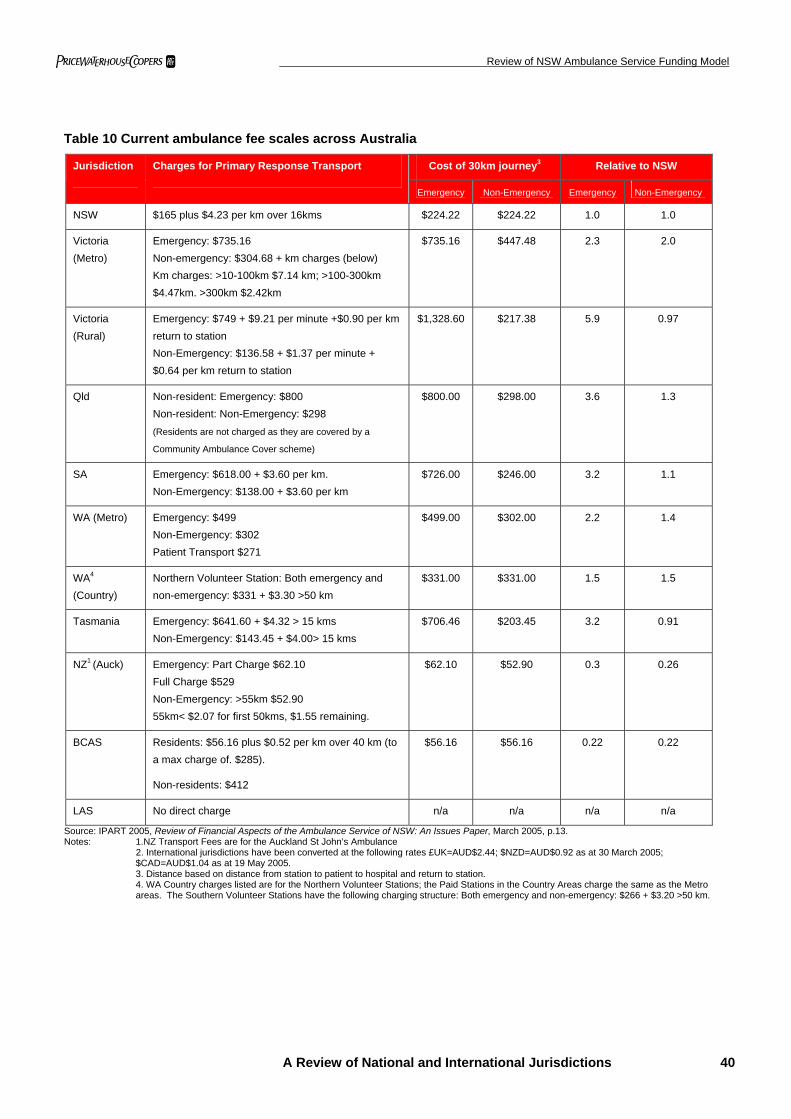
pwc Review of NSW Ambulance Service Funding Model
A Review of National and International Jurisdictions 40
Table 10 Current ambulance fee scales across Australia
Cost of 30km journey3 Relative to NSW Jurisdiction Charges for Primary Response Transport
Emergency Non-Emergency Emergency Non-Emergency
NSW $165 plus $4.23 per km over 16kms $224.22 $224.22 1.0 1.0
Victoria (Metro)
Emergency: $735.16 Non-emergency: $304.68 + km charges (below) Km charges: >10-100km $7.14 km; >100-300km $4.47km. >300km $2.42km
$735.16 $447.48 2.3 2.0
Victoria (Rural)
Emergency: $749 + $9.21 per minute +$0.90 per km return to station Non-Emergency: $136.58 + $1.37 per minute + $0.64 per km return to station
$1,328.60 $217.38 5.9 0.97
Qld Non-resident: Emergency: $800 Non-resident: Non-Emergency: $298 (Residents are not charged as they are covered by a
Community Ambulance Cover scheme)
$800.00 $298.00 3.6 1.3
SA Emergency: $618.00 + $3.60 per km. Non-Emergency: $138.00 + $3.60 per km
$726.00 $246.00 3.2 1.1
WA (Metro) Emergency: $499 Non-Emergency: $302 Patient Transport $271
$499.00 $302.00 2.2 1.4
WA4 (Country)
Northern Volunteer Station: Both emergency and non-emergency: $331 + $3.30 >50 km
$331.00 $331.00 1.5 1.5
Tasmania Emergency: $641.60 + $4.32 > 15 kms Non-Emergency: $143.45 + $4.00> 15 kms
$706.46 $203.45 3.2 0.91
NZ1 (Auck) Emergency: Part Charge $62.10 Full Charge $529 Non-Emergency: >55km $52.90 55km< $2.07 for first 50kms, $1.55 remaining.
$62.10 $52.90 0.3 0.26
BCAS Residents: $56.16 plus $0.52 per km over 40 km (to a max charge of. $285).
Non-residents: $412
$56.16 $56.16 0.22 0.22
LAS No direct charge n/a n/a n/a n/a
Source: IPART 2005, Review of Financial Aspects of the Ambulance Service of NSW: An Issues Paper, March 2005, p.13. Notes: 1.NZ Transport Fees are for the Auckland St John’s Ambulance
2. International jurisdictions have been converted at the following rates £UK=AUD$2.44; $NZD=AUD$0.92 as at 30 March 2005; $CAD=AUD$1.04 as at 19 May 2005.
3. Distance based on distance from station to patient to hospital and return to station. 4. WA Country charges listed are for the Northern Volunteer Stations; the Paid Stations in the Country Areas charge the same as the Metro areas. The Southern Volunteer Stations have the following charging structure: Both emergency and non-emergency: $266 + $3.20 >50 km.
pwc Review of NSW Ambulance Service Funding Model
A Review of National and International Jurisdictions 41
User Charge Exemptions
Of particular interest is to whom these transport fees apply to which people are exempt. Categories of patients who are exempt from direct user charges in NSW are listed in section 2.3.2.
Neither WA, SA or BCAS provide free services to pensioners or health care card holders. As pensioners are typically more frequent users of ambulance services, this will significantly increase the pool of chargeable patients. In SA, this appears to have encouraged increased subscription membership, however this is not reflected in WA (see section 3.3.3). In BC, low income residents, including welfare recipients can have their fee charges forgiven. In 2004/05, approximately $2.8 million of ambulance fees for forgiven in such instances.55
Residents in Queensland are covered by the CAC, it is non-residents who are charged the transport fees listed in Table 10. The user charges in Queensland are one of the highest rates of the analysed jurisdictions, with a flat rate emergency charge of $800.
Tasmania and the UK provide free ambulance services to all residents. Tasmania charge interstate and international visitors to the State who do not have insurance cover and a number of public entities with which TAS has bulk agreements.
User charges for the St John’s Ambulance Service in NZ are referred to as ‘part charges’ and differ throughout the country due to disparate funding arrangements. These part charges are relatively low and represent a nominal contribution to operation expenses. International patients who are not from Commonwealth countries with reciprocal agreements, or other insurance agreements, are charged the ‘full charge’. The quoted fees are for the Auckland St John’s Ambulance, which has the highest user charges in the country.
Treat and Not Transport
Treat-not-transport (TNT) refers to situations where an ambulance responds to a call where the patient requires treatment but is not transported to hospital. In 2003/04, 100,900 patients or 11 per cent of responses in NSW fell into the TNT category.56 NSW does not charge these patients, but estimates that the notional value of TNT services in 2003/04 was almost $8 million based on the existing distance fee only, or $16 million if only the current flagfall of $165 was also charged.
55 Communications with the BCAS. 56 IPART 2005, Review of Financial Aspects of the Ambulance Service of NSW: An Issues Paper, March 2005, p.14.
pwc Review of NSW Ambulance Service Funding Model
A Review of National and International Jurisdictions 42
All other Australian jurisdictions analysed, BCAS and NZ charged a fee for TNT services.
• Victoria charge a flat $221;
• South Australia charge a flat $466;
• Queensland charge the greater of $84 or $11.55 per km up to a maximum of $800;
• WA Metro charge $499 for a call classified as an emergency (priority 1 and 2); and $302 for a call classified as a non-emergency (priority 3);
• Tasmania charge $442.97 plus $4.32 for each kilometre travelled above 15 kms;
• BCAS charge $5057 when an ambulance responds to a call and treatment and / or transportation are refused; and
• St John’s Ambulance NZ charge the flat part charge rate, which is $67.50 in Auckland.
It is important to note that for the jurisdictions which list a distance based TNT charge, the patient is charged for the distance to the site and back to the station.
There could also be some merit in introducing fines for pranks or obvious frivolous misuse of the Service in order to discourage such behaviour. Whilst such behaviour is not common, it can endanger other lives and it also incurs some costs.
Bad and doubtful debts
Bad and doubtful debts normally result from refusal by end patients to pay transport invoices. People often assume ambulance services are, or should be, covered by Medicare, and hence refuse to pay. Increases in fees or the number of non-exempt patients will inevitably increase the number of doubtful debts.
For the entire Queensland Department of Emergency Services, bad debts as a proportion of total transport fees were 14 per cent in 2002/03. However, following the introduction of the CAC this decreased to 9.3 per cent in 2003/04.58 Similarly, Productivity Commission data indicates that revenue from transport fees in Tasmania increased by 1.2 per cent between 2003/04, however bad debts as a proportion of transport fees increased by 5.9 per cent over the same period.59 This indicates that changes to the collection of transport fees can have a significant impact upon bad and doubtful debts.
57 This is approximately AUD$52; based on $CAD = AUD$1.04 at 18 May 2005. 58 Queensland Department of Emergency Services 2004, Annual Report 2003/04, p.108. 59 Tas Department of Health and Human Services 2004, Annual Report 2003/04, p.133; and Productivity Commission 2005, Report of Government Services 2005, Table 8A.19
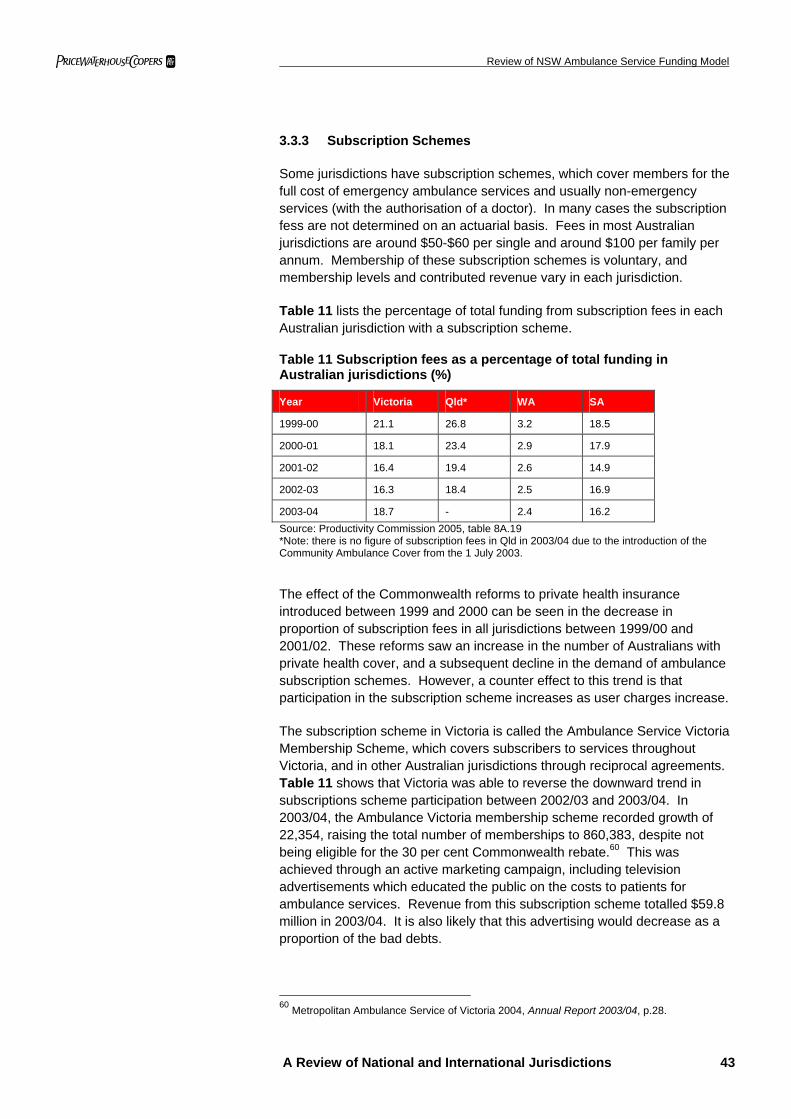
pwc Review of NSW Ambulance Service Funding Model
A Review of National and International Jurisdictions 43
3.3.3 Subscription Schemes
Some jurisdictions have subscription schemes, which cover members for the full cost of emergency ambulance services and usually non-emergency services (with the authorisation of a doctor). In many cases the subscription fess are not determined on an actuarial basis. Fees in most Australian jurisdictions are around $50-$60 per single and around $100 per family per annum. Membership of these subscription schemes is voluntary, and membership levels and contributed revenue vary in each jurisdiction.
Table 11 lists the percentage of total funding from subscription fees in each Australian jurisdiction with a subscription scheme.
Table 11 Subscription fees as a percentage of total funding in Australian jurisdictions (%)
Year Victoria Qld* WA SA
1999-00 21.1 26.8 3.2 18.5
2000-01 18.1 23.4 2.9 17.9
2001-02 16.4 19.4 2.6 14.9
2002-03 16.3 18.4 2.5 16.9
2003-04 18.7 - 2.4 16.2 Source: Productivity Commission 2005, table 8A.19 *Note: there is no figure of subscription fees in Qld in 2003/04 due to the introduction of the Community Ambulance Cover from the 1 July 2003.
The effect of the Commonwealth reforms to private health insurance introduced between 1999 and 2000 can be seen in the decrease in proportion of subscription fees in all jurisdictions between 1999/00 and 2001/02. These reforms saw an increase in the number of Australians with private health cover, and a subsequent decline in the demand of ambulance subscription schemes. However, a counter effect to this trend is that participation in the subscription scheme increases as user charges increase.
The subscription scheme in Victoria is called the Ambulance Service Victoria Membership Scheme, which covers subscribers to services throughout Victoria, and in other Australian jurisdictions through reciprocal agreements. Table 11 shows that Victoria was able to reverse the downward trend in subscriptions scheme participation between 2002/03 and 2003/04. In 2003/04, the Ambulance Victoria membership scheme recorded growth of 22,354, raising the total number of memberships to 860,383, despite not being eligible for the 30 per cent Commonwealth rebate.60 This was achieved through an active marketing campaign, including television advertisements which educated the public on the costs to patients for ambulance services. Revenue from this subscription scheme totalled $59.8 million in 2003/04. It is also likely that this advertising would decrease as a proportion of the bad debts.
60 Metropolitan Ambulance Service of Victoria 2004, Annual Report 2003/04, p.28.
pwc Review of NSW Ambulance Service Funding Model
A Review of National and International Jurisdictions 44
In Victoria 17.6 per cent of the population are covered by the subscription scheme, 43.2 per cent have private health cover, and 23.7 per cent are exempt (on income support). Therefore, this implies that only 15.5 per cent of the population are eligible to be directly invoiced for ambulance services.
The relatively high subscription rate is of interest because the subscription scheme is more expensive at $55 for singles and $110 for families per year, in comparison to Ambulance only cover in Victoria which is $23.20 for singles and $46.40 for families.61 In December 2004, only 9,347 people were covered by Ambulance Only cover.62 One of the primary reasons for this trend is because in Victoria, patients who have private health cover must pay the invoice, and then obtain a rebate from the health insurer. Whereas in NSW, all people with private health insurance are exempt from payment due to the HIL.
In WA, there are two separate subscription schemes for metropolitan and rural areas. Members of both subscription schemes are covered for ambulance services throughout WA. The metropolitan scheme, formerly operated by St John Ambulance, has been administered by private health insurers HBF since 1997. All emergency ambulance services are covered by this scheme, however all members are charged a $50 co-payment for using non-emergency transport.
St John Sub Centres administer the country subscription scheme in WA called the St John Country Ambulance cover. Country Ambulance cover is only available for country residents that live in particular country areas, but covers members for ambulance services within WA. There is no co-payment required for non-emergency transport. These funds go directly to local ambulance centres. However, WA only recorded receiving $1.9 million from both subscription schemes.
For ambulance providers in NZ, subscription schemes provide a minimal amount of funding, to both the non-government and government ambulance operators. The schemes cover members for the part charges, which only represent a nominal contribution to the operating costs. There appears to be greater use in rural areas.
St John’s Ambulance in NZ has the Supporters Scheme that is more a subscription plan to support the wider services and activities of St John’s Ambulance, which also provides coverage for ambulance services. In other words, St John’s market the Supporters Scheme as charitable contribution, which as an subsidiary benefit covers members for use of ambulance services.
61 MBF Rate https://www.mbf.com.au/main/products/ambulance/ at 30 March 2005. 62 Private Health Insurance Administration Council 2004, PHIAC A Victoria Report, p.3
pwc Review of NSW Ambulance Service Funding Model
A Review of National and International Jurisdictions 45
Tasmania and the UK do not charge patients for transport fees, and hence do not have any use for a subscription scheme. The BCAS, only charge residents nominal ambulance fees, that amounts to 22 per cent of the amount charged in NSW for a similar 30km journey (see Table 10). Due to these low ambulance fees, and the fact that low income residents can have their ambulance fees forgiven, there does not appear to be a need for a subscription scheme.
Queensland no longer receives revenue from a subscription scheme, as it was replaced by the introduction of the Community Ambulance Cover, which is discussed in detail below in section 3.3.4.
3.3.4 Universal Ambulance Levy Applied to All Residents Quarterly
Queensland is the only jurisdiction which has a State wide levy to fund ambulance services. The Community Ambulance Cover (CAC) replaced the Queensland Ambulance Service Subscription Scheme on 1 July 2003. A charge now applies to business and residential electricity accounts, which is collected by electricity retailers and suppliers on behalf of the Government. From 1 July 2004, the levy applied is 24.712 cents a day or $90.20 over the year, unless an exemption has been obtained.
Each electricity bill only pays one levy, regardless of the number of people who live in each household. Hence, arguably single person households paying $90 is an inequitably higher amount in comparison to say the cost of Ambulance Only private cove in Victoria of $23. The CAC levy applies to separate areas in a building able to receive on-supplied electricity unless the occupant is exempt.
The CAC generated $92 million in 2003/04, which is budgeted to increase to $104 million in 2004/05.63 This 13 per cent growth forecast in 2004-05 reflects a full-year collection of the Cover, CPI adjustment and growth of non-exempt electricity accounts. Clearly, this will not fully fund the QAS which required $286.1 million in total funding in 2003/04, however it will ease the degree of reliance on direct Government funding. Revenue from the scheme is provided to the Queensland Department of Human Services through Parliamentary appropriation from Consolidated Revenue.
The Cover is a broad-based charge that aims to spread the cost of providing ambulance services across the community. It is not a direct user-pays system as every Queenslander is automatically covered for the cost of emergency ambulance services nationwide. QAS has negotiated individual fees for service contracts with entities that are not specified within the CAC.
63 Queensland Government 2004, Budget Strategy and Outlook: Budget Paper No. 2, p.79
pwc Review of NSW Ambulance Service Funding Model
A Review of National and International Jurisdictions 46
The Queensland Government’s initial preference for this community scheme was through council rates. However, lack of universal council approval for this method coupled with inequities in missing application to people not owning real estate, and potentially being paid on multiple occasions by property investors, led them to introduce charges through the electricity bill instead. A similar scheme could also be applied to water charges or vehicle registrations.
The introduction of the CAC removed direct charges (ie a pricing signal) for ambulance services in Queensland and this has arguably placed upward pressure on demand. Queensland experienced the highest increase in the number of responses in Australia of 13.3% between 2002/03 and the year following the introduction of the CAC (2003/04). This compares to the average Australia wide growth rate of 5.2% for the same period.64 However, we understand that the Queensland Ambulance Service is of the view that the demand growth since July 2003 has been driven by conventional factors such as population growth and ageing rather than it being a partial response to the removal of the user charge or price signal. Whilst a longer time period is required to draw definitive conclusions on whether removing the price signal stimulates high long term growth in ambulance demand, this initial data would suggests that volume growth rates are more likely to be higher in the absence of price signals to better contain usage to essential circumstances.
3.3.5 Levies on Private Health Insurance Holders
The NSW Government indirectly levies all NSW residents who take out basic hospital cover with private health insurers. The effect of the levy is that privately covered patients do not receive an ambulance invoice which then avoids the need for them to pay and obtain a refund from the health insurer. Most jurisdictions have levies on all non-life insurance, however aside from NSW and its HIL no other state has a levy on private health insurance holders. Interestingly, Victoria, Tasmania and SA all have comparable levies to fund fire and emergency services.
Fire Services in Victoria are funded by the Fire Services Levy (FSL) which collects revenue for the statutory contribution budget. This is paid by insurance companies, Local and State Government. The level of required contributions by insurance companies to the operating expenses of the Victorian fire services is prescribed under section 37 of the Metropolitan Fire Brigades /Act 1958 (75.0 per cent) and section 76 of the Country Fire Authority Act 1958 (77.5 per cent). In 2004-05, revenue from insurance contributions to fire services is anticipated to increase by $21 million (7.0 per cent) compared to the 2003-04 revised estimate.65
64 Productivity Commission 2005, Report of Government Services 2005. 65 Treasury of Victoria 2004, Statement of Finances 2004-05: Budget Paper No. 4, p.131.
pwc Review of NSW Ambulance Service Funding Model
A Review of National and International Jurisdictions 47
The remainder of the operating expenses is met through state government and municipal council contributions, and direct charges by the brigades for attending fires on behalf of property owners who elect not to insure their properties, and also from other services.
Tasmania has a similar fire levy in order to meet operational costs and capital needs of the State Fire Commission. The levies are collected from:
• a fire service contribution on property (levied on assessed annual values) and collected by councils;
• a motor vehicle fire levy on all vehicle registration (excluding motor cycles); and
• a fire levy on prescribed classes of insurance.
SA also has an Emergency Services Levy (ESL) which funds the cost of Emergency Services, to the exclusion of the Ambulance Service which only receives a grant from the levy. The levy applies to mobile and fixed property. A fixed property levy is collected by Revenue SA. Vehicles registered under the Motor Vehicles Act, 1959 must pay the levy when applying to register or renew the registration and the boat levy is included in Marine and Harbour payments.
3.3.6 Bulk Agreements
In most jurisdictions, Ambulance Services have bulk agreements or contracts with organisations which purchase large volumes of ambulance transport. Revenue from these agreements appears in the Transport Fees as a subcategory of this stream.
Bulk agreements usually fall within the following categories:
• public and private hospitals – often fund inter-hospital transfers, which can be both emergency and non-emergency;
• area health services and other public health providers – sometimes contract with ambulance providers for non-emergency patient transports;
• accident authorities / agencies – most jurisdictions have public authorities which are responsible for funding health services which occur as a result of work, motor or general accidents; often such entities pay more than the standard rate as motor accidents typically result in a high number of vehicles attending; and
• DVA – some jurisdictions have agreements to pay for all health services for veterans and other similar groups. However, DVA contributions by jurisdiction vary in line with the exemption policies.
The contractual arrangements between each ambulance service and the various purchasers vary widely, the commercial details of which are often not publicly available. Due to the high usage of the services, most ambulance providers contract with these organisations at varying rates in return for greater notice to enable more efficient rostering and scheduling.
In Australia, the nature of the bulk agreements are broadly similar and reflect that arrangements in NSW (see section 2.3.2). Most States have
pwc Review of NSW Ambulance Service Funding Model
A Review of National and International Jurisdictions 48
agreements with DVA, and similar agreements with each the motor accident and workers compensation body in each state. Currently NSW only has bulk agreements with two of the eight AHS, such agreements can contain tailored pricing and arrangements to complete non-emergency work in times better suited to the Service.
Tasmania is the only jurisdiction which does not have bulk agreements with public hospitals for inter-hospital transfers, as the major hospitals and ambulance services are operated by the same division in the Department of Health and Human Services. Recently a shortfall in funding was caused partly by the fact that TAS does not charge citizens or public hospitals for their services.
However, TAS has bulk agreements with the following organisations, that generated $3.2 million in revenue in 2003/0466:
• fees charged to private hospitals for the transfer of non-urgent stable patients;
• fees charged to compensable bodies such as the Motor Accident Insurance Board or workers compensation insurers; and
• fees charged to beneficiaries of DVA.
In the UK, bulk agreements are the only source of transport fee revenue, as all residents are provided with free emergency services. Patient Transport Services are provided by a range of NHS Ambulance Trusts in addition to private providers. Hospitals, GPs, and other local health services who use such non-emergency patient transports contract with Ambulance providers. In 2003/04, the LAS managed to retain 30 contracts despite increasing competition.67
NZ set up the Accident Compensation Commission (ACC) in 1974 which provides all New Zealanders with ‘no-fault’ accident coverage. In exchange, citizens give up their right to sue for personal damages. This ensures that all people are covered, and insures residents for accident-emergency services. NZ Ambulance providers have bulk agreements with the ACC for the provision of such services. There are a number of other schemes which are funded by levies paid by employers, employees or the self-employed. Other examples include levies within motor vehicle licensing, insurance premiums, and petrol excise.
In BC, unlike many jurisdictions that receive a large amount of revenue from institutional users particularly hospitals, the majority of transport fees are received directly from individuals. In 2004/05 transport revenue received from institutional users only made up 28.6 per cent of total transport revenue.
66Joint Standing Committee on Community Development 2003, Report on Ambulance Services in Tasmania, Parliament of Tasmania, p.45. 67 London Ambulance Service NHS Trust 2004; Annual Report 2003/04, p28
pwc Review of NSW Ambulance Service Funding Model
A Review of National and International Jurisdictions 49
3.3.7 Ancillary Products and Services
A number of jurisdictions supplement their funding with revenue from a range of ancillary products / services. The prevalence of such products and services is usually confined to more financially independent services and non-government entities. Budget-dependent GGE’s which are maintained by deficit based funding have less incentive to diversify their income streams into these more commercial operations and can be required to return to the Government at the year end, any unspent revenue. The variety of expanding non-ambulance businesses include:
• alarm monitoring;
• servicing events;
• first aid supplies;
• training (internally and externally);
• youth groups;
• caring callers; and
• paramedics for air operators.
SAAS engage in ancillary activities such as providing a 24-hour emergency monitoring service called “Call Direct” which connects users directly to the emergency services through an alarm based device. The ambulance service then calls the patient back to determine their needs. If there is no answer an ambulance is sent. These units are directly targeted for patients with a high risk of requiring emergency services, such as the elderly, convalescing people, permanently ill or disabled, etc. SA sells each unit for $417.50.
Ambulance Services in NZ also have a significant range of charitable and commercial activities which comprise nearly 44 per cent of total revenue. For the three DHB providers, ambulance services are an addition to the wide range of health related activities undertaken. Revenue from ancillary products contributed to the 10 per cent revenue growth rate for NZ Ambulance which exceeded the cost growth rate of 8 per cent between 2001/02 and 2002/03.
This diversification of revenue sources has improved the financial operations of ambulance providers, and has facilitated cross subsidisation of non-ambulance activities and ambulance activities.
pwc Review of NSW Ambulance Service Funding Model
A Review of National and International Jurisdictions 50
St John’s Ambulance in NZ and WA both engage in the provision of a large number of ancillary products and services. NZ St John’s provides medical alarms; ‘Caring Caller Program’, First Aid Supplies, First Aid Training; and attendance at events, such as the Big Day Out. WA St John’s provide First Aid Supplies, First Aid Training; Community Care visiting program; corporate ambulance services and training.
The LAS in the UK operates the Emergency Bed Service (EBS), which is a service that provides information on available beds 24-hours a day for most of London. The service can distinguish between different types of beds available and operates the following four services accordingly:
• The GP Referral Service: finds the most appropriate destination, based upon a patient’s individual needs and the immediate availability of suitable beds and services.
• The Intensive Care Service: a National Register holds information on available beds and services in all general, paediatric and neuroscience critical care units in England. It is available to clinicians considering a patient transfer.
• The Paediatric Service: The EBS collects and holds information on available general paediatric beds and cubicles in hospitals throughout London. It is used by doctors looking for beds and services for their patients.
• The Neonatal Intensive Care Services: A register of available neonatal intensive care cots and services.
3.3.8 Volunteer Labour
Although volunteer labour is not a source of funding, it significantly contributes to a number of emergency services in a number of jurisdictions. Ambulance services typically have high fixed costs, with employee related costs being one of the larges cost items. Therefore, volunteer labour can decrease the reliance on Government funding. It tends to be the charitable and non-government ambulance providers who are better able to attract and retain volunteers.
St John’s Ambulance operate all over the world using mainly volunteer labour. The WA St John’s would be less cost effective without volunteer labour. Of the 5,581 total staff, nearly 90 per cent are volunteers. Consequently, WA had one of the lowest total funding requirements at $77.7 million, even though it covers the largest area of any single ambulance service anywhere in the world. It also has one of the lowest funding rates per capita in Australia at approximately $38.85, in comparison to around $49.43 in NSW.
pwc Review of NSW Ambulance Service Funding Model
A Review of National and International Jurisdictions 51
The operation of the non-government ambulance providers, who provide the majority of ambulance services in NZ, is dependent on the contribution of volunteers. The direct staff costs of all ambulance services in NZ amounts to $45.5 million in 2002/03, which amounts to 52 per cent of total costs. Hence, employee related expenses in NZ are relatively low, especially in comparison to comprising 70 per cent of total costs in NSW. Estimates of the cost of replacing volunteers with paid staff are between $21.8 million and $32.6 million.
Similarly, Tasmania is dependent on volunteer labour and support. Almost 73 per cent of the 687 staff are volunteers that staff 23 wholly volunteer operated stations. Without this contribution, it is unlikely that the Tasmanian Ambulance Service would be able to achieve one of the lowest funding per capita at $40.83 in 2003/04.
In SA, Ambulance stations in smaller country towns are staffed by more than 1,300 volunteer ambulance officers and supported by more than 200 non-operational volunteers.68
Most of the other jurisdictions also use some volunteer labour inputs, especially in rural areas where demand per km2 is lower due to the sparse population. However, in these jurisdictions volunteers comprise a low proportion of total staff numbers.
Overall whilst volumes can reduce costs, use of volunteers also has a range of service quality, training, risk, insurance and management issues which can require close consideration.
68 SAAS 2004, SA Ambulance Service Annual Report 2003/04.p.6
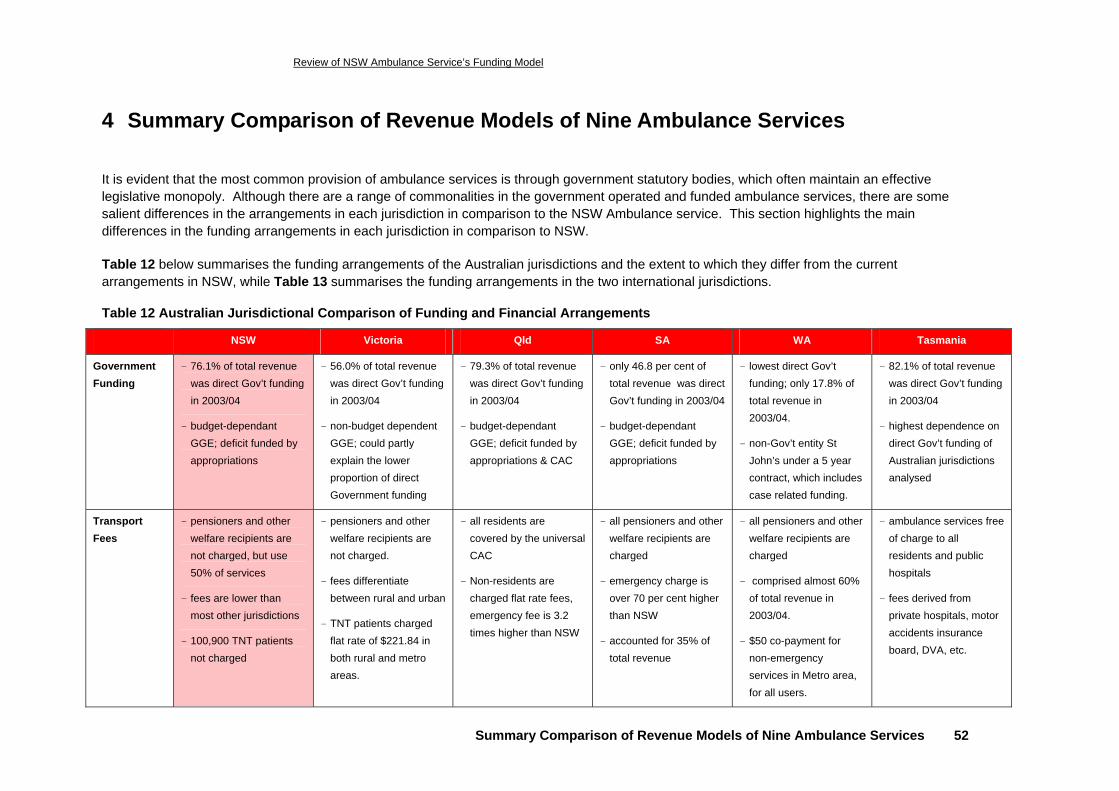
Review of NSW Ambulance Service’s Funding Model
Summary Comparison of Revenue Models of Nine Ambulance Services 52
4 Summary Comparison of Revenue Models of Nine Ambulance Services
It is evident that the most common provision of ambulance services is through government statutory bodies, which often maintain an effective legislative monopoly. Although there are a range of commonalities in the government operated and funded ambulance services, there are some salient differences in the arrangements in each jurisdiction in comparison to the NSW Ambulance service. This section highlights the main differences in the funding arrangements in each jurisdiction in comparison to NSW.
Table 12 below summarises the funding arrangements of the Australian jurisdictions and the extent to which they differ from the current arrangements in NSW, while Table 13 summarises the funding arrangements in the two international jurisdictions.
Table 12 Australian Jurisdictional Comparison of Funding and Financial Arrangements
NSW Victoria Qld SA WA Tasmania
Government Funding
- 76.1% of total revenue was direct Gov’t funding in 2003/04
- budget-dependant GGE; deficit funded by appropriations
- 56.0% of total revenue was direct Gov’t funding in 2003/04
- non-budget dependent GGE; could partly explain the lower proportion of direct Government funding
- 79.3% of total revenue was direct Gov’t funding in 2003/04
- budget-dependant GGE; deficit funded by appropriations & CAC
- only 46.8 per cent of total revenue was direct Gov’t funding in 2003/04
- budget-dependant GGE; deficit funded by appropriations
- lowest direct Gov’t funding; only 17.8% of total revenue in 2003/04.
- non-Gov’t entity St John’s under a 5 year contract, which includes case related funding.
- 82.1% of total revenue was direct Gov’t funding in 2003/04
- highest dependence on direct Gov’t funding of Australian jurisdictions analysed
Transport Fees
- pensioners and other welfare recipients are not charged, but use 50% of services
- fees are lower than most other jurisdictions
- 100,900 TNT patients not charged
- pensioners and other welfare recipients are not charged.
- fees differentiate between rural and urban
- TNT patients charged flat rate of $221.84 in both rural and metro areas.
- all residents are covered by the universal CAC
- Non-residents are charged flat rate fees, emergency fee is 3.2 times higher than NSW
- all pensioners and other welfare recipients are charged
- emergency charge is over 70 per cent higher than NSW
- accounted for 35% of total revenue
- all pensioners and other welfare recipients are charged
- comprised almost 60% of total revenue in 2003/04.
- $50 co-payment for non-emergency services in Metro area, for all users.
- ambulance services free of charge to all residents and public hospitals
- fees derived from private hospitals, motor accidents insurance board, DVA, etc.
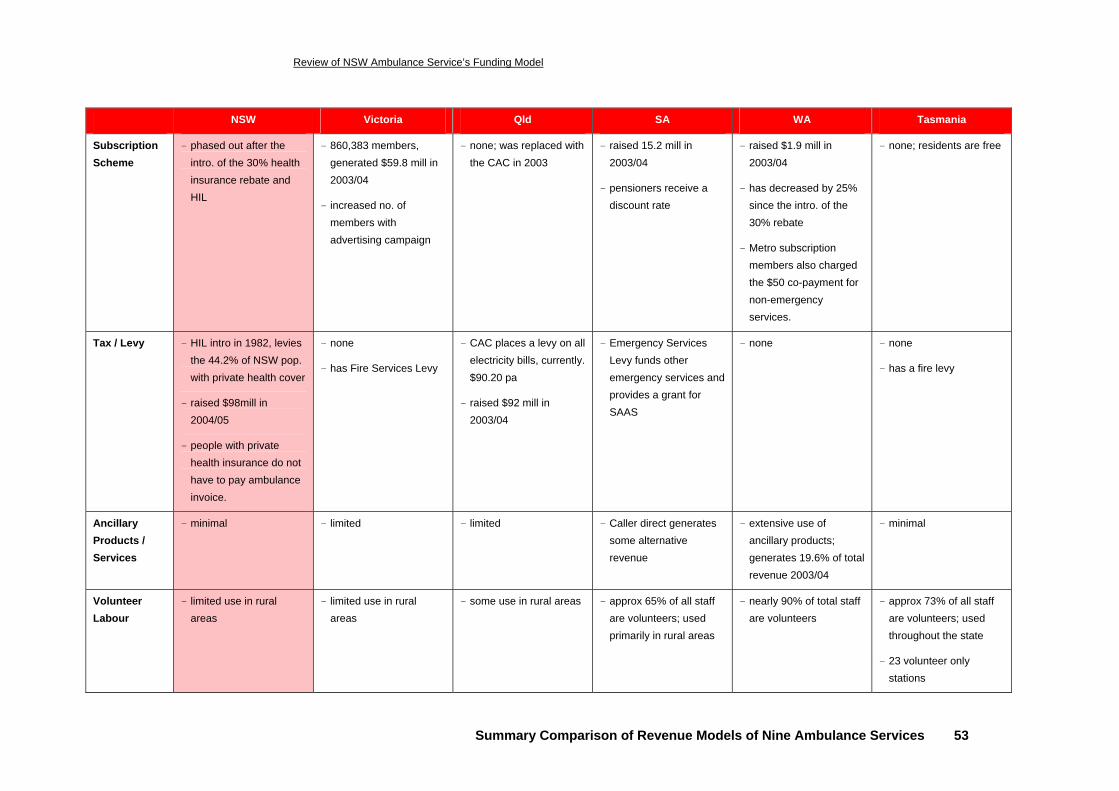
Review of NSW Ambulance Service’s Funding Model
Summary Comparison of Revenue Models of Nine Ambulance Services 53
NSW Victoria Qld SA WA Tasmania
Subscription Scheme
- phased out after the intro. of the 30% health insurance rebate and HIL
- 860,383 members, generated $59.8 mill in 2003/04
- increased no. of members with advertising campaign
- none; was replaced with the CAC in 2003
- raised 15.2 mill in 2003/04
- pensioners receive a discount rate
- raised $1.9 mill in 2003/04
- has decreased by 25% since the intro. of the 30% rebate
- Metro subscription members also charged the $50 co-payment for non-emergency services.
- none; residents are free
Tax / Levy - HIL intro in 1982, levies the 44.2% of NSW pop. with private health cover
- raised $98mill in 2004/05
- people with private health insurance do not have to pay ambulance invoice.
- none
- has Fire Services Levy
- CAC places a levy on all electricity bills, currently. $90.20 pa
- raised $92 mill in 2003/04
- Emergency Services Levy funds other emergency services and provides a grant for SAAS
- none
- none
- has a fire levy
Ancillary Products / Services
- minimal - limited - limited - Caller direct generates some alternative revenue
- extensive use of ancillary products; generates 19.6% of total revenue 2003/04
- minimal
Volunteer Labour
- limited use in rural areas
- limited use in rural areas
- some use in rural areas - approx 65% of all staff are volunteers; used primarily in rural areas
- nearly 90% of total staff are volunteers
- approx 73% of all staff are volunteers; used throughout the state
- 23 volunteer only stations
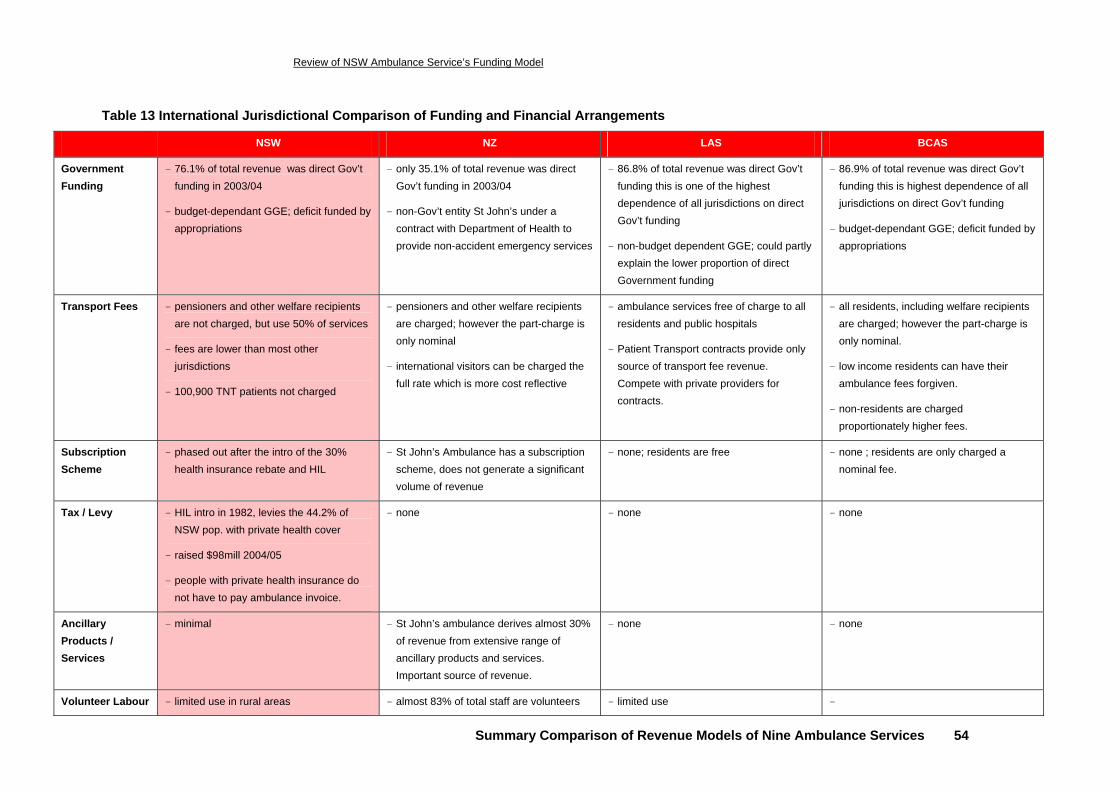
Review of NSW Ambulance Service’s Funding Model
Summary Comparison of Revenue Models of Nine Ambulance Services 54
Table 13 International Jurisdictional Comparison of Funding and Financial Arrangements
NSW NZ LAS BCAS
Government Funding
- 76.1% of total revenue was direct Gov’t funding in 2003/04
- budget-dependant GGE; deficit funded by appropriations
- only 35.1% of total revenue was direct Gov’t funding in 2003/04
- non-Gov’t entity St John’s under a contract with Department of Health to provide non-accident emergency services
- 86.8% of total revenue was direct Gov’t funding this is one of the highest dependence of all jurisdictions on direct Gov’t funding
- non-budget dependent GGE; could partly explain the lower proportion of direct Government funding
- 86.9% of total revenue was direct Gov’t funding this is highest dependence of all jurisdictions on direct Gov’t funding
- budget-dependant GGE; deficit funded by appropriations
Transport Fees - pensioners and other welfare recipients are not charged, but use 50% of services
- fees are lower than most other jurisdictions
- 100,900 TNT patients not charged
- pensioners and other welfare recipients are charged; however the part-charge is only nominal
- international visitors can be charged the full rate which is more cost reflective
- ambulance services free of charge to all residents and public hospitals
- Patient Transport contracts provide only source of transport fee revenue. Compete with private providers for contracts.
- all residents, including welfare recipients are charged; however the part-charge is only nominal.
- low income residents can have their ambulance fees forgiven.
- non-residents are charged proportionately higher fees.
Subscription Scheme
- phased out after the intro of the 30% health insurance rebate and HIL
- St John’s Ambulance has a subscription scheme, does not generate a significant volume of revenue
- none; residents are free
- none ; residents are only charged a nominal fee.
Tax / Levy - HIL intro in 1982, levies the 44.2% of NSW pop. with private health cover
- raised $98mill 2004/05
- people with private health insurance do not have to pay ambulance invoice.
- none - none
- none
Ancillary Products / Services
- minimal - St John’s ambulance derives almost 30% of revenue from extensive range of ancillary products and services. Important source of revenue.
- none
- none
Volunteer Labour - limited use in rural areas - almost 83% of total staff are volunteers - limited use -
pwc Review of NSW Ambulance Service Funding Model
Conclusions and Reform Options 55
5 Conclusions and Reform Options
5.1 Conclusions
This literature review highlights, describes and compares the key aspects of the NSW Ambulance funding model with those of Ambulance services in other national and international jurisdictions. Specifically, the review identifies key differences in funding approaches across jurisdictions. These differences in turn provide a focus for review of the NSW Ambulance funding model.
The key findings of the review are:
• The Service has had an increasingly heavy reliance on direct government funding (73.6% of total revenue in 2003/04).
• Government funding (primarily comprised of recurrent allocations) is sourced as appropriations from the NSW Department of Health and is generally allocated though a historically based deficit funding approach; with adjustments for award rises, CPI and new capacity.
• A very large proportion of patients are exempt from direct charges. Of the 753,300 patients that were transported and/or treated in 2003/04, only 20 per cent were charged directly. Despite the exemption from charging of the 80 per cent of patients, and the exempt covering almost all patients from lower socio-economic means, of the remaining 20 per cent of patients who are directly charged, approximately 47 per cent fail to pay the invoice.
• Over 63 per cent of exempt patients are comprised of pensioners and treat and not transport patients. The majority of other Australian jurisdictions charge a fee for all response services, whereas NSW does not charge a fee where patients are treated but then not transported.
• The level of current user charges are well below the average cost of service delivery – a comparison of ambulance fee scales across jurisdictions indicates that the direct charges for primary responses in NSW is well below those in other national jurisdictions. In NSW, the average cost per patient in 2003/04 was $512 compared with an average charge of $251.
• The structure of user charges does not reflect the fixed cost nature of the NSW Ambulance Service – preliminary calculations indicate that a flagfall charge of around $375 is more reflective of the average fixed cost per patient, compared to current primary flagfall of $165. Such a change may also provide a better price signal to contain usage to genuinely necessary and appropriate occasions with some subsequent variable cost savings.
pwc Review of NSW Ambulance Service’s Funding Model
Conclusions and Reform Options 56
• There are no financial disincentives for undertaking non-urgent services, such as most inter-hospital transfers during ‘after hours’ periods. In 2003/04, between 23 per cent and 61 per cent (depending on region) of inter-hospital transfers took place between 6pm and 8am. After hours responses have a higher cost, particularly in country areas where they often result in the payment of call-out allowances to ambulance officers.
5.2 Potential Reform Options
5.2.1 Options Derived from Other Jurisdictions
The following potential reform options have been derived from the various funding models analysed in the selected national and international jurisdictions. These revenue streams are successful in some jurisdictions, and there is some merit in further investigating their potential effect on the NSW Service. However, we recognise that some of the possible options may not be appropriate for NSW.
i) Implementation of a Subsidy Agreement
Government funding from appropriations does not provide the same level of commercial incentives as can be present in performance agreements as part of subsidy contracts known as Community Service Obligations (CSOs). We recommend further evaluation of a medium term CSO funding agreement (such as that in Victoria) be further evaluated. Such an agreement could have a fixed and variable funding component reflecting the predominately fixed cost structure whilst adjusting to reflect surges or reductions in demand. There may also be merit in assessing whether management incentives could improve if the CSO for the Service was provided by another Government entity other than NSW Health.
ii) Community Ambulance Charge
We recommend the further evaluation of the merit of a broad-based community charge to recover the cost of providing emergency ambulance services from NSW residents. The charge on behalf of the NSW Government could be administered through a number of means such as via council rates, water accounts or electricity accounts. However, a shortcoming of this approach is that it removes the price signal for services, and a detailed evaluation of this option will need to focus the extent to which a community charge would further stimulate demand and higher levels of cost growth.
iii) Improving the Cost Reflectivity of Direct User Charges
We recommend further investigation of reforms to the existing direct charging structure, particularly in relation to the extent to which the current direct charges recover and reflect the structure of costs of NSW Ambulance service delivery. More specifically a higher flagfall, an excess waiting time charge as well as a significant differential between emergency and non-emergency services may have reasonable merit. An increase in user charges will act as a price signal and provide some demand moderation.
pwc Review of NSW Ambulance Service’s Funding Model
Conclusions and Reform Options 57
Whilst higher charge levels, in the absence of reforms to debt collection processes, will result in growth in bad debts, PwC is also recommending some reforms to debt collection processes (see Potential Reform Option (ix)).
There is also a need for indexing or escalating user charges in line with changes in costs. However, it would be necessary to ensure that there is a mechanism to promote maintaining the efficiency of the service.
iv) Charging Exempt Patients
We recommend the further evaluation of the merit of establishing a modest co-payment ambulance call out fee for non-emergency services some currently exempt patients. Such a co-payment will provide some price signal to ensure usage is contained to necessary circumstances whilst in no way deterring appropriate utilisation. There is also some potential merit in examining the large array of different categories of people who are currently exempt from charging so as to ensure exemption recipients are genuinely of insufficient financial means to make some level of co-payment towards ambulance costs.
v) Charge for Treat and Not Transport
We recommend further evaluation of the merit of a TNT charge. Whilst such a charge may be prone to bad debts which may limit the significance of revenue raised, it may serve to contain the volume of less appropriate call-outs and reduce associated costs. This will be particularly relevant as one of the Services’ key priorities is to provide additional rapid responds to capitalise on their ability to “treat on scene” and decrease transports to hospital. There could also be some merit in introducing fines for pranks or obvious frivolous misuse of the Service in order to discourage such behaviour. Alternatively the Service could consider some form of charge for each ambulance response regardless of whether treatment and/or transport is not required or refused, similar to the $50 charge by the BCAS.
vi) Development of Greater Ancillary Revenue Streams
We recommend further evaluation of expanding the services offered, such as some of the services provided in WA and NZ, provided they do not interfere with the core business and that the pricing for each ancillary service fully recovers all costs (including return of and on capital). Also existing ancillary services should be re-priced to the greater of full cost recovery or competitive market levels. However, we recognise the market domination of St John’s Ambulance and other private operators within this sphere; this could further limit the ability of the Service to derive revenue from this source.
pwc Review of NSW Ambulance Service’s Funding Model
Conclusions and Reform Options 58
5.2.2 Other Potential Reform Options
The following set of potential reform options have been developed in response to the specific characteristics of the NSW Service, and are not directly from the current funding arrangements in the analysed jurisdictions. We recommend that there is merit in further evaluating the implementation of these potential reforms.
vii) Hypothecation of Health Insurance Levy
Under the prevailing model, the NSW Ambulance Service does not directly receive a component of the HIL from Treasury. We recommend that the merit of hypothecation of HIL to the Service be further evaluated. However, as outlined in section 2.3.4, the Service already sees these funds as unofficially hypothecated, therefore the actual benefit of this reform may be limited.
viii) ‘Out of hours’ Charge for Inter-hospital Transfers
We recommend the further evaluation of the merit of differential user charges for ‘after-hours’ inter-hospital transfers as: such movements incur greater ambulance staff costs (especially in non-metro areas) and hospitals have reasonable capability to arrange such movements within business hours.
ix) Review Bad Debts Procedures
We recommend further evaluation of different innovative techniques to improve debtor recovery rates. There could also be merit in attempting recovering some outstanding invoices by contracting with the State Debt Recovery Office. This arrangement could include adding any outstanding charge to other Government charges, such as requiring payment in order to enable renewal of a drivers licence or vehicle registration.
x) Bulk Agreements
The Service should seek to establish bulk agreements with all AHS. Prices should be tailored to reflect likely costs. Greater efficiencies can be gained from framing bulk service agreements based on targeted volume over expected typical routes/distances and hours of operation. For example where an AHS has its own Transport Service and uses the Service for out of hours, longer distance movements or cases with increased acuity, a significantly higher unit price should apply. Additionally an excess waiting time charge could be appropriate to ensure a timely acceptance of patients to enable Service officers to move on to servicing their next job allocation.