pricing of u.s. money market funds - · pdf file*the term “shadow price” has been...
TRANSCRIPT

Pricing of U.S. Money Market Funds
January 2011

The Investment Company Institute is the national association of U.S. investment companies, including mutual funds, closed-end funds, exchange-traded funds (ETFs), and unit investment trusts (UITs). ICI seeks to encourage adherence to high ethical standards, promote public understanding, and otherwise advance the interests of funds, their shareholders, directors, and advisers. Members of ICI manage total assets of $12.31 trillion and serve over 90 million shareholders.

Pricing of U.S. Money Market Funds
Contents
Summary and Key Findings . . . . . . . . . . . . . . . . . . . . . . . . . . . . . . . . . . . . . . . . . . . . . . . . . . . 1
Introduction . . . . . . . . . . . . . . . . . . . . . . . . . . . . . . . . . . . . . . . . . . . . . . . . . . . . . . . . . . . . . . . 5
Understanding Money Market Fund Pricing . . . . . . . . . . . . . . . . . . . . . . . . . . . . . . . . . . . . . . . 6
Rule 2a-7 Risk-Limiting Provisions . . . . . . . . . . . . . . . . . . . . . . . . . . . . . . . . . . . . . . . . . . 6
Amortized Cost Method Used to Calculate Stable $1.00 NAV . . . . . . . . . . . . . . . . . . . . . . 7
Allowable Deviations of Per-Share Market Value . . . . . . . . . . . . . . . . . . . . . . . . . . . . . . . 9
Amortized Cost Is Normally a Close Approximation of Market Value . . . . . . . . . . . . . . . 10
Factors That Affect Per-Share Market Values . . . . . . . . . . . . . . . . . . . . . . . . . . . . . . . . . . . . . 10
Changes in Interest Rates . . . . . . . . . . . . . . . . . . . . . . . . . . . . . . . . . . . . . . . . . . . . . . . . 12
Weighted Average Maturity . . . . . . . . . . . . . . . . . . . . . . . . . . . . . . . . . . . . . . . . . . . . . . 14
Net Inflows and Outflows . . . . . . . . . . . . . . . . . . . . . . . . . . . . . . . . . . . . . . . . . . . . . . . . 16
Combining the Effects of Interest Rate Changes and Net Flows . . . . . . . . . . . . . . . . . . . 19
Credit Events . . . . . . . . . . . . . . . . . . . . . . . . . . . . . . . . . . . . . . . . . . . . . . . . . . . . . . . . . 20
How Have Funds’ Shadow Prices Behaved Historically? . . . . . . . . . . . . . . . . . . . . . . . . . . . . 24
Summing Up the Historical Evidence on Money Market Funds’ Shadow Prices . . . . . . . . . . . 30
Notes . . . . . . . . . . . . . . . . . . . . . . . . . . . . . . . . . . . . . . . . . . . . . . . . . . . . . . . . . . . . . . . . . . . . 31
Glossary of Money Market Terms . . . . . . . . . . . . . . . . . . . . . . . . . . . . . . . . . . . . . . . . . . . . . . 34

Figures
FIGURE 1 Rising Interest Rates in 2004 Reflected Tightening Monetary Policy . . . . . . . . . . . 11
FIGURE 2 Market Value of 3-Month Treasury Security Differed Little from Amortized Cost . . 11
FIGURE 3 A Fund's Shadow Price Varies with Changes in Interest Rates . . . . . . . . . . . . . . . . . 13
FIGURE 4 Most Changes in Interest Rates on 3-Month Treasury Securities Are Small . . . . . . . 14
FIGURE 5 Weighted Average Maturity Determines Sensitivity of a Fund’s Shadow Price to Changes in Interest Rates . . . . . . . . . . . . . . . . . . . . . . . . . . . . . . . . . . . . . . 15
FIGURE 6 Shadow Prices Are Sensitive to a Fund's Net Flows . . . . . . . . . . . . . . . . . . . . . . . . . 17
FIGURE 7 Large, Sudden Net Flows to Taxable Money Market Funds Occur Infrequently . . . . 18
FIGURE 8 Net Outflows and Changes in Interest Rates Together Influence a Fund’s Shadow Price . . . . . . . . . . . . . . . . . . . . . . . . . . . . . . . . . . . . . . . . . . . . . . . . . . . . . . 19
FIGURE 9 Spread Between Second-Tier and Top-Tier 30-Day Commercial Paper Rates . . . . . 20
FIGURE 10 Sensitivity of a Fund’s Shadow Price to an Issuer Downgrade . . . . . . . . . . . . . . . . . 21
FIGURE 11 Short-Term Corporate Ratings Actions Tend to Cluster . . . . . . . . . . . . . . . . . . . . . . 22
FIGURE 12 Percentage of a Portfolio That Can Default Before a Money Market Fund Risks Breaking the Buck . . . . . . . . . . . . . . . . . . . . . . . . . . . . . . . . . . . . . . . . . . . . . . . . . 23
FIGURE 13 Money Market Funds Providing Shadow Prices . . . . . . . . . . . . . . . . . . . . . . . . . . . . 25
FIGURE 14 Shadow Prices, January 2000–April 2010 . . . . . . . . . . . . . . . . . . . . . . . . . . . . . . . . 26
FIGURE 15 Shadow Prices, August 6, 2008–December 24, 2008 . . . . . . . . . . . . . . . . . . . . . . . 28
FIGURE 16 Yields on Selected 1-Month Money Market Instruments Rose Sharply During the Financial Crisis . . . . . . . . . . . . . . . . . . . . . . . . . . . . . . . . . . . . . . . . . . . . 29

1prICIng oF U.S. MonEy MarkET FUndS
Pricing of U.S. Money Market Funds
Rochelle L. Antoniewicz, ICI Senior Economist; Michael C. Breuer, ICI Assistant Economist;
Sean S. Collins, ICI Senior Director of Industry and Financial Analysis; and Brian K. Reid,
ICI Chief Economist, prepared this report. Kimberly A. Lunde, ICI Research Associate,
provided research assistance.
Summary and Key FindingsU.S. money market funds, unlike other mutual funds, seek to maintain a stable $1.00 per share net asset value (NAV). The NAV is the price at which investors purchase or redeem shares.
Money market funds must adhere to strict risk-limiting provisions governing the credit quality,
liquidity, diversification, and maturity of their portfolio securities. Funds operating under these
rules are allowed to value their assets at the assets’ amortized cost, rather than at market value.
The rule governing money market funds requires that funds hold high-quality, liquid securities with short maturities. Money market funds are governed by Rule 2a-7 under the
Investment Company Act of 1940. By managing their funds to meet and exceed Rule 2a-7’s
standards, advisers limit money market funds’ exposure to credit risk, interest-rate risk, and
liquidity risk. Rule 2a-7’s standards help ensure that money market funds maintain a stable $1.00
NAV. As money market funds disclose in their prospectuses, however, they are not insured by the
Federal Deposit Insurance Corporation or any other government agency, and it is possible to lose
money by investing in such funds.
Money market funds are required to regularly calculate their “shadow prices”—their portfolios’ per-share values at market prices.* While money market funds have routinely
calculated per-share market values for decades, and disclosed them semiannually, the Securities
and Exchange Commission’s 2010 amendments to Rule 2a-7 now require funds to disclose them
on a monthly basis (with a 60-day lag) to four decimal places (e.g., $1.0005 or $0.9995). This
disclosure will expose many investors to shadow prices for the first time.
*The term “shadow price” has been used for many years to reflect the fact that a money market fund’s per-share value, when calculated on a current market basis, must and typically does very closely “shadow” or track the fund’s per-share value calculated using the amortized cost method. In this report, we will use “shadow price” and “per-share market value” interchangeably.

2 prICIng oF U.S. MonEy MarkET FUndS
Shadow prices can deviate from $1.0000, even when financial markets are largely stable. Such deviations are typically small and are not generally a cause for investor concern. Because
money market funds hold short-term, high-quality securities, amortized cost usually provides a
close approximation to a fund portfolio’s market value.
Four factors are primarily responsible for changes in money market funds’ per-share market values. They are:
» Changes in interest rates. Falling interest rates increase shadow prices, and rising rates
reduce them.
» The maturity of a fund’s portfolio. The longer the portfolio’s dollar-weighted average
maturity (WAM),* the greater the impact of changing interest rates on the fund’s
per-share market value.
» Flows of net new money into and out of funds. If a fund’s shadow price differs from
$1.0000, net inflows, or investors’ purchases in excess of investors’ redemptions,
will move the per-share market value toward $1.0000. Net outflows, or investors’
redemptions in excess of investors’ purchases, will increase the deviation from $1.0000.
» Credit events affecting securities held in a fund’s portfolio. Downgrades and defaults
decrease shadow prices.
A money market fund can report a stable $1.00 NAV if its shadow price remains within one-half cent ($0.0050) of $1.0000. On the other hand, if a fund’s shadow price rises above $1.0050
or falls below $0.9950, the fund’s board must promptly consider what action, if any, should
be taken, including whether to discontinue the use of amortized cost valuation and reprice the
fund’s NAV to be more or less than $1.00. Repricing the NAV is known as “breaking the dollar” or
“breaking the buck.” The board may also consider whether to suspend redemptions and liquidate
the fund.
Large, sudden changes in market conditions are necessary before a money market fund is at risk of breaking the buck. Modeling based on reasonable assumptions about fund portfolio
composition and maturity demonstrates that:
» Short-term interest rates must rise by more than 300 basis points (3 percentage points)
in one day to reduce a fund’s shadow price to $0.9950, absent any other changes in
market conditions.
* Weighted average maturity (WAM) and other key terms are defined in the Glossary of Money Market Terms.

3prICIng oF U.S. MonEy MarkET FUndS
» Investor net redemptions must reach 80 percent of a fund’s assets to reduce a fund’s
per-share market value to $0.9950, absent any other changes in market conditions and
given an initial per-share market value of $0.9990.
» Interest rate changes and flows can have a combined effect on a fund’s shadow price. In
the modeling, a 100 basis-point (1 percentage-point) increase in interest rates combined
with investor net redemptions of nearly 70 percent of a fund’s assets, all in one day,
would be necessary to reduce a fund’s shadow price to $0.9950.
Large, sudden changes in interest rates or large investor net redemptions are rare. Historical
data show that:
» On 98 percent of all business days between 1982 and 2010, interest rates on the 3-month
Treasury bill changed (up or down) by 25 basis points or less. Over longer periods,
changes in short-term interest rates also tend to be small; 3-month Treasury interest
rates changed by 25 basis points or less (up or down) in 63 percent of 30-day periods
during those years.
» Between 1996 and 2010, investor net redemptions from taxable money market funds in a
single week exceeded 20 percent of a fund’s assets in fewer than 1 percent of instances.
Over four-week periods during those years, redemptions exceeded 20 percent of assets
in fewer than 2.5 percent of instances.
Interest rate changes and investor net redemptions over longer periods have less impact on money market funds’ shadow prices. Money market funds hold securities that mature over a
short period. This allows fund managers to adjust their portfolios relatively quickly to changes
in interest rates, net flows, and credit events. The 2010 amendments to Rule 2a-7 reduced the
maximum allowable WAM of a money market fund’s portfolio from 90 days to 60 days. This
change has the potential to significantly reduce volatility in per-share market values.
Credit events affecting securities held by a money market fund can have a smaller or larger effect on the fund’s shadow price, depending on the nature and size of the event. Modeling
demonstrates that:
» A money market fund’s per-share market value can withstand large increases in the
interest rate on a single security. For a security that comprises 5 percent of a fund’s
portfolio, a 400 basis-point increase in its interest rate—which might be caused by
a credit rating downgrade—will reduce a fund’s shadow price by only 5 basis points,
from $1.0000 to $0.9995. The impact on the shadow price is muted by Rule 2a-7’s
diversification requirements, which allow a money market fund to invest no more than
5 percent of its assets with a single issuer.

4 prICIng oF U.S. MonEy MarkET FUndS
» The effect of a default on a fund's shadow price depends on the size of the fund's
holding and the severity of the decline in the market values of the defaulted securities.
For example, a default in a security that comprises 1.25 percent of a fund’s assets can
reduce the fund’s per-share market value to $0.9950 or below if the default reduces the
security’s value by 40 percent or more (to 60 cents or less on the dollar).
» To maintain minimal credit risk, money market fund managers work hard to diversify and
monitor the credit quality of their portfolios to avoid holding securities that may end up
defaulting.
Historical evidence confirms that deviations between money market funds’ shadow prices and amortized costs are generally small. Data from a sample of taxable money market funds
covering one-quarter of industry assets demonstrate that:
» Average per-share market values of all funds in the sample varied within a narrow range
over the decade from 2000 to 2010—a period when financial markets experienced wide
variations in interest rates and asset prices. Average shadow prices for funds in the
sample ranged from $1.0020 in 2001–2002, when the Federal Reserve reduced interest
rates sharply, to $0.9990 in the fall of 2008, at the peak of the financial crisis.
» Average per-share market values for prime money market funds in the sample—those
taxable funds that invest in corporate as well as government securities—varied between
$1.0020 and $0.9980 during the decade from 2000 to 2010.
Experience during the financial crisis indicates that money market funds’ shadow prices did not provide early warning of severe financial shocks. In the week ending September 10, 2008—
two business days before the failure of Lehman Brothers Holdings Inc.—90 percent of prime
money market funds in the sample had per-share market values within 5 basis points of $1.0000
(between $0.9996 and $1.0005). Even the following week, after Lehman Brothers had failed,
93 percent of prime funds in the sample had shadow prices greater than $0.9975, and none had a
per-share market value within 10 basis points of $0.9950.

5prICIng oF U.S. MonEy MarkET FUndS
IntroductionOne defining feature of U.S. money market funds is that, in contrast to other mutual funds, they
seek to maintain a stable $1.00 net asset value (NAV).† The NAV is the price at which investors
purchase or redeem shares. Like other mutual funds, a money market fund holds a portfolio of
securities, and the value of those securities fluctuates with market conditions. For money market
funds, which hold short-term, high-quality securities, these fluctuations are generally very
modest. A money market fund provides investors a stable $1.00 NAV by using “amortized cost” to
value its portfolio securities. Amortized cost is the price a fund pays for a security as adjusted for
accretion of discount or amortization of premium. Money market funds use amortized cost, rather
than market value, to value their securities when calculating NAV.
The Securities and Exchange Commission (SEC) allows a money market fund to use the amortized
cost method only if the fund follows Rule 2a-7 under the Investment Company Act of 1940.
Rule 2a-7 is intended to help ensure that a fund can maintain a stable $1.00 NAV. To that end, the
rule specifies standards on portfolio credit quality, readily available liquidity to meet redemption
requests, diversification of issuers and guarantors of portfolio securities, and maturity of portfolio
securities. The rule also requires a fund to regularly compare its price per share calculated using
the amortized cost method to the price per share based on market prices, known as its “shadow
price.”‡
In January 2010, the SEC adopted important amendments to Rule 2a-7 to tighten the rule’s
credit, maturity, and liquidity standards.1 The amendments also require money market funds to
provide their shadow prices, along with other new disclosures, to the SEC on a monthly basis. On
January 31, 2011, the SEC will begin publishing these data with a 60-day lag.2
This report reviews the differences between money market funds’ $1.00 NAV and their shadow
prices. While a fund’s per-share market value, or shadow price, generally remains very close
to the stable $1.00 NAV, deviations can and do occur because of changes in market interest
rates, money flowing into or out of a fund, losses or gains on a fund’s portfolio securities, credit
events affecting any securities held in the portfolio, or other factors. The SEC allows a fund’s
shadow price to vary within a narrow band of 0.5 percent, or 50 basis points, on either side of
$1.0000 (from $0.9950 to $1.0050).3 If the per-share market value moves outside this band, the
fund’s board must promptly consider what action, if any, should be taken, including whether to
† Net asset value (NAV) and other key terms are defined in the Glossary of Money Market Terms.
‡ The term “shadow price” has been used for many years to reflect the fact that a money market fund’s per-share value, when calculated on a current market basis, must and typically does very closely “shadow” or track the fund’s per-share value calculated using the amortized cost method. In this report, we will use “shadow price” and “per-share market value” interchangeably.

6 prICIng oF U.S. MonEy MarkET FUndS
discontinue the use of amortized cost valuation and reprice the fund’s NAV to be more or less
than $1.00. Repricing the NAV is known as “breaking the dollar” or “breaking the buck.” The
board may also consider whether to suspend redemptions and liquidate the fund.
The SEC’s new disclosure will give many investors their first real exposure to money market
funds’ shadow prices.4 This paper shows that deviations between funds’ shadow prices and the
stable $1.00 NAV are common but typically small. Such deviations often reflect changes in market
interest rates and rarely signal a credit problem or an increase in the possibility that a money
market fund might be at risk of breaking the buck.
Understanding Money Market Fund PricingThis section reviews some of the features of Rule 2a-7, including its risk-limiting provisions. It
describes the amortized cost method and explains how this method produces a stable $1.00 NAV.
It also describes how money market funds must monitor their per-share market values and how
they manage their portfolios so that their shadow prices stay within a narrow band around the
stable $1.00 NAV. Although per-share market values can differ from $1.0000 because of market
conditions (e.g., interest rates, fund flows, credit quality), the risk-limiting provisions of Rule 2a-7
generally ensure that any such deviations are small under a wide range of market conditions. Thus,
the amortized cost method generally provides a close approximation to a fund’s per-share market
value.
Rule 2a-7 Risk-Limiting Provisions Rule 2a-7 specifies risk-limiting provisions that money market funds must follow if they use the
amortized cost method. The SEC adopted Rule 2a-7 in 1983 and has amended it over the years,
with the most recent changes adopted in January 2010.5 Each revision to Rule 2a-7 has tightened
the rule’s risk-limiting provisions with an eye toward ensuring that funds can maintain a stable
$1.00 NAV.
As money market funds disclose in their prospectuses, they are not insured by the Federal Deposit
Insurance Corporation (FDIC) or any other government agency, and it is possible to lose money by
investing in such funds. Rule 2a-7 is designed to limit the risk of such losses. The basic objective
of Rule 2a-7 is to limit a money market fund’s exposure to credit risk (the risk that a borrower
will not pay its obligations when due), interest rate risk (the risk of significant changes in market
value due to changes in prevailing interest rates), and liquidity risk (the risk funds will be unable
to meet high levels of redemption requests). Rule 2a-7 requires that money market funds hold
high-quality, liquid securities with short maturities, and maintain minimum liquidity standards.

7prICIng oF U.S. MonEy MarkET FUndS
In particular, a money market fund must hold securities that present minimal credit risk and that
mature within 397 days (with exceptions for certain types of securities, including variable- and
floating-rate securities that have a demand feature or have an interest rate reset of no more than
397 days). In addition, the fund must maintain an average (weighted by dollars) portfolio maturity
of no more than 60 days (based on maturity dates or interest rate reset dates) and an average
(weighted by dollars) life of no more than 120 days (based on maturity dates, including the
right to demand repayment of the security within a specified period, and with no consideration
of interest rate reset dates). These limitations (known as weighted average maturity [WAM]
and weighted average life [WAL]) help to reduce interest rate risk and credit risk in a money
market fund’s portfolio. Also, money market funds have minimum daily and weekly liquidity
requirements to meet investors’ redemption requests. Specifically, taxable money market funds
must hold 10 percent of their assets in cash, Treasuries, or securities that mature in one day (daily
liquidity). Both taxable and tax-exempt money market funds must hold 30 percent of their assets
in cash, Treasuries, certain government securities with remaining maturities of 60 days or less,
or securities that will mature or are subject to a demand feature that is exercisable and payable
within five business days (weekly liquidity). Money market funds also must maintain a diversified
portfolio designed to limit a fund’s exposure to the credit risk of any single issuer.
These requirements are minimum standards that money market funds must meet. Many, if not
most, funds hold portfolios that are more conservative, in that they hold securities that are even
less sensitive to credit or interest rate risk than securities meeting the minimum standards set
by Rule 2a-7. For example, while a fund is allowed to have a WAM of up to 60 days, the average
across all taxable money market funds was just 41 days as of January 4, 2011.6
Amortized Cost Method Used to Calculate Stable $1.00 NAVA core feature of a money market fund is its stable $1.00 NAV. A stable $1.00 NAV offers investors
a number of important benefits, in terms of tax, accounting, and recordkeeping simplification. For
example, because a money market fund generally pays out all of its return as an income dividend
to shareholders, investors need not track capital gains and losses. A stable $1.00 NAV also allows
money market funds to offer a range of features valuable to investors, such as checkwriting,
ATM access, and electronic (wire) transfers on a same-day basis. Such options are not generally
available with long-term mutual funds.

8 prICIng oF U.S. MonEy MarkET FUndS
Money market funds are able to maintain a stable $1.00 NAV by valuing securities at their
amortized cost. All mutual funds calculate their net asset values daily. Net asset value is the value
of the fund’s assets, less liabilities, divided by the number of shares outstanding and rounded
to the nearest cent. Fluctuating NAV funds (e.g., equity and bond funds) value their securities
at market prices. Nearly all money market funds, however, use amortized cost to value their
securities, provided that amortized cost remains close to market value.
The amortized cost method makes incremental adjustments to the amortized cost of a security
each day so that when the security matures, its amortized cost equals its face value. Many of
the securities that money market funds invest in—such as commercial paper, Treasury bills,
and certain agency securities—are “discount securities.” Discount securities do not pay explicit
interest. Instead, interest is accrued implicitly.7 When discount securities are first sold, they
typically sell for less than face value, that is, at a discount. At maturity, the investor receives the
face value. The difference between what the investor paid and the amount received at maturity is
implicitly accrued interest. For example, a fund may pay $99.40 for a security that will return $100
in 60 days. The face value of the security is $100; the purchase price of the security is $99.40;
and the discount is $0.60. The fund books the security in its portfolio at an initial amortized cost
of $99.40. The amortized cost method allows the fund to increase the amortized cost value of
the security each day by the amount of the daily interest accrual—generally computed as the
difference between the face value and the purchase price divided by the remaining maturity of
the security. In our example, the daily accrued interest would be one cent ([$100 - $99.40]/60).8
By valuing its securities at amortized cost, a money market fund can maintain a stable $1.00 NAV
because the amortized cost of securities—the purchase price plus accrued interest—increases at
a predictable rate each day. A money market fund declares a daily dividend to fund shareholders
equal to the accrued interest on the fund’s portfolio (less accrued expenses). In our example,
the daily one-cent increment to the amortized cost value of the security is offset by recording
a dividend payment (net of fund expenses) payable to fund shareholders each day. At the end
of each day, the fund’s per-share NAV based on the amortized cost value of the fund’s portfolio
securities has the same accounting value as the day before.9 Thus, from day to day, the fund’s NAV
per share remains stable at $1.00.
9prICIng oF U.S. MonEy MarkET FUndS
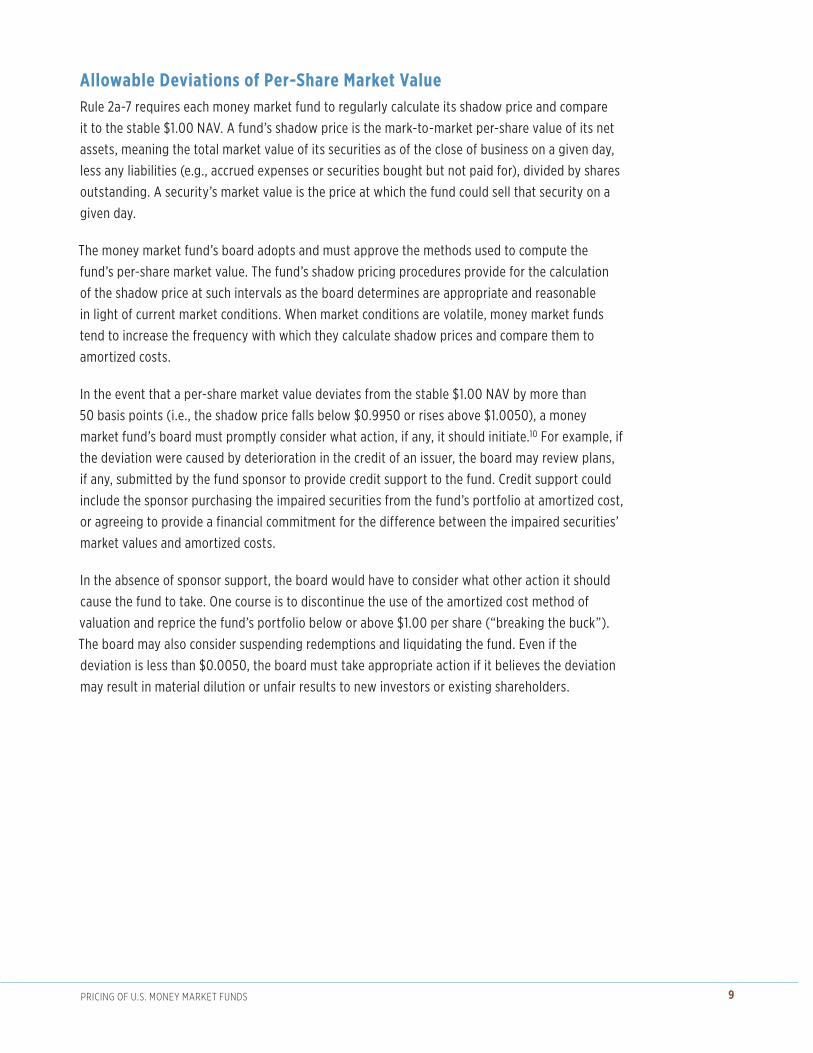
Allowable Deviations of Per-Share Market ValueRule 2a-7 requires each money market fund to regularly calculate its shadow price and compare
it to the stable $1.00 NAV. A fund’s shadow price is the mark-to-market per-share value of its net
assets, meaning the total market value of its securities as of the close of business on a given day,
less any liabilities (e.g., accrued expenses or securities bought but not paid for), divided by shares
outstanding. A security’s market value is the price at which the fund could sell that security on a
given day.
The money market fund’s board adopts and must approve the methods used to compute the
fund’s per-share market value. The fund’s shadow pricing procedures provide for the calculation
of the shadow price at such intervals as the board determines are appropriate and reasonable
in light of current market conditions. When market conditions are volatile, money market funds
tend to increase the frequency with which they calculate shadow prices and compare them to
amortized costs.
In the event that a per-share market value deviates from the stable $1.00 NAV by more than
50 basis points (i.e., the shadow price falls below $0.9950 or rises above $1.0050), a money
market fund’s board must promptly consider what action, if any, it should initiate.10 For example, if
the deviation were caused by deterioration in the credit of an issuer, the board may review plans,
if any, submitted by the fund sponsor to provide credit support to the fund. Credit support could
include the sponsor purchasing the impaired securities from the fund’s portfolio at amortized cost,
or agreeing to provide a financial commitment for the difference between the impaired securities’
market values and amortized costs.
In the absence of sponsor support, the board would have to consider what other action it should
cause the fund to take. One course is to discontinue the use of the amortized cost method of
valuation and reprice the fund’s portfolio below or above $1.00 per share (“breaking the buck”).
The board may also consider suspending redemptions and liquidating the fund. Even if the
deviation is less than $0.0050, the board must take appropriate action if it believes the deviation
may result in material dilution or unfair results to new investors or existing shareholders.

10 prICIng oF U.S. MonEy MarkET FUndS
Amortized Cost Is Normally a Close Approximation of Market ValueBecause money market funds typically hold short-term, high-quality securities, the amortized
cost method usually provides a very good approximation to the market value of a fund’s portfolio.
A security’s amortized cost equals its market value if conditions remain exactly as they were when
the fund purchased the security. In that case, both the security’s amortized cost and its market
value rise daily by the amount of interest accrued.
Financial market conditions, of course, rarely remain the same from day to day. For example,
interest rates change every day. Because the market value of fixed-income securities varies
inversely with interest rates, an increase in interest rates can reduce (and a decline in interest
rates can increase) the market values of the securities that a money market fund holds. However,
such price effects are typically very small for the kinds of short-term, high-quality securities
money market funds hold.
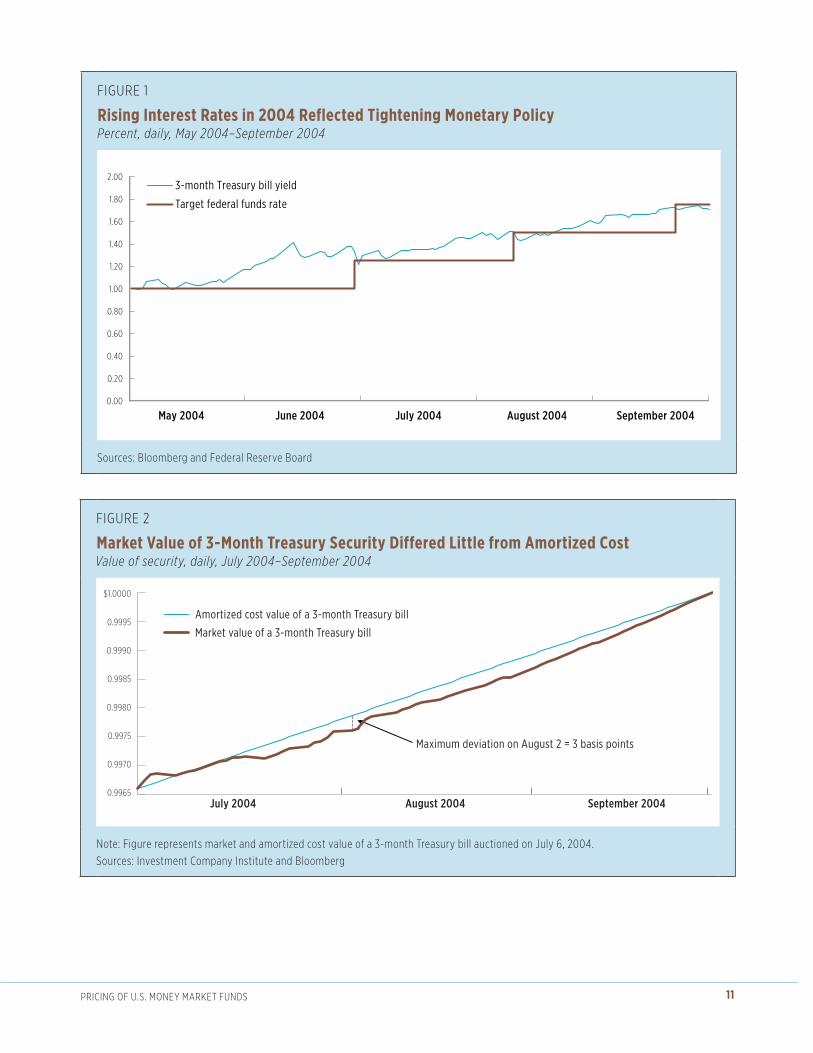
Events in 2004 illustrate this: in July, the Federal Reserve began tightening monetary policy,
causing short-term interest rates to rise (Figure 1). Consequently, the market prices of short-term
Treasury securities fell. In particular, the price of a 3-month Treasury bill issued on July 6, 2004,
fell below its amortized cost value for most of the security’s life (Figure 2). Nevertheless, the
maximum deviation of the market value of the security from its amortized cost was small, only
3 basis points on August 2, 2004. The deviation shrank as the Treasury bill neared its final
maturity, at which time its market price equaled its amortized cost. Thus, during this period, even
a money market fund holding only 3-month Treasury bills would have seen its per-share market
value drop a few basis points below $1.0000. If the fund held those Treasury securities to maturity,
it would have suffered no loss because the fund would have received the full face value, including
interest implicitly accrued from July 6, 2004.11
Factors That Affect Per-Share Market ValuesSeveral key factors affect a money market fund’s shadow price. These include changes in market
interest rates, the weighted average maturity of a fund’s portfolio, net inflows and outflows
of money, gains or losses on the fund’s portfolio securities, and credit events, such as ratings
upgrades, ratings downgrades, or defaults, which affect securities held in the portfolio.12
Fund managers are keenly aware of these factors and their impact on their funds’ shadow prices.
Indeed, the recent amendments to Rule 2a-7 require fund managers to “stress test” their funds
periodically by simulating how a fund’s shadow price might respond to hypothetical changes in
these factors. A fund must report the results of such stress tests to its board at the board’s next
meeting (or more promptly if appropriate in light of the stress test results).
11prICIng oF U.S. MonEy MarkET FUndS
FIgUrE 1
Rising Interest Rates in 2004 Reflected Tightening Monetary PolicyPercent, daily, May 2004–September 2004
0.00
0.20
0.40
0.60
0.80
1.00
1.20
1.40
1.60
1.80
2.00 3-month Treasury bill yield
Target federal funds rate
July 2004 August 2004 September 2004 June 2004 May 2004
Sources: Bloomberg and Federal reserve Board
FIgUrE 2
Market Value of 3-Month Treasury Security Differed Little from Amortized CostValue of security, daily, July 2004–September 2004
0.9965
0.9970
0.9975
0.9980
0.9985
0.9990
0.9995
$1.0000
July 2004 August 2004 September 2004
Market value of a 3-month Treasury bill
Amortized cost value of a 3-month Treasury bill
Maximum deviation on August 2 = 3 basis points
note: Figure represents market and amortized cost value of a 3-month Treasury bill auctioned on July 6, 2004. Sources: Investment Company Institute and Bloomberg

12 prICIng oF U.S. MonEy MarkET FUndS
This section discusses and models the impact of various factors on per-share market values. As
the section illustrates, an exceptionally large change in interest rates is necessary to produce a
significant deviation in a money market fund’s shadow price. Net outflows from a fund (investors’
net redemptions) exacerbate deviations resulting from interest rate fluctuations, but a fund must
receive extraordinary net redemption requests before a fund’s shadow price approaches $0.9950.
Even adverse credit events are unlikely to produce significant deviations in a fund’s per-share
market value unless a fund suffers a default on a significant portfolio holding. Deviations of
shadow prices from $1.0000 tend to be small because of the risk-limiting conditions of Rule 2a-7
and the conservative investment practices of most fund managers, who normally operate well
inside of Rule 2a-7’s limitations.
Changes in Interest RatesOne of the primary drivers of a money market fund’s per-share market value is fluctuations in
market interest rates, a type of market risk often referred to as interest rate risk.
The market values of debt securities vary inversely with interest rates. For example, a fund
buys commercial paper issued today that matures in 60 days and pays an annual interest rate
of 3 percent. If annual interest rates on 60-day commercial paper were to increase by 100 basis
points (1 percentage point) tomorrow, the market value of the commercial paper the fund bought
falls because other investors are now able to purchase commercial paper that is paying 4 percent
annual interest. The commercial paper that is paying 3 percent is less attractive to investors and
as such must have a lower market value to induce investors to buy it. The opposite is true when
interest rates decline. In our example, if interest rates were to decrease by 100 basis points, the
market value of the commercial paper the fund bought would rise. The commercial paper owned
by the fund would pay more in interest payments (3 percent) than what the current market offers
(2 percent), and the fund would receive a higher value for the commercial paper if the fund
manager were to sell it.
Because a money market fund’s shadow price is the per-share market value of the fund’s
portfolio, it will also vary with changes in prevailing market interest rates. Generally, the larger
the change in market interest rates, the larger the impact on a fund’s per-share market value.
Figure 3 demonstrates this relationship for a fund that has an initial shadow price of $1.0000
and a weighted average maturity of 60 days, which is the maximum permitted under Rule 2a-7.
(The importance of weighted average maturity will be discussed further below.) An increase of
200 basis points in market interest rates in one day would reduce the fund’s per-share market

13prICIng oF U.S. MonEy MarkET FUndS
value from $1.0000 to $0.9967, a decline of 33 basis points. Conversely, if interest rates were to
fall 200 basis points, the fund’s shadow price would increase by 33 basis points to $1.0033. In
either case, the fund’s NAV would remain at $1.00.
As part of their stress testing procedures, money market funds gauge the responsiveness of their
per-share market values to large, unexpected changes in interest rates. Large changes in interest
rates are very infrequent. As shown in Figure 4, over the 29-year period from January 1982 to
December 2010, the yield on 3-month Treasury bills increased by more than 100 basis points in a
single day only once, on February 1, 1982 (0.01 percent of all days over the period). Small changes
in rates are much more prevalent; interest rates changed by 25 basis points or less in a single day
on 98 percent of the days in the period (rising on 55 percent of days and falling on 43 percent of
days). As Figure 3 illustrates, a 25 basis-point change in interest rates changes a fund’s shadow
price by only 4 basis points.
FIgUrE 3
A Fund's Shadow Price Varies with Changes in Interest Rates
1-day change in interest rates
Basis points
Resulting shadow price 1-day change in shadow price
Basis points
–300 $1.0050 50
–200 1.0033 33
–100 1.0017 17
–50 1.0008 8
–25 1.0004 4
0 1.0000 0
25 0.9996 –4
50 0.9992 –8
100 0.9983 –17
200 0.9967 –33
300 0.9950 –50
note: Figure presents the resulting shadow price following the indicated change in interest rates. This calculation assumes a weighted-average maturity of 60 days and an initial shadow price of $1.0000.Source: Investment Company Institute
14 prICIng oF U.S. MonEy MarkET FUndS
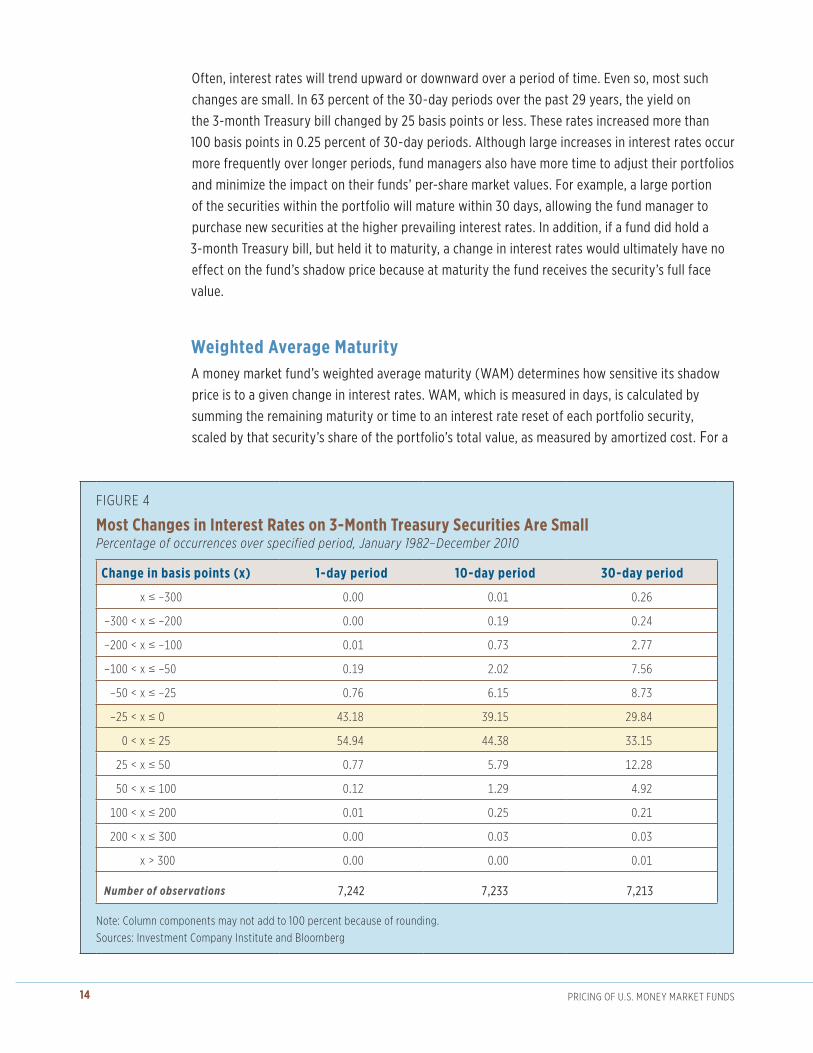
Often, interest rates will trend upward or downward over a period of time. Even so, most such
changes are small. In 63 percent of the 30-day periods over the past 29 years, the yield on
the 3-month Treasury bill changed by 25 basis points or less. These rates increased more than
100 basis points in 0.25 percent of 30-day periods. Although large increases in interest rates occur
more frequently over longer periods, fund managers also have more time to adjust their portfolios
and minimize the impact on their funds’ per-share market values. For example, a large portion
of the securities within the portfolio will mature within 30 days, allowing the fund manager to
purchase new securities at the higher prevailing interest rates. In addition, if a fund did hold a
3-month Treasury bill, but held it to maturity, a change in interest rates would ultimately have no
effect on the fund’s shadow price because at maturity the fund receives the security’s full face
value.
Weighted Average MaturityA money market fund’s weighted average maturity (WAM) determines how sensitive its shadow
price is to a given change in interest rates. WAM, which is measured in days, is calculated by
summing the remaining maturity or time to an interest rate reset of each portfolio security,
scaled by that security’s share of the portfolio’s total value, as measured by amortized cost. For a
FIgUrE 4
Most Changes in Interest Rates on 3-Month Treasury Securities Are SmallPercentage of occurrences over specified period, January 1982–December 2010
Change in basis points (x) 1-day period 10-day period 30-day period
x ( –300 0.00 0.01 0.26
–300 < x ( –200 0.00 0.19 0.24
–200 < x ( –100 0.01 0.73 2.77
–100 < x ( –50 0.19 2.02 7.56
–50 < x ( –25 0.76 6.15 8.73
–25 < x ( 0 43.18 39.15 29.84
0 < x ( 25 54.94 44.38 33.15
25 < x ( 50 0.77 5.79 12.28
50 < x ( 100 0.12 1.29 4.92
100 < x ( 200 0.01 0.25 0.21
200 < x ( 300 0.00 0.03 0.03
x > 300 0.00 0.00 0.01
Number of observations 7,242 7,233 7,213
note: Column components may not add to 100 percent because of rounding.Sources: Investment Company Institute and Bloomberg

15prICIng oF U.S. MonEy MarkET FUndS
given change in interest rates, a money market fund with a longer WAM will experience a larger
change in its shadow price than a similar fund with a shorter WAM. Figure 5 illustrates this by
comparing three funds, which each have the same credit profile and an initial per-share market
value of $1.0000. Fund A has a 45-day WAM, Fund B a 60-day WAM, and Fund C a 90-day WAM.
A 1 percentage point increase in interest rates will reduce the shadow prices of all three, but the
per-share market value of Fund C will decline the most (from $1.0000 to $0.9975, i.e., 25 basis
points). This relationship holds because for a specific increase (or decrease) in interest rates, the
market value of a security with a longer remaining maturity will fall (or rise) more than the same
security with a shorter remaining maturity.13
In January 2010, the SEC lowered the maximum allowable WAM of a money market fund’s
portfolio from 90 days to 60 days. Most funds typically have had weighted average maturities
well below these limits. For example, in August 2008, the average prime money market fund
had a weighted average maturity of 42 days14—less than half the allowed maximum at that time.
Certain funds did, however, have WAMs in excess of 60 days, which was allowable at that time.
Figure 5 demonstrates that the SEC’s decision to reduce the maximum allowable WAM to 60 days
has the potential to significantly reduce volatility in shadow prices arising from changes in interest
rates.
FIgUrE 5
Weighted Average Maturity Determines Sensitivity of a Fund’s Shadow Price to Changes in Interest Rates
0.9950
0.9960
0.9970
0.9980
0.9990
1.0000
1.0010
1.0020
1.0030
1.0040
$1.0050
-5 -4 -3 -2 -1 0 1 2 3 4 5
1-day percentage point change in interest rates
Fund A with 45-day WAM
Fund B with 60-day WAM
Fund C with 90-day WAM*
Shadow price
Shadow price = $0.9988
Shadow price = $0.9983
Shadow price = $0.9975
*no longer permitted under rule 2a-7.note: Figure indicates the resulting shadow price for a given change in interest rates. The initial shadow price is $1.0000. Source: Investment Company Institute
16 prICIng oF U.S. MonEy MarkET FUndS
Net Inflows and Outflows Funds’ shadow prices are sensitive to investors’ purchases and redemptions of shares. Net inflows
or outflows of money to the fund can magnify any existing deviation between a fund’s shadow
price and its $1.00 NAV. If a fund has a realized or unrealized capital gain or loss in any of its
portfolio holdings, net purchases or sales of the fund’s shares at a stable NAV of $1.00 will spread
the gain or loss across the remaining number of fund shares, altering the fund’s per-share market
value.
For example, suppose that today a fund with 1 million shares has net assets with a market value
of $1,000,000, giving the fund a shadow price of $1.0000. Tomorrow, one of the fund’s securities
appreciates in value by $1,000. The fund’s per-share market value therefore rises to $1.0010
(Figure 6, blue line). If investors subsequently redeem, on net, 50 percent of the fund’s assets
($500,000) at the fund’s $1.00 NAV, the fund’s shadow price will rise to $1.0020 (the $501,000
remaining market value of the portfolio divided by the remaining 500,000 shares). This occurs
because investors who cash out at the fund’s $1.00 NAV leave behind the entire value of the
unrealized capital gain.
Suppose, in contrast, that a fund begins today with net assets at a market value of $1,000,000,
but tomorrow suffers an unrealized capital loss of $1,000 on one of its securities. In that case,
the fund’s per-share market value falls to $0.9990 (Figure 6, red line). If investors subsequently
redeem, on net, 50 percent of the fund’s assets, the fund’s shadow price will fall to $0.9980 (the
remaining market value of $499,000 divided by 500,000 shares). This occurs because investors
redeem out at the fund’s $1.00 NAV, incurring none of the unrealized capital loss remaining
behind in the fund’s securities.
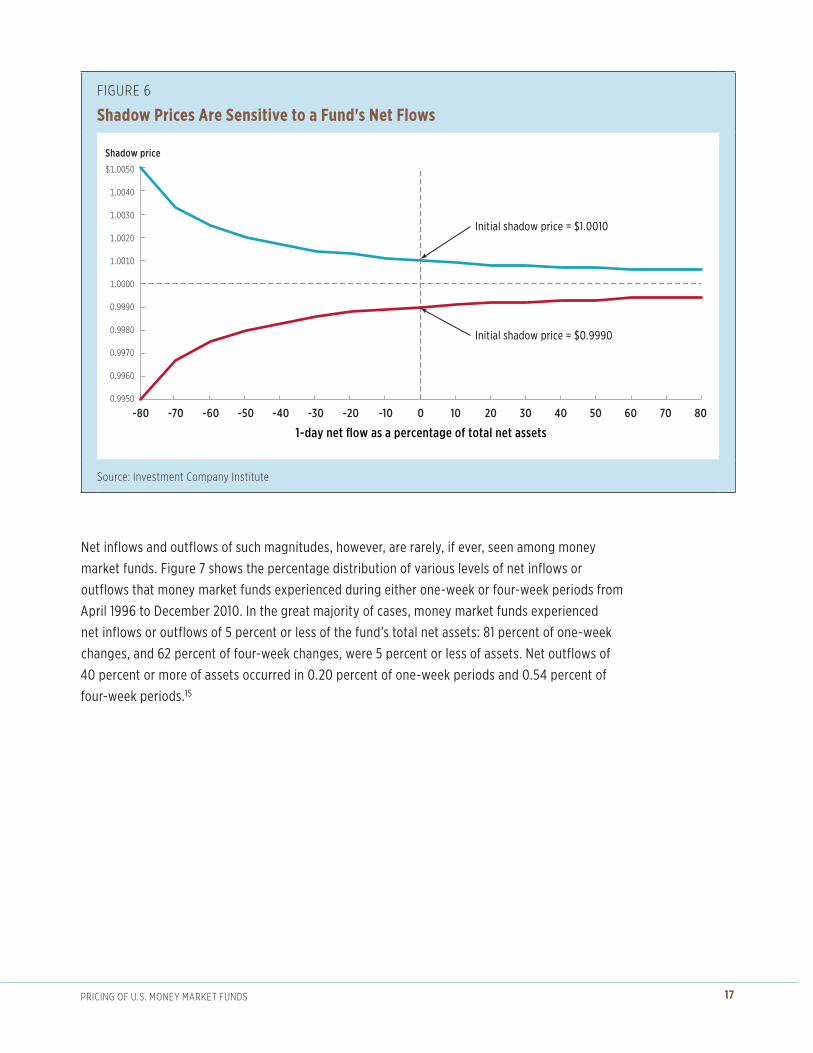
As Figure 6 shows, the effects of net inflows and outflows on a fund’s shadow price are not linear.
Increasingly larger net outflows have an increasingly larger effect on the shadow price of a fund
that has unrealized capital gains or losses. This also means that extraordinarily large net outflows
would be necessary to reduce the per-share market value of the fund with a capital loss much
below an initial level of $0.9990. For example, this fund’s shadow price would not fall to $0.9950
unless the fund experienced net outflows of 80 percent of the fund’s assets.
17prICIng oF U.S. MonEy MarkET FUndS
FIgUrE 6
Shadow Prices Are Sensitive to a Fund's Net Flows
80706050403020100-10-20-30-40-50-60-70-80
Initial shadow price = $1.0010
Initial shadow price = $0.9990
1-day net flow as a percentage of total net assets
0.9950
0.9960
0.9970
0.9980
0.9990
1.0000
1.0010
1.0020
1.0030
1.0040
$1.0050
Shadow price
Source: Investment Company Institute
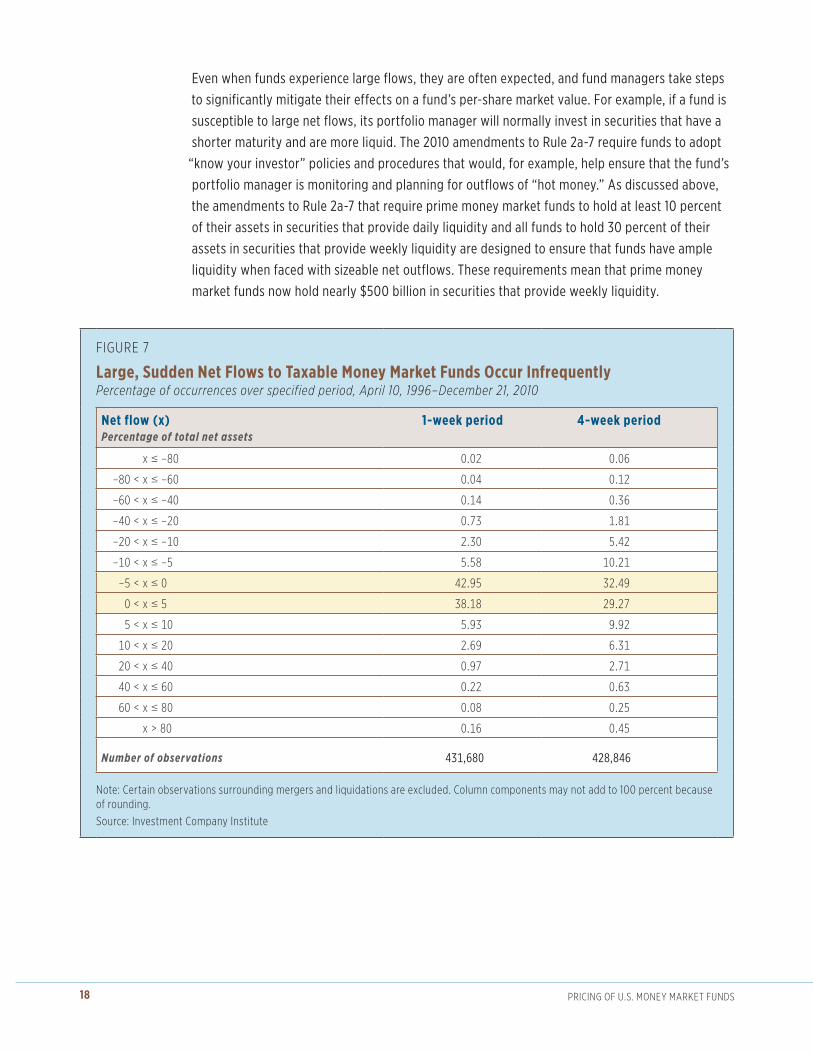
Net inflows and outflows of such magnitudes, however, are rarely, if ever, seen among money
market funds. Figure 7 shows the percentage distribution of various levels of net inflows or
outflows that money market funds experienced during either one-week or four-week periods from
April 1996 to December 2010. In the great majority of cases, money market funds experienced
net inflows or outflows of 5 percent or less of the fund’s total net assets: 81 percent of one-week
changes, and 62 percent of four-week changes, were 5 percent or less of assets. Net outflows of
40 percent or more of assets occurred in 0.20 percent of one-week periods and 0.54 percent of
four-week periods.15
18 prICIng oF U.S. MonEy MarkET FUndS
Even when funds experience large flows, they are often expected, and fund managers take steps
to significantly mitigate their effects on a fund’s per-share market value. For example, if a fund is
susceptible to large net flows, its portfolio manager will normally invest in securities that have a
shorter maturity and are more liquid. The 2010 amendments to Rule 2a-7 require funds to adopt
“know your investor” policies and procedures that would, for example, help ensure that the fund’s
portfolio manager is monitoring and planning for outflows of “hot money.” As discussed above,
the amendments to Rule 2a-7 that require prime money market funds to hold at least 10 percent
of their assets in securities that provide daily liquidity and all funds to hold 30 percent of their
assets in securities that provide weekly liquidity are designed to ensure that funds have ample
liquidity when faced with sizeable net outflows. These requirements mean that prime money
market funds now hold nearly $500 billion in securities that provide weekly liquidity.
FIgUrE 7
Large, Sudden Net Flows to Taxable Money Market Funds Occur InfrequentlyPercentage of occurrences over specified period, April 10, 1996–December 21, 2010
Net flow (x)Percentage of total net assets
1-week period 4-week period
x ( –80 0.02 0.06
–80 < x ( –60 0.04 0.12
–60 < x ( –40 0.14 0.36
–40 < x ( –20 0.73 1.81
–20 < x ( –10 2.30 5.42
–10 < x ( –5 5.58 10.21
–5 < x ( 0 42.95 32.49
0 < x ( 5 38.18 29.27
5 < x ( 10 5.93 9.92
10 < x ( 20 2.69 6.31
20 < x ( 40 0.97 2.71
40 < x ( 60 0.22 0.63
60 < x ( 80 0.08 0.25
x > 80 0.16 0.45
Number of observations 431,680 428,846
note: Certain observations surrounding mergers and liquidations are excluded. Column components may not add to 100 percent because of rounding.Source: Investment Company Institute

19prICIng oF U.S. MonEy MarkET FUndS
FIgUrE 8
Net Outflows and Changes in Interest Rates Together Influence a Fund’s Shadow Price
0%
10%
20%
30%
40%
50%
60%
70%
1.0 1.2 1.4 1.6 1.8 2.0 2.2 2.4 2.6 2.8 3.0
1-da
y ne
t out
flow
s as
a p
erce
ntag
e of
fund
ass
ets
1-day percentage point increase in short-term interest rates
Region where fund is at risk of“breaking the buck”
(shadow price < $0.9950)
Region of stable $1.00 NAV($0.9950 ≤ shadow price ≤ $1.0000)
note: Figure assumes short-term interest rates are initially at 1 percent and the fund has the maximum permitted weighted average maturity of 60 days.Source: Investment Company Institute
Combining the Effects of Interest Rate Changes and Net FlowsA fund must understand and assess how various factors may affect its shadow price. These
factors may, at times, move shadow prices in the same direction or, at other times, in opposite
directions. For example, if a fund receives inflows while interest rates are rising, its per-share
market value will fall less than if the fund had received no new money. Even when these factors
work in the same direction, a fund’s shadow price may not move much.
To illustrate this point, Figure 8 shows combinations of interest rate changes (horizontal axis)
and net investor redemptions (vertical axis) that could lead a fund’s shadow price to drop below
$0.9950. The figure assumes a hypothetical fund with a weighted average maturity of 60 days,
the maximum allowed by Rule 2a-7. Suppose interest rates were to jump by 1 percentage point
overnight. As noted above, that would be a very large, unusual increase, one which would put
downward pressure on a fund’s per-share market value. Even then, investors would have to
redeem nearly 70 percent of the fund’s assets before the fund’s shadow price would approach
$0.9950 (yellow-shaded area).

20 prICIng oF U.S. MonEy MarkET FUndS
Credit Events Prime money market funds hold a variety of high-quality,16 short-term corporate debt securities
(e.g., commercial paper, medium-term notes, and bonds with less than 397 days remaining
maturity) that offer premiums over yields on Treasury securities. Investors in corporate debt
securities require this yield premium because of the greater credit risk they bear from holding
these securities.
Deterioration in a security’s credit quality will cause its price to fall and, in turn, will reduce the
shadow price of a money market fund holding such a security. Over the period December 1988
to December 2010, second-tier securities, on average, had yields 23 basis points above those on
top-tier securities. During periods of financial stress, this spread can widen as market participants
become more reluctant to bear credit risk. Figure 9 shows that during the height of the financial
crisis in the fourth quarter of 2008, the spread between rates on 30-day second-tier and 30-day
top-tier commercial paper rose rapidly to 488 basis points. This meant that market values of
second-tier commercial paper dropped relative to those of top-tier commercial paper.
Although a decline in credit quality of a particular security will cause its market value to decline,
the overall impact on a fund’s shadow price is often small. Figure 10 shows the effect on a fund’s
FIgUrE 9
Spread Between Second-Tier and Top-Tier 30-Day Commercial Paper Rates1
Basis points, weekly,2 December 1988–December 2010
0
100
200
300
400
500
600
1988
1989
1990
1991
1992
1993
1994
1995
1996
1997
1998
1999
2000
2001
2002
2003
2004
2005
2006
2007
2008
2009
2010
1 The spread is the difference between the yield on second-tier commercial paper and the yield on top-tier commercial paper. Top-tier commercial paper is typically rated a1/p1/F1. Second-tier commercial paper is typically rated a2/p2/F2.
2 Shown as a rolling weekly average.Source: Bloomberg

21prICIng oF U.S. MonEy MarkET FUndS
FIgUrE 10
Sensitivity of a Fund’s Shadow Price to an Issuer Downgrade
Remaining days to maturity of downgraded security
90 60 30 0
Downgraded security represents 1% of fund assets and its yield rises
100 basis points
resulting shadow price $0.99997 $0.99998 $0.99999 $1.00000
deviation from $1.00000 (basis points) -0.3 -0.2 -0.1 0.0
400 basis points
resulting shadow price $0.99990 $0.99993 $0.99997 $1.00000
deviation from $1.00000 (basis points) -1.0 -0.7 -0.3 0.0
Downgraded security represents 5% of fund assets and its yield rises
100 basis points
resulting shadow price $0.99987 $0.99992 $0.99996 $1.00000
deviation from $1.00000 (basis points) -1.3 -0.8 -0.4 0.0
400 basis points
resulting shadow price $0.99950 $0.99967 $0.99983 $1.00000
deviation from $1.00000 (basis points) -5.0 -3.3 -1.7 0.0
note: Figure represents the shadow price of a fund with the indicated percentage of its portfolio subjected to the indicated rise in interest rates as the result of a downgrade. The fund’s shadow price is assumed initially to be $1.00000, and it and the resulting shadow price are shown to the fifth decimal place in order to measure the impact of the downgrade. The sensitivity test assumes there are no subsequent downgrades, and that the market value of the remaining securities in the portfolio equals amortized cost.Source: Investment Company Institute
per-share market value if the credit quality of one of its securities changes abruptly. Initially,
the shadow price of a fund would decline after such an event because the market value of the
security would fall as market participants reassessed the credit-worthiness of the borrower. The
magnitude of the decline in the per-share market value would depend on how much the interest
rate rose for the borrower to issue new securities, as well as the share of the fund’s portfolio
invested in the security issued at the old interest rate. For example, if the new interest rate on
90-day securities issued by a particular borrower was 100 basis points higher and a money market
fund had 1 percent of its portfolio in this borrower’s 90-day securities at the old, lower interest
rate, the fund’s shadow price would decline by only 0.5 basis points, or five one-thousandths of
a cent. Even if the interest rate for the borrower to issue new 90-day securities rose by 400 basis
points and 5 percent of the fund was invested in the old security, the fund’s per-share market
value would decline by only 5 basis points (from $1.0000 to $0.9995).17 In either case, the fund’s
shadow price would return to $1.0000 if the fund held the security to maturity and the security
did not experience a further deterioration in credit quality or a default. Here, as before, the fund
maintains a stable $1.00 NAV.

22 prICIng oF U.S. MonEy MarkET FUndS
Fund managers constantly monitor the credit quality of their portfolios to ensure that fund
assets pose minimal credit risks. Should an issuer’s credit quality deteriorate, in most cases fund
managers have time to react, such as by choosing not to reinvest in a firm’s commercial paper as
it matures. It would be unusual for the credit quality of a security to change all in one day. Rather,
investors would typically reassess the credit quality of an issuer over a period of time, causing
interest rates on its securities to rise over the course of weeks or months.
Fund managers are also mindful of the interactions of economic activity on the credit quality
of their securities. When the economy is expanding and corporate profit growth is rising, the
overall credit quality of firms generally improves. As economic activity slows and profit growth
drops off, credit quality can decline. Funds can monitor credit quality by watching such indicators
as yields on individual securities, premiums on credit default swaps, changes in credit ratings,
and corporate financial statements. Credit rating downgrades often “cluster” together during
recessions, while upgrades cluster during expansions (Figure 11).
Because lower-rated securities have a higher probability of defaulting, Rule 2a-7 places strict
limits on money market funds’ holdings of second-tier securities. A fund cannot invest more than
3 percent of its assets in second-tier securities, cannot invest more than 0.5 percent of its assets
in second-tier securities issued by any single issuer, and cannot buy second-tier securities that
mature in more than 45 days. It is possible for even top-tier borrowers to default, so Rule 2a-7
FIgUrE 11
Short-Term Corporate Ratings Actions Tend to ClusterQuarterly, 2000–2010
100
80
60
40
20
0
20
40
60
20102009200820072006200520042003200220012000
Number of rating changes by Standard & Poor’s
Upgr
ades
Do
wng
rade
s
Source: Bloomberg
23prICIng oF U.S. MonEy MarkET FUndS
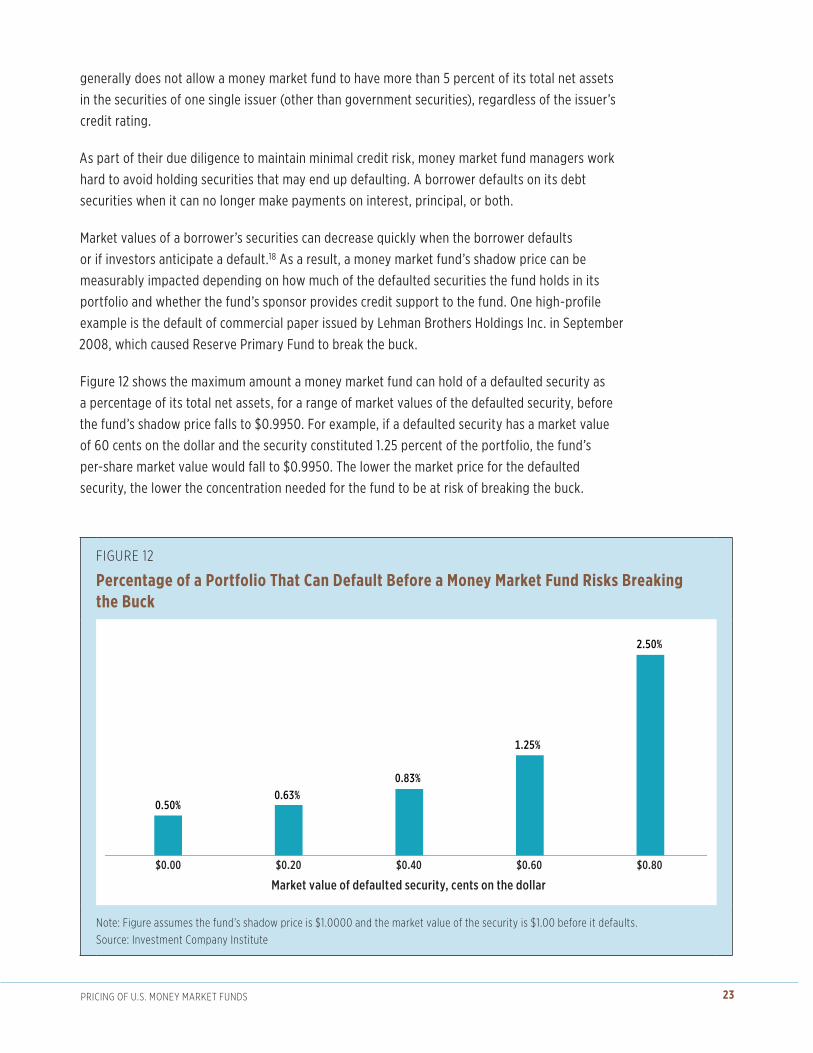
FIgUrE 12
Percentage of a Portfolio That Can Default Before a Money Market Fund Risks Breaking the Buck
$0.80$0.40$0.20 $0.60$0.00
0.50% 0.63%
0.83%
2.50%
1.25%
Market value of defaulted security, cents on the dollar
note: Figure assumes the fund’s shadow price is $1.0000 and the market value of the security is $1.00 before it defaults.Source: Investment Company Institute
generally does not allow a money market fund to have more than 5 percent of its total net assets
in the securities of one single issuer (other than government securities), regardless of the issuer’s
credit rating.
As part of their due diligence to maintain minimal credit risk, money market fund managers work
hard to avoid holding securities that may end up defaulting. A borrower defaults on its debt
securities when it can no longer make payments on interest, principal, or both.
Market values of a borrower’s securities can decrease quickly when the borrower defaults
or if investors anticipate a default.18 As a result, a money market fund’s shadow price can be
measurably impacted depending on how much of the defaulted securities the fund holds in its
portfolio and whether the fund’s sponsor provides credit support to the fund. One high-profile
example is the default of commercial paper issued by Lehman Brothers Holdings Inc. in September
2008, which caused Reserve Primary Fund to break the buck.
Figure 12 shows the maximum amount a money market fund can hold of a defaulted security as
a percentage of its total net assets, for a range of market values of the defaulted security, before
the fund’s shadow price falls to $0.9950. For example, if a defaulted security has a market value
of 60 cents on the dollar and the security constituted 1.25 percent of the portfolio, the fund’s
per-share market value would fall to $0.9950. The lower the market price for the defaulted
security, the lower the concentration needed for the fund to be at risk of breaking the buck.

24 prICIng oF U.S. MonEy MarkET FUndS
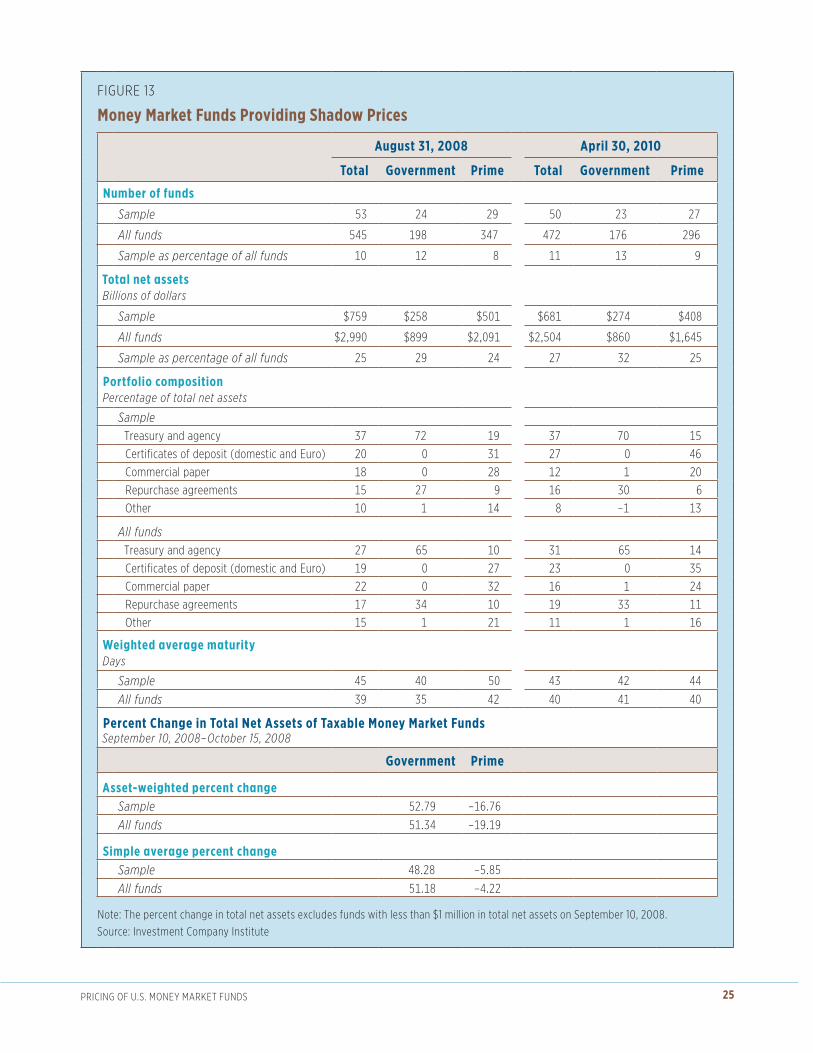
How Have Funds’ Shadow Prices Behaved Historically?The previous section uses modeling to illustrate how a number of factors influence a fund’s
per-share market value. To show how these factors have played out in actual market conditions,
ICI collected weekly data on shadow prices from a sample of 53 taxable money market funds.19 As
Figure 13 shows, in April 2010, these funds accounted for 11 percent of the number and 27 percent
of the assets of all taxable money market funds, about the same percentages as in August 2008.
The sample includes both government money market funds (those that invest only in Treasury and
U.S. agency securities) and prime money market funds (those that may also invest in short-term
debt issued by the private sector, such as commercial paper, repurchase agreements, certificates
of deposit, or Eurodollar deposits).
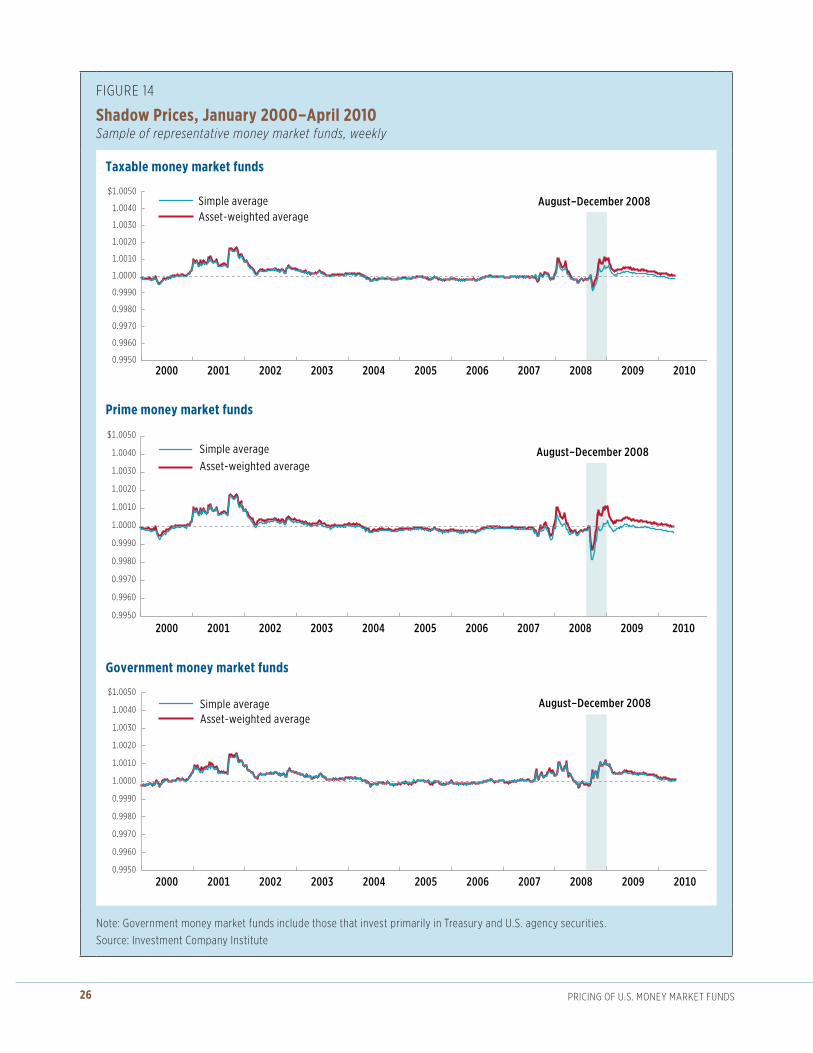
Figure 14 summarizes the per-share market values of these money market funds over the period
January 1, 2000, to April 30, 2010. The top panel of Figure 14 shows shadow prices for taxable
money market funds in the sample (i.e., prime and government money market funds combined);
the middle and bottom panels show them for the two groups of funds separately. The figure
plots the average shadow price for these money market funds (“simple average”), as well as the
average shadow price weighted by each fund’s assets (“asset-weighted average”). The horizontal
line at $1.0000 represents the per-share market value matching the stable $1.00 NAV. The
vertical scale represents a band around $1.0000 of plus or minus 50 basis points, or one-half cent
($0.0050).
The figure shows that shadow prices have sometimes been above, and at other times below,
$1.0000. For example, in 2001 and 2002, they were generally above $1.0000. During this period,
the Federal Reserve reduced interest rates sharply to counter the 2001 recession that followed the
bursting of the “dot-com” bubble in 2000.20 As a result, yields on money market instruments fell,
and their prices, which move inversely with interest rates, rose, boosting funds’ per-share market
values.
The period from 2003 to 2006 was one of relative calm for financial markets. The economy was
recovering from the recession in 2001. Monetary policy remained on hold throughout much of
2003 and 2004. Beginning in mid-2004, the Federal Reserve began a long, slow tightening of
monetary policy. Yields on money market instruments increased about 400 basis points during
this period, putting gradual downward pressure on their prices. Credit conditions generally
improved, though, and credit spreads, such as the difference between yields on commercial paper
and Treasury bills, were small. In combination, these effects generally resulted in funds’ shadow
prices being below $1.0000 over this period, but the deviations were typically small, averaging
only a few basis points. This shows that per-share market values can and do deviate from the
stable $1.00 NAV during periods of financial stability; the mere fact that a fund’s shadow price
drops below $1.0000 does not necessarily suggest a cause for concern.
25prICIng oF U.S. MonEy MarkET FUndS
FIgUrE 13
Money Market Funds Providing Shadow Prices
August 31, 2008 April 30, 2010
Total Government Prime Total Government Prime
Number of funds
Sample 53 24 29 50 23 27
All funds 545 198 347 472 176 296
Sample as percentage of all funds 10 12 8 11 13 9
Total net assets Billions of dollars
Sample $759 $258 $501 $681 $274 $408
All funds $2,990 $899 $2,091 $2,504 $860 $1,645
Sample as percentage of all funds 25 29 24 27 32 25
Portfolio composition Percentage of total net assets
SampleTreasury and agency 37 72 19 37 70 15
Certificates of deposit (domestic and Euro) 20 0 31 27 0 46
Commercial paper 18 0 28 12 1 20
repurchase agreements 15 27 9 16 30 6
other 10 1 14 8 –1 13
All fundsTreasury and agency 27 65 10 31 65 14
Certificates of deposit (domestic and Euro) 19 0 27 23 0 35
Commercial paper 22 0 32 16 1 24
repurchase agreements 17 34 10 19 33 11
other 15 1 21 11 1 16
Weighted average maturity Days
Sample 45 40 50 43 42 44
All funds 39 35 42 40 41 40
Percent Change in Total Net Assets of Taxable Money Market FundsSeptember 10, 2008–October 15, 2008
Government Prime
Asset-weighted percent changeSample 52.79 –16.76
All funds 51.34 –19.19
Simple average percent changeSample 48.28 –5.85
All funds 51.18 –4.22
note: The percent change in total net assets excludes funds with less than $1 million in total net assets on September 10, 2008.Source: Investment Company Institute
26 prICIng oF U.S. MonEy MarkET FUndS
FIgUrE 14
Shadow Prices, January 2000–April 2010Sample of representative money market funds, weekly
0.9950
0.9960
0.9970
0.9980
0.9990
1.0000
1.0010
1.0020
1.0030
1.0040
$1.0050
2000 2001 2002 2003 2004 2005 2006 2007 2008 2009 2010
Taxable money market funds
Simple average Asset-weighted average
0.9950
0.9960
0.9970
0.9980
0.9990
1.0000
1.0010
1.0020
1.0030
1.0040
$1.0050
2000 2001 2002 2003 2004 2005 2006 2007 2008 2009 2010
Prime money market funds
Simple average Asset-weighted average
0.9950
0.9960
0.9970
0.9980
0.9990
1.0000
1.0010
1.0020
1.0030
1.0040
$1.0050
2000 2001 2002 2003 2004 2005 2006 2007 2008 2009 2010
Government money market funds
Simple average Asset-weighted average
August–December 2008
August–December 2008
August–December 2008
note: government money market funds include those that invest primarily in Treasury and U.S. agency securities.Source: Investment Company Institute

27prICIng oF U.S. MonEy MarkET FUndS
The period from mid-2007 to mid-2009 comprises the recent financial crisis, including the severe
redemption pressure that some money market funds experienced in September 2008 after the
failure of Lehman Brothers. Figure 14 highlights the months August to December 2008 (shaded
period). During this time, the shadow prices of prime money market funds in the sample on
average fell below $1.0000 before recovering to about $1.0000 by the end of that year. Over the
same period, the shadow prices of government money market funds rose above $1.0000 and
remained there, even throughout 2009.
To better understand these developments, Figure 15 focuses on the period August to December
2008. Shadow prices on average moved little, if at all, in the weeks leading up to the failure of
Lehman Brothers. For example, in the week ending Wednesday, September 10, 200821—just two
business days before Lehman Brothers failed—shadow prices for prime money market funds
remained very close to $1.0000. It was not until the following week (labeled as the week of
September 17), after Lehman Brothers had failed, that per-share market values on average fell
noticeably below $1.0000 for prime money market funds.22
This is not a statistical artifact of averages hiding details: for the week ending September 10,
90 percent of prime money market funds in the sample had shadow prices within 5 basis points
of $1.0000 (in the range of $0.9996 to $1.0005). Even for the week ending September 17, after
Lehman Brothers had failed, the vast majority of prime funds saw their per-share market values
fall relatively little: 93 percent of funds in the sample still had shadow prices greater than $0.9975,
and none had one within 10 basis points of $0.9950.
One argument offered in support of disclosure of money market funds’ per-share market values
is that disclosure might help investors make more informed decisions regarding purchasing or
redeeming fund shares. Figure 15 demonstrates, however, that shadow prices did not provide an
“early warning” about events to come.
There are at least two major reasons for this. First, many funds simply did not hold Lehman
Brothers debt as the firm’s condition deteriorated. Many funds that had held Lehman Brothers
debt eliminated such positions well before September 2008. Other funds had never held Lehman
Brothers debt. Thus, there is no reason their per-share market values would have responded to
the default of Lehman Brothers per se.
Second, market participants did not anticipate the general and severe deterioration in money
market conditions around the time Lehman Brothers failed. Although the viability of Lehman
Brothers had been questioned for several months, some market participants expected even
as late as Friday, September 12, 2008, that the federal government might provide assistance
to allow an orderly wind-down or buyout of Lehman Brothers, as it had with The Bear Stearns
Companies, Inc. in March 2008. Over the weekend of September 13–14, 2008, the federal
government considered offering assistance to Lehman Brothers, but then decided against that
course. The firm collapsed on September 15. While the failure of Lehman Brothers by itself might
have been manageable, the government’s decision not to aid Lehman Brothers, after it supported

28 prICIng oF U.S. MonEy MarkET FUndS
FIgUrE 15
Shadow Prices, August 6, 2008–December 24, 2008Sample of representative money market funds, weekly
0.9950
0.9960
0.9970
0.9980
0.9990
1.0000
1.0010
1.0020
1.0030
1.0040
$1.0050
8/6 8/13 8/20 8/27 9/3 9/10 9/17 9/24 10/1 10/8 10/15 10/22 10/29 11/5 11/12 11/19 11/26 12/3 12/10 12/17 12/24
Taxable money market funds
Simple average Asset-weighted average
Simple average Asset-weighted average
Simple average Asset-weighted average
0.9950
0.9960
0.9970
0.9980
0.9990
1.0000
1.0010
1.0020
1.0030
1.0040
$1.0050
Prime money market funds
0.9950
0.9960
0.9970
0.9980
0.9990
1.0000
1.0010
1.0020
1.0030
1.0040
$1.0050
Government money market funds
8/6 8/13 8/20 8/27 9/3 9/10 9/17 9/24 10/1 10/8 10/15 10/22 10/29 11/5 11/12 11/19 11/26 12/3 12/10 12/17 12/24
8/6 8/13 8/20 8/27 9/3 9/10 9/17 9/24 10/1 10/8 10/15 10/22 10/29 11/5 11/12 11/19 11/26 12/3 12/10 12/17 12/24
note: government money market funds include those that invest primarily in Treasury and U.S. agency securities.Source: Investment Company Institute
29prICIng oF U.S. MonEy MarkET FUndS
the larger Bear Stearns, led market participants to reassess the notion of “too big to fail” and
thereby also to reprice risk for all financial institutions. In addition, financial markets were hit
simultaneously by a series of other negative events. On September 15, American International
Group, Inc. (AIG), the large insurance concern that had guaranteed a vast amount of debt
securities by selling credit default swaps, appeared to be on the verge of failure.23 A credit
downgrade on September 15 triggered a run on Washington Mutual Inc., which was taken over by
the FDIC. And concerns rapidly surfaced that the debt of several other large financial institutions
was much riskier than previously thought.
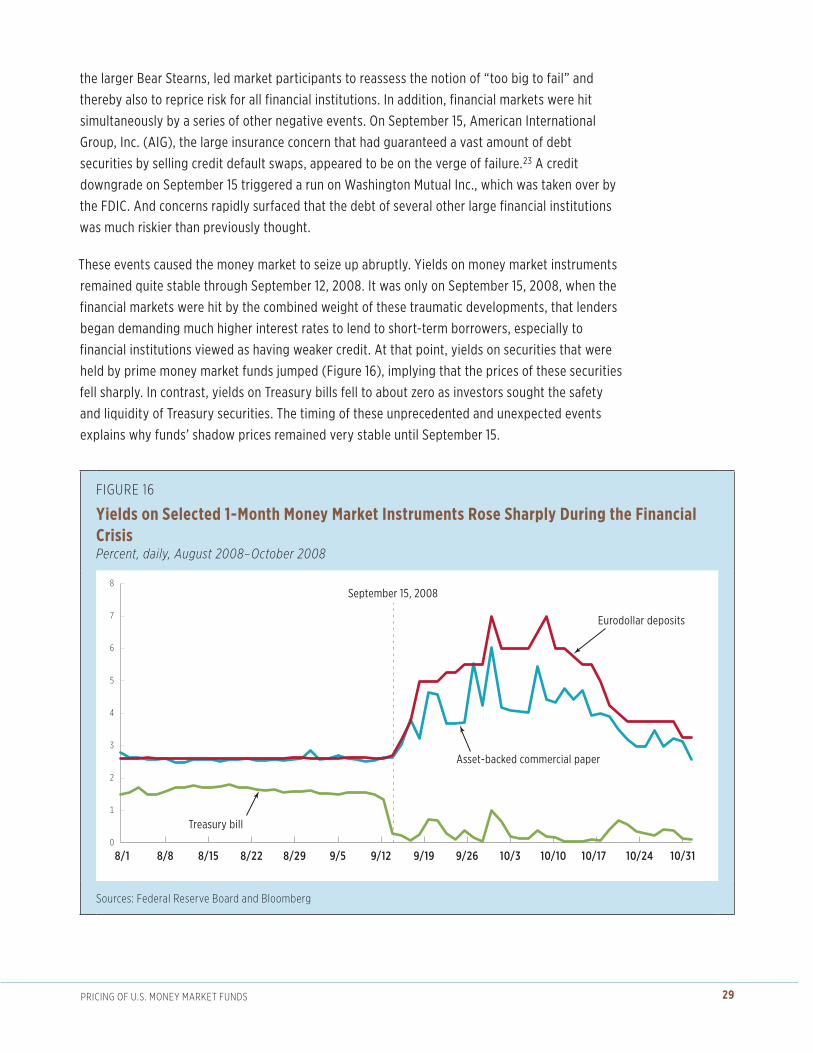
These events caused the money market to seize up abruptly. Yields on money market instruments
remained quite stable through September 12, 2008. It was only on September 15, 2008, when the
financial markets were hit by the combined weight of these traumatic developments, that lenders
began demanding much higher interest rates to lend to short-term borrowers, especially to
financial institutions viewed as having weaker credit. At that point, yields on securities that were
held by prime money market funds jumped (Figure 16), implying that the prices of these securities
fell sharply. In contrast, yields on Treasury bills fell to about zero as investors sought the safety
and liquidity of Treasury securities. The timing of these unprecedented and unexpected events
explains why funds’ shadow prices remained very stable until September 15.
FIgUrE 16
Yields on Selected 1-Month Money Market Instruments Rose Sharply During the Financial CrisisPercent, daily, August 2008–October 2008
0
1
2
3
4
5
6
7
8
10/3110/2410/1710/1010/39/269/199/129/58/298/228/158/88/1
Treasury bill
Asset-backed commercial paper
Eurodollar deposits
September 15, 2008
Sources: Federal reserve Board and Bloomberg

30 prICIng oF U.S. MonEy MarkET FUndS
Summing Up the Historical Evidence on Money Market Funds’ Shadow PricesIn sum, shadow prices can and do deviate from $1.0000 and the stable $1.00 NAV, even during
times when financial markets are largely stable. Such deviations generally should be no cause of
concern to money market fund investors. Instead, they typically reflect the random variation in
financial market prices that occur on a daily basis as the result of any number of developments—
including fluctuations in interest rates, changes in investors’ purchase and redemption behavior,
and changes in funds’ weighted average maturities. These variations do not necessarily have any
implication for money market funds or their investors because money market funds tend to follow
“buy and hold to maturity” strategies. In fact, because a fund’s WAM cannot exceed the 60 days
between when a shadow price is determined and when it first becomes available on the SEC’s
website, any deviation between the fund’s per-share market value and its stable $1.00 NAV may
have been eliminated or substantially reduced by the time the shadow price is publicly disclosed.
In contrast, shadow prices can deviate more noticeably from $1.0000 as a result of significant
credit defaults or extreme market disruptions. In these circumstances, however, shareholders are
more likely to learn about the event through headlines in the financial media than by checking
their fund’s shadow price. With respect to credit events in particular, shareholders can check their
fund’s website for monthly portfolio information that should allow them to determine whether,
and to what extent, their fund held securities affected by the event as of the date of the posting.
This information could allow shareholders to assess the potential impact of such an event on the
fund’s shadow price and its ability to maintain a stable $1.00 NAV.

31prICIng oF U.S. MonEy MarkET FUndS
Notes1 Money Market Fund Reform, SEC Release No. IC-29132 (February 23, 2010), 75 FR 10060
(March 4, 2010).
2 Data published on January 31, 2011, will thus disclose shadow prices as of November 30, 2010.
3 One basis point is 0.01 percentage point; 100 basis points equal 1 percentage point. One basis point applied to $1.00 is $0.0001; 100 basis points equal 1 cent.
4 Previously, these shadow prices had been reported to the SEC only on Form N-SAR, a semiannual report filed by all mutual funds and made public on EDGAR.
5 For further details, see “Money Market Fund Reforms: 2010 SEC Amendments,” available at www.ici.org/policy/regulation/products/money_market/10_mmfs_2010sec.
6 Based on a tabulation of data from iMoneyNet.
7 Money market funds may also invest in “coupon securities,” which pay explicit interest. Such securities are also valued at amortized cost.
8 Daily accrued interest in this example is based on a straight-line amortization over the 60-day period.
9 In the example, the fund every day will record the following separate, specific transactions. First, the fund will increase the amortized cost of this security by one penny ($0.01). At the end of 60 days, the fund will have neither gain nor loss when the security matures and it receives $100 (as its amortized cost has increased from $99.40 to $100). Second, the fund will accrue one penny of income and record two offsetting entries: one for the portion of the penny that reflects the allocable share of the fund’s expenses and a second for the remainder of the penny that will be paid to shareholders as a dividend. These offsetting transactions—one penny of income and two amounts totaling one penny attributable to expenses and dividends payable—cause the fund’s net assets to remain constant. At the end of 60 days, when the fund receives $100, the fund has $99.40 (the same amount paid for the first security) to invest in another security and $0.60 to distribute to shareholders as a dividend (after reducing the $0.60 by the allocable share of fund expenses).
10 A fund will normally take certain actions well before its shadow price falls to $0.9950. Funds typically have policies and procedures stating that if the fund’s shadow price drops below a specified level (e.g., $0.9975), the fund must take particular actions, such as beginning to compute shadow prices on a daily basis, notifying senior officials of the fund’s adviser, or calling a meeting of the fund’s board.
11 A money market fund might sell securities at a loss under certain circumstances. For example, if a fund had large and unexpected redemption requests that it could not meet, it might need to sell securities, potentially including those with unrealized losses (i.e., amortized cost exceeds market value), to meet such redemptions. Another reason why a fund might sell such a security would be if it expects the credit quality, and thus the price, of the security to continue to deteriorate. If a fund sells a security at a loss (i.e., the amount received upon sale is less than the security’s amortized cost), then the amortized cost NAV may decline (from $1.00 to $0.9995). Nevertheless, for disclosure and share trade processing purposes, the per-share amortized cost is rounded to the nearest cent ($1.00). In this circumstance, a money market fund might be able to restore the amortized cost NAV to $1.00 by realizing gains on other securities that it holds whose market values exceed their amortized cost value. The amendments recently adopted by the SEC address the concern that a fund may need to sell securities at a loss to meet unusual redemptions by (1) requiring that funds hold significant levels of liquidity at all times;

32 prICIng oF U.S. MonEy MarkET FUndS
(2) requiring funds to adopt “know your investors” procedures to make it less likely that a fund would be surprised by large redemptions; and (3) requiring funds to “stress test” their portfolios to anticipate the effects of market volatility, interest rate fluctuations, and redemptions on the fund’s shadow price.
12 Credit events may be purely idiosyncratic, reflecting the condition and business decisions of a single firm, or general, reflecting macroeconomic factors that affect overall credit conditions and lead lenders to demand greater yields from borrowers.
13 If interest rates rise, an investor holding a security maturing in 90 days must wait longer to reinvest at higher prevailing rates than an investor whose security matures in 60 days. The market value of the 90-day security thus would fall more than the value of the 60-day security.
14 See Figure 13, weighted average maturity, for all funds.
15 The four-week figure, while very low, overstates the likelihood and importance of very large outflows. Figure 7 seeks to adjust for the decline in assets that funds often undergo preceding a merger or liquidation. These declines are normally anticipated well in advance and often occur because of explicit business decisions on the part of the fund’s manager. Thus, they are not the kinds of events that would typically put downward pressure on a fund’s shadow price. However, the exact procedure the analysis used to adjust for mergers and liquidation is necessarily subjective, as it requires the analysis to arbitrarily exclude a certain number of weeks of the fund’s data before the liquidation or merger. This analysis has taken a conservative approach that excludes only four weeks of data before the liquidation or merger, a window that is unlikely to exclude all weeks in which funds experienced merger- or liquidation-related outflows.
16 A money market fund must only hold securities that have been determined by a fund’s board of directors to present minimal credit risks. In addition, 97 percent of a fund’s assets must be invested in government obligations or other securities that either received the highest short-term rating or are of comparable quality.
17 For illustrative purposes, the example assumes, somewhat extremely, that the fund holds 5 percent of its portfolio in the securities of one issuer. Few, if any, money market funds actually invest 5 percent of their portfolios in the securities of one issuer.
18 Market values of defaulted securities depend on various features, including the seniority of the debt, whether it is collateralized by specific assets, and the anticipated recovery of the amount owed. Defaulted senior debt and collateralized debt securities tend to have higher market values than subordinated or unsecured defaulted securities.
19 The funds in the sample all calculate their shadow prices weekly. The great majority do so on Tuesdays, Wednesdays, or Thursdays. For presentation purposes, the analysis aligns the data for all funds on Wednesdays. Thus, for example, funds that calculated their shadow prices on either Tuesday, September 9, 2008, or Thursday, September 11, 2008, would be represented in the figures in this section in the data point for Wednesday, September 10, 2008. This study focuses on taxable money market funds because they have considerably more assets and a larger base of institutional investors than tax-exempt money market funds.
33prICIng oF U.S. MonEy MarkET FUndS
20 From January 3, 2001, to November 6, 2002, the Federal Reserve cut the federal funds rate from 6.5 percent to 1.25 percent. The Federal Reserve reduced the federal funds rate once more to 1 percent on June 25, 2003. From that point, the federal funds rate remained at 1 percent until June 30, 2004, at which point the Federal Reserve began a tightening of monetary policy that lasted three years.
21 Recall that because of the way the analysis aligned the data (see note 19), the data point for the week ending September 10, 2008 includes funds that calculated their shadow prices on Thursday, September 11, and Friday, September 12, 2008.
22 Lehman Brothers announced on Sunday, September 14, 2008, that it would file for bankruptcy the next day, September 15. Thus, Monday, September 15, was the first day that the financial markets were open after the news of Lehman’s failure was confirmed and the first day funds could have computed their shadow prices with the news of the event factored in.
23 On September 16, 2008, reversing an earlier indication that it would not participate in a rescue of AIG, the Federal Reserve announced that it would lend up to $85 billion to the insurance giant.

34 prICIng oF U.S. MonEy MarkET FUndS
Glossary of Money Market Terms
accretion of a discount. An accounting process by which the book value of a security purchased at a discount from par is increased during the security’s holding period. The accretion reflects the increase in the security’s value as it approaches maturity, so that the book value will equal par on the security’s maturity date. For example, if a security with a face value (par) of $100 and a remaining maturity of 60 days is purchased for $99.40, the daily accretion on a straight-line basis is one cent ($0.01). Thus, the security’s book value will increase by one cent each day, from $99.40 at the time of purchase to $100 on the security’s final maturity date.
amortization of a premium. An accounting process by which the book value of a security purchased at a premium above par is decreased during the security’s holding period, so that the book value will equal par on the security’s maturity date. The amortization reflects the decrease in the security’s value as it approaches maturity. For example, if a security with a face value (par) of $100 and a remaining maturity of 60 days is purchased for $100.60, the daily amortization on a straight-line basis is one cent ($0.01). Thus, the security’s book value will decrease by one cent each day, from $100.60 at the time of purchase to $100 on the security’s final maturity date.
amortized cost. The acquisition cost of a security as adjusted for accretion of a discount or amortization of a premium. Money market funds use amortized cost in lieu of market value to calculate their per-share net asset value (NAV).
ask or asked. The price at which a market maker will sell a security. Contrast bid .
asset-backed commercial paper (ABCP). Commercial paper sold to finance a wide range of assets, such as credit card receivables or automobile loans. An asset-backed commercial paper program is composed of a bankruptcy-remote special purpose vehicle, or conduit, that issues commercial paper and uses the proceeds of such issuance to obtain interests in various types of assets, either through asset purchase or secured lending transactions. Asset interests underlying ABCP programs vary widely and commonly include trade receivables, credit card receivables, equipment loans and leases, automobile loans and leases, consumer loans, manufactured housing loans, and dealer floor plan loans.
basis point (bp). One one-hundredth of 1 percent (0.01 percent); thus, 100 basis points equal 1 percent. When applied to $1.00, 1 basis point is $0.0001; 100 basis points equal one cent ($0.01).
bid. The price at which a market maker will buy a security. Contrast ask .
book value. The value at which a debt security is shown on the holder’s balance sheet. For a money market fund, book value is amortized cost, which may differ from market value. It also may be described as “accreted book value” or “amortized book value.”
break the buck. See break the dollar.

35prICIng oF U.S. MonEy MarkET FUndS
break the dollar. A phrase used to describe when the net asset value of a money market fund is repriced from its stable $1.00 NAV, an event that could be triggered by a deviation greater than one-half of 1 percent (one-half cent, or $0.0050) between the fund’s mark-to-market value (shadow price) and its stable $1.00 NAV. Also known as break the buck .
certificate of deposit (CD). A savings certificate entitling the bearer to receive interest. A CD bears a fixed maturity date, has a specified fixed interest rate, and can be issued in any denomination. CDs are generally issued by commercial banks and are currently insured by the Federal Deposit Insurance Corporation (FDIC) up to a maximum of $250,000. CDs are generally offered at terms ranging from one month to five years.
commercial paper (CP). Short-term, unsecured notes issued by a corporation to meet immediate short-term needs for cash, such as the financing of accounts payable, inventories, and short-term liabilities. Maturities typically range from overnight to 270 days. Commercial paper is usually issued by corporations with high credit ratings and sold at a discount from face value.
credit default swap (CDS). A contract designed to transfer the credit exposure of debt obligations between parties. The buyer of a CDS receives credit protection, whereas the seller of the CDS guarantees the credit worthiness of the underlying security. The buyer makes a series of payments to the seller and, in return, receives a payoff if the security underlying the agreement experiences a credit event, such as a default.
credit rating. An evaluation given by an NRSRO of a security’s creditworthiness. Also known as rating .
credit risk. The risk that an issuer of debt securities or a borrower may default on its obligations.
credit spread. The additional yield required of a debt security beyond that of a risk-free alternative (such as a U.S. Treasury instrument of the same maturity).
credit spread risk. The risk that a security’s credit spread will widen. This could happen, for example, if the security’s credit rating is downgraded.
default. A failure by an issuer to: (i) pay principal or interest when due, (ii) meet nonpayment obligations, such as reporting requirements, or (iii) comply with certain covenants in the document authorizing the issuance of a bond (an indenture).
discount securities. Non-interest-bearing money market instruments that are issued at a discount and redeemed at maturity for par. For example, U.S. Treasury bills are issued as discount securities.
Eurodollar deposit. U.S. dollar–denominated deposits at foreign banks or foreign branches of U.S. banks. Eurodollar deposits are not regulated by the Federal Reserve Board.
face value. The principal amount that an issuer of a debt security promises to repay at the security’s maturity. Also called par.

36 prICIng oF U.S. MonEy MarkET FUndS
fair value. The price for a security which the fund might reasonably expect to receive upon its current sale.
federal funds. Non-interest-bearing deposits held by member banks at the Federal Reserve.
federal funds rate. The interest rate at which federal funds are traded.
first-tier security. Generally, a security that has received the highest short-term credit rating (typically A1, P1, or F1), or an unrated security that is of comparable quality. First-tier securities include U.S. government securities.
government money market fund. See money market fund .
interest rate risk. Risk of gain or loss on a security due to possible changes in interest-rate levels. When interest rates rise, the market value of a debt security will fall, and vice versa. Interest rate risk is a type of market risk .
interest rate reset date. The date on which a variable-rate debt security’s interest rate is adjusted. This adjustment occurs periodically over the life of the variable-rate security and is either tied to some reference rate or determined by an agent to allow the security to be resold for its par value.
liquidity. The ability of a security to be easily and rapidly converted to cash without a substantial loss of value. In the money market, a security is said to be liquid if the spread between bid and ask prices is narrow and reasonably sized trades can take place at those quotes.
liquidity risk. In money market funds, the risk that monies needed to fund investor redemptions may not be available in sufficient quantities due to the fund’s inability to sell portfolio securities or obtain money from other sources.
market risk. Risk that the value of a portfolio will decrease due to a change in the value of one or more market risk factors. The four most common market risk factors are stock prices (equity risk), interest rates (interest rate risk), foreign exchange rates (currency risk), and commodity prices (commodity risk).
market value. The price at which a security was last traded or a market maker or dealer is currently offering to trade and could presumably be purchased or sold.
maturity date. The final payment date of a debt security, on which all outstanding principal and interest are repaid.
money market. The global financial market for short-term borrowing and lending where short-term instruments such as Treasury bills, commercial paper, and repurchase agreements are bought and sold.
37prICIng oF U.S. MonEy MarkET FUndS
money market fund. A mutual fund that seeks to maintain a stable $1.00 net asset value by valuing its assets at amortized cost, or that is otherwise required to comply with the risk-limiting conditions of Rule 2a-7. Money market funds are generally classified as follow:
» tax-exempt money market fund. A fund that seeks to maintain a stable NAV while paying dividends that are not taxed by the federal government, and in some cases by states and municipalities, by investing in municipal money market securities.
» taxable money market fund. A government or prime money market fund, the dividends of which are taxed by federal, state, and local governments.
» government money market fund. A taxable money market fund invested principally in U.S. Treasury obligations and other financial instruments issued or guaranteed by the U.S. government, its agencies, or its instrumentalities. One type of government fund is a Treasury money market fund, which primarily invests in direct government obligations, such as U.S. Treasury bills and other short-term securities backed by the full faith and credit of the U.S. government either through direct purchases or repurchase agreements collaterized by such securities.
» prime money market fund. A taxable money market fund that invests in high-quality, short-term money market instruments including Treasury and government obligations, certificates of deposit , repurchase agreements, commercial paper, and other money market securities.
net asset value (NAV). A mutual fund’s price per share, calculated by dividing the value of the fund’s securities and other assets, less liabilities, by the number of shares outstanding. Money market funds use amortized cost, rather than market value, to calculate their NAV.
NRSRO. Nationally Recognized Statistical Ratings Organization. A provider of credit ratings that is registered with the SEC.
par. The principal amount that an issuer of a debt security promises to repay at the security’s maturity. Also called face value.
per-share market value. See shadow price.
prime money market fund. See money market fund .
rating. An evaluation given by an NRSRO of a security’s creditworthiness. Also known as credit rating .
remaining maturity. A security’s remaining maturity is the number of days between the current date and the security’s maturity date.
repurchase agreements (repos). A form of short-term funding for dealers. The dealer sells the securities to investors, usually on an overnight basis, and buys them back at a higher price reflecting the cost of funding.

38 prICIng oF U.S. MonEy MarkET FUndS
roll over. To reinvest funds received from a maturing security in a new issue of the same or a similar security.
second-tier security. Generally, a security that has received the second highest short-term credit rating (typically A2, P2, or F2), or an unrated security that is of comparable quality.
shadow price. The price per share of a money market fund obtained by using market prices to value the fund’s assets. The shadow price is calculated as the market value of a money market fund’s total net assets divided by the number of shares outstanding. Also referred to as mark-to-market net asset value. See per-share market value.
taxable money market fund. See money market fund .
tax-exempt money market fund. See money market fund .
total net assets (TNA). Total assets of a fund less its liabilities.
Treasury bill (T-bill). A short-term debt obligation of the U.S. government with a maturity of less than one year. T-bills are sold in denominations of $1,000 up to a maximum purchase of $5 million and commonly have maturities of one month (four weeks), three months (13 weeks), or six months (26 weeks).
Treasury money market fund. See money market fund .
weighted average life (WAL). A measure of a money market fund’s sensitivity to changes in credit spreads and other spread risks. Weighted average life, which is expressed in days, is calculated by summing the remaining maturity of each portfolio security or, when relevant, the number of days until the date of the next demand feature when the fund may receive payment of principal and interest, scaled by that security’s share of the portfolio’s total value, as measured by amortized cost. Weighted average life differs from weighted average maturity (WAM) in that the weighted average life calculation uses a variable-rate security’s final maturity (or the date of the next demand feature); the weighted average maturity calculation uses the security’s next interest rate reset date. Thus, weighted average life will always be equal to or greater than the weighted average maturity.
weighted average maturity (WAM). A measure of a money market fund’s sensitivity to changes in interest rates. Weighted average maturity, which is expressed in days, is calculated by summing the remaining maturity or time to an interest rate reset of each portfolio security scaled by that security’s share of the portfolio’s total value, as measured by amortized cost.
yield to maturity. The rate of return on a debt security held to maturity considering both interest payments and the increase in value (attributable to any discount) or the decrease in value (attributable to any premium).


1401 H Street, NW Washington, DC 20005 202/326-5800 www.ici.org
Copyright © 2011 by the Investment Company Institute