pricing proposal 2016/17 - australian energy regulator approved... · sa power networks pricing...
TRANSCRIPT
SA Power Networks
SA Power Networks Pricing Proposal 2016/17 v2.0 F Page i of 110
Pricing Proposal 2016/17
10 June 2016 (including final TUoS prices)
SA Power Networks Pricing Proposal 2016/17 Page 1 of 110
Executive Summary
This Annual Pricing Proposal (APP) has been prepared by SA Power Networks under the requirements
of the National Electricity Rules1 (NER, or the Rules). It provides details of our proposed network
prices for 2016/17 and comprehensive information on the price changes for each type and size of
customer.
Each electricity customer’s retail bill comprises the following components, the first four of which are
included in this Network Pricing Proposal:
1. SA Power Networks’ distribution network charges;
2. Transmission network charges, by ElectraNet and MurrayLink;
3. Jurisdictional Scheme Amount charges, required to fund the South Australian Government’s
Feed-in Tariff (FiT) credits to the owners of qualifying solar photo-voltaic (PV) electricity
generators;
4. Metering charges (by SA Power Networks or another metering provider); and
5. Retail charges, including the cost of energy generation, and obligations under the national
Renewable Energy Target (RET) and the state’s Retailer Energy Efficiency Scheme (REES).
The first three components are collectively referred to as ‘Network Use of System’ or ‘NUoS’ charges
and usually sum to just under half the final bill paid by consumers. The distribution and transmission
charges reflect the cost of transporting electricity across the State’s electricity grid from where it is
produced to where it is consumed. The fourth charge generally applies to small customers for their
type 6 metering provided by SA Power Networks.
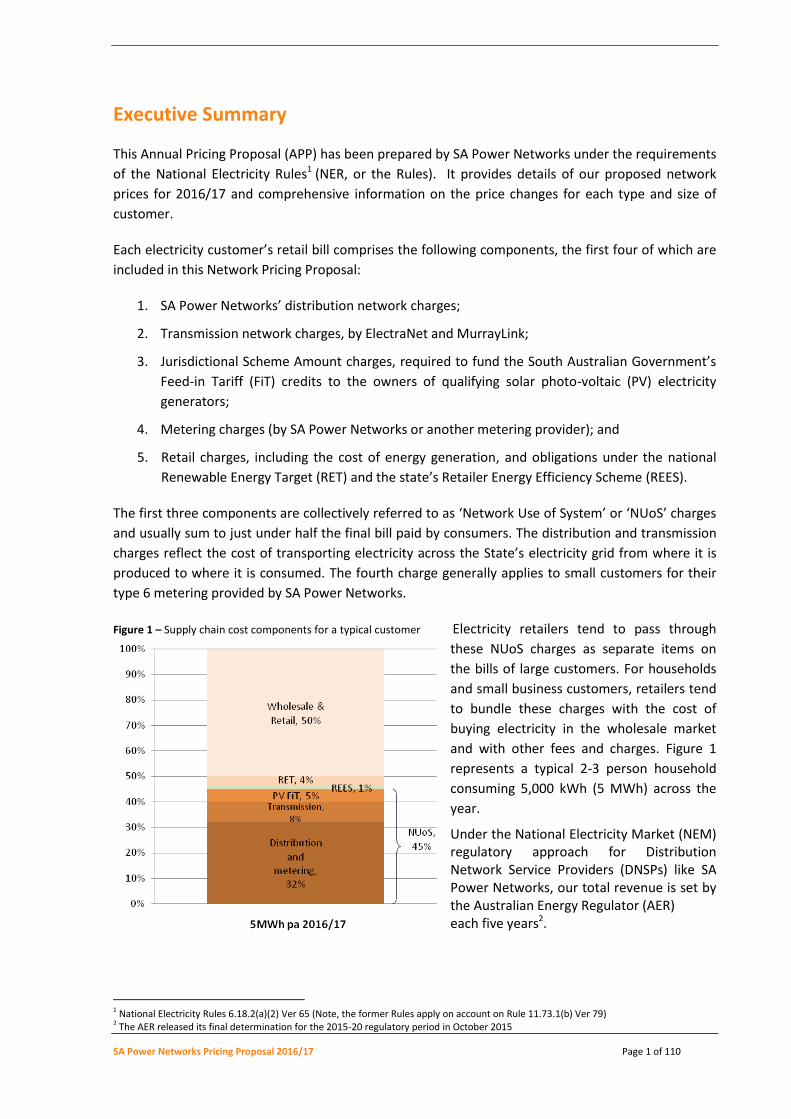
Figure 1 – Supply chain cost components for a typical customer Electricity retailers tend to pass through
these NUoS charges as separate items on
the bills of large customers. For households
and small business customers, retailers tend
to bundle these charges with the cost of
buying electricity in the wholesale market
and with other fees and charges. Figure 1
represents a typical 2-3 person household
consuming 5,000 kWh (5 MWh) across the
year.
Under the National Electricity Market (NEM) regulatory approach for Distribution Network Service Providers (DNSPs) like SA Power Networks, our total revenue is set by the Australian Energy Regulator (AER) each five years2.
1 National Electricity Rules 6.18.2(a)(2) Ver 65 (Note, the former Rules apply on account on Rule 11.73.1(b) Ver 79) 2 The AER released its final determination for the 2015-20 regulatory period in October 2015
SA Power Networks Pricing Proposal 2016/17 Page 2 of 110
Simplicity
Fairness & Equity
Compliance
Empower the
consumer
With our total revenue capped, our tariffs represent the way that we allocate these total costs to our
diverse customer base.
The way we allocate these costs to customers is changing. The National Electricity Rules (NER, or the
Rules) changed in late 2014 and require us to develop what can be referred to as a more ‘user pays’
approach to the way we price use of the network3. Network pricing needs to become more ‘cost-
reflective’ over time. Changes are required to our pricing from July 2017, but we have endeavoured
to ensure any interim period price changes are aligned with the direction of the new pricing rules.
This reform program will involve numerous decisions along the way and requires SA Power Networks
to balance sometimes competing objectives. We have been refining a set of Customer Impact
Principles as a complement to the Pricing Principles established under the Rules4.
An Electricity Advisory Panel was convened in February 20165 and asked to participate in a deliberative process facilitated by independent consultancy democracyCo. The Panel was posed the
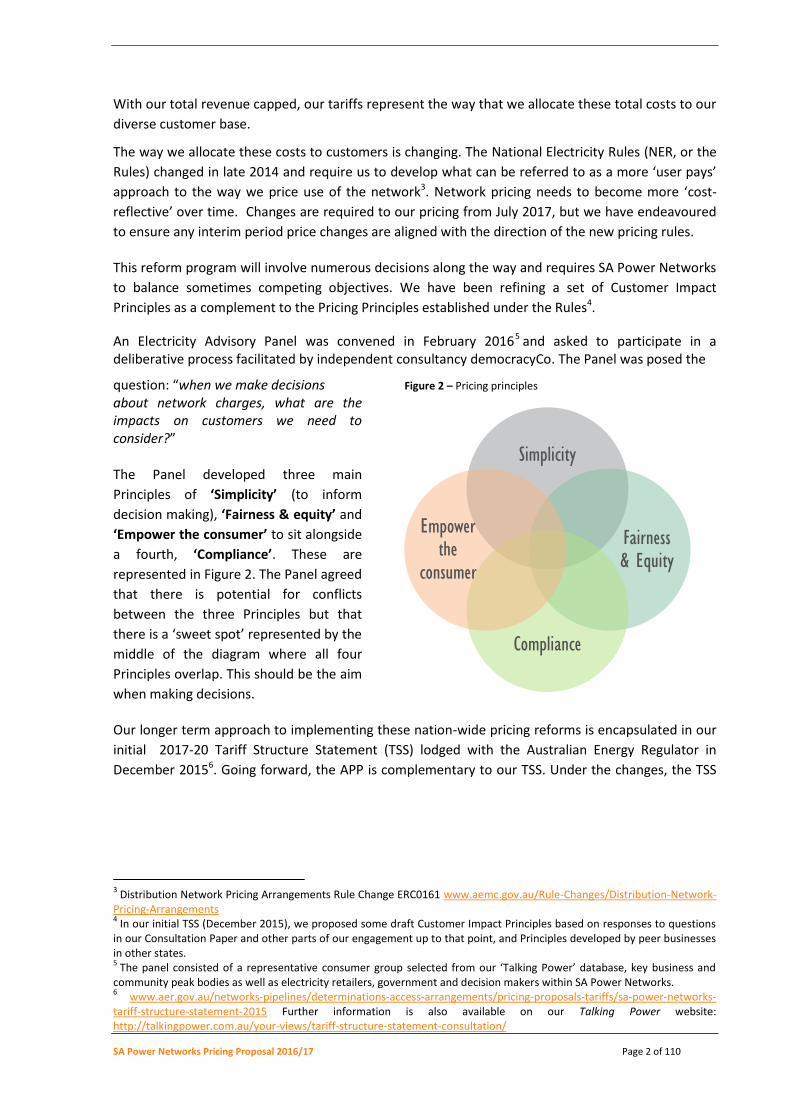
question: “when we make decisions Figure 2 – Pricing principles
about network charges, what are the impacts on customers we need to consider?”
The Panel developed three main
Principles of ‘Simplicity’ (to inform
decision making), ‘Fairness & equity’ and
‘Empower the consumer’ to sit alongside
a fourth, ‘Compliance’. These are
represented in Figure 2. The Panel agreed
that there is potential for conflicts
between the three Principles but that
there is a ‘sweet spot’ represented by the
middle of the diagram where all four
Principles overlap. This should be the aim
when making decisions.
Our longer term approach to implementing these nation-wide pricing reforms is encapsulated in our
initial 2017-20 Tariff Structure Statement (TSS) lodged with the Australian Energy Regulator in
December 20156. Going forward, the APP is complementary to our TSS. Under the changes, the TSS
3 Distribution Network Pricing Arrangements Rule Change ERC0161 www.aemc.gov.au/Rule-Changes/Distribution-Network-
Pricing-Arrangements 4 In our initial TSS (December 2015), we proposed some draft Customer Impact Principles based on responses to questions
in our Consultation Paper and other parts of our engagement up to that point, and Principles developed by peer businesses in other states. 5 The panel consisted of a representative consumer group selected from our ‘Talking Power’ database, key business and
community peak bodies as well as electricity retailers, government and decision makers within SA Power Networks. 6
www.aer.gov.au/networks-pipelines/determinations-access-arrangements/pricing-proposals-tariffs/sa-power-networks-tariff-structure-statement-2015 Further information is also available on our Talking Power website: http://talkingpower.com.au/your-views/tariff-structure-statement-consultation/

SA Power Networks Pricing Proposal 2016/17 Page 3 of 110
outlines our proposed changes over a five year Regulatory Period7, and the APP documents the
subset of those changes proposed in any given year.
For our 2016/17 APP we have placed particular emphasis on the the principles of Simplicity and
Fairness & Equity as we move towards more cost-reflective pricing.
What’s changing in 2016/17?
Our 2015/16 APP is available from the AER website8. What follows is a summary of the changes
proposed in our 2016/17 APP.
Revenue – Effects of 2015/16 on 2016/17 prices
Due to higher than expected electricity demand over summer, we expect to collect more distribution
revenue in 2015/16 than we initially forecast. Consistent with the AER’s final determination, we will
return this surplus revenue to customers through lower prices than planned, in 2016/17. Note that
this issue applies to our distribution charges, our transmission charges and our recovery of PV FiT
charges under the SA Government’s Jurisdictional Scheme (ie the network component of the bill).
We have estimated the 2015/16 network charge recoveries (distribution plus transmission plus PV
FiT) at $1,100.5 million, which is around $38 million above the forecast in last year’s APP.
Revenue – 2016/17 Allowances
Our allowed distribution revenue rises from $682 million for (2015/16) to $760 million due to the
AER’s final decision of October 2015. This increase also includes CPI of 1.7% and the performance
incentive scheme outcomes (arising from 2013/14 and 2014/15 performance) of 2.2%. We forecast
to recover $734 million from customers after allowing for the estimated 2015/16 over-recovery of
distribution charges.
Our transmission charges for 2016/17 have now been finalised. There has been a reduction of 5% in
ElectraNet charges due to higher proceeds from inter-regional settlements on the interconnection.
These proceeds are used to discount transmission prices. Combining the reduction in transmission
charges with the estimated over-recovery of such charges in 2015/16 means that our 2016/17
transmission prices to customers will fall by 12% on average. Major business customers receive a
locational price based on ElectraNet’s price list, so their prices will fall on average by 5% (ie the major
business prices are not affected by our over/under-recovery).
The revenue collected for the State Government’s Solar Feed-in Tariff (FiT)will be less in 2016/17 due
to the expiry, on 30 September 2016, of what is known as the ’16 cent’ scheme9. This reduction of
$32 million will be passed on principally to business customers. As the principal customers that are
using the ‘44 cent’ PV schemes are residential, we will maintain the ongoing PV FiT allocation to
residential customers rather than business customers is consistent with the ‘Fairness and Equity’
7 In this case, due to the timing of the introduction of the changes, our first TSS covers the final three years of our current
regulatory period and this APP is required to be prepared in accordance with version 65 of the Rules (preceding the changes). However we are seeking to provide a consistent approach wherever possible. 8 www.aer.gov.au/networks-pipelines/determinations-access-arrangements/pricing-proposals-tariffs/sa-power-networks-
annual-pricing-proposal-2015-16 9 More information is available by searching on ‘solar feed in’ at www.sa.gov.au

SA Power Networks Pricing Proposal 2016/17 Page 4 of 110
Customer Impact Principle. Residential customers will receive a $6 million reduction and business
customers will see a $26 million reduction in PV FiT charges.
Tariff Changes for Large Business Customers
The approximately 5,500 customers classified as ‘large market customers’ (consuming more than
160MWh per annum and hence having retail bills of around $40,000 per annum) have all been
assigned to a cost-reflective network tariff. The final tranche of this occurred on 1 July 2015. We are
not proposing any major changes for these customers.
Approximately 250 customers were assigned to a ‘transition’ tariff in order to manage the impacts of
the change to cost-reflective tariffs. Demand charges were applied at 30% of their final value for
2015/16. This will increase to 50% in 2016/17 with the other 50% balance based proportionately on
business 2-rate prices.
We are not proposing any changes to the structure of tariffs for this group in 2016/17 and they can
expect to see reductions in prices due to our lower overall revenue and lower contributions to PV FiT
recovery. Price reductions of 6% are expected.
For Small Business Customers
We supply around 95,000 small businesses. These include a range of businesses, State and Local
Government sites and properties operated by community sector organisations.
We have split the LV business tariff class into a ‘large LV business’ tariff class and a ‘small business’
tariff class. LV businesses who consume greater than 160MWh per annum will be reassigned to the
large LV business tariff class with the small businesses will remain on the small business tariff class.
The purpose of this change is to better reflect the existing tariff options for these customers.
Customers will not be reassigned to a differently priced tariff in 2016/17 as a result of this tariff class
change.
We are proposing a number of tariff changes for these customers. The average 2016/17 network
price reduction for these small business customers is forecast at 6%. No small business customer
tariffs increase in 2016/17 although some customers may receive smaller price reductions than the
average. This will particularly be the case for those single-rate business customers with usage up to
10 MWh pa and for those business 2-rate customers with predominantly off-peak usage.
Business Single Rate
Approximately 62,000 sites are assigned to our now closed Business Single Rate tariff (closed to new
applicants in 2010). This tariff had a slightly higher rate for the consumption block above 10MWh pa
(a difference of approximately 1.3c/kWh in 2015/16). In the pursuit of simplicity we will be
eliminating this difference for 2016/17 by providing a larger price-reduction to block 2 than to
block 1. All business single-rate customers will get a price reduction.
Business 2 Rate
Approximately 32,000 sites are assigned to our Business 2 Rate tariff. This tariff has separate charges
for Peak and Off-peak consumption. In the pursuit of simplicity and alignment with our more cost-
SA Power Networks Pricing Proposal 2016/17 Page 5 of 110
reflective tariffs we will be reducing the difference between peak and off-peak rates for 2016/17 by
reducing the peak-rate but holding the off-peak rate at 2015/16 prices.
Other changes for business
A number of small business customers have been transferred to our (monthly) Actual Demand tariff
as a result of alterations to their supply (such as upgrades or installing solar PV). We will introduce a
small business version of the transition tariff that is available to our large business customers. This
transition tariff will be suitable for some of those small business customers who are/have been
required (because of new connections or alterations to their existing connection) to take up cost-
reflective demand-based tariffs. The transition tariff does not have as large a demand component
however it has a larger usage (energy) component. Any small business customer can opt-in to using
this tariff, but we anticipate its use primarily by those new connections/alterations customers with
less favourable load characteristics.
In the interests of simplicity we will be closing the Agreed Demand tariff to new small business
applicants from 1 July 2016. This option is rarely a cost-effective or simple option for new small
business customers so we will limit the tariff’s use to those currently using it.
We have proposed an initiative in our initial 2017-20 TSS that allows customers with multiple sites to
move to cost-reflective tariffs on a ‘no lose’ guarantee. We intend to trial this during 2016/17 with
approximately 20 customers that have more than 10 sites each. These customers will pay no more
for network charges than they would have on the business single/business 2-rate tariffs but are likely
to make savings in total over their multiple sites from using cost-reflective demand-based tariffs. In
the event that a customer does lose across the sites, we will directly refund the customer the
difference between the new and the old tariff outcomes. We will not require the retailer to rebill the
year’s accounts at the old tariff rates.
For Residential customers
Households are generally assigned to our residential single rate tariff and are able to access our
controlled load tariff (for storage hot water and a limited number of other applications). We
introduced a ‘cost-reflective’ (monthly) Actual Demand tariff in 2014/15 for those customers willing
to install an interval meter and able to find a retailer willing to offer a matching retail tariff.
We are proposing a number of minor changes to residential tariffs for 2016/17.
Residential Single Rate
The 2016/17 Residential single rate prices for the supply charge and block 1 usage (up to 4,000 kWh
pa) have been held at 2015/16 prices, with block 2 usage having a small price reduction. The
composition of this price has altered in particular for transmission. This tariff charges a slightly higher
rate for consumption above 4,000 kWh (there is a difference of approximately 3.5c/kWh in 2015/16).
In the pursuit of simplicity and eventual alignment with the settings of our cost-reflective tariff we
are reducing this difference for 2016/17 to 2.9 c/kWh. In order to remain revenue neutral overall, we
will achieve this via a smaller reduction in the transmission price for consumption up to 4,000 kWh
and a decrease in the price for consumption above 4,000 kWh.

SA Power Networks Pricing Proposal 2016/17 Page 6 of 110
Residential (monthly) Actual Demand
Consistent with feedback received during our TSS consultation, the monthly minimum demand will
reduce from 1.5 kW to 1.0 kW for 2016/17. Consumption charges (cents per kWh) will also reduce by
a greater proportion than other residential tariffs, increasing the attractiveness of this cost-reflective
tariff. The TSS consultation wanted the risk taken by cost-reflective tariff users to be recognised so.
Controlled Load
In the pursuit of eventual alignment with the consumption charge settings of our cost-reflective tariff
we will be holding the controlled load usage rate at 2015/16 price levels.
We have also received feedback on the desired use of controlled load for charging electric vehicles
(EVs) overnight. We have investigated the suitability of such devices and the direction of our TSS
tariff strategy, and have decided to include hard-wired electric vehicle chargers not exceeding 25
amps in size as equipment permitted to be used on controlled load. Such chargers are typically
provided with hybrid electric vehicles, and will operate for several hours each night at a level of
demand similar to hot water systems to provide energy for the following day’s car usage.
For those customers who wish to install fast chargers, or those who do not wish to hard-wire a small
EV charger into controlled load, the residential single-rate tariff or the residential monthly demand
tariff is available. The latter option can provide low network prices for battery charging if the charger
is not used at times of that house’s peak demand between 4pm and 9pm each month.
Summary
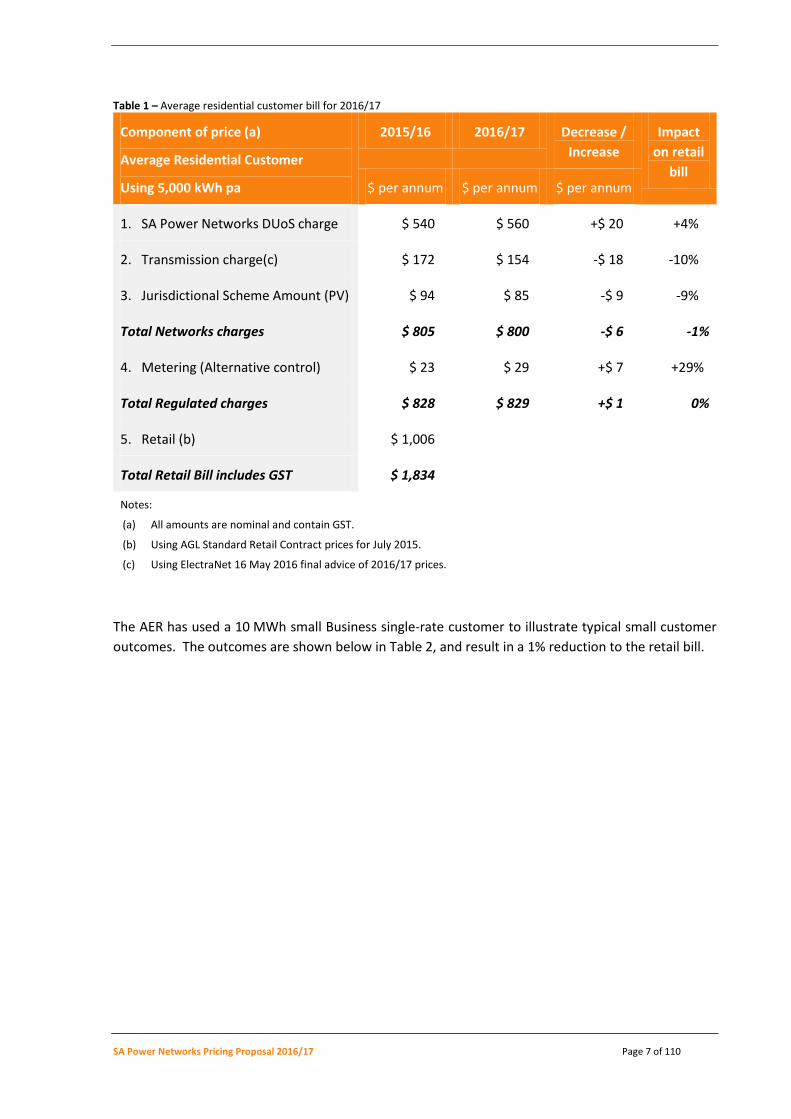
Table 1 below provides a comparison of the annual cost for a typical 2-3 person household (5,000
kWh). The retail prices for 2016/17 have not been announced, so 2015/16 energy/retail prices are
used. The slight savings for such customers from standard control network charges (distribution,
transmission and PV FiT recovery) are offset by the small increase in the metering fee to most
residential customers, resulting in no change in overall charges covered by this Pricing Proposal.
SA Power Networks Pricing Proposal 2016/17 Page 7 of 110
Table 1 – Average residential customer bill for 2016/17
Component of price (a)
Average Residential Customer
Using 5,000 kWh pa
2015/16 2016/17 Decrease /
Increase
Impact
on retail
bill $ per annum $ per annum $ per annum
1. SA Power Networks DUoS charge $ 540 $ 560 +$ 20 +4%
2. Transmission charge(c) $ 172 $ 154 -$ 18 -10%
3. Jurisdictional Scheme Amount (PV) $ 94 $ 85 -$ 9 -9%
Total Networks charges $ 805 $ 800 -$ 6 -1%
4. Metering (Alternative control) $ 23 $ 29 +$ 7 +29%
Total Regulated charges $ 828 $ 829 +$ 1 0%
5. Retail (b) $ 1,006
Total Retail Bill includes GST $ 1,834
Notes:
(a) All amounts are nominal and contain GST.
(b) Using AGL Standard Retail Contract prices for July 2015.
(c) Using ElectraNet 16 May 2016 final advice of 2016/17 prices.
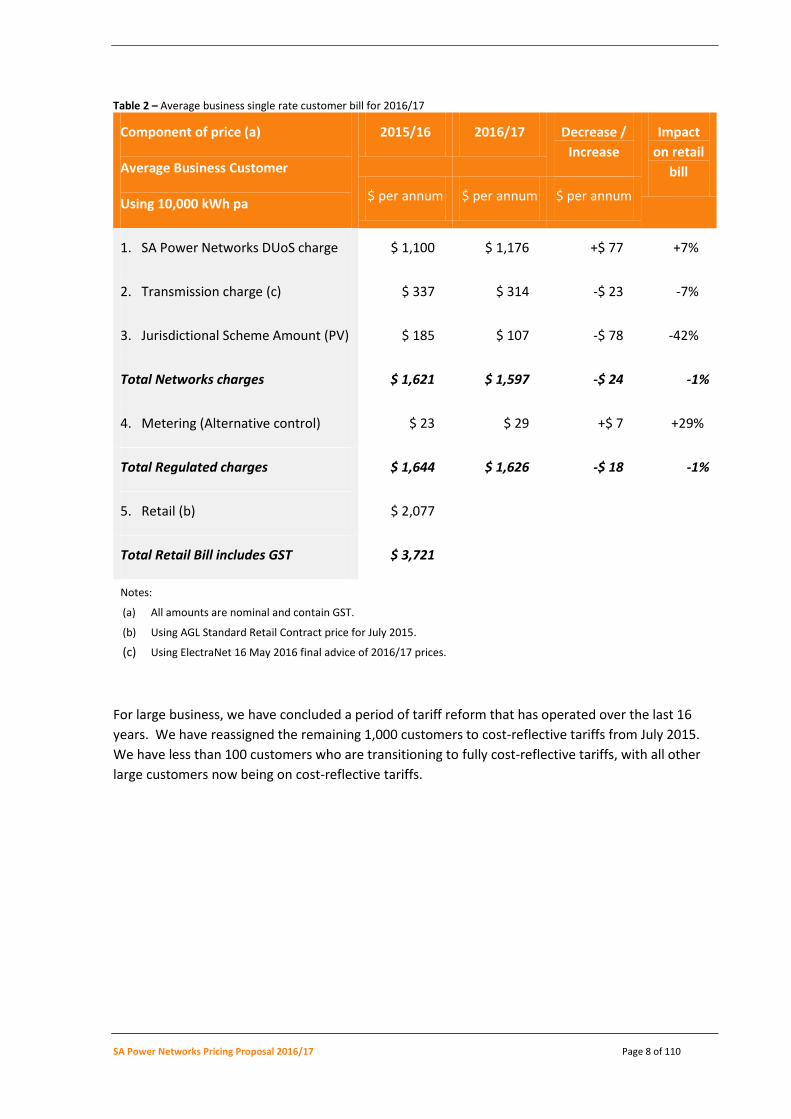
The AER has used a 10 MWh small Business single-rate customer to illustrate typical small customer
outcomes. The outcomes are shown below in Table 2, and result in a 1% reduction to the retail bill.
SA Power Networks Pricing Proposal 2016/17 Page 8 of 110
Table 2 – Average business single rate customer bill for 2016/17
Component of price (a)
Average Business Customer
Using 10,000 kWh pa
2015/16 2016/17 Decrease /
Increase
Impact
on retail
bill
$ per annum $ per annum $ per annum
1. SA Power Networks DUoS charge $ 1,100 $ 1,176 +$ 77 +7%
2. Transmission charge (c) $ 337 $ 314 -$ 23 -7%
3. Jurisdictional Scheme Amount (PV) $ 185 $ 107 -$ 78 -42%
Total Networks charges $ 1,621 $ 1,597 -$ 24 -1%
4. Metering (Alternative control) $ 23 $ 29 +$ 7 +29%
Total Regulated charges $ 1,644 $ 1,626 -$ 18 -1%
5. Retail (b) $ 2,077
Total Retail Bill includes GST $ 3,721
Notes:
(a) All amounts are nominal and contain GST.
(b) Using AGL Standard Retail Contract price for July 2015.
(c) Using ElectraNet 16 May 2016 final advice of 2016/17 prices.
For large business, we have concluded a period of tariff reform that has operated over the last 16
years. We have reassigned the remaining 1,000 customers to cost-reflective tariffs from July 2015.
We have less than 100 customers who are transitioning to fully cost-reflective tariffs, with all other
large customers now being on cost-reflective tariffs.
SA Power Networks Pricing Proposal 2016/17 Page 9 of 110
Shortened forms
Abbreviation Definition or description
AER Australian Energy Regulator.
Augmentation Investment in new network assets to meet increased demand.
Capacity, capability The amount of energy that a part of the network is able to carry.
Capital
Contributed Works
Works for which the customer(s) contribute towards the cost of supplying
assets, typically because they are the sole users.
COAG Council of Australian Governments.
Contestability Customer choice of electricity supplier.
Controlled Load The DNSP controls the hours in which the supply is made available.
Cost of Supply
Model
Theoretical and algorithmic model used to calculate prices, which conform to
the pricing goals.
Cross subsidy Where the price to a tariff class falls outside the range between the avoidable
incremental cost of supply and the cost of stand-alone supply, an economic
cross subsidy from or to other customers is said to exist.
Decision The Australian Energy Regulator’s Final Decision on South Australia -
distribution determination 2015–16 to 2019–20, October 2015
Demand Energy consumption at a point in time.
Demand
Management
Attempt to modify demand behaviour so as to constrain demand at critical
times.
Distribution
Network
The assets and service which links energy customers to the transmission
network.
Distributor, DNSP Distribution Network Service Provider.
DUoS Distribution Use of System. The utilisation of the distribution network in the
provision of electricity to consumers (a component of NUoS).
EDPD Electricity Distribution Price Determination (South Australian).
ESCoSA Essential Services Commission of South Australia, the South Australian
Regulator of energy and other infrastructure.
FiT Feed-in Tariff, paid to customers that have solar PV generators.
FRC Full Retail Competition (sometimes called Full Retail Contestability).
SA Power Networks Pricing Proposal 2016/17 Page 10 of 110
Abbreviation Definition or description
High Voltage Equipment or supplies at voltages of 22 or 11 kV.
IBT, Inclining Block
Tariff
A network tariff energy rate in which the rate increases above specific
consumption thresholds.
JSA Jurisdictional Scheme Amount, a component of the Network Use of System
charge to fund Feed-in Tariff payments to customers that have solar PV
generators.
kVA, MVA Kilo-volt amps and Mega-volt amps, units of instantaneous total electrical
power demand. Usually the peak demand is referenced. See also PF for the
relationship between power demand quantities.
kVAr, MVAr Kilo-volt amps (reactive) and Mega-volt amps (reactive) units of instantaneous
reactive electrical power demand. Usually the peak demand is referenced. See
also PF for the relationship between power demand quantities.
kW, MW Kilo-watts and Mega-watts, units of instantaneous real electrical power
demand. Usually the peak demand is referenced. See also PF for the
relationship between power demand quantities.
kWh, MWh Kilo-watt hours and Mega-watt hours, units of electrical energy consumption.
Low Voltage Equipment or supply at a voltage of 230 V single phase or 415 V, three phase.
Marginal Cost The cost of providing a small increment of service. The Long Run Marginal Cost
(LRMC) includes future investment, Short Run Marginal Cost (SRMC) considers
only the costs involved without extra investment.
Market Participant Businesses involved in the electricity industry are referred to as Market or Code
Participants.
Supply Rate The fixed daily cost component of a Network price.
NEL National Electricity Law.
NEM National Electricity Market.
NUoS Network Use of System. The utilisation of the total electricity network in the
provision of electricity to consumers (NUoS = DUoS + TUoS).
PV Photo-Voltaic
PF Power Factor, a measure of the ratio of real power to total power of a load.
The relationship between real, reactive and total power is as follows:
Power Factor = Real Power (kW) / Total Power (kVA)
SA Power Networks Pricing Proposal 2016/17 Page 11 of 110
Abbreviation Definition or description
Total Power (kVA) = √ [Real Power (kW)2 + Reactive Power (kVAr)2 ]
Price Signal Prices set to convey a desired behaviour because of the costs associated with
supplying the service.
Price Structure The components that make up a Price available to customers.
Proposal SA Power Networks’ Initial Pricing Proposal, submitted in accordance with the
Rules (this document).
Retailer An FRC market participant (business) supplying electricity to customers.
Rules National Electricity Rules.
Sub-transmission Equipment or supplies at voltage levels of 66 or 33 kV.
Tariff A grouping of customers who are subject to the same network price
components and conditions of supply.
Tariff class A class of customers for one or more direct control services who are subject to
a particular tariff or particular tariffs.
ToU Time of Use, a system of pricing where energy or demand charges are higher in
periods of peak utilisation of the network.
Transmission
Network
The assets and service that enable generators to transmit their electrical
energy to population centres. Operating voltage of equipment is 275 and
132 kV with some at 66 kV.
TUoS Transmission Use of System charges for the utilisation of the transmission
network.
Unmetered supply A connection to the distribution system which is not equipped with a meter
and has estimated consumption. Connections to public lights, phone boxes,
traffic lights and the like are not normally metered.
WAPC Weighted Average Price Cap, a form of regulatory price control, where the
allowable price change is based on the weighted historic consumption of each
price.
SA Power Networks Pricing Proposal 2016/17 Page 12 of 110
Contents Executive Summary ................................................................................................................................. 1
Shortened forms ..................................................................................................................................... 9
1 Introduction .................................................................................................................................. 15
1.1 National Electricity Rules ....................................................................................................... 15
1.2 Scope of SA Power Networks’ Pricing Proposal .................................................................... 15
1.3 Structure of SA Power Networks’ Pricing Proposal ............................................................... 16
1.4 Confidential information ....................................................................................................... 19
2 Our Context ................................................................................................................................... 20
2.1 SA Power Networks’ business ............................................................................................... 20
2.2 Climatic conditions ................................................................................................................ 21
2.3 SA Power Networks’ customer and demand profile ............................................................. 21
2.4 Coincident Demand ............................................................................................................... 23
2.5 Customer Density .................................................................................................................. 24
2.6 Metering ................................................................................................................................ 25
3 Regulatory requirements .............................................................................................................. 27
3.1 Rules requirements ............................................................................................................... 27
3.2 Requirements of the AER’s 2015 Final Decision ................................................................... 28
3.3 Principal elements of the AER’s 2015 Final Decision ............................................................ 29
3.4 Publication of information about tariffs and tariff classes ................................................... 33
4 Network tariff strategy .................................................................................................................. 34
4.1 Regulatory Requirements ..................................................................................................... 34
4.2 Network tariff objectives....................................................................................................... 34
4.3 The need for tariff reform ..................................................................................................... 35
4.4 Network tariff strategy .......................................................................................................... 36
4.5 Tariff reform 2005 to 2015 .................................................................................................... 36
4.6 Cost-Reflective Tariffs for large businesses July 2015........................................................... 37
4.7 Future tariff reform options .................................................................................................. 38
5 Tariff Classes .................................................................................................................................. 39
5.1 Regulatory requirements ...................................................................................................... 40
5.2 Standard control service tariffs and tariff classes ................................................................. 41
5.3 Low voltage residential tariff class ........................................................................................ 44
5.4 Low voltage business tariff class ........................................................................................... 47
5.5 High Voltage Business tariff class .......................................................................................... 53
5.6 Major Business tariff class ..................................................................................................... 55
6 Standard control services tariffs (NUoS) ....................................................................................... 58
6.1 Regulatory Requirements ..................................................................................................... 58
6.2 Tariff changes in 2016/17 ...................................................................................................... 58
SA Power Networks Pricing Proposal 2016/17 Page 13 of 110
6.3 Components of Network Charges by tariff class – this year vs last year .............................. 58
6.4 Low Voltage Residential tariff class ....................................................................................... 60
6.5 Low Voltage Business tariff class ........................................................................................... 62
6.6 High Voltage Business tariff class .......................................................................................... 64
6.7 Major Business tariff class ..................................................................................................... 65
7 Customer Impacts ......................................................................................................................... 67
7.1 Regulatory Requirements ..................................................................................................... 67
7.2 Overall price trends during the 2015-20 regulatory control period ..................................... 68
7.3 Variations to prices ............................................................................................................... 69
7.4 Low Voltage Residential tariff class ....................................................................................... 69
7.5 Low Voltage Business tariff class ........................................................................................... 73
7.6 High Voltage Business tariff class .......................................................................................... 78
7.7 Major Business tariff class ..................................................................................................... 78
8 Pricing of standard control services .............................................................................................. 79
8.1 Regulatory requirements ...................................................................................................... 79
8.2 2016/17 prices for standard control services ....................................................................... 80
8.3 Compliance with the Revenue Cap ....................................................................................... 81
8.4 Tariff class side constraints ................................................................................................... 81
8.5 Compliance with pricing principles ....................................................................................... 83
8.6 Stand-alone costs .................................................................................................................. 84
8.7 Avoidable costs ..................................................................................................................... 84
8.8 Compliance with Rules clause 6.18.5(a) ................................................................................ 84
8.9 Long Run Marginal Costs ....................................................................................................... 85
8.10 Transaction costs ................................................................................................................... 90
8.11 Customer response to price signals ...................................................................................... 90
9 Distribution cost recovery tariffs .................................................................................................. 91
9.1 Regulatory Requirements ..................................................................................................... 91
9.2 Distribution use of system overs and unders account balance ............................................ 92
10 Transmission cost recovery tariffs ............................................................................................ 93
10.1 Regulatory Requirements ..................................................................................................... 93
10.2 Transmission cost recovery tariff methodology.................................................................... 94
10.3 Transmission use of system overs and unders account balance .......................................... 96
10.4 Charging parameters for transmission recovery tariffs ........................................................ 96
10.5 Transmission recovery tariffs for 2016/17 ............................................................................ 97
11 Recovery of the PV Jurisdictional Scheme Amount .................................................................. 98
11.1 PV Jurisdictional Scheme Amount overs and unders account balance ................................ 99
11.2 Charging parameters for PV JSA cost recovery tariffs ......................................................... 100
11.3 PV JSA cost recovery tariffs for 2016/17 ............................................................................. 100
SA Power Networks Pricing Proposal 2016/17 Page 14 of 110
12 Customer tariff class assignment and reassignment .............................................................. 101
12.1 Regulatory Requirements ................................................................................................... 101
12.2 Assignment of new customers to a tariff class during the next regulatory control period 104
12.3 Reassignment of existing customers to another existing or a new tariff during the next regulatory control period ................................................................................................................ 105
12.4 Objections to proposed assignments and reassignments .................................................. 106
13 Alternative Control Services – metering services ................................................................... 107
Appendices .......................................................................................................................................... 109
Appendix A. Network Use of System Tariffs and explanatory notes ........................................... 109
Appendix B. CONFIDENTIAL – Audit of 2014/15 quantities ........................................................ 109
Appendix C. S-Factor calculation ................................................................................................. 109
Appendix D. Transmission Prices from ElectraNet – 2016/17 TUoS prices ................................. 109
Appendix E. Long Run Marginal Cost Methodology .................................................................... 109
Appendix F. Stand-alone and Avoided Cost Methodologies ....................................................... 109
Appendix G. CONFIDENTIAL – Revenue and Price Compliance Model (standard control) ......... 109
Appendix H. Not used .................................................................................................................. 109
Appendix I. Not used .................................................................................................................. 109
Appendix J. SA Power Networks’ procedure for assigning and reassigning customers to tariff classes (Tariff Manual) .................................................................................................................... 109
Appendix K. SA Power Networks’ Regulatory Compliance Checklist .......................................... 109
SA Power Networks Pricing Proposal 2016/17 Page 15 of 110
1 Introduction
SA Power Networks is submitting this Annual Pricing Proposal (APP or Proposal or Pricing Proposal)
for 2016/17 to the Australian Energy Regulator (AER). The Proposal has been prepared in
accordance with the requirements of the National Electricity Rules (NER or Rules) Version 6510 and
the AER’s 2015-20 Final Determination for SA Power Networks, made in October 2015.
The Pricing Proposal covers all of SA Power Networks’ standard control services (DUoS) and
alternative control services (metering). In its Final Determination, the AER confirmed a change in
regulatory control mechanism for SA Power Networks for 2015-20, with a revenue cap replacing the
previous weighted average price cap (WAPC) for standard control services and a price cap replacing
the alternative control services’ WAPC.
1.1 National Electricity Rules
Clause 6.1.1 of the Rules confers responsibility on the AER for the economic regulation of
distribution services provided by means of, or in connection with, distribution systems that form
part of the national grid.
1.1.1 Classification of distribution services
In accordance with clause 6.2.1 and 6.2.2 of the Rules, the AER has classified SA Power Networks’
distribution services into the following three classes:
1. Direct control services;
2. Negotiated distribution services; and
3. Unregulated distribution services.
Direct control services have been further divided into the following two subclasses:
1. Standard control services; and
2. Alternative control services.
This Pricing Proposal applies to all of the direct control services provided by SA Power Networks.
1.2 Scope of SA Power Networks’ Pricing Proposal
SA Power Networks’ Pricing Proposal sets out the proposed prices required to comply with the
revenue cap (direct control) and price cap (alternative control) approved by the AER.
This Pricing Proposal is submitted in accordance with, and complies with, the requirements of:
1. The National Electricity Law;
2. The National Electricity Rules Ver 65, including the Transitional Rules for South Australia; and
10 Rule 11.73.1(b) states the former Chapter 6 Ver 65 applies in relation to an affected DNSP's pricing proposals for the first and second regulatory years of the initial regulatory control period of the affected DNSP.

SA Power Networks
SA Power Networks Pricing Proposal 2016/17 Page 16 of 110
3. The AER’s 2015-20 SA Power Networks Final Decision of October 2015.
1.3 Structure of SA Power Networks’ Pricing Proposal
In Part I of the Rules, clause 6.18 (Distribution Pricing Rules) sets out the requirements concerning
Distribution Pricing that SA Power Networks’ Pricing Proposal must include. These requirements
include:
The Pricing Principles which must be followed;
The requirement for this Pricing Proposal; and
The matters that the Pricing Proposal must address.
The AER’s Final Decision has been made pursuant to clause 6.11.1 of the Rules. Several aspects of
that determination impose requirements concerning distribution pricing, including:
Classification of services;
The pricing control mechanism(s), X factors and side constraints;
Assigning and reassigning customers to tariff classes;
Recovery of transmission charges; and
The pass through of costs, in specified circumstances. This includes the PV Jurisdictional
Scheme Amount.
This Pricing Proposal has been structured so as to allow compliance with the specific requirements
of the Rules and the AER’s Final Decision to be readily ascertained. The substantive Sections of this
Pricing Proposal are set out in Table 3.
Table 3 - Structure of SA Power Networks’ Pricing Proposal
Section Purpose
1 Introduction Introduces the APP, its regulatory framework and the
purpose of the statement.
2 Our context Summarises the characteristics of SA Power Networks’
network that provide the context for SA Power Networks’
network tariff strategy.
3 Regulatory
Requirements
Summarises the regulatory requirements as they relate to SA
Power Networks’ Pricing Proposal including the relevant
requirements of the Rules and the AER’s 2015 Final Decision.
It also describes the requirements concerning the recovery of
the Jurisdictional Scheme Amount, to fund Feed-in Tariff
payments made to customers with solar PV generators.
4 Network Tariff
Strategy
Outlines SA Power Networks’ Network Tariff Strategy and
indicates how tariff charging parameters are expected to

SA Power Networks
SA Power Networks Pricing Proposal 2016/17 Page 17 of 110
Section Purpose
vary.
5 Tariff Classes Defines the tariffs and tariff classes into which SA Power
Networks’ customers for direct control services are divided
and their charging parameters.
6 Standard Control
Services Tariffs
(NUoS)
Describes the nature and extent of the change in SA Power
Networks’ NUoS tariffs between 2015/16 and 2016/17
including the effects of distribution, transmission and PV FiT
recovery combined.
7 Customer Impacts
(NUoS)
Outlines the expected customer impacts of Network Use of
System (NUoS) prices in 2016/17 and the system of reviewing
those impacts throughout the regulatory control period.
8 Pricing of Standard
Control Services
(DUoS component)
Demonstrates that SA Power Networks’ 2016/17 DUoS prices
comply with the revenue X factors, side constraints and the
NER Pricing Principles.
9 Recovery of
Distribution Costs
Sets out SA Power Networks’ Distribution cost recovery tariff
setting methodology and demonstrates adjustments made to
the tariffs resulting from the actual, estimated and forecast
recovery of these charges in 2015/16 and 2016/17.
10 Recovery of
Transmission Costs
Sets out SA Power Networks’ Transmission cost recovery
tariff setting methodology and demonstrates adjustments
made to the tariffs resulting from the actual, estimated and
forecast recovery of these charges in 2014/15, 2015/16 and
2016/17.
11 Recovery of the PV FiT
Jurisdictional Scheme
Amount
Sets out SA Power Networks’ approach to the recovery of the
Jurisdictional Scheme Amount for the recovery of SA
Government Feed-in Tariff payments made by SA Power
Networks to customers with qualifying solar PV generators.
Covers the actual, estimated and forecast outcomes for
2014/15, 2015/16 and 2016/17.
12 Customer Assignment
and Reassignment
Sets out SA Power Networks’ tariff assignment and
reassignment strategy, in line with the AER’s requirements
from the Final Decision (Attachment 14).
13 Alternative Control
Services
Sets out SA Power Networks’ tariffs for alternative control
metering services, in line with the AER’s requirements from
the Final Decision.
SA Power Networks
SA Power Networks Pricing Proposal 2016/17 Page 18 of 110
Section Purpose
Appendices Separately provided.
SA Power Networks
SA Power Networks Pricing Proposal 2016/17 Page 19 of 110
1.4 Confidential information
Clause 6.19.2 of the Rules classifies as confidential all network pricing information about a
Distribution Network User used by a DNSP for the purposes of network pricing. SA Power Networks
has nominated Attachments B and G which constitute part of this Pricing Proposal, as confidential.
SA Power Networks requests that the AER does not disclose the information contained in these
confidential attachments to any person outside of the AER.
SA Power Networks
SA Power Networks Pricing Proposal 2016/17 Page 20 of 110
2 Our Context
This Section of the Pricing Proposal provides contextual information on SA Power Networks’ business
circumstances. This provides context both to SA Power Networks’ existing network tariffs and
pricing and the rationale for the changes to tariffs that are proposed during the 2015-20 regulatory
control period and beyond.
2.1 SA Power Networks’ business
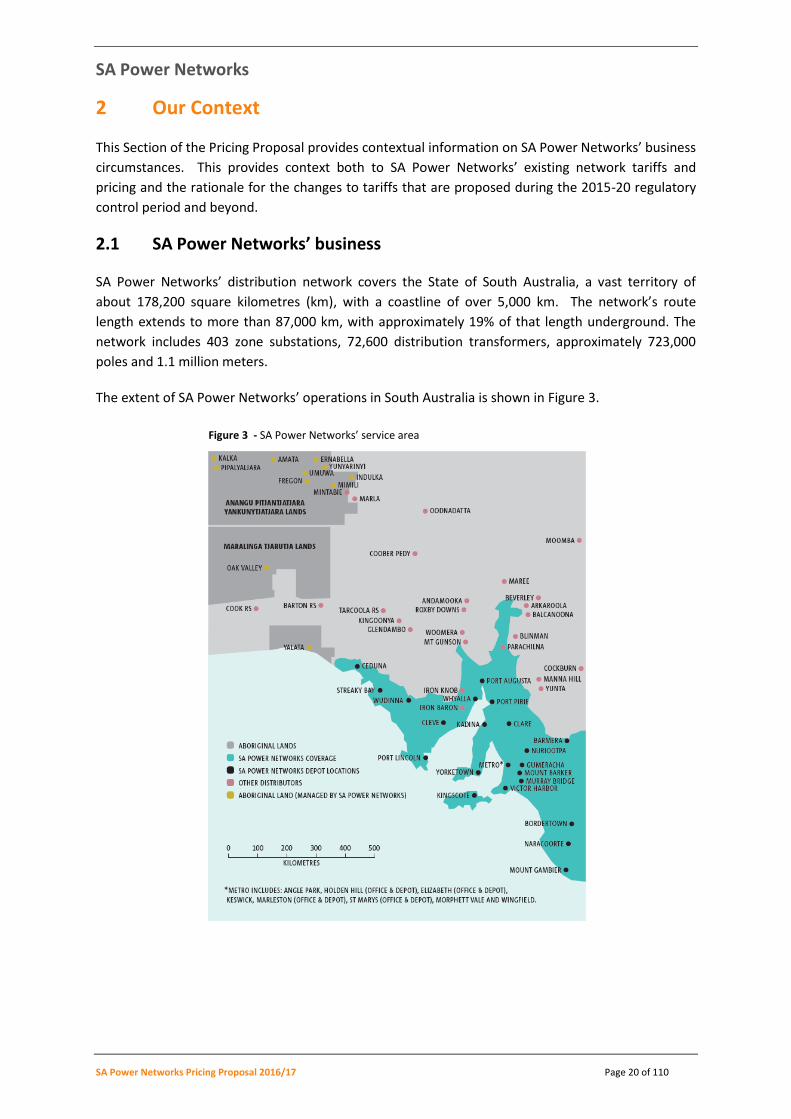
SA Power Networks’ distribution network covers the State of South Australia, a vast territory of
about 178,200 square kilometres (km), with a coastline of over 5,000 km. The network’s route
length extends to more than 87,000 km, with approximately 19% of that length underground. The
network includes 403 zone substations, 72,600 distribution transformers, approximately 723,000
poles and 1.1 million meters.
The extent of SA Power Networks’ operations in South Australia is shown in Figure 3.
Figure 3 - SA Power Networks’ service area
SA Power Networks
SA Power Networks Pricing Proposal 2016/17 Page 21 of 110
The South Australian distribution network is predominantly three-phase, with a single-phase system
used mostly in rural and remote areas. A sub-transmission network supplies and links zone
substations, operating at 66 kilovolts (kV) and 33 kV. In rural and remote areas the single-phase
system operates at 19 kV. Overall, some 30% of the network is comprised of these long ‘single wire
earth return’ (SWER) lines. In higher density rural and urban locations, the three-phase feeder
system operates at 11 kV. The standard low voltage customer supply is 230V at 50Hz.
With the exception of much of the coastal area and the hinterland, South Australia is very sparsely
settled. Approximately 70% of customers reside in Adelaide, including the great majority of business
and commercial customers. However, the extensive area serviced by distribution means that 70% of
the network infrastructure is required to deliver energy to the remaining 30% of customers.
Compared with other states, there are relatively few regional centres, and they are generally small
and located widely across the territory.
As a result, the average customer density across the State is very low. This discussed further in
Section 2.5 below.
2.2 Climatic conditions
Adelaide and much of South Australia has a dry climate featuring greater extremes of summer
temperature than most other Australian capitals. Extended periods of heatwave conditions can
occur in summer (November 2009 and January 2014 are recent examples of extended heatwaves).
During these heatwave periods, summer daytime temperatures can exceed 40oC for several days in a
row and overnight minimums can remain above 30oC for some of those days.
2.3 SA Power Networks’ customer and demand profile
The South Australian climate has led to an extraordinary demand for air conditioning. Over 90% of
homes are air conditioned with the air-conditioned floor space of these homes increasing each year.
The consequent high peak network demand occurs for only a small part of the year. At other times
in summer, milder weather often occurs which requires no air conditioning in most homes.
Extremely ‘peaky’ conditions such as these heatwaves require network assets and capacity that is
under-utilised during much of the year, driving distribution costs higher on a per unit of energy
served basis than comparable interstate networks.
A more recent development has been the customer uptake of PV systems by small customers.
About 25% of residential customers now have PV systems operating, reducing their use of energy
when the sun is shining. The incentives of the solar PV feed-in tariff schemes have been popular,
and customers have responded to the incentives provided.
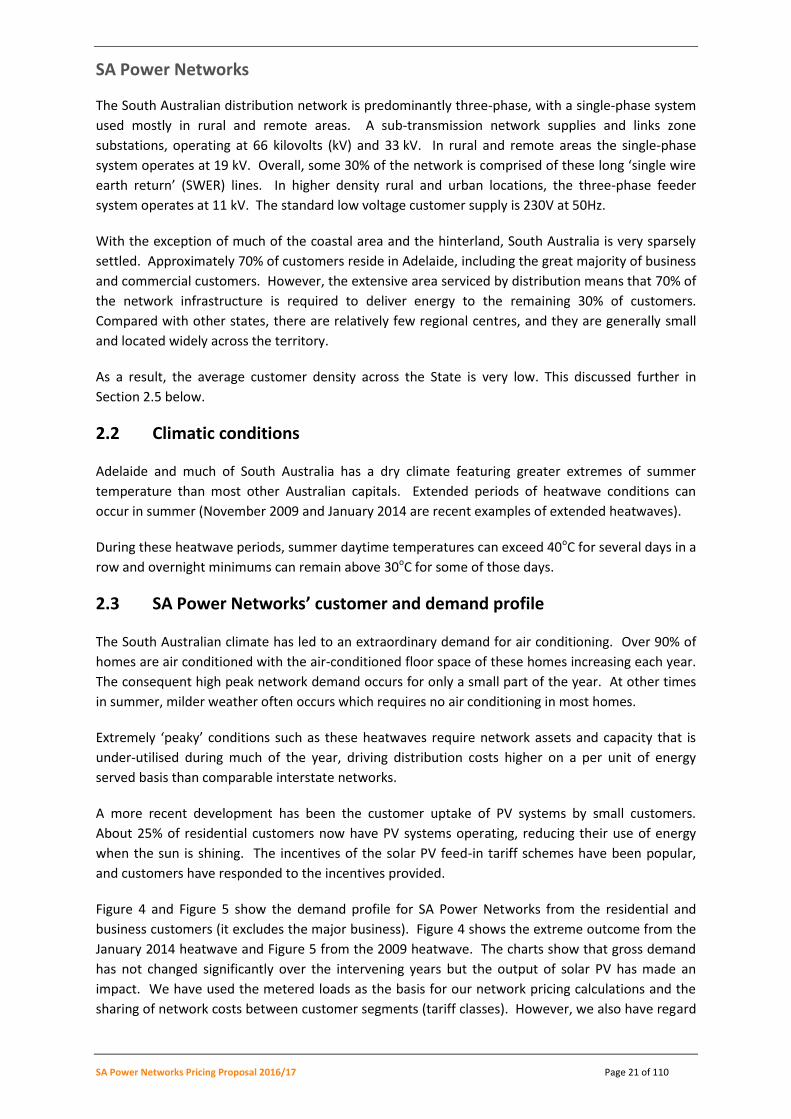
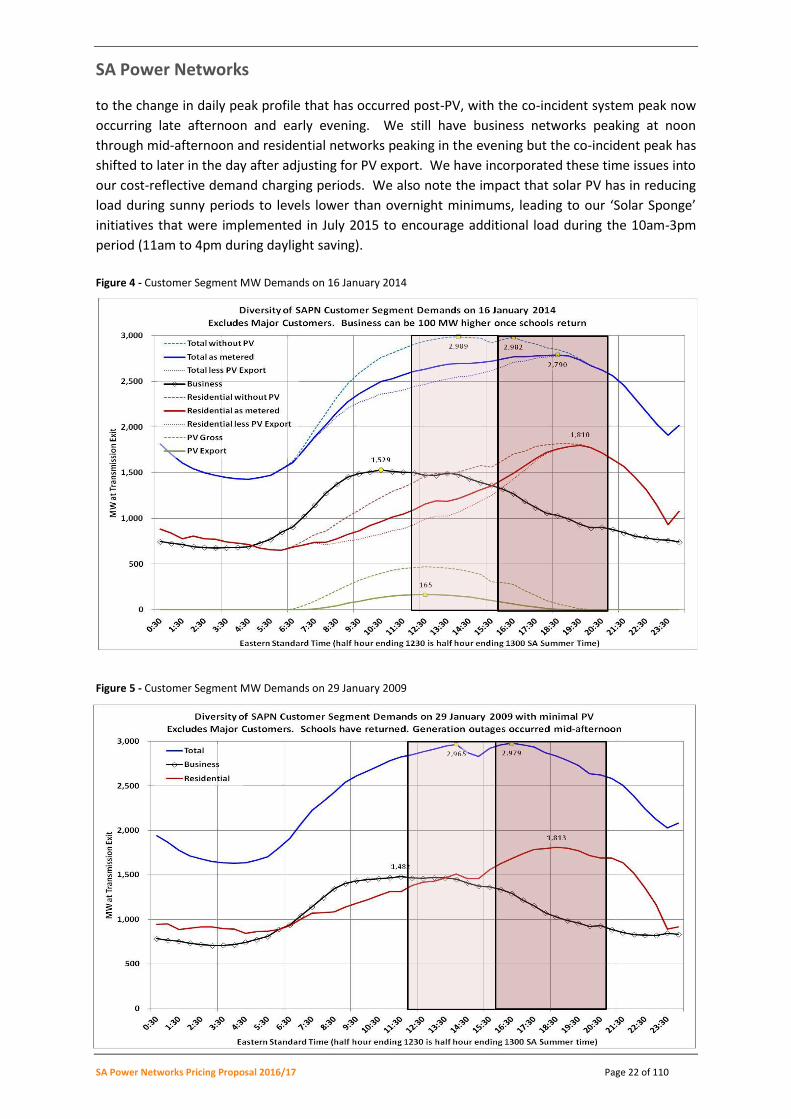
Figure 4 and Figure 5 show the demand profile for SA Power Networks from the residential and
business customers (it excludes the major business). Figure 4 shows the extreme outcome from the
January 2014 heatwave and Figure 5 from the 2009 heatwave. The charts show that gross demand
has not changed significantly over the intervening years but the output of solar PV has made an
impact. We have used the metered loads as the basis for our network pricing calculations and the
sharing of network costs between customer segments (tariff classes). However, we also have regard
SA Power Networks
SA Power Networks Pricing Proposal 2016/17 Page 22 of 110
to the change in daily peak profile that has occurred post-PV, with the co-incident system peak now
occurring late afternoon and early evening. We still have business networks peaking at noon
through mid-afternoon and residential networks peaking in the evening but the co-incident peak has
shifted to later in the day after adjusting for PV export. We have incorporated these time issues into
our cost-reflective demand charging periods. We also note the impact that solar PV has in reducing
load during sunny periods to levels lower than overnight minimums, leading to our ‘Solar Sponge’
initiatives that were implemented in July 2015 to encourage additional load during the 10am-3pm
period (11am to 4pm during daylight saving).
Figure 4 - Customer Segment MW Demands on 16 January 2014
Figure 5 - Customer Segment MW Demands on 29 January 2009
SA Power Networks
SA Power Networks Pricing Proposal 2016/17 Page 23 of 110
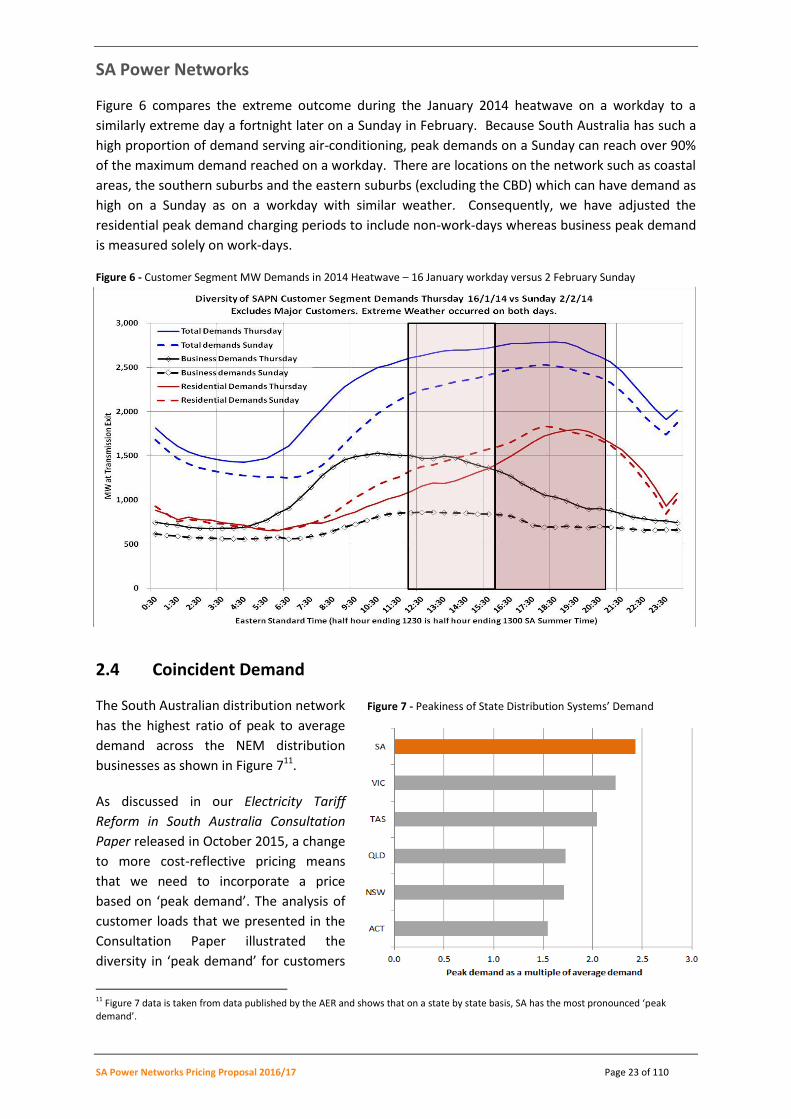
Figure 6 compares the extreme outcome during the January 2014 heatwave on a workday to a
similarly extreme day a fortnight later on a Sunday in February. Because South Australia has such a
high proportion of demand serving air-conditioning, peak demands on a Sunday can reach over 90%
of the maximum demand reached on a workday. There are locations on the network such as coastal
areas, the southern suburbs and the eastern suburbs (excluding the CBD) which can have demand as
high on a Sunday as on a workday with similar weather. Consequently, we have adjusted the
residential peak demand charging periods to include non-work-days whereas business peak demand
is measured solely on work-days.
Figure 6 - Customer Segment MW Demands in 2014 Heatwave – 16 January workday versus 2 February Sunday
2.4 Coincident Demand
The South Australian distribution network Figure 7 - Peakiness of State Distribution Systems’ Demand
has the highest ratio of peak to average
demand across the NEM distribution
businesses as shown in Figure 711.
As discussed in our Electricity Tariff
Reform in South Australia Consultation
Paper released in October 2015, a change
to more cost-reflective pricing means
that we need to incorporate a price
based on ‘peak demand’. The analysis of
customer loads that we presented in the
Consultation Paper illustrated the
diversity in ‘peak demand’ for customers
11 Figure 7 data is taken from data published by the AER and shows that on a state by state basis, SA has the most pronounced ‘peak demand’.
SA Power Networks
SA Power Networks Pricing Proposal 2016/17 Page 24 of 110
with the same annual consumption. With such a difference between peak demand and average
demand (the pricing basis for our current tariffs) it is inevitable that reforming tariffs to one
involving peak demand will have a significant customer impact on the distribution of energy costs.
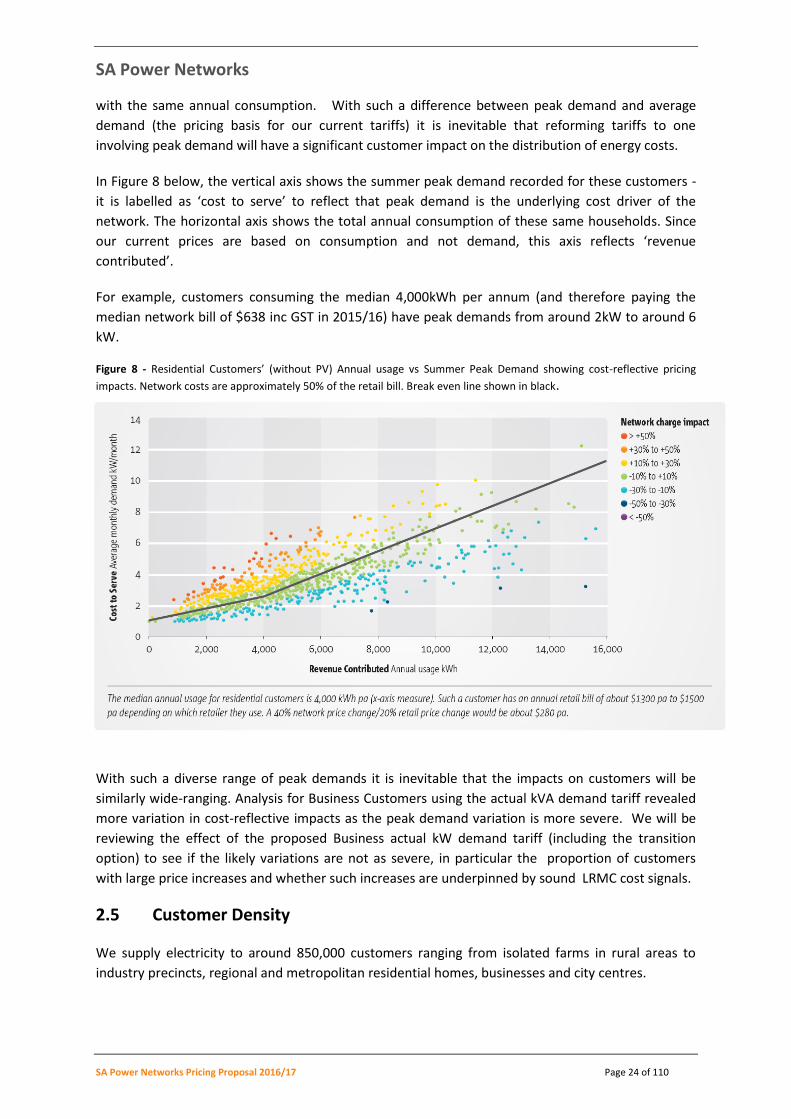
In Figure 8 below, the vertical axis shows the summer peak demand recorded for these customers -
it is labelled as ‘cost to serve’ to reflect that peak demand is the underlying cost driver of the
network. The horizontal axis shows the total annual consumption of these same households. Since
our current prices are based on consumption and not demand, this axis reflects ‘revenue
contributed’.
For example, customers consuming the median 4,000kWh per annum (and therefore paying the
median network bill of $638 inc GST in 2015/16) have peak demands from around 2kW to around 6
kW.
Figure 8 - Residential Customers’ (without PV) Annual usage vs Summer Peak Demand showing cost-reflective pricing
impacts. Network costs are approximately 50% of the retail bill. Break even line shown in black.
With such a diverse range of peak demands it is inevitable that the impacts on customers will be
similarly wide-ranging. Analysis for Business Customers using the actual kVA demand tariff revealed
more variation in cost-reflective impacts as the peak demand variation is more severe. We will be
reviewing the effect of the proposed Business actual kW demand tariff (including the transition
option) to see if the likely variations are not as severe, in particular the proportion of customers
with large price increases and whether such increases are underpinned by sound LRMC cost signals.
2.5 Customer Density
We supply electricity to around 850,000 customers ranging from isolated farms in rural areas to
industry precincts, regional and metropolitan residential homes, businesses and city centres.
SA Power Networks
SA Power Networks Pricing Proposal 2016/17 Page 25 of 110
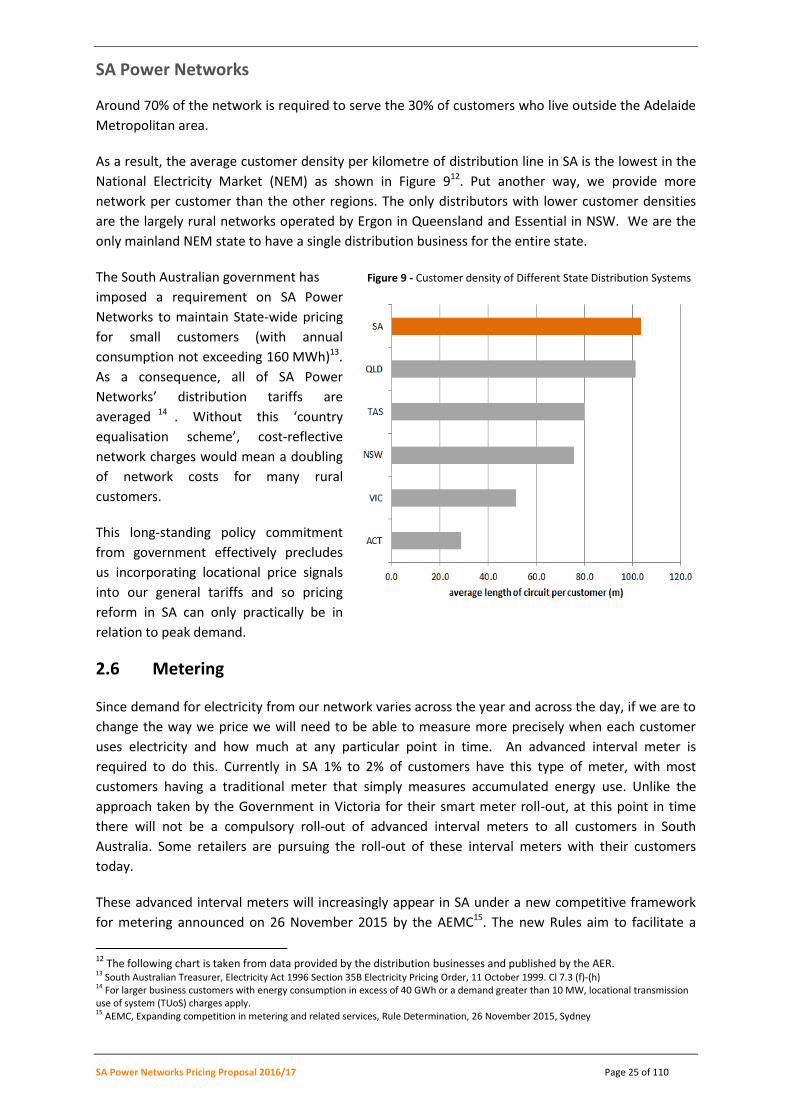
Around 70% of the network is required to serve the 30% of customers who live outside the Adelaide
Metropolitan area.
As a result, the average customer density per kilometre of distribution line in SA is the lowest in the
National Electricity Market (NEM) as shown in Figure 912. Put another way, we provide more
network per customer than the other regions. The only distributors with lower customer densities
are the largely rural networks operated by Ergon in Queensland and Essential in NSW. We are the
only mainland NEM state to have a single distribution business for the entire state.
The South Australian government has Figure 9 - Customer density of Different State Distribution Systems
imposed a requirement on SA Power
Networks to maintain State-wide pricing
for small customers (with annual
consumption not exceeding 160 MWh)13.
As a consequence, all of SA Power
Networks’ distribution tariffs are
averaged 14 . Without this ‘country
equalisation scheme’, cost-reflective
network charges would mean a doubling
of network costs for many rural
customers.
This long-standing policy commitment
from government effectively precludes
us incorporating locational price signals
into our general tariffs and so pricing
reform in SA can only practically be in
relation to peak demand.
2.6 Metering
Since demand for electricity from our network varies across the year and across the day, if we are to
change the way we price we will need to be able to measure more precisely when each customer
uses electricity and how much at any particular point in time. An advanced interval meter is
required to do this. Currently in SA 1% to 2% of customers have this type of meter, with most
customers having a traditional meter that simply measures accumulated energy use. Unlike the
approach taken by the Government in Victoria for their smart meter roll-out, at this point in time
there will not be a compulsory roll-out of advanced interval meters to all customers in South
Australia. Some retailers are pursuing the roll-out of these interval meters with their customers
today.
These advanced interval meters will increasingly appear in SA under a new competitive framework
for metering announced on 26 November 2015 by the AEMC15. The new Rules aim to facilitate a
12
The following chart is taken from data provided by the distribution businesses and published by the AER. 13 South Australian Treasurer, Electricity Act 1996 Section 35B Electricity Pricing Order, 11 October 1999. Cl 7.3 (f)-(h) 14 For larger business customers with energy consumption in excess of 40 GWh or a demand greater than 10 MW, locational transmission use of system (TUoS) charges apply. 15 AEMC, Expanding competition in metering and related services, Rule Determination, 26 November 2015, Sydney
SA Power Networks
SA Power Networks Pricing Proposal 2016/17 Page 26 of 110
market-led (retailer-led) approach to the deployment of advanced interval meters. The changes to
the Rules also include provisions to ensure customers can have free access to their interval data.
From 1 December 2017, retailers will be responsible for arranging metering services for all small
customers (< 160MWh), not SA Power Networks. All new and replacement meters must also be
advanced interval meters that meet the ‘minimum services specification’ included in the new Rules.
Note that all customers can choose to have an advanced interval meter provided competitively
today if they so choose, not just the large business customers.
SA Power Networks
SA Power Networks Pricing Proposal 2016/17 Page 27 of 110
3 Regulatory requirements
This Section summarises the regulatory requirements pertaining to SA Power Networks’ Pricing
Proposal, including the relevant requirements of the Rules and those of the AER’s 2015-20 Final
Decision.
Transitional Rule 11.73.1(b) of the current NER (Ver 79) provides that pricing proposals for the
2015/16 and 2016/17 regulatory years are to be governed by Chapter 6 of version 65 of the Rules.
The latest AEMC Rule determination will apply from 2017/18 onwards.
3.1 Rules requirements
3.1.1 Required elements of a Pricing Proposal
To comply with clause 6.18.2 of the Rules16, SA Power Networks’ 2016/17 Pricing Proposal must
include the elements below:
6.18.2 Pricing proposals
(a) A Distribution Network Service Provider must:
(1) submit to the AER, as soon as practicable, and in any case within 15 business days,
after publication of the distribution determination, a pricing proposal (the initial
pricing proposal) for the first regulatory year of the regulatory control period; and
(2) submit to the AER, at least 2 months before the commencement of the second and
each subsequent regulatory year of the regulatory control period, a further pricing
proposal (an annual pricing proposal) for the relevant regulatory year.
(b) A pricing proposal must:
(1) set out the tariff classes that are to apply for the relevant regulatory year; and
(2) set out the proposed tariffs for each tariff class; and
(3) set out, for each proposed tariff, the charging parameters and the elements of
service to which each charging parameter relates; and
(4) set out, for each tariff class related to standard control services, the expected
weighted average revenue for the relevant regulatory year and also for the current
regulatory year; and
(5) set out the nature of any variation or adjustment to the tariff that could occur
during the course of the regulatory year and the basis on which it could occur; and
(6) set out how designated pricing proposal charges are to be passed on to customers
and any adjustments to tariffs resulting from over or under recovery of those
charges in the previous regulatory year; and
16 National Electricity Rules, version 65, 1 October 2014.
SA Power Networks
SA Power Networks Pricing Proposal 2016/17 Page 28 of 110
(6A) set out how jurisdictional scheme amounts for each approved jurisdictional scheme
are to be passed on to customers and any adjustments to tariffs resulting from over
or under recovery of those amounts; and
(6B) describe how each approved jurisdictional scheme that has been amended since
the last jurisdictional scheme approval date meets the jurisdictional scheme
eligibility criteria; and
(7) demonstrate compliance with the Rules and any applicable distribution
determination; and
(8) describe the nature and extent of change from the previous regulatory year and
demonstrate that the changes comply with the Rules and any applicable
distribution determination.
This Pricing Proposal has been prepared by SA Power Networks in such a way as to demonstrate in a
logical sequence that it complies with all of the requirements of clause 6.18.2(b) of the Rules above.
The other relevant Sections of the Rules that have been addressed in formulating this Pricing
Proposal are as follows:
6.18.3 Tariff classes
6.18.5 Pricing principles
6.18.6 Side constraints on tariffs for standard control services
6.18.7 Recovery of designated pricing proposal changes
6.18.8 Approval of pricing proposal
6.18.9 Publication of information about tariffs and tariff classes
Reference to these clauses has been made in the appropriate Sections of this Pricing Proposal, to
demonstrate how SA Power Networks has complied with each applicable Rules provision.
3.2 Requirements of the AER’s 2015 Final Decision
The AER’s October 2015 Final Decision for South Australia has been made pursuant to the provisions
of clause 6.11.1 of the Rules and imposes a number of requirements that are relevant to a Pricing
Proposal. The relevant requirements are as follows:
Attachment 1 Annual revenue requirement
Attachment 11 Service target performance incentive scheme
Attachment 12 DMIS arrangements
Attachment 13 Classification of services
Attachment 14 Control mechanism
o Application of the revenue cap, and under/over recovery mechanism for
DUoS
SA Power Networks
SA Power Networks Pricing Proposal 2016/17 Page 29 of 110
o Under/over recovery for transmission (TUoS)
o Under/over-recovery of jurisdictional schemes (PV FiT)
o Revenue control and Pricing side constraint formulae
o Assigning retail customers to tariff classes
Attachment 15 Pass through events
Attachment 16 Alternative control services
Where it is necessary to demonstrate that SA Power Networks has complied with a requirement of
the AER’s Decision, reference to the relevant component of the Decision has been made in the
appropriate Section of this Pricing Proposal.
3.3 Principal elements of the AER’s 2015 Final Decision
The principal elements of the AER’s Decision pertaining to direct control services (comprising
standard and alternative control services) are outlined in this section.
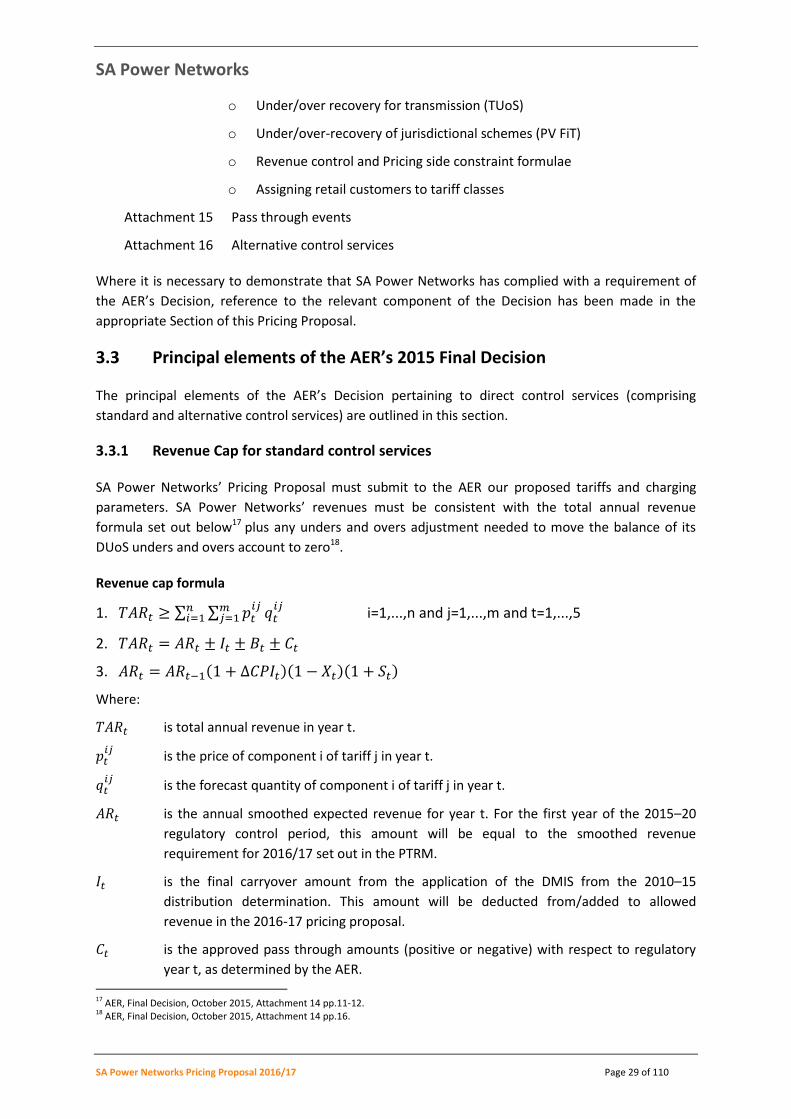
3.3.1 Revenue Cap for standard control services
SA Power Networks’ Pricing Proposal must submit to the AER our proposed tariffs and charging
parameters. SA Power Networks’ revenues must be consistent with the total annual revenue
formula set out below17 plus any unders and overs adjustment needed to move the balance of its
DUoS unders and overs account to zero18.
Revenue cap formula
1.
i=1,...,n and j=1,...,m and t=1,...,5
2.
3.
Where:
is total annual revenue in year t.
is the price of component i of tariff j in year t.
is the forecast quantity of component i of tariff j in year t.
is the annual smoothed expected revenue for year t. For the first year of the 2015–20
regulatory control period, this amount will be equal to the smoothed revenue
requirement for 2016/17 set out in the PTRM.
is the final carryover amount from the application of the DMIS from the 2010–15
distribution determination. This amount will be deducted from/added to allowed
revenue in the 2016-17 pricing proposal.
is the approved pass through amounts (positive or negative) with respect to regulatory
year t, as determined by the AER.
17 AER, Final Decision, October 2015, Attachment 14 pp.11-12. 18 AER, Final Decision, October 2015, Attachment 14 pp.16.
SA Power Networks
SA Power Networks Pricing Proposal 2016/17 Page 30 of 110
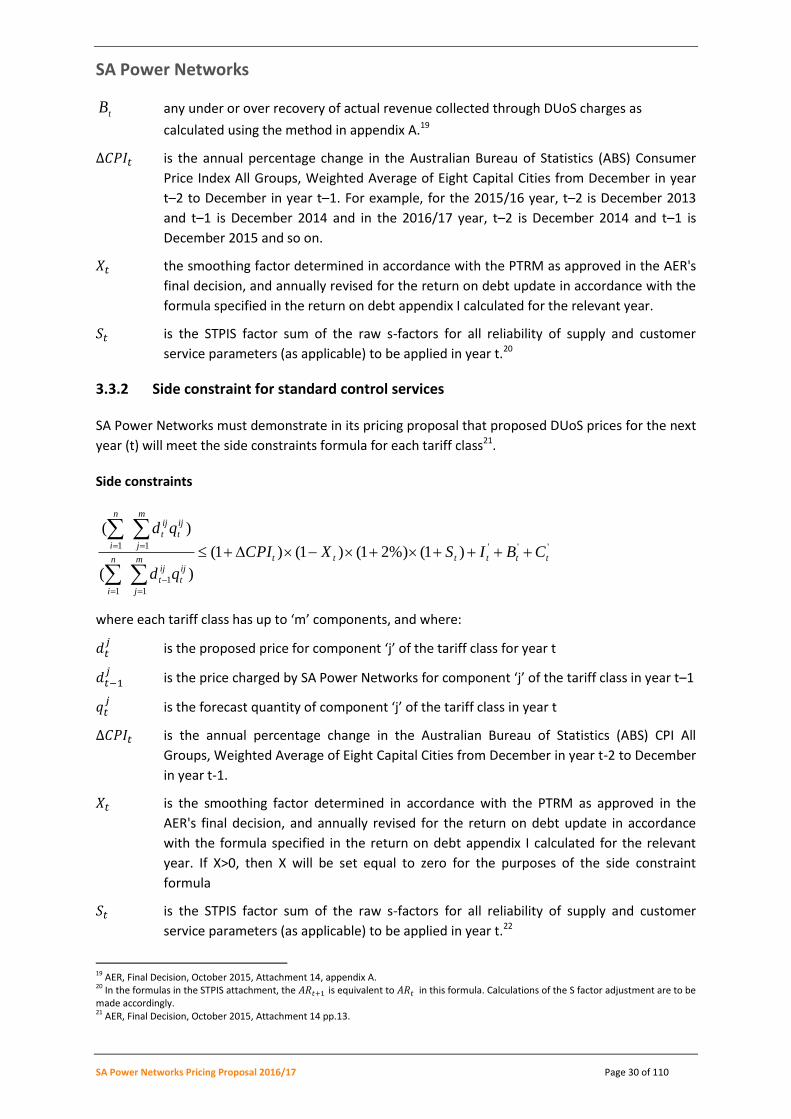
tB any under or over recovery of actual revenue collected through DUoS charges as
calculated using the method in appendix A.19
is the annual percentage change in the Australian Bureau of Statistics (ABS) Consumer
Price Index All Groups, Weighted Average of Eight Capital Cities from December in year
t–2 to December in year t–1. For example, for the 2015/16 year, t–2 is December 2013
and t–1 is December 2014 and in the 2016/17 year, t–2 is December 2014 and t–1 is
December 2015 and so on.
the smoothing factor determined in accordance with the PTRM as approved in the AER's
final decision, and annually revised for the return on debt update in accordance with the
formula specified in the return on debt appendix I calculated for the relevant year.
is the STPIS factor sum of the raw s-factors for all reliability of supply and customer
service parameters (as applicable) to be applied in year t.20
3.3.2 Side constraint for standard control services
SA Power Networks must demonstrate in its pricing proposal that proposed DUoS prices for the next
year (t) will meet the side constraints formula for each tariff class21.
Side constraints
'''
1
1
1
11)1(%)21()1()1(
)(
)(
ttttttm
j
ij
t
ij
t
n
i
m
j
ij
t
ij
t
n
iCBISXCPI
qd
qd
where each tariff class has up to ‘m’ components, and where:
is the proposed price for component ‘j’ of the tariff class for year t
is the price charged by SA Power Networks for component ‘j’ of the tariff class in year t–1
is the forecast quantity of component ‘j’ of the tariff class in year t
is the annual percentage change in the Australian Bureau of Statistics (ABS) CPI All
Groups, Weighted Average of Eight Capital Cities from December in year t-2 to December
in year t-1.
is the smoothing factor determined in accordance with the PTRM as approved in the
AER's final decision, and annually revised for the return on debt update in accordance
with the formula specified in the return on debt appendix I calculated for the relevant
year. If X>0, then X will be set equal to zero for the purposes of the side constraint
formula
is the STPIS factor sum of the raw s-factors for all reliability of supply and customer
service parameters (as applicable) to be applied in year t.22
19 AER, Final Decision, October 2015, Attachment 14, appendix A. 20 In the formulas in the STPIS attachment, the is equivalent to in this formula. Calculations of the S factor adjustment are to be made accordingly. 21 AER, Final Decision, October 2015, Attachment 14 pp.13.
SA Power Networks
SA Power Networks Pricing Proposal 2016/17 Page 31 of 110
tI is the final carryover amount from the application of the DMIS from the 2010–15
distribution determination. This amount will be deducted from/added to allowed
revenue in the 2016/17 pricing proposal.
tB any under or over recovery of actual revenue collected through DUoS charges as
calculated using the method in appendix A. 23
tC is the sum of adjustments relating to pass through events.
is an annual adjustment factor related to the balance of the DUoS unders and overs
account with respect to regulatory year t
With the exception of the CPI and X factors, the percentage for each of the other factors above can
be calculated by dividing the incremental revenues (as used in the total annual revenue formula) for
each factor by the expected revenues for regulatory year t–1 (based on the prices in year t–1
multiplied by the forecast quantities for year t).
3.3.3 Revenue requirement and pricing X factors for standard control services
Attachment 1 of the Decision contains SA Power Networks’ standard control service 2015/16
smoothed revenue requirements of $682 M and revenue X factors for subsequent years.
Attachment 16 contains alternative control metering services prices for 2015/16 and price X factors
for subsequent years.
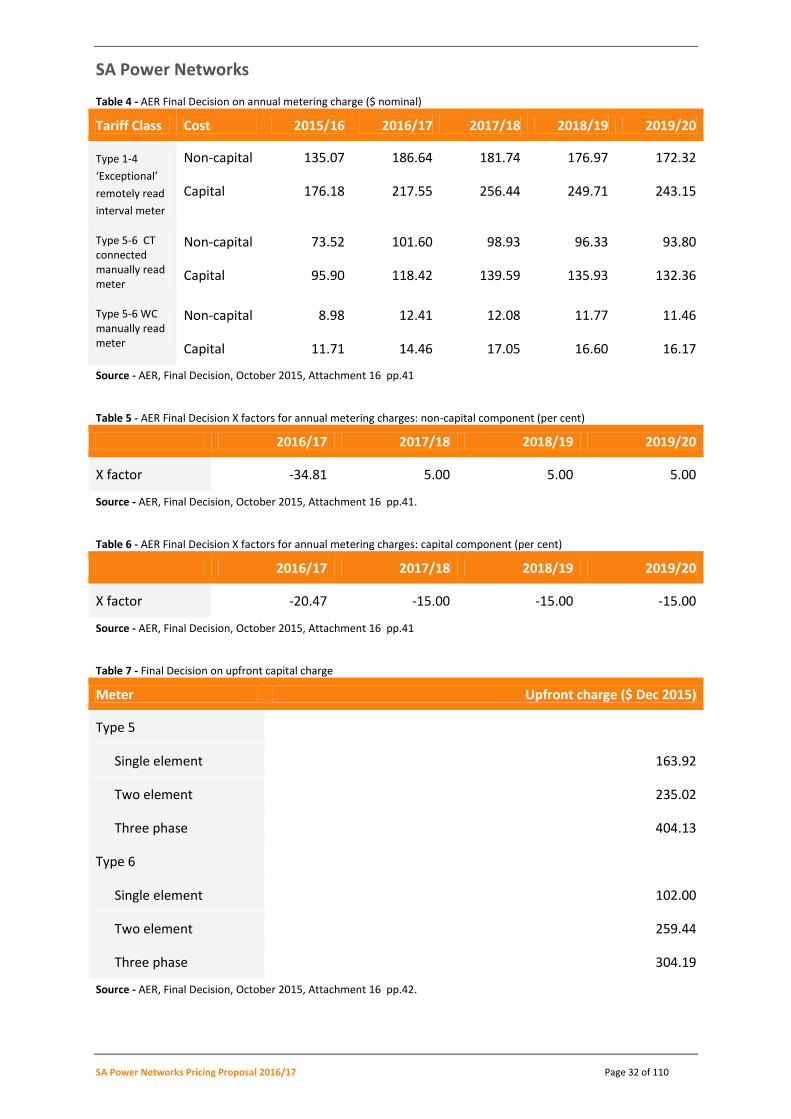
3.3.4 Price Cap for alternative control services
The AER’s Final Decision has set the annual metering charges for 2016/17 as shown in Tables 4 to 8.
Most small customers will incur the non-capital and capital charges, typically for a type 5-6
Whole Current (WC) manually read meter with quarterly readings. There are other charges
for Current Transformer (CT) meters and Exceptional meters supplied by SA Power
Networks.
Customers who do not use SA Power Networks’ meters at June 2015 continue to not get a
charge.
Customers who switch to another meter provider from July 2015 will still incur the capital-
related charge.
New customers from July 2016 electing to use an SA Power Networks’ meter will incur the
upfront capital charge, as well as the ongoing non-capital charge.
Metering charges are discussed further later in this Pricing Proposal.
22 In the formulas in the STPIS attachment, the is equivalent to in this formula. Calculations of the S factor adjustment are to be made accordingly. 23 AER, Final Decision, October 2015, Attachment 14, appendix A.
SA Power Networks
SA Power Networks Pricing Proposal 2016/17 Page 32 of 110
Table 4 - AER Final Decision on annual metering charge ($ nominal)
Tariff Class Cost 2015/16 2016/17 2017/18 2018/19 2019/20
Type 1-4
‘Exceptional’
remotely read
interval meter
Non-capital 135.07 186.64 181.74 176.97 172.32
Capital 176.18 217.55 256.44 249.71 243.15
Type 5-6 CT connected manually read meter
Non-capital 73.52 101.60 98.93 96.33 93.80
Capital 95.90 118.42 139.59 135.93 132.36
Type 5-6 WC manually read meter
Non-capital 8.98 12.41 12.08 11.77 11.46
Capital 11.71 14.46 17.05 16.60 16.17
Source - AER, Final Decision, October 2015, Attachment 16 pp.41
Table 5 - AER Final Decision X factors for annual metering charges: non-capital component (per cent)
2016/17 2017/18 2018/19 2019/20
X factor -34.81 5.00 5.00 5.00
Source - AER, Final Decision, October 2015, Attachment 16 pp.41.
Table 6 - AER Final Decision X factors for annual metering charges: capital component (per cent)
2016/17 2017/18 2018/19 2019/20
X factor -20.47 -15.00 -15.00 -15.00
Source - AER, Final Decision, October 2015, Attachment 16 pp.41
Table 7 - Final Decision on upfront capital charge
Meter Upfront charge ($ Dec 2015)
Type 5
Single element 163.92
Two element 235.02
Three phase 404.13
Type 6
Single element 102.00
Two element 259.44
Three phase 304.19
Source - AER, Final Decision, October 2015, Attachment 16 pp.42.
SA Power Networks
SA Power Networks Pricing Proposal 2016/17 Page 33 of 110
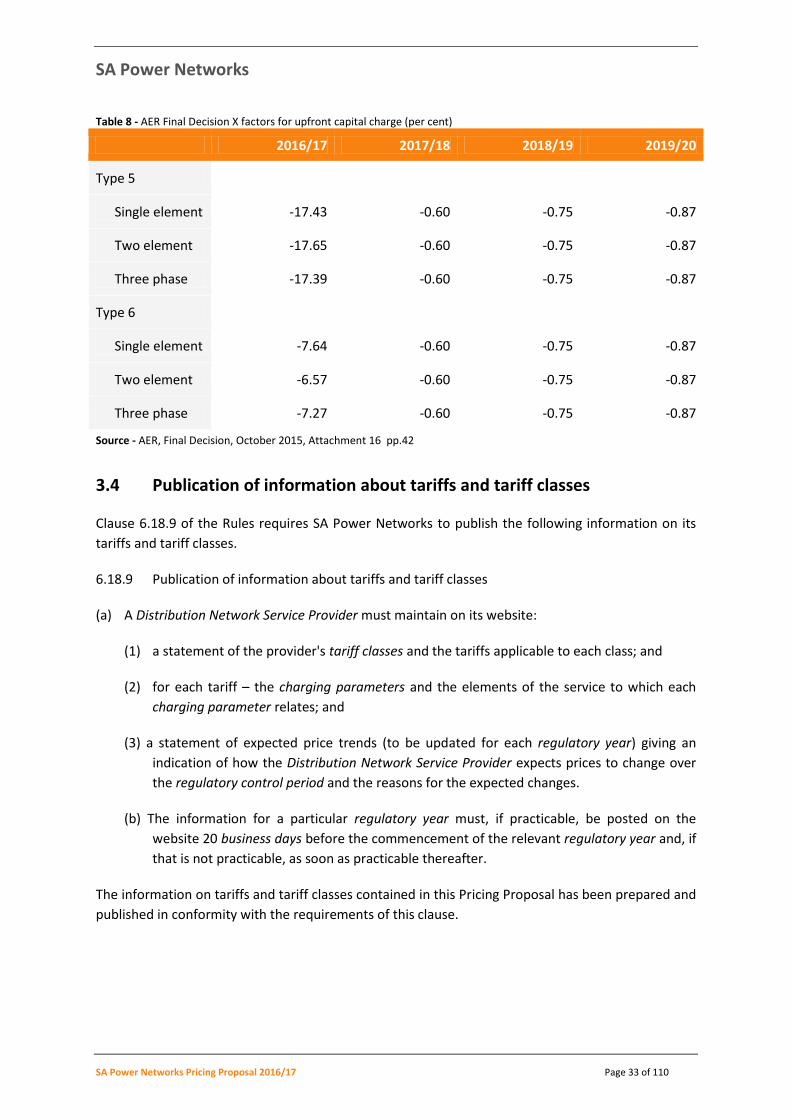
Table 8 - AER Final Decision X factors for upfront capital charge (per cent)
2016/17 2017/18 2018/19 2019/20
Type 5
Single element -17.43 -0.60 -0.75 -0.87
Two element -17.65 -0.60 -0.75 -0.87
Three phase -17.39 -0.60 -0.75 -0.87
Type 6
Single element -7.64 -0.60 -0.75 -0.87
Two element -6.57 -0.60 -0.75 -0.87
Three phase -7.27 -0.60 -0.75 -0.87
Source - AER, Final Decision, October 2015, Attachment 16 pp.42
3.4 Publication of information about tariffs and tariff classes
Clause 6.18.9 of the Rules requires SA Power Networks to publish the following information on its
tariffs and tariff classes.
6.18.9 Publication of information about tariffs and tariff classes
(a) A Distribution Network Service Provider must maintain on its website:
(1) a statement of the provider's tariff classes and the tariffs applicable to each class; and
(2) for each tariff – the charging parameters and the elements of the service to which each
charging parameter relates; and
(3) a statement of expected price trends (to be updated for each regulatory year) giving an
indication of how the Distribution Network Service Provider expects prices to change over
the regulatory control period and the reasons for the expected changes.
(b) The information for a particular regulatory year must, if practicable, be posted on the
website 20 business days before the commencement of the relevant regulatory year and, if
that is not practicable, as soon as practicable thereafter.
The information on tariffs and tariff classes contained in this Pricing Proposal has been prepared and
published in conformity with the requirements of this clause.
SA Power Networks
SA Power Networks Pricing Proposal 2016/17 Page 34 of 110
4 Network tariff strategy
This Section contains the objectives that SA Power Networks applies to the development of its
network tariffs. It goes on to outline the strategies SA Power Networks proposes to pursue in
developing tariffs during the 2015-20 regulatory control period.
In order to drive improved efficiency, the NER have changed and require us to develop what can be
referred to as a more ‘user pays’ approach to the way we price our network. Under the changes to
the rules, our pricing needs to become more cost- reflective to better signal the cost of building and
maintaining a network to meet the infrequent peaks in demand.
The changes to the Rules apply in SA from 1 July 2017 and SA Power Networks submitted its initial
Tariff Structure Statement (2017-20) to the AER in December 2015.
The impact of the Rule change will be mainly felt by households and small businesses but as
determined largely by the availability of interval meters. As discussed below, the transition to cost-
reflective pricing for our largest customers is well underway.
4.1 Regulatory Requirements
The information in this Section concerning potential future network tariff developments is provided
pursuant to clause 6.18.9 of the Rules.
6.18.9 Publication of information about tariffs and tariff classes
(a) A Distribution Network Service Provider must maintain on its website:
(3) a statement of expected price trends (to be updated for each regulatory year)
giving an indication of how the Distribution Network Service Provider expects prices
to change over the regulatory control period and the reasons for the expected
changes.
4.2 Network tariff objectives
This Section presents the high level framework that SA Power Networks applies to the development
of its network tariff strategy. They are as follows:
Revenue sufficiency - prices are formulated to recover permitted revenue under the
determination.
Revenue volatility - to the extent possible, tariffs will be structured to minimise monthly and
annual variations in revenue.
Pricing efficiency - through their variable components, prices will signal the economic cost of
providing network service. Residual costs will be recovered in a manner which least distorts
customers’ consumption decisions.
Customer equity - customers should pay a reasonable allocated share of costs and moves
towards pricing cost reflectivity need to be tempered to limit their impact on some
customers.
SA Power Networks
SA Power Networks Pricing Proposal 2016/17 Page 35 of 110
Pricing stability - to the extent possible undue variation in price levels should be avoided.
Side constraints must be complied with
Pricing simplicity - price structures should be understandable, simple and transparent.
The tariff reform program will involve numerous decisions along the way and requires SA Power
Networks to balance sometimes competing objectives. We have been refining a set of Customer
Impact Principles as a complement to the above objectives and the Pricing Principles established
under the National Electricity Rules24, for further details refer to Section 7.
Our longer term approach to implementing these nation-wide pricing reforms is encapsulated in our
initial TSS 2017-20 lodged with the Australian Energy Regulator in December 201525. From 2017 the
APP (i.e. this document) will be complementary to our TSS. Under the changes, the TSS will outline
our proposed changes over a five year regulatory period26, while the APP documents the subset of
those changes proposed in any given year.
For our 2016/17 APP we have placed particular emphasis on the the principles of Simplicity and
Fairness and Equity as we move towards more cost-reflective pricing.
4.3 The need for tariff reform
As explained in Section 2, to a greater extent than any other Australian distributor, SA Power
Networks’ summer demand is sensitive to the effect of air conditioning demand. High summer peak
demands occur during heat wave conditions, which correspond with periods when the elements of
the system have least capacity and the power factor of loads is poor.
Over the last five years, the new development has been solar PV systems, especially within the
residential networks. We now have about 25% penetration of these systems and there can be in
excess of 500 MW of generation occurring near midday for over half of the year when the sun is
shining. The network challenges are different today, with problems of low load during days with
mild but sunny weather. In summer, the peaks that used to occur between 2pm and 5pm have
moved to become slightly lower peaks between 5pm and 8pm. There are still business network
peaks during the day but residential systems and co-incident systems27 are now peaking later.
The next development coming is battery storage, and perhaps electric vehicles. The battery storage
has the potential to soak up a lot of the excess energy being generated during sunshine and shift
that to later in the day when the network peaks. How this will develop in summer is unclear, but
network tariffs that give good signals for economic peak-lopping will assist in the development of a
more efficient and economic network. If electric vehicles do take off, we will again need clear signals
to customers that enable them to recharge their car with convenience but without creating new
24
In our initial TSS (December 2015), we proposed some draft Customer Impact Principles based on responses to questions in our Consultation Paper and other parts of our engagement up to that point, and Principles developed by peer businesses in other states. 25
www.aer.gov.au/networks-pipelines/determinations-access-arrangements/pricing-proposals-tariffs/sa-power-networks-tariff-structure-statement-2015 Further information is also available on our Talking Power website: http://talkingpower.com.au/your-views/tariff-structure-statement-consultation/ 26
In this case, due to the timing of the introduction of the changes, our first TSS covers the final three years of our current regulatory period and this APP is required to be prepared in accordance with version 65 of the Rules (preceding the changes). However we are seeking to provide a consistent approach wherever possible. 27 Network peak ie the residential system and the whole of network system, are peaking at the same time.
SA Power Networks
SA Power Networks Pricing Proposal 2016/17 Page 36 of 110
peaks on the network. Technologies over the next five years will create quite strong pathways and
opportunities for the future development of the network.
As a consequence, the management of summer demand has a high priority in SA Power Networks’
tariff reform strategies. This leads to an emphasis on providing network price signals that will
encourage both residential and business customers to manage their demand by the following
means:
The price levels of existing tariff structures;
The development of more cost-reflective tariff structures; and
The development of innovative new tariff structures.
4.4 Network tariff strategy
SA Power Networks has a pricing strategy that will, within the limitations of metering arrangements
and efficient tariff structures, signal the costs associated with increased demand placed on the
network, including the use of air conditioning. Where metering arrangements don’t allow efficient
pricing structures to be used (eg with type 6 meters) then we will endeavour to ensure that a fair
level of cost-recovery occurs with those customers.
Consistent with the network tariff objectives outlined in Section 4.2, SA Power Networks’ network
tariff strategy aims to:
Attain revenue sufficiency under the Revenue Cap;
Signal the long run marginal cost of supply through its network tariffs;
Improve cost-reflectivity and reduce revenue variability by reducing the reliance on usage
based tariff components where appropriate;
Pass on the cost of ElectraNet’s transmission services to customers; and
Explore tariff based demand management opportunities, including voluntary capacity
based tariffs. Sections 4.6 through 4.7 outline future tariff reform options under
consideration and development.
4.5 Tariff reform 2005 to 2015
Over the last two regulatory control periods (2005-10 and 2010-15), SA Power Networks undertook
a number of tariff reforms, including the following:
Large businesses have been encouraged to adopt kVA demand price structures where
favourable, and have been mandatorily applied to customers using more than 250 kVA,
and since July 2010 for new customers (and alterations to supply) requiring more than 70
kVA. Some medium-sized businesses have also opted-in to the kVA demand prices;
Power factor correction for businesses has been facilitated through the use of an
excluded/negotiated service charge for excess reactive power requirements;
Simplifying the small customer tariffs used by residential and business customers to reduce
the number of steps. Prices in higher usage blocks have also been reduced relative to the
SA Power Networks
SA Power Networks Pricing Proposal 2016/17 Page 37 of 110
first block, reflecting better understanding of actual costs of supply to these customers;
and
A residential actual demand tariff (optional) was established in 2014/15, although its
adoption to date is limited. It plays an important role in indicating to customers and the
electricity industry the sort of tariff structures and incentives around which new housing
and new technology considerations should be made.
4.6 Cost-Reflective Tariffs for large businesses July 2015
In South Australia, there were some 4,500 large businesses and/or medium businesses on cost-
reflective tariffs prior to July 2015. A further 1,000 large businesses were not yet on cost-reflective
tariffs. There were about 250 of these large customers who still had type 6 metering which limits
tariff options. The other 750 customers had either only recently acquired interval metering or had
load profiles which meant that energy only tariffs were more advantageous than agreed demand
tariffs.
SA Power Networks proposed that assigning all large customers to cost-reflective tariffs in July 2015
as a critical step in the general implementation of such tariffs. With the large distribution price
reductions (and PV FiT recovery reductions), such transfers were easier to achieve whilst still giving
price reductions. To enable this tariff reform program to occur, we created two new tariffs to
complement the agreed demand tariff. We also simplified the current agreed demand tariff and
removed the constraints of minimum quantities.
The key steps undertaken to progress this initiative by July 2015 involved:
Transferring 500 customers from energy tariffs to agreed demand;
Offering 1200 customers currently on agreed demand a lower agreed demand;
Advising those 1200 customers and a further 2,000 customers that the agreed demand
period now includes November, and extends to 9pm;
Transferring 900 customers from agreed demand to actual demand (typically monthly);
Transferring 350 customers from energy to actual demand;
Transferring 64 customers from energy to a transition actual demand tariff;
Transferring the 250 large business customers still with type 6 meters to legacy tariffs for
business single and business 2-rate. These customers will receive price reductions when
they have interval metering installed and switch to a cost-reflective tariff;
Review the 200 High Voltage customers for the best tariff option and offer a lower agreed
demand where suitable; and
Review the 20 Major Businesses, ensuring proper determination of locational TUoS charges
and agreed demands.
We liaised with retailers on these arrangements, trying to ensure a smooth transition for customers
to the July 2015 pricing.
After these initiatives have been completed, we will look at the optimal cost-reflective arrangements
for the medium businesses (<160 MWh) that have interval metering. This will take effect from July
2016, noting that any such tariff assignment will be optional for these customers.

SA Power Networks
SA Power Networks Pricing Proposal 2016/17 Page 38 of 110
4.7 Future tariff reform options
SA Power Networks proposes to explore any benefits capable of being realised from continuing the
network tariff reform process. Within the limitations of the AER’s DMIA provisions, SA Power
Networks may obtain more first-hand information on customers’ usage of the network through trials
and associated customer research.
The following network tariff reforms may be pursued by SA Power Networks during the 2015-20
regulatory control period. They are discussed in more detail in our initial TSS proposal submitted to
the AER in December 2015:
Improving the design of demand tariffs, to enhance their cost reflectivity;
Continuing to assign more small business customers to network demand tariffs where it is
economically efficient to do so;
Exploring tariff based demand management opportunities at specific locations where
network constraints are developing; and
Encouraging more consumption from the residential network during sunny periods as loads
can be negative because of solar PV production.

SA Power Networks
SA Power Networks Pricing Proposal 2016/17 Page 39 of 110
5 Tariff Classes
This Section describes SA Power Networks’ standard control service tariff classes and the way in
which they have been constituted to comply with the requirements of the Rules and the AER’s
Determination.
In Attachment 13 of the AER’s Final Decision, the AER has classified the following distribution
services provided by SA Power Networks as standard control services28:
A.1 Standard network services
a. All network services except:
i. network services provided at the request of a distribution network user:
(i) with higher quality or reliability standards, or lower quality or reliability standards
(where permissible), than are required by the rules or any other applicable
regulatory instruments, or
(ii) in excess of levels of service or plant ratings required to be provided by SA Power
Networks' assets, or
ii. extension or augmentation of the distribution network associated with the provision of a
new connection point or upgrading of the capability of a connection point to the extent
that a distribution network user is required to make a financial contribution in
accordance with the rules, or
iii. other network services that are classified as negotiated distribution services in sections
A.6 to A.15 of this appendix A.
A.2 Standard connection services
a. All connection services except:
i. connection services provided at the request of a distribution network user:
(i) with higher quality or reliability standards, or lower quality or reliability standards
(where permissible), than are required by the rules or any other applicable
regulatory instruments, or
(ii) in excess of levels of service or plant ratings required to be provided by SA Power
Networks’ assets, or
ii. the provision of a new connection point or upgrading of the capability of a connection
point to the extent that a distribution network user is required to make a financial
contribution in accordance with the rules, or
iii. other connection services that are classified as negotiated distribution services in
sections A.6 to A.15 of this appendix A.
28 AER, Final Decision, October 2015, Attachment 13, pp. 15.
SA Power Networks
SA Power Networks Pricing Proposal 2016/17 Page 40 of 110
A.3 Unmetered metering services
a. The provision of metering services in respect of meters meeting the requirements of a
metering installation type 7.
5.1 Regulatory requirements
5.1.1 Rule requirements
SA Power Networks’ Pricing Proposal must contain the information on tariffs, tariff classes and
charging parameters as set out in clause 6.18.2 of the Rules.
6.18.2 Pricing proposals
(b) A pricing proposal must:
(1) set out the tariff classes that are to apply for the relevant regulatory year; and
(2) set out the proposed tariffs for each tariff class; and
(3) set out, for each proposed tariff, the charging parameters and the elements of
service to which each charging parameter relates.
SA Power Networks is also required to comply with the following requirements of clause 6.18.3 of
the Rules with respect to tariff classes.
6.18.3 Tariff classes
(a) A pricing proposal must define the tariff classes into which customers for direct control
services are divided.
(b) Each customer for direct control services must be a member of 1 or more tariff classes.
(c) Separate tariff classes must be constituted for customers to whom standard control
services are supplied and customers to whom alternative control services are supplied
(but a customer for both standard control services and alternative control services may
be a member of 2 or more tariff classes).
(d) A tariff class must be constituted with regard to:
(1) the need to group customers together on an economically efficient basis; and
(2) the need to avoid unnecessary transaction costs.
5.1.2 Requirements of the AER’s Decision
The AER has established procedures for assigning or reassigning customers to tariff classes in
Attachment 14 of its Final Decision. At the commencement of the regulatory control period, SA
Power Networks’ retail customers will be taken to be “assigned” to the tariff class which SA Power
Networks was charging that retail customer immediately prior to 1 July 201529.
Attachment 14 Section D of the Final Decision contains procedures for the reassigning of customers
to tariff classes, with which SA Power Networks must comply during the 2015-20 regulatory control
29 AER, Final Decision, October 2015, Attachment 14, p. 21.
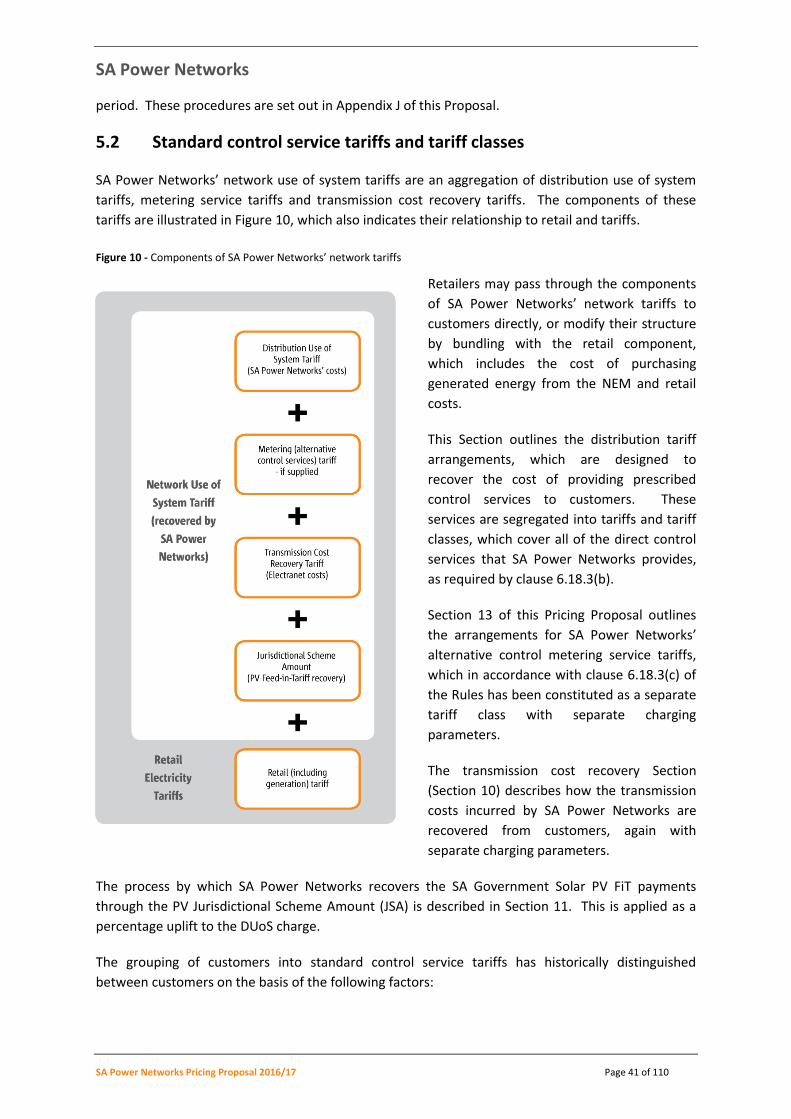
SA Power Networks
SA Power Networks Pricing Proposal 2016/17 Page 41 of 110
period. These procedures are set out in Appendix J of this Proposal.
5.2 Standard control service tariffs and tariff classes
SA Power Networks’ network use of system tariffs are an aggregation of distribution use of system
tariffs, metering service tariffs and transmission cost recovery tariffs. The components of these
tariffs are illustrated in Figure 10, which also indicates their relationship to retail and tariffs.
Figure 10 - Components of SA Power Networks’ network tariffs
Retailers may pass through the components
of SA Power Networks’ network tariffs to
customers directly, or modify their structure
by bundling with the retail component,
which includes the cost of purchasing
generated energy from the NEM and retail
costs.
This Section outlines the distribution tariff
arrangements, which are designed to
recover the cost of providing prescribed
control services to customers. These
services are segregated into tariffs and tariff
classes, which cover all of the direct control
services that SA Power Networks provides,
as required by clause 6.18.3(b).
Section 13 of this Pricing Proposal outlines
the arrangements for SA Power Networks’
alternative control metering service tariffs,
which in accordance with clause 6.18.3(c) of
the Rules has been constituted as a separate
tariff class with separate charging
parameters.
The transmission cost recovery Section
(Section 10) describes how the transmission
costs incurred by SA Power Networks are
recovered from customers, again with
separate charging parameters.
The process by which SA Power Networks recovers the SA Government Solar PV FiT payments
through the PV Jurisdictional Scheme Amount (JSA) is described in Section 11. This is applied as a
percentage uplift to the DUoS charge.
The grouping of customers into standard control service tariffs has historically distinguished
between customers on the basis of the following factors:
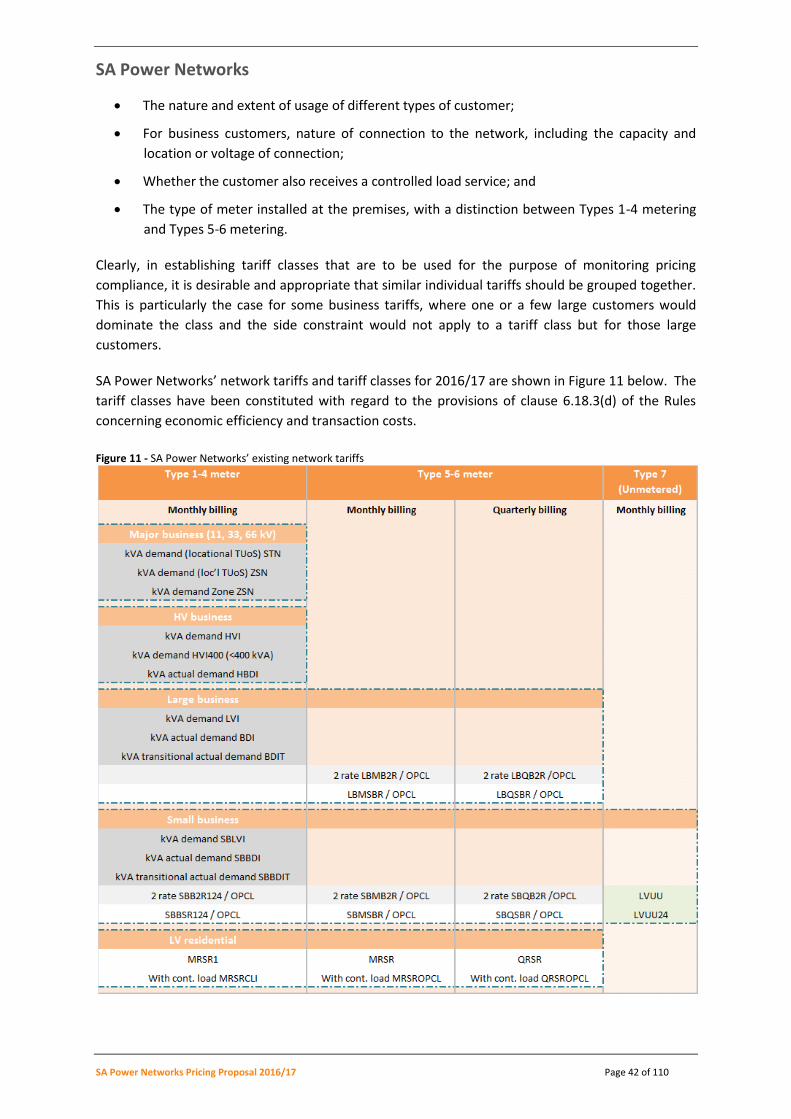
SA Power Networks
SA Power Networks Pricing Proposal 2016/17 Page 42 of 110
The nature and extent of usage of different types of customer;
For business customers, nature of connection to the network, including the capacity and
location or voltage of connection;
Whether the customer also receives a controlled load service; and
The type of meter installed at the premises, with a distinction between Types 1-4 metering
and Types 5-6 metering.
Clearly, in establishing tariff classes that are to be used for the purpose of monitoring pricing
compliance, it is desirable and appropriate that similar individual tariffs should be grouped together.
This is particularly the case for some business tariffs, where one or a few large customers would
dominate the class and the side constraint would not apply to a tariff class but for those large
customers.
SA Power Networks’ network tariffs and tariff classes for 2016/17 are shown in Figure 11 below. The
tariff classes have been constituted with regard to the provisions of clause 6.18.3(d) of the Rules
concerning economic efficiency and transaction costs.
Figure 11 - SA Power Networks’ existing network tariffs
SA Power Networks
SA Power Networks Pricing Proposal 2016/17 Page 43 of 110
5.2.1 Standard control services tariffs
The tariffs in Figure 11 cover a diverse range of customer requirements.
Residential customer tariffs have a fixed daily charge (termed the Supply Rate) and an inclining block
energy component, in common with the tariff structures of many utilities. In 2009/10, the inclining
block energy charge was modified to include four block levels. In 2014/15 the tariff reverted to two
blocks. A separate energy rate applies to the energy consumption within each block level. A
residential actual demand tariff was introduced in 2014/15.
Business customer tariffs cover the range of:
single rate energy tariffs for small Low Voltage connected customers;
Two rate Time of Use (peak and off peak) for medium Low Voltage connected customers;
kVA agreed demand tariffs for large customers at all voltage levels, with individually
calculated (locational) transmission prices for those customers with a demand in excess of
10 MW. The demand charge is stepped according to the customer’s size, to reflect the cost
of providing network capacity at the particular voltage level and location; and
An actual kVA demand tariff suitable for large customers, for seasonal large customers
whose load varies across the year and also those large customers with very flexible load.
Medium business customers can also opt-in for this tariff.
5.2.2 Standard control services tariff classes
The five tariff classes that SA Power Networks has established are as follows:
Major business (11 kV substation connection through to 66 kV);
High Voltage business (typically at 11 kV)
Large LV business
Small business including unmetered supplies; and
Residential.
SA Power Networks has illustrated the grouping of its individual tariffs into tariff classes shown in
Figure 11 using a dashed outline. Note that the split of LV business into two tariff classes has
occurred this year, although it has been flagged in our TSS submission. The separate tariff class
based on customer size (large vs small) also reflects the degree to which the customer uses the LV
network. Most large LV business customers will use negligible amounts of the LV mains, taking
supply close to a transformer. We will be able to better reflect the costs of these separate tariff
classes in the respective tariffs going forward. Today, we will be using some duplicate tariffs in each
of the two tariff classes, as small and large businesses have utilised the same tariff until now.
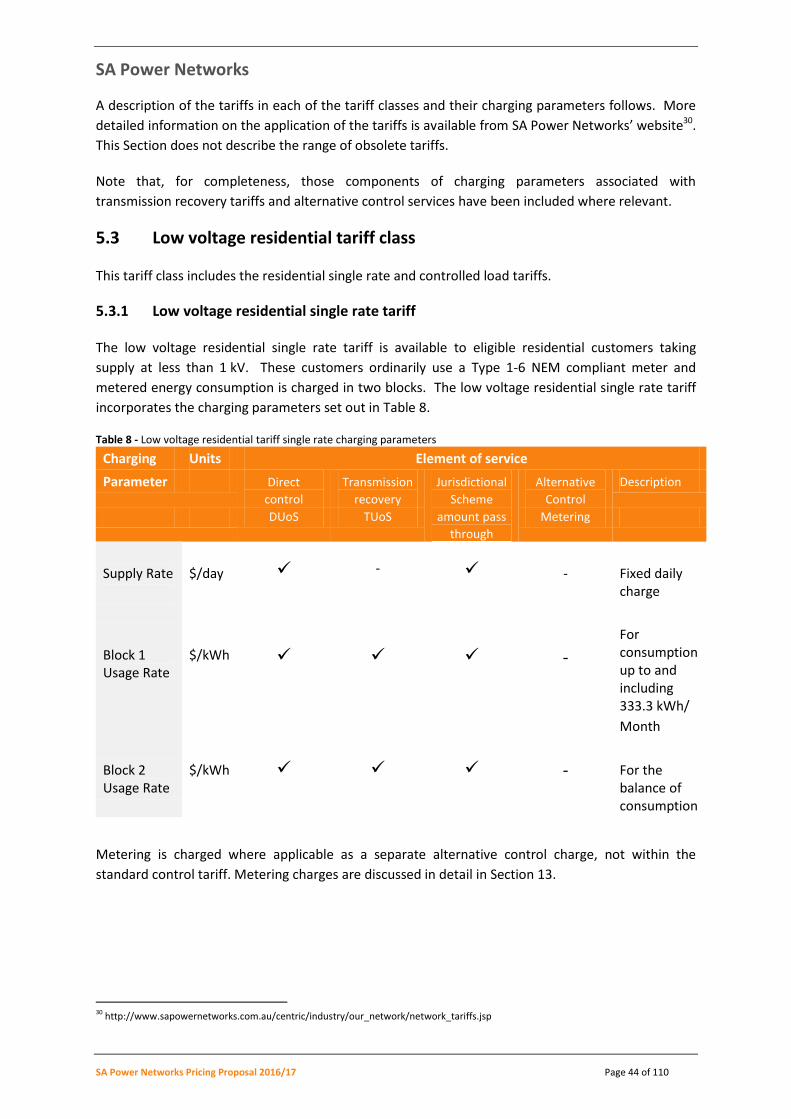
SA Power Networks
SA Power Networks Pricing Proposal 2016/17 Page 44 of 110
A description of the tariffs in each of the tariff classes and their charging parameters follows. More
detailed information on the application of the tariffs is available from SA Power Networks’ website30.
This Section does not describe the range of obsolete tariffs.
Note that, for completeness, those components of charging parameters associated with
transmission recovery tariffs and alternative control services have been included where relevant.
5.3 Low voltage residential tariff class
This tariff class includes the residential single rate and controlled load tariffs.
5.3.1 Low voltage residential single rate tariff
The low voltage residential single rate tariff is available to eligible residential customers taking
supply at less than 1 kV. These customers ordinarily use a Type 1-6 NEM compliant meter and
metered energy consumption is charged in two blocks. The low voltage residential single rate tariff
incorporates the charging parameters set out in Table 8.
Table 8 - Low voltage residential tariff single rate charging parameters
Charging Units Element of service
Parameter Direct
control
Transmission
recovery
Jurisdictional
Scheme
amount pass
through
Alternative
Control
Description
DUoS TUoS Metering
Supply Rate
$/day
-
-
Fixed daily charge
Block 1 Usage Rate
$/kWh
-
For consumption up to and including 333.3 kWh/
Month
Block 2 Usage Rate
$/kWh - For the balance of consumption
Metering is charged where applicable as a separate alternative control charge, not within the
standard control tariff. Metering charges are discussed in detail in Section 13.
30 http://www.sapowernetworks.com.au/centric/industry/our_network/network_tariffs.jsp
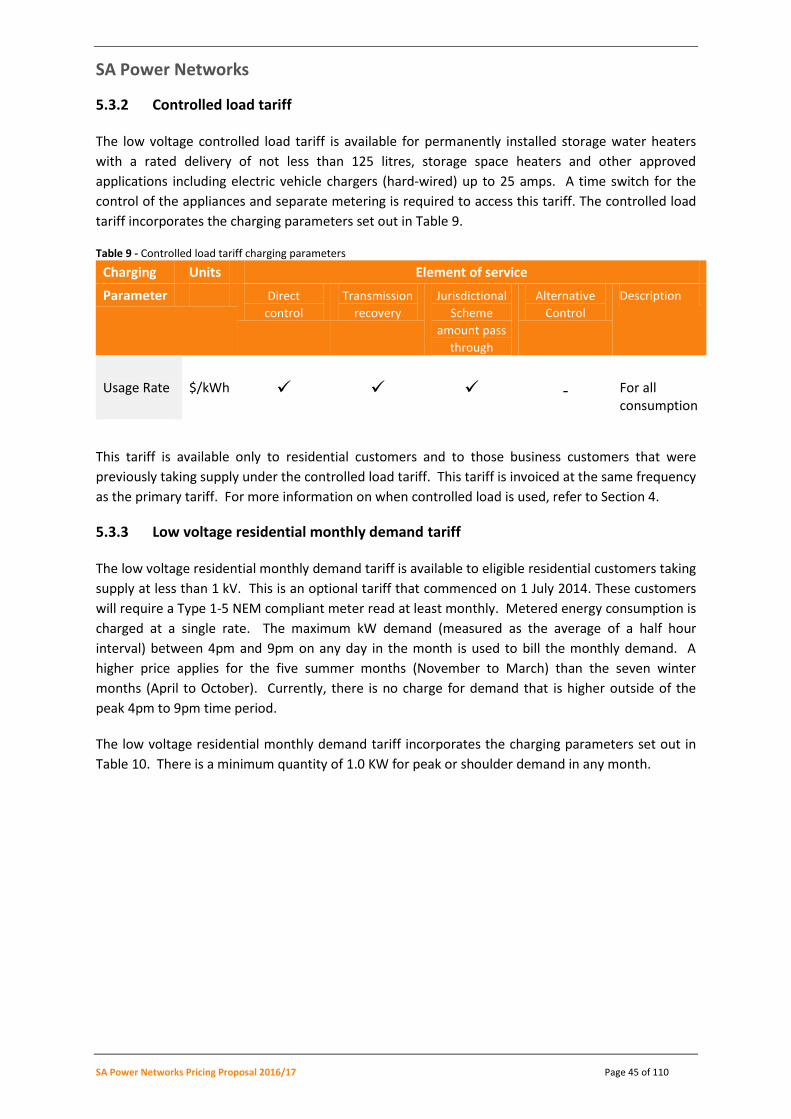
SA Power Networks
SA Power Networks Pricing Proposal 2016/17 Page 45 of 110
5.3.2 Controlled load tariff
The low voltage controlled load tariff is available for permanently installed storage water heaters
with a rated delivery of not less than 125 litres, storage space heaters and other approved
applications including electric vehicle chargers (hard-wired) up to 25 amps. A time switch for the
control of the appliances and separate metering is required to access this tariff. The controlled load
tariff incorporates the charging parameters set out in Table 9.
Table 9 - Controlled load tariff charging parameters
Charging Units Element of service
Parameter Direct
control
Transmission
recovery
Jurisdictional
Scheme
amount pass
through
Alternative
Control
Description
Usage Rate
$/kWh
-
For all consumption
This tariff is available only to residential customers and to those business customers that were
previously taking supply under the controlled load tariff. This tariff is invoiced at the same frequency
as the primary tariff. For more information on when controlled load is used, refer to Section 4.
5.3.3 Low voltage residential monthly demand tariff
The low voltage residential monthly demand tariff is available to eligible residential customers taking
supply at less than 1 kV. This is an optional tariff that commenced on 1 July 2014. These customers
will require a Type 1-5 NEM compliant meter read at least monthly. Metered energy consumption is
charged at a single rate. The maximum kW demand (measured as the average of a half hour
interval) between 4pm and 9pm on any day in the month is used to bill the monthly demand. A
higher price applies for the five summer months (November to March) than the seven winter
months (April to October). Currently, there is no charge for demand that is higher outside of the
peak 4pm to 9pm time period.
The low voltage residential monthly demand tariff incorporates the charging parameters set out in
Table 10. There is a minimum quantity of 1.0 KW for peak or shoulder demand in any month.
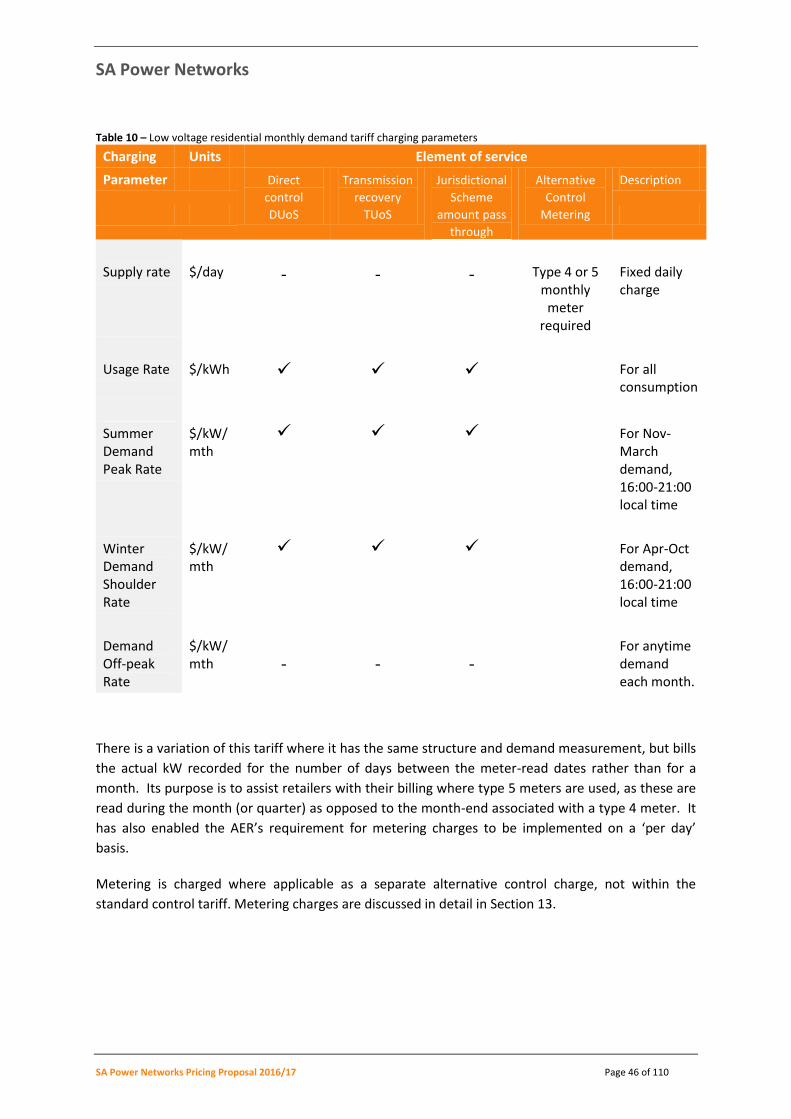
SA Power Networks
SA Power Networks Pricing Proposal 2016/17 Page 46 of 110
Table 10 – Low voltage residential monthly demand tariff charging parameters
Charging Units Element of service
Parameter Direct
control
Transmission
recovery
Jurisdictional
Scheme
amount pass
through
Alternative
Control
Description
DUoS TUoS Metering
Supply rate
$/day
-
-
-
Type 4 or 5 monthly
meter required
Fixed daily charge
Usage Rate
$/kWh
For all consumption
Summer Demand Peak Rate
$/kW/mth
For Nov-March demand, 16:00-21:00 local time
Winter Demand Shoulder Rate
$/kW/mth
For Apr-Oct demand, 16:00-21:00 local time
Demand Off-peak Rate
$/kW/mth
-
-
- For anytime
demand each month.
There is a variation of this tariff where it has the same structure and demand measurement, but bills
the actual kW recorded for the number of days between the meter-read dates rather than for a
month. Its purpose is to assist retailers with their billing where type 5 meters are used, as these are
read during the month (or quarter) as opposed to the month-end associated with a type 4 meter. It
has also enabled the AER’s requirement for metering charges to be implemented on a ‘per day’
basis.
Metering is charged where applicable as a separate alternative control charge, not within the
standard control tariff. Metering charges are discussed in detail in Section 13.

SA Power Networks
SA Power Networks Pricing Proposal 2016/17 Page 47 of 110
5.4 Low voltage business tariff class
The low voltage business tariffs cover a broad range of customer sizes and types of metering
installations. This tariff class is the most diverse in terms of its consumption range and the variety of
end uses.
5.4.1 Business low voltage single rate tariff (obsolete)
The low voltage business single rate tariff was available for use at a Type 1-6 meter installation. As
with the residential tariff, consumption is charged on an inclining scale in two consumption blocks.
The low voltage business single rate tariff incorporates the charging parameters set out in Table 11.
This tariff was closed to new applicants on 30 June 2010.
Table 11 - Low voltage business single rate tariff charging parameters
Charging Units Element of service
Parameter Direct
control
Transmission
recovery
Jurisdictional
Scheme
amount pass
through
Alternative
Control
Description
DUoS TUoS Metering
Supply Rate
$/day
-
-
Fixed daily charge
Block 1 Usage Rate
$/kWh
-
For consumption up to and including 833.3 kWh/
Month
Block 2 Usage Rate
$/kWh - For the balance of consumption
Metering is charged where applicable as a separate alternative control charge, not within the
standard control tariff. Metering charges are discussed in detail in Section 13.
5.4.2 Business low voltage 2-rate tariff
The low voltage business 2-rate tariff has a Time of Use (ToU) structure with peak and off-peak
consumption charges, using a Type 1-6 meter. The customer’s peak period energy consumption is
charged in four consumption blocks. The low voltage business 2-rate tariff incorporates the charging
parameters set out in Table 12. The pricing of Block 1 through Block 4 is identical, effectively
converting Business 2-rate into a single block tariff
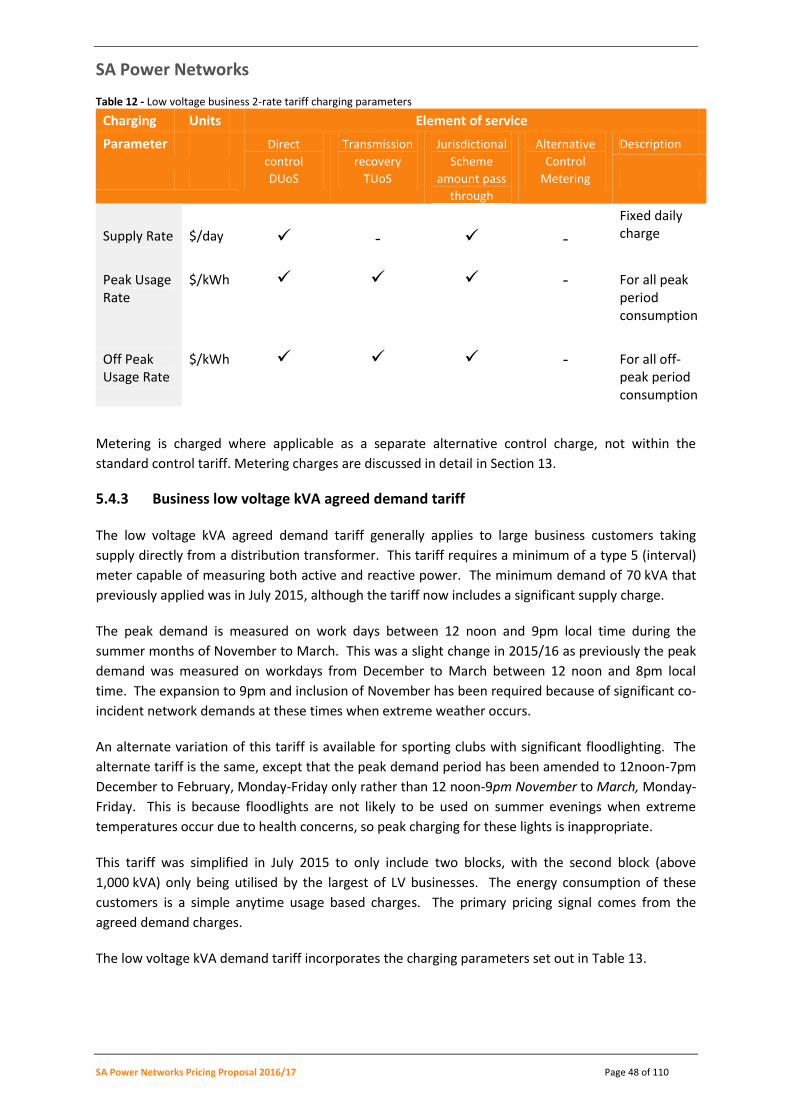
SA Power Networks
SA Power Networks Pricing Proposal 2016/17 Page 48 of 110
Table 12 - Low voltage business 2-rate tariff charging parameters
Charging Units Element of service
Parameter Direct
control
Transmission
recovery
Jurisdictional
Scheme
amount pass
through
Alternative
Control
Description
DUoS TUoS Metering
Supply Rate
$/day
-
-
Fixed daily charge
Peak Usage Rate
$/kWh - For all peak period consumption
Off Peak Usage Rate
$/kWh - For all off-peak period consumption
Metering is charged where applicable as a separate alternative control charge, not within the
standard control tariff. Metering charges are discussed in detail in Section 13.
5.4.3 Business low voltage kVA agreed demand tariff
The low voltage kVA agreed demand tariff generally applies to large business customers taking
supply directly from a distribution transformer. This tariff requires a minimum of a type 5 (interval)
meter capable of measuring both active and reactive power. The minimum demand of 70 kVA that
previously applied was in July 2015, although the tariff now includes a significant supply charge.
The peak demand is measured on work days between 12 noon and 9pm local time during the
summer months of November to March. This was a slight change in 2015/16 as previously the peak
demand was measured on workdays from December to March between 12 noon and 8pm local
time. The expansion to 9pm and inclusion of November has been required because of significant co-
incident network demands at these times when extreme weather occurs.
An alternate variation of this tariff is available for sporting clubs with significant floodlighting. The
alternate tariff is the same, except that the peak demand period has been amended to 12noon-7pm
December to February, Monday-Friday only rather than 12 noon-9pm November to March, Monday-
Friday. This is because floodlights are not likely to be used on summer evenings when extreme
temperatures occur due to health concerns, so peak charging for these lights is inappropriate.
This tariff was simplified in July 2015 to only include two blocks, with the second block (above
1,000 kVA) only being utilised by the largest of LV businesses. The energy consumption of these
customers is a simple anytime usage based charges. The primary pricing signal comes from the
agreed demand charges.
The low voltage kVA demand tariff incorporates the charging parameters set out in Table 13.

SA Power Networks
SA Power Networks Pricing Proposal 2016/17 Page 49 of 110
Table 13 - Low voltage kVA agreed demand tariff charging parameters
Charging Units Element of service
Parameter Direct
control
Transmission
recovery
Jurisdictional
Scheme
amount pass
through
Alternative
Control
Description
DUoS TUoS Metering
Supply Rate
$/day
-
Type 4 or 5 monthly
meter required
Fixed daily charge
Annual Block 1 Demand Rate
$/kVA /mth
- For peak demand up to and including 1000 kVA
Annual Block 2 Demand Rate
$/kVA /mth
- For the balance of kVA demand
Additional demand
$/kVA /mth
- - Demand in excess of that required during summer peak hours.
Usage Rate $/kWh - For all energy consumption
Metering is charged where applicable as a separate alternative control charge, not within the
standard control tariff. Metering charges are discussed in detail in Section 13.
These tariffs are invoiced monthly and are determined on a ‘per day’ basis in accordance with the
AER’s metering charges.
5.4.4 Business low voltage kVA actual demand tariff
The business low voltage actual demand tariff is available to eligible business customers taking
supply at less than 1 kV (the tariff is also available for business customers taking HV supply, typically
at 11 kV). This tariff was introduced on 1 July 2015. It forms part of a suite of cost-reflective tariffs
that are used by large business customers. This tariff is optional for suitable medium-sized
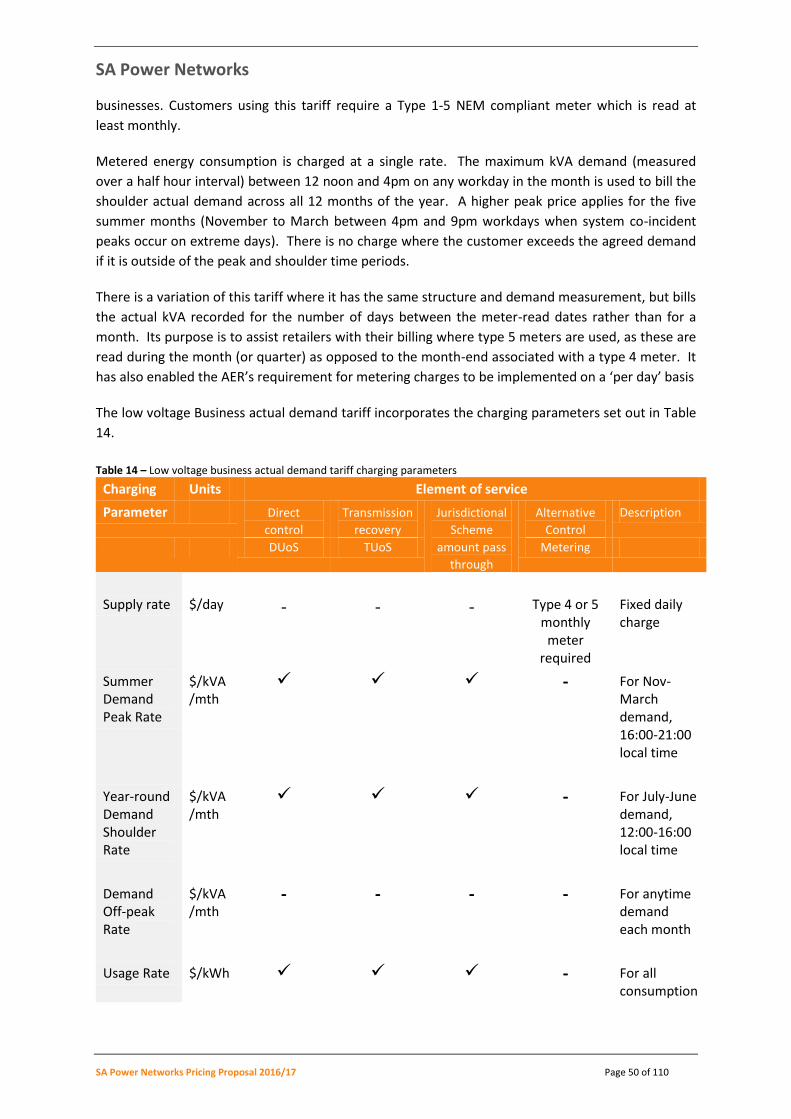
SA Power Networks
SA Power Networks Pricing Proposal 2016/17 Page 50 of 110
businesses. Customers using this tariff require a Type 1-5 NEM compliant meter which is read at
least monthly.
Metered energy consumption is charged at a single rate. The maximum kVA demand (measured
over a half hour interval) between 12 noon and 4pm on any workday in the month is used to bill the
shoulder actual demand across all 12 months of the year. A higher peak price applies for the five
summer months (November to March between 4pm and 9pm workdays when system co-incident
peaks occur on extreme days). There is no charge where the customer exceeds the agreed demand
if it is outside of the peak and shoulder time periods.
There is a variation of this tariff where it has the same structure and demand measurement, but bills
the actual kVA recorded for the number of days between the meter-read dates rather than for a
month. Its purpose is to assist retailers with their billing where type 5 meters are used, as these are
read during the month (or quarter) as opposed to the month-end associated with a type 4 meter. It
has also enabled the AER’s requirement for metering charges to be implemented on a ‘per day’ basis
The low voltage Business actual demand tariff incorporates the charging parameters set out in Table
14.
Table 14 – Low voltage business actual demand tariff charging parameters
Charging Units Element of service
Parameter Direct
control
Transmission
recovery
Jurisdictional
Scheme
amount pass
through
Alternative
Control
Description
DUoS TUoS Metering
Supply rate
$/day
-
-
-
Type 4 or 5 monthly
meter required
Fixed daily charge
Summer Demand Peak Rate
$/kVA/mth
- For Nov-March demand, 16:00-21:00 local time
Year-round Demand Shoulder Rate
$/kVA/mth
- For July-June demand, 12:00-16:00 local time
Demand Off-peak Rate
$/kVA/mth
- - - - For anytime demand each month
Usage Rate $/kWh - For all consumption
SA Power Networks
SA Power Networks Pricing Proposal 2016/17 Page 51 of 110
Metering is charged where applicable as a separate alternative control charge, not within the
standard control tariff. Metering charges are discussed in detail in Section 13.
5.4.5 Business low voltage kVA transition actual demand tariff
The business low voltage transition actual demand tariff is available to large business customers
reassigned from a business energy tariff to a cost-reflective tariff in July 2015, but who would be
worse off as a result. It forms part of a suite of cost-reflective tariffs that are required to be used by
large business customers.
In 2016/17, the proportion of business 2-rate will reduce from 70% to 50% and the actual demand
proportion will increase from 30% to 50%. The transition will be complete by 2020. Customers on
this tariff require a Type 1-5 NEM compliant meter read at least monthly.
All tariff elements used in the business 2-rate and agreed monthly demand tariffs are used in this
transition tariff. The low voltage Business actual demand tariff incorporates the charging
parameters set out in Table 15.
There is a variation of this tariff where it has the same structure and demand measurement, but bills
the actual kVA recorded for the number of days between the meter-read dates rather than for a
month. Its purpose is to assist retailers with their billing where type 5 meters are used, as these are
read during the month (or quarter) as opposed to the month-end associated with a type 4 meter. It
has also enabled the AER’s requirement for metering charges to be implemented on a ‘per day’
basis.
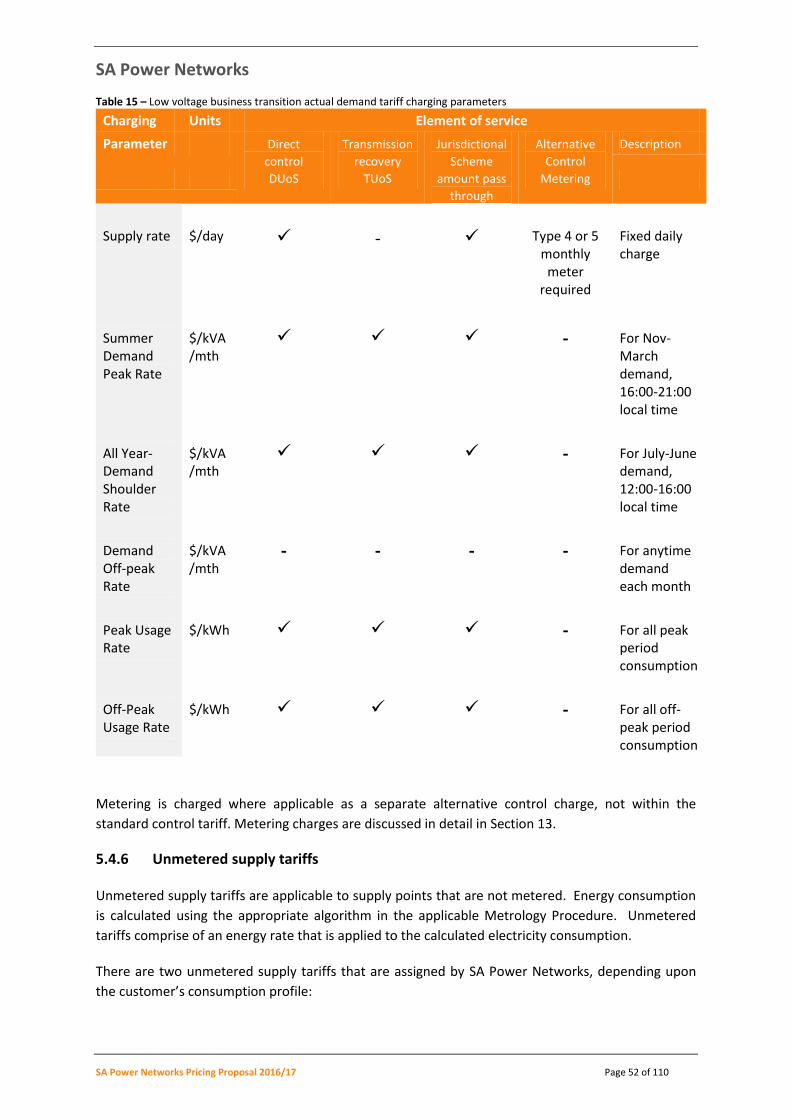
SA Power Networks
SA Power Networks Pricing Proposal 2016/17 Page 52 of 110
Table 15 – Low voltage business transition actual demand tariff charging parameters
Charging Units Element of service
Parameter Direct
control
Transmission
recovery
Jurisdictional
Scheme
amount pass
through
Alternative
Control
Description
DUoS TUoS Metering
Supply rate
$/day
-
Type 4 or 5 monthly
meter required
Fixed daily charge
Summer Demand Peak Rate
$/kVA/mth
- For Nov-March demand, 16:00-21:00 local time
All Year-Demand Shoulder Rate
$/kVA/mth
- For July-June demand, 12:00-16:00 local time
Demand Off-peak Rate
$/kVA/mth
- - - - For anytime demand each month
Peak Usage Rate
$/kWh - For all peak period consumption
Off-Peak Usage Rate
$/kWh - For all off-peak period consumption
Metering is charged where applicable as a separate alternative control charge, not within the
standard control tariff. Metering charges are discussed in detail in Section 13.
5.4.6 Unmetered supply tariffs
Unmetered supply tariffs are applicable to supply points that are not metered. Energy consumption
is calculated using the appropriate algorithm in the applicable Metrology Procedure. Unmetered
tariffs comprise of an energy rate that is applied to the calculated electricity consumption.
There are two unmetered supply tariffs that are assigned by SA Power Networks, depending upon
the customer’s consumption profile:
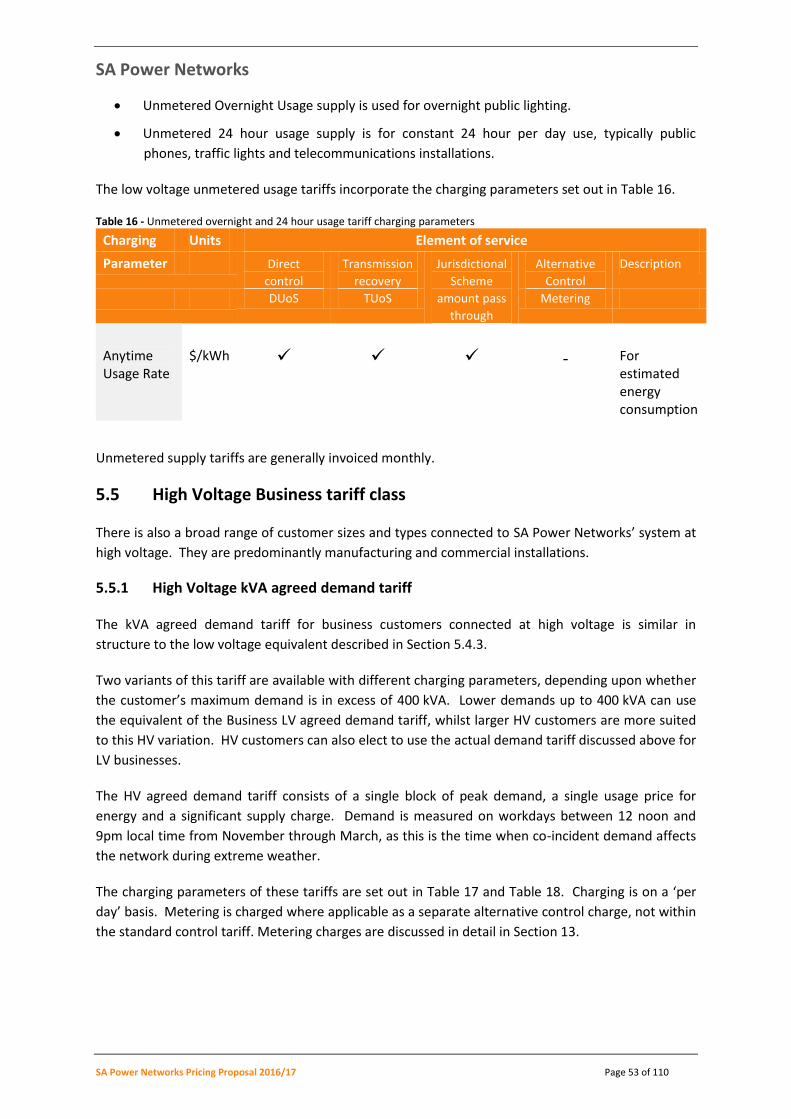
SA Power Networks
SA Power Networks Pricing Proposal 2016/17 Page 53 of 110
Unmetered Overnight Usage supply is used for overnight public lighting.
Unmetered 24 hour usage supply is for constant 24 hour per day use, typically public
phones, traffic lights and telecommunications installations.
The low voltage unmetered usage tariffs incorporate the charging parameters set out in Table 16.
Table 16 - Unmetered overnight and 24 hour usage tariff charging parameters
Charging Units Element of service
Parameter Direct
control
Transmission
recovery
Jurisdictional
Scheme
amount pass
through
Alternative
Control
Description
DUoS TUoS Metering
Anytime Usage Rate
$/kWh
-
For estimated energy consumption
Unmetered supply tariffs are generally invoiced monthly.
5.5 High Voltage Business tariff class
There is also a broad range of customer sizes and types connected to SA Power Networks’ system at
high voltage. They are predominantly manufacturing and commercial installations.
5.5.1 High Voltage kVA agreed demand tariff
The kVA agreed demand tariff for business customers connected at high voltage is similar in
structure to the low voltage equivalent described in Section 5.4.3.
Two variants of this tariff are available with different charging parameters, depending upon whether
the customer’s maximum demand is in excess of 400 kVA. Lower demands up to 400 kVA can use
the equivalent of the Business LV agreed demand tariff, whilst larger HV customers are more suited
to this HV variation. HV customers can also elect to use the actual demand tariff discussed above for
LV businesses.
The HV agreed demand tariff consists of a single block of peak demand, a single usage price for
energy and a significant supply charge. Demand is measured on workdays between 12 noon and
9pm local time from November through March, as this is the time when co-incident demand affects
the network during extreme weather.
The charging parameters of these tariffs are set out in Table 17 and Table 18. Charging is on a ‘per
day’ basis. Metering is charged where applicable as a separate alternative control charge, not within
the standard control tariff. Metering charges are discussed in detail in Section 13.
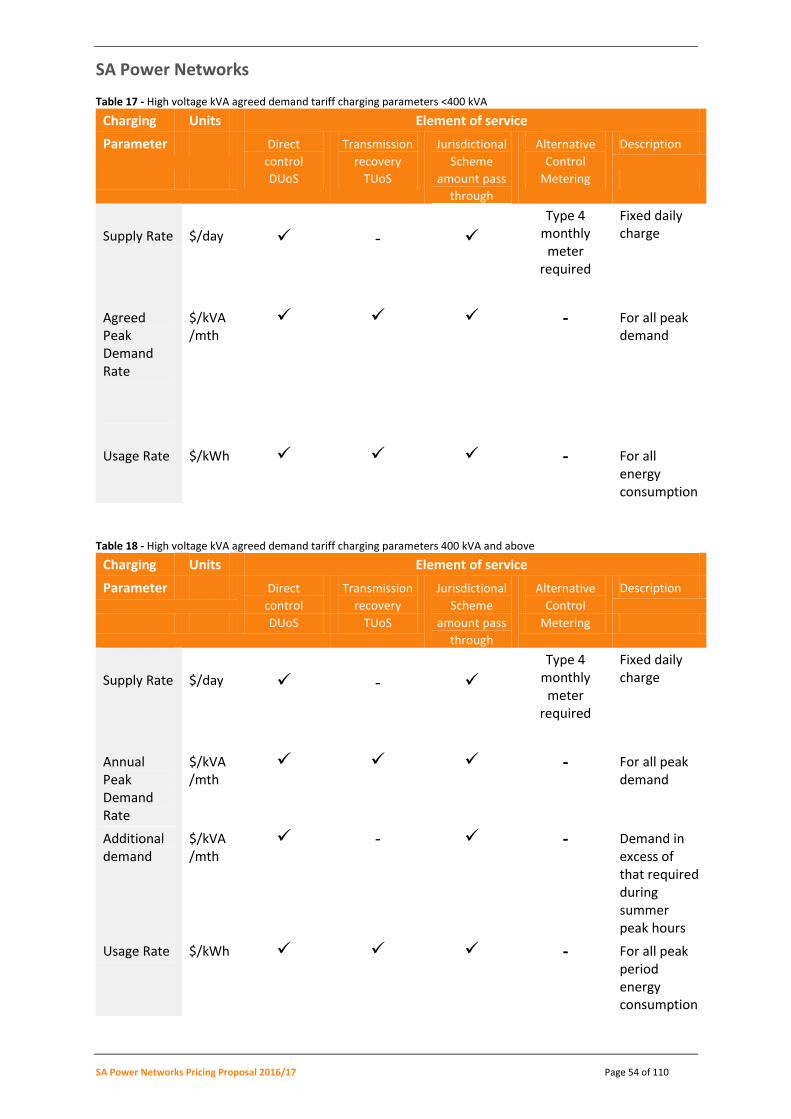
SA Power Networks
SA Power Networks Pricing Proposal 2016/17 Page 54 of 110
Table 17 - High voltage kVA agreed demand tariff charging parameters <400 kVA
Charging Units Element of service
Parameter Direct
control
Transmission
recovery
Jurisdictional
Scheme
amount pass
through
Alternative
Control
Description
DUoS TUoS Metering
Supply Rate
$/day
-
Type 4 monthly
meter required
Fixed daily charge
Agreed Peak Demand Rate
$/kVA /mth
- For all peak demand
Usage Rate $/kWh - For all energy consumption
Table 18 - High voltage kVA agreed demand tariff charging parameters 400 kVA and above
Charging Units Element of service
Parameter Direct
control
Transmission
recovery
Jurisdictional
Scheme
amount pass
through
Alternative
Control
Description
DUoS TUoS Metering
Supply Rate
$/day
-
Type 4 monthly
meter required
Fixed daily charge
Annual Peak Demand Rate
$/kVA /mth
- For all peak demand
Additional demand
$/kVA /mth
- - Demand in excess of that required during summer peak hours
Usage Rate $/kWh - For all peak period energy consumption
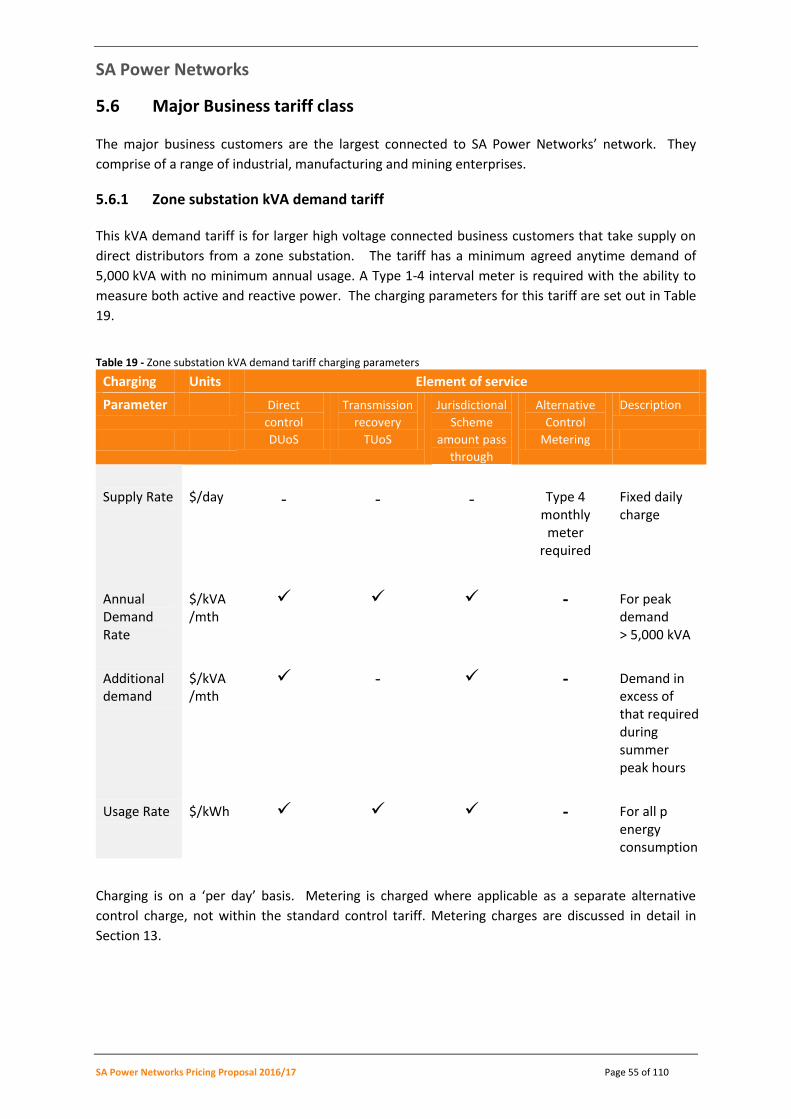
SA Power Networks
SA Power Networks Pricing Proposal 2016/17 Page 55 of 110
5.6 Major Business tariff class
The major business customers are the largest connected to SA Power Networks’ network. They
comprise of a range of industrial, manufacturing and mining enterprises.
5.6.1 Zone substation kVA demand tariff
This kVA demand tariff is for larger high voltage connected business customers that take supply on
direct distributors from a zone substation. The tariff has a minimum agreed anytime demand of
5,000 kVA with no minimum annual usage. A Type 1-4 interval meter is required with the ability to
measure both active and reactive power. The charging parameters for this tariff are set out in Table
19.
Table 19 - Zone substation kVA demand tariff charging parameters
Charging Units Element of service
Parameter Direct
control
Transmission
recovery
Jurisdictional
Scheme
amount pass
through
Alternative
Control
Description
DUoS TUoS Metering
Supply Rate
$/day
-
-
-
Type 4 monthly
meter required
Fixed daily charge
Annual Demand Rate
$/kVA /mth
- For peak demand > 5,000 kVA
Additional demand
$/kVA /mth
- - Demand in excess of that required during summer peak hours
Usage Rate $/kWh - For all p energy consumption
Charging is on a ‘per day’ basis. Metering is charged where applicable as a separate alternative
control charge, not within the standard control tariff. Metering charges are discussed in detail in
Section 13.
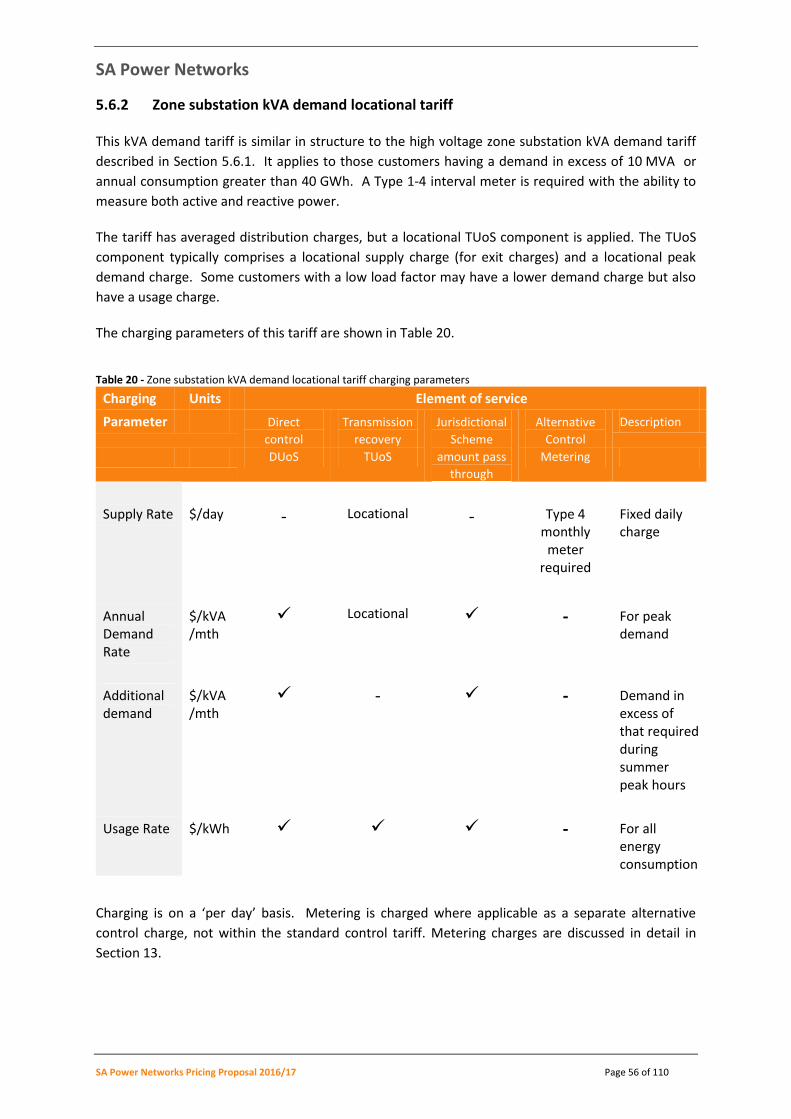
SA Power Networks
SA Power Networks Pricing Proposal 2016/17 Page 56 of 110
5.6.2 Zone substation kVA demand locational tariff
This kVA demand tariff is similar in structure to the high voltage zone substation kVA demand tariff
described in Section 5.6.1. It applies to those customers having a demand in excess of 10 MVA or
annual consumption greater than 40 GWh. A Type 1-4 interval meter is required with the ability to
measure both active and reactive power.
The tariff has averaged distribution charges, but a locational TUoS component is applied. The TUoS
component typically comprises a locational supply charge (for exit charges) and a locational peak
demand charge. Some customers with a low load factor may have a lower demand charge but also
have a usage charge.
The charging parameters of this tariff are shown in Table 20.
Table 20 - Zone substation kVA demand locational tariff charging parameters
Charging Units Element of service
Parameter Direct
control
Transmission
recovery
Jurisdictional
Scheme
amount pass
through
Alternative
Control
Description
DUoS TUoS Metering
Supply Rate
$/day
-
Locational
-
Type 4 monthly
meter required
Fixed daily charge
Annual Demand Rate
$/kVA /mth
Locational - For peak demand
Additional demand
$/kVA /mth
- - Demand in excess of that required during summer peak hours
Usage Rate $/kWh - For all energy consumption
Charging is on a ‘per day’ basis. Metering is charged where applicable as a separate alternative
control charge, not within the standard control tariff. Metering charges are discussed in detail in
Section 13.
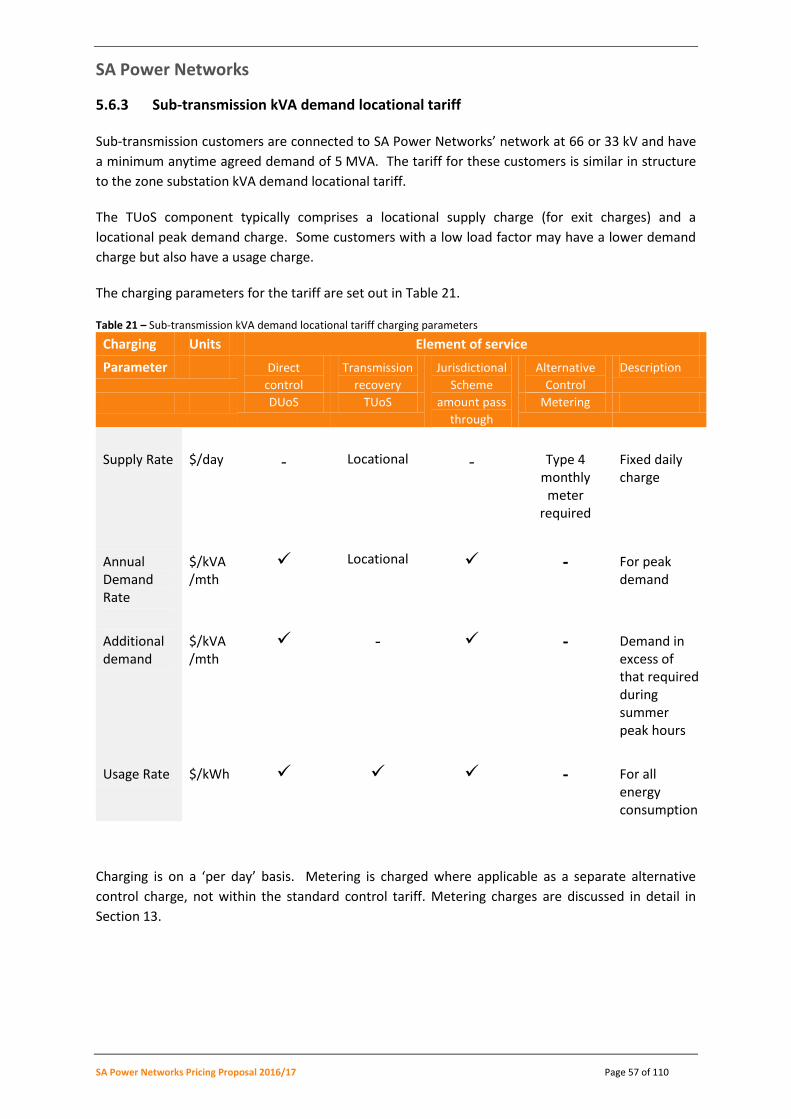
SA Power Networks
SA Power Networks Pricing Proposal 2016/17 Page 57 of 110
5.6.3 Sub-transmission kVA demand locational tariff
Sub-transmission customers are connected to SA Power Networks’ network at 66 or 33 kV and have
a minimum anytime agreed demand of 5 MVA. The tariff for these customers is similar in structure
to the zone substation kVA demand locational tariff.
The TUoS component typically comprises a locational supply charge (for exit charges) and a
locational peak demand charge. Some customers with a low load factor may have a lower demand
charge but also have a usage charge.
The charging parameters for the tariff are set out in Table 21.
Table 21 – Sub-transmission kVA demand locational tariff charging parameters
Charging Units Element of service
Parameter Direct
control
Transmission
recovery
Jurisdictional
Scheme
amount pass
through
Alternative
Control
Description
DUoS TUoS Metering
Supply Rate
$/day
-
Locational
-
Type 4 monthly
meter required
Fixed daily charge
Annual Demand Rate
$/kVA /mth
Locational - For peak demand
Additional demand
$/kVA /mth
- - Demand in excess of that required during summer peak hours
Usage Rate $/kWh - For all energy consumption
Charging is on a ‘per day’ basis. Metering is charged where applicable as a separate alternative
control charge, not within the standard control tariff. Metering charges are discussed in detail in
Section 13.

SA Power Networks
SA Power Networks Pricing Proposal 2016/17 Page 58 of 110
6 Standard control services tariffs (NUoS)
Within the framework of SA Power Networks’ longer term tariff strategy set out in Section 4 of this
Pricing Proposal, this section sets out the proposed rates for tariff charging components of standard
control services for 2016/17 and provides a comparison with the rates in place during 2015/16.
It should be noted that the information and comparisons in this section relate to SA Power
Networks’ standard control services for all network charges (NUoS). This is the charge seen by large
customers on their unbundled bills from retailers. It comprises the addition of
SA Power Networks’ standard control services (DUoS);
Transmission cost recovery components (TUoS); and
PV FiT JSA cost recovery components (PV JSA).
The charges are generally bundled to small customers and can also include alternative control
service charges for metering. These charges are explicitly set out in our tariff list, but are part of the
total network charges to customers. Metering is discussed separately in Section 13.
6.1 Regulatory Requirements
The information in this section concerning the change in standard control service rates is provided
pursuant to clause 6.18.9 of the Rules.
6.18.9 Publication of information about tariffs and tariff classes
(a) A Distribution Network Service Provider must maintain on its website:
(3) a statement of expected price trends (to be updated for each regulatory year)
giving an indication of how the Distribution Network Service Provider expects
prices to change over the regulatory control period and the reasons for the
expected changes.
6.2 Tariff changes in 2016/17
The tariff changes in 2016/17 have been made with regard to our tariff strategy for the 2015-20
regulatory control period set out in Section 4. Details on how the tariff components (distribution,
transmission and PV FiT) have been determined and their compliance with regulatory requirements
are set out in chapters 9, 10 and 11. This section aims to inform customers about the general
movement in these three NUoS components against the tariff classes, and how this year’s resulting
network charges (NUoS) compare with those charged last year.
6.3 Components of Network Charges by tariff class – this year vs last year
The following sections provide information on the three NUoS component of SA Power Networks’
existing tariffs (ie DUoS, TUoS and PV Fit) and the movement in recovery proposed for 2016/17 by
each of the five tariff classes. Changes in tariff recovery from one year to another should be
apparent from these tables.
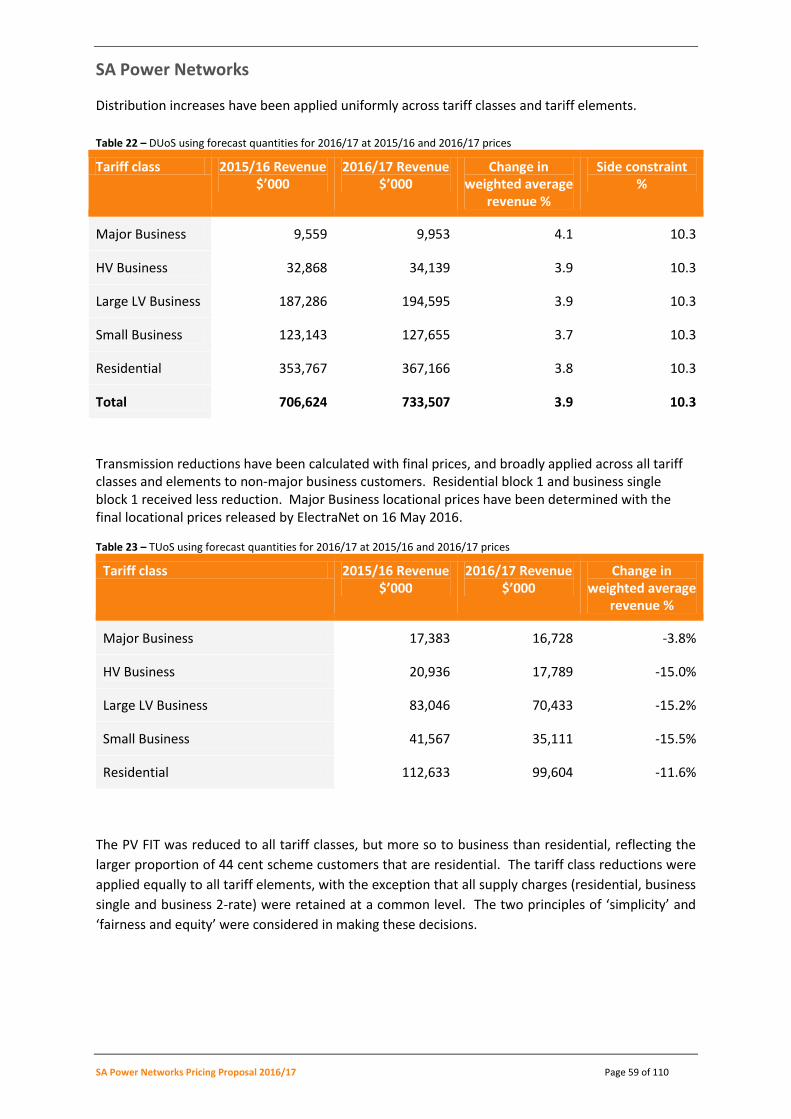
SA Power Networks
SA Power Networks Pricing Proposal 2016/17 Page 59 of 110
Distribution increases have been applied uniformly across tariff classes and tariff elements.
Table 22 – DUoS using forecast quantities for 2016/17 at 2015/16 and 2016/17 prices
Tariff class 2015/16 Revenue $’000
2016/17 Revenue $’000
Change in weighted average
revenue %
Side constraint %
Major Business 9,559 9,953 4.1 10.3
HV Business 32,868 34,139 3.9 10.3
Large LV Business 187,286 194,595 3.9 10.3
Small Business 123,143 127,655 3.7 10.3
Residential 353,767 367,166 3.8 10.3
Total 706,624 733,507 3.9 10.3
Transmission reductions have been calculated with final prices, and broadly applied across all tariff classes and elements to non-major business customers. Residential block 1 and business single block 1 received less reduction. Major Business locational prices have been determined with the final locational prices released by ElectraNet on 16 May 2016.
Table 23 – TUoS using forecast quantities for 2016/17 at 2015/16 and 2016/17 prices
Tariff class 2015/16 Revenue $’000
2016/17 Revenue $’000
Change in weighted average
revenue %
Major Business 17,383 16,728 -3.8%
HV Business 20,936 17,789 -15.0%
Large LV Business 83,046 70,433 -15.2%
Small Business 41,567 35,111 -15.5%
Residential 112,633 99,604 -11.6%
The PV FIT was reduced to all tariff classes, but more so to business than residential, reflecting the
larger proportion of 44 cent scheme customers that are residential. The tariff class reductions were
applied equally to all tariff elements, with the exception that all supply charges (residential, business
single and business 2-rate) were retained at a common level. The two principles of ‘simplicity’ and
‘fairness and equity’ were considered in making these decisions.
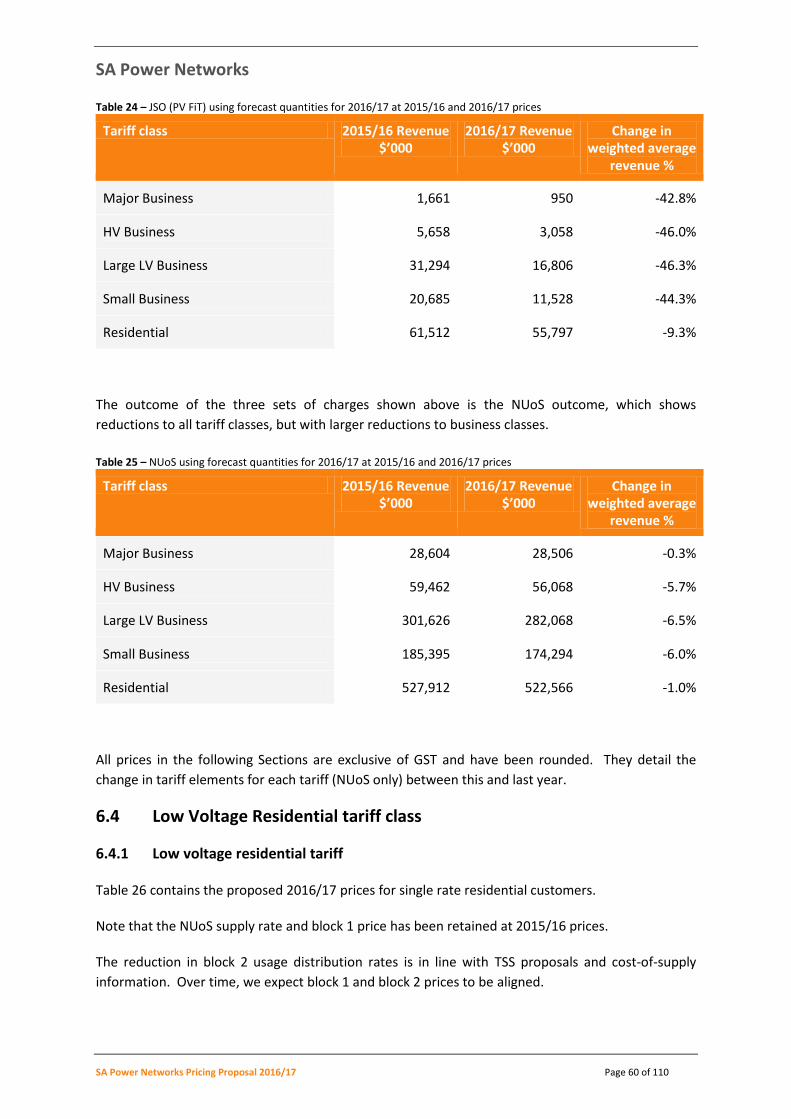
SA Power Networks
SA Power Networks Pricing Proposal 2016/17 Page 60 of 110
Table 24 – JSO (PV FiT) using forecast quantities for 2016/17 at 2015/16 and 2016/17 prices
Tariff class 2015/16 Revenue $’000
2016/17 Revenue $’000
Change in weighted average
revenue %
Major Business 1,661 950 -42.8%
HV Business 5,658 3,058 -46.0%
Large LV Business 31,294 16,806 -46.3%
Small Business 20,685 11,528 -44.3%
Residential 61,512 55,797 -9.3%
The outcome of the three sets of charges shown above is the NUoS outcome, which shows
reductions to all tariff classes, but with larger reductions to business classes.
Table 25 – NUoS using forecast quantities for 2016/17 at 2015/16 and 2016/17 prices
Tariff class 2015/16 Revenue $’000
2016/17 Revenue $’000
Change in weighted average
revenue %
Major Business 28,604 28,506 -0.3%
HV Business 59,462 56,068 -5.7%
Large LV Business 301,626 282,068 -6.5%
Small Business 185,395 174,294 -6.0%
Residential 527,912 522,566 -1.0%
All prices in the following Sections are exclusive of GST and have been rounded. They detail the
change in tariff elements for each tariff (NUoS only) between this and last year.
6.4 Low Voltage Residential tariff class
6.4.1 Low voltage residential tariff
Table 26 contains the proposed 2016/17 prices for single rate residential customers.
Note that the NUoS supply rate and block 1 price has been retained at 2015/16 prices.
The reduction in block 2 usage distribution rates is in line with TSS proposals and cost-of-supply
information. Over time, we expect block 1 and block 2 prices to be aligned.

SA Power Networks
SA Power Networks Pricing Proposal 2016/17 Page 61 of 110
Table 26 - Proposed 2016/17 low voltage residential tariff single rate
Charging Parameter Units Existing 2015/16
Proposed 2016/17
Variance
Supply rate $ p.a. 109.95 109.95 0.00
Block 1 usage rate ¢/kWh 11.75 11.75 0.00
Block 2 usage rate ¢/kWh 15.23 14.70 -0.53
6.4.2 Low voltage residential actual demand tariff
Table 27 contains proposed 2016/17 prices for residential actual demand tariff. Demand prices and
usage prices have been reduced.
Table 27 - Proposed 2016/17 low voltage residential tariff actual demand
Charging Parameter Units Existing 2015/16
Proposed 2016/17
Variance
Supply rate $ p.a. 0.00 0.00 0.00
Peak demand (Nov-March) $/kW/mth 13.48 12.91 -0.57
Shoulder demand (April-Oct) $/kW/mth 6.74 6.45 -0.29
Off-peak demand (2100-1600) $/kW/mth 0.00 0.00 0.00
Usage rate ¢/kWh 7.19 6.52 -0.67
6.4.3 Controlled load tariff
Table 28 contains the proposed 2016/17 prices for controlled load customers.
The NUoS rate for this tariff has been retained at 2015/16 levels, offering a significant reduction to
residential prices.
Table 28 - Proposed 2016/17 controlled load tariff
Charging Parameter Units Existing 2015/16
Proposed 2016/17
Variance
Usage rate ¢/kWh 5.39 5.39 0.00
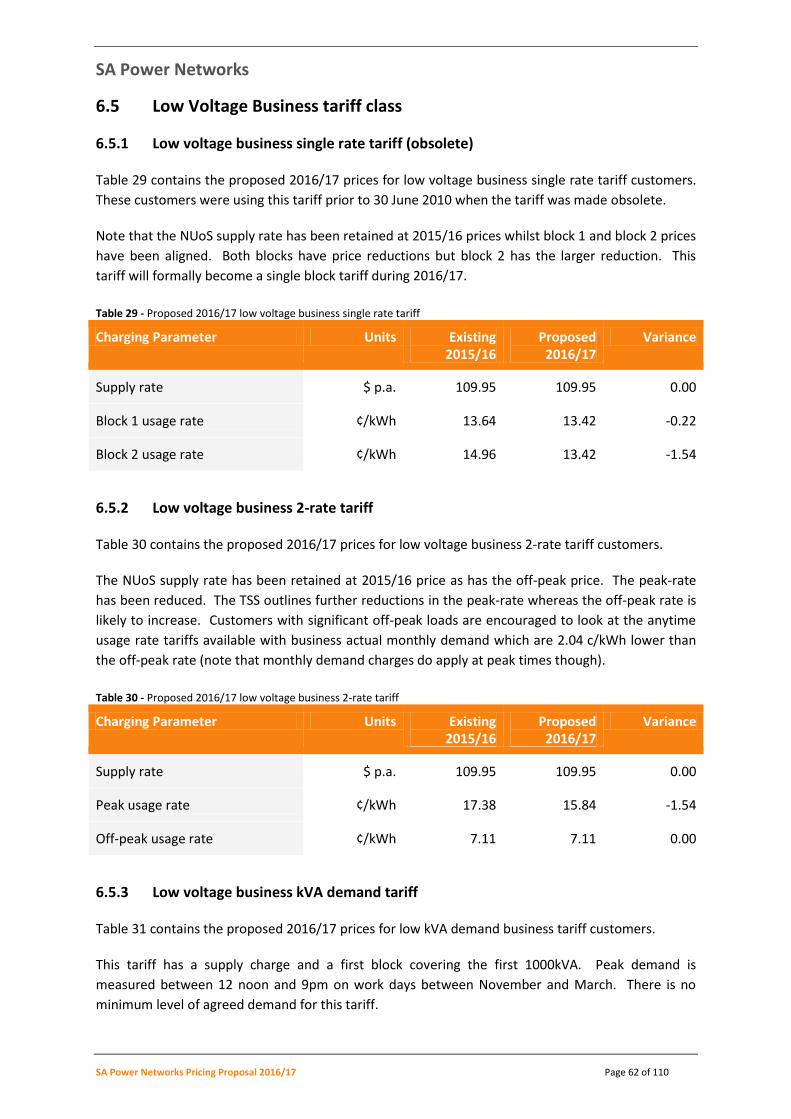
SA Power Networks
SA Power Networks Pricing Proposal 2016/17 Page 62 of 110
6.5 Low Voltage Business tariff class
6.5.1 Low voltage business single rate tariff (obsolete)
Table 29 contains the proposed 2016/17 prices for low voltage business single rate tariff customers.
These customers were using this tariff prior to 30 June 2010 when the tariff was made obsolete.
Note that the NUoS supply rate has been retained at 2015/16 prices whilst block 1 and block 2 prices
have been aligned. Both blocks have price reductions but block 2 has the larger reduction. This
tariff will formally become a single block tariff during 2016/17.
Table 29 - Proposed 2016/17 low voltage business single rate tariff
Charging Parameter Units Existing 2015/16
Proposed 2016/17
Variance
Supply rate $ p.a. 109.95 109.95 0.00
Block 1 usage rate ¢/kWh 13.64 13.42 -0.22
Block 2 usage rate ¢/kWh 14.96 13.42 -1.54
6.5.2 Low voltage business 2-rate tariff
Table 30 contains the proposed 2016/17 prices for low voltage business 2-rate tariff customers.
The NUoS supply rate has been retained at 2015/16 price as has the off-peak price. The peak-rate
has been reduced. The TSS outlines further reductions in the peak-rate whereas the off-peak rate is
likely to increase. Customers with significant off-peak loads are encouraged to look at the anytime
usage rate tariffs available with business actual monthly demand which are 2.04 c/kWh lower than
the off-peak rate (note that monthly demand charges do apply at peak times though).
Table 30 - Proposed 2016/17 low voltage business 2-rate tariff
Charging Parameter Units Existing 2015/16
Proposed 2016/17
Variance
Supply rate $ p.a. 109.95 109.95 0.00
Peak usage rate ¢/kWh 17.38 15.84 -1.54
Off-peak usage rate ¢/kWh 7.11 7.11 0.00
6.5.3 Low voltage business kVA demand tariff
Table 31 contains the proposed 2016/17 prices for low kVA demand business tariff customers.
This tariff has a supply charge and a first block covering the first 1000kVA. Peak demand is
measured between 12 noon and 9pm on work days between November and March. There is no
minimum level of agreed demand for this tariff.

SA Power Networks
SA Power Networks Pricing Proposal 2016/17 Page 63 of 110
Table 31 - Proposed 2016/17 low voltage business kVA demand tariff
Charging Parameter Units Existing 2015/16
Proposed 2016/17
Variance
Supply rate $ p.a. 4,203.86 4,063.85 -140.01
Annual block 1 demand rate $/kVA/mth 10.45 9.70 -0.75
Annual block 2 demand rate $/kVA/mth 8.67 7.99 -0.68
Additional demand $/kVA/mth 4.04 3.90 -0.14
Usage rate ¢/kWh 3.29 3.07 -0.22
There is a variant to this tariff available for sportsgrounds with significant floodlighting. This tariff
variant has a slightly different definition of peak demand period, using 12:01 to 19:00 local time for
December to February. The tariff variant is otherwise in line with the original tariff.
6.5.4 Low voltage business actual demand tariff
Table 32 contains proposed 2016/17 prices for low voltage business actual demand tariff.
This tariff was introduced in 2015/16 and has been used initially by large customers and some small
customers previously on agreed demand tariffs. Some small businesses currently on energy tariffs
may opt-in to this tariff.
Table 32- Proposed 2016/17 low voltage business tariff actual demand
Charging Parameter Units Existing 2015/16
Proposed 2016/17
Variance
Supply rate $ p.a. 0.00 0.00 0.00
Peak demand (Nov-March) $/kVA/mth 15.83 14.83 -1.00
Shoulder demand (July-June) $/kVA/mth 7.91 7.41 -0.50
Off-peak demand $/kVA/mth 0.00 0.00 0.00
Usage rate ¢/kWh 5.40 5.05 -0.35
6.5.5 Low voltage business actual demand tariff Transition
Table 33 contains proposed 2016/17 prices for low voltage business actual demand transition tariff.
This tariff was introduced in 2015/16 and has been used initially by large customers previously on
energy tariffs who might otherwise have faced an increase in prices when reassigned to a cost-
reflective tariff.
Each year, this tariff will progressively increase the proportion of the cost-reflective actual demand
tariff and reduce the proportion of the business 2-rate tariff. In 2016/17, the proportion of business
2-rate will reduce from 70% to 50% and the actual demand proportion will increase from 30% to
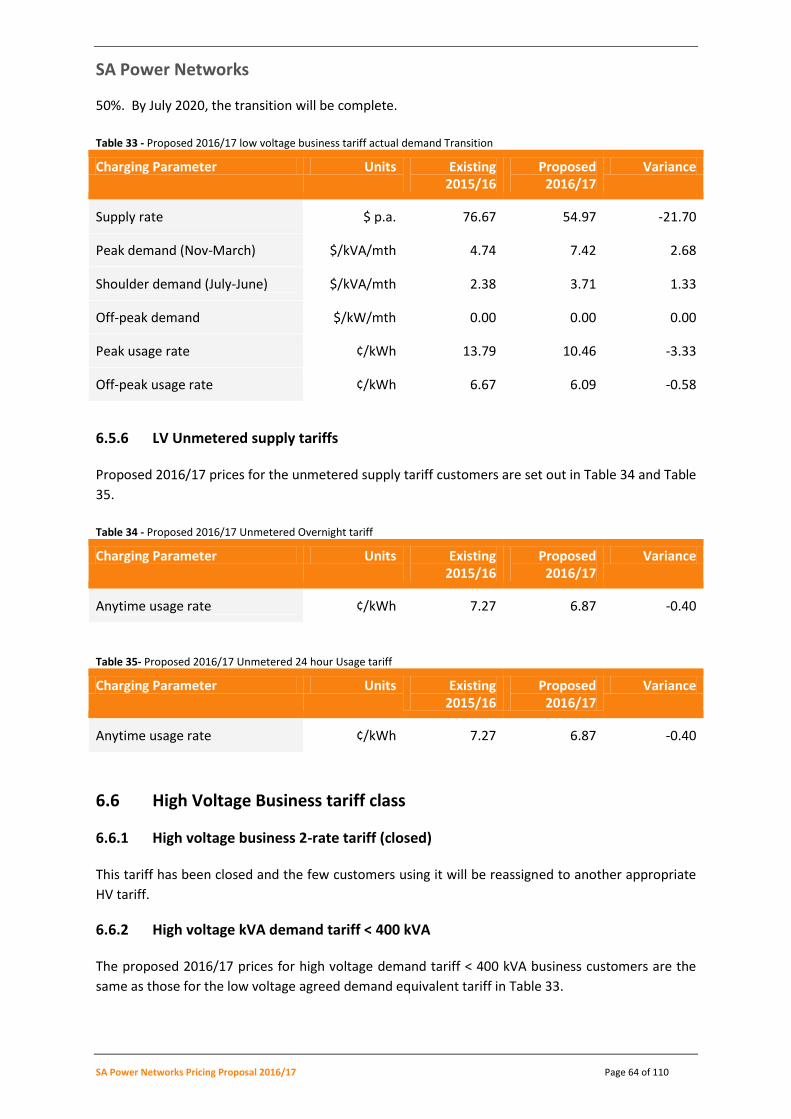
SA Power Networks
SA Power Networks Pricing Proposal 2016/17 Page 64 of 110
50%. By July 2020, the transition will be complete.
Table 33 - Proposed 2016/17 low voltage business tariff actual demand Transition
Charging Parameter Units Existing 2015/16
Proposed 2016/17
Variance
Supply rate $ p.a. 76.67 54.97 -21.70
Peak demand (Nov-March) $/kVA/mth 4.74 7.42 2.68
Shoulder demand (July-June) $/kVA/mth 2.38 3.71 1.33
Off-peak demand $/kW/mth 0.00 0.00 0.00
Peak usage rate ¢/kWh 13.79 10.46 -3.33
Off-peak usage rate ¢/kWh 6.67 6.09 -0.58
6.5.6 LV Unmetered supply tariffs
Proposed 2016/17 prices for the unmetered supply tariff customers are set out in Table 34 and Table
35.
Table 34 - Proposed 2016/17 Unmetered Overnight tariff
Charging Parameter Units Existing 2015/16
Proposed 2016/17
Variance
Anytime usage rate ¢/kWh 7.27 6.87 -0.40
Table 35- Proposed 2016/17 Unmetered 24 hour Usage tariff
Charging Parameter Units Existing 2015/16
Proposed 2016/17
Variance
Anytime usage rate ¢/kWh 7.27 6.87 -0.40
6.6 High Voltage Business tariff class
6.6.1 High voltage business 2-rate tariff (closed)
This tariff has been closed and the few customers using it will be reassigned to another appropriate
HV tariff.
6.6.2 High voltage kVA demand tariff < 400 kVA
The proposed 2016/17 prices for high voltage demand tariff < 400 kVA business customers are the
same as those for the low voltage agreed demand equivalent tariff in Table 33.
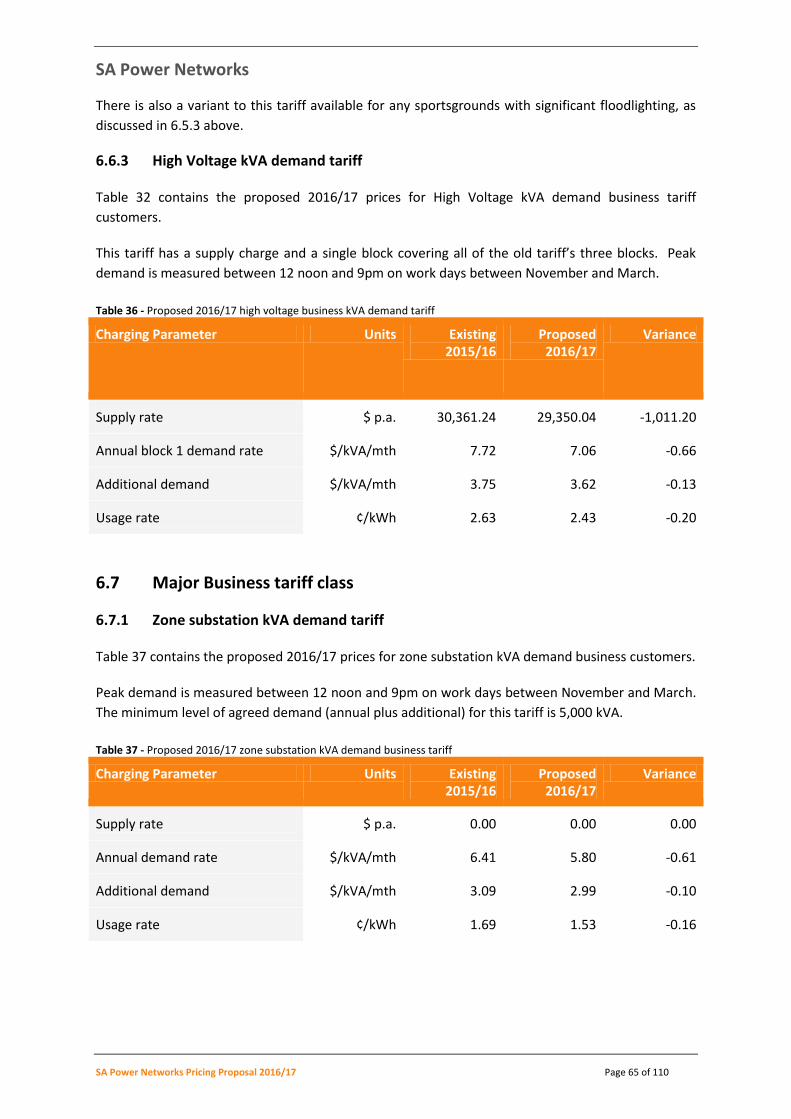
SA Power Networks
SA Power Networks Pricing Proposal 2016/17 Page 65 of 110
There is also a variant to this tariff available for any sportsgrounds with significant floodlighting, as
discussed in 6.5.3 above.
6.6.3 High Voltage kVA demand tariff
Table 32 contains the proposed 2016/17 prices for High Voltage kVA demand business tariff
customers.
This tariff has a supply charge and a single block covering all of the old tariff’s three blocks. Peak
demand is measured between 12 noon and 9pm on work days between November and March.
Table 36 - Proposed 2016/17 high voltage business kVA demand tariff
Charging Parameter Units Existing 2015/16
Proposed 2016/17
Variance
Supply rate $ p.a. 30,361.24 29,350.04 -1,011.20
Annual block 1 demand rate $/kVA/mth 7.72 7.06 -0.66
Additional demand $/kVA/mth 3.75 3.62 -0.13
Usage rate ¢/kWh 2.63 2.43 -0.20
6.7 Major Business tariff class
6.7.1 Zone substation kVA demand tariff
Table 37 contains the proposed 2016/17 prices for zone substation kVA demand business customers.
Peak demand is measured between 12 noon and 9pm on work days between November and March.
The minimum level of agreed demand (annual plus additional) for this tariff is 5,000 kVA.
Table 37 - Proposed 2016/17 zone substation kVA demand business tariff
Charging Parameter Units Existing 2015/16
Proposed 2016/17
Variance
Supply rate $ p.a. 0.00 0.00 0.00
Annual demand rate $/kVA/mth 6.41 5.80 -0.61
Additional demand $/kVA/mth 3.09 2.99 -0.10
Usage rate ¢/kWh 1.69 1.53 -0.16

SA Power Networks
SA Power Networks Pricing Proposal 2016/17 Page 66 of 110
6.7.2 Zone substation kVA demand locational tariff
This tariff incorporates the distribution and PV FiT charges applied in the zone substation kVA
demand tariff, with an individually calculated locational transmission charge for the major
business.Sub-transmission kVA demand tariff
Table 38 contains the proposed 2016/17 prices for sub-transmission kVA demand business
customers. It is used by those customers connected at sub-transmission that have not had a
locational tariff defined for them. Peak demand is measured between 12 noon and 9pm on work
days between November and March. The minimum level of agreed demand (annual plus additional)
for this tariff is 5,000 kVA.
Table 38 - Proposed 2016/17 Sub-transmission kVA demand tariff
Charging Parameter Units Existing 2015/16
Proposed 2016/17
Variance
Supply rate $ p.a. 0.00 0.00 0.00
Annual demand rate $/kVA/mth 3.97 3.44 -0.53
Additional demand $/kVA/mth 0.65 0.63 -0.02
Usage rate ¢/kWh 1.13 0.99 -0.14
6.7.3 Sub-transmission kVA demand locational tariff
This tariff incorporates the distribution and PV FiT charges applied in the sub-transmission kVA
demand tariff, with an individually calculated locational transmission charge for the major business.
SA Power Networks
SA Power Networks Pricing Proposal 2016/17 Page 67 of 110
7 Customer Impacts
In this Section, customer impacts are calculated for the individual components and the total of the
proposed bundled NUoS tariffs in a simple and transparent manner. The use of these network tariffs
results in customer impacts that include the following components:
DUoS charges, for SA Power Networks’ standard control services;
Transmission cost recovery tariffs, to recover costs associated with ElectraNet’s standard
control services and any avoided TUoS payments made by SA Power Networks to embedded
generators; and
The PV Jurisdictional Scheme Amount, which recovers the cost of payments made by SA
Power Networks for SA Government Feed-in Tariffs to customers with solar PV generators.
All of the customer impacts presented in this section are GST exclusive. Metering charges for SA
Power Networks’ alternative control services may also apply, but are not included in this analysis.
We have shown detailed outcomes for small customers in this section. Outcomes for large
customers should be in line with that shown in the tariff class summaries shown in the previous
section, at somewhere between a 5% and 6% saving.
7.1 Regulatory Requirements
7.1.1 Rules requirements
Rules clause 6.18.2 imposes a requirement for the Pricing Proposal to set out the nature of
variations potential deviations from the published tariffs that may take place during 2016/17.
6.18.2 Pricing proposals
(b) A pricing proposal must:
(5) set out the nature of any variation or adjustment to the tariff that could occur
during the course of the regulatory year and the basis on which it could occur;
Clause 6.18.9 requires the publication of price trends over the 2015-20 regulatory control period and
the reasons for expected variations.
6.18.9 Publication of information about tariffs and tariff classes
(a) A Distribution Network Service Provider must maintain on its website:
(3) a statement of expected price trends (to be updated for each regulatory year)
giving an indication of how the Distribution Network Service Provider expects
prices to change over the regulatory control period and the reasons for the
expected changes.

SA Power Networks
SA Power Networks Pricing Proposal 2016/17 Page 68 of 110
7.2 Overall price trends during the 2015-20 regulatory control period
The expected overall price trends over the course of the determination are built up from the
following components:
SA Power Networks’ distribution prices for standard control services, in accordance with
the AER’s Final Decision of a revenue cap;
Transmission related prices, using ElectraNet’s 16 May 2016 pricing advice for 2016/17
prices; and
Forecasts for future period recovery of the SA Government PV FiT payments to qualifying generators
under the JSA arrangement. At this time, we have not prepared any further forecast of forward
prices beyond 2016/17. We have prepared detailed forecasts of prices through to 2019/20 in our
TSS prepared in December 2015 which remain relevant today. We will be updating our forecast of
future network prices as part of our TSS Revision in September 2016. We refer customers to these
documents if they seek information on likely tariff price movements.
Table 39– SA Power Networks’ DUoS charges (nominal $, GST excl.)
Tariff DUoS $/MWh 2015/16
DUoS $/MWh 2016/17
Residential 104 108
Residential and Hot Water 83 86
Business Single 105 108
Business 2-Rate 85 88
Business LV Actual Demand 92 95
Business LV Agreed Demand 54 56
Business HV Demand 36 37
In addition to SA Power Networks’ distribution charges, the bundled NUoS price includes the pass-
throughs of the transmission and SA Government PV feed-in payments as shown in Table 40.
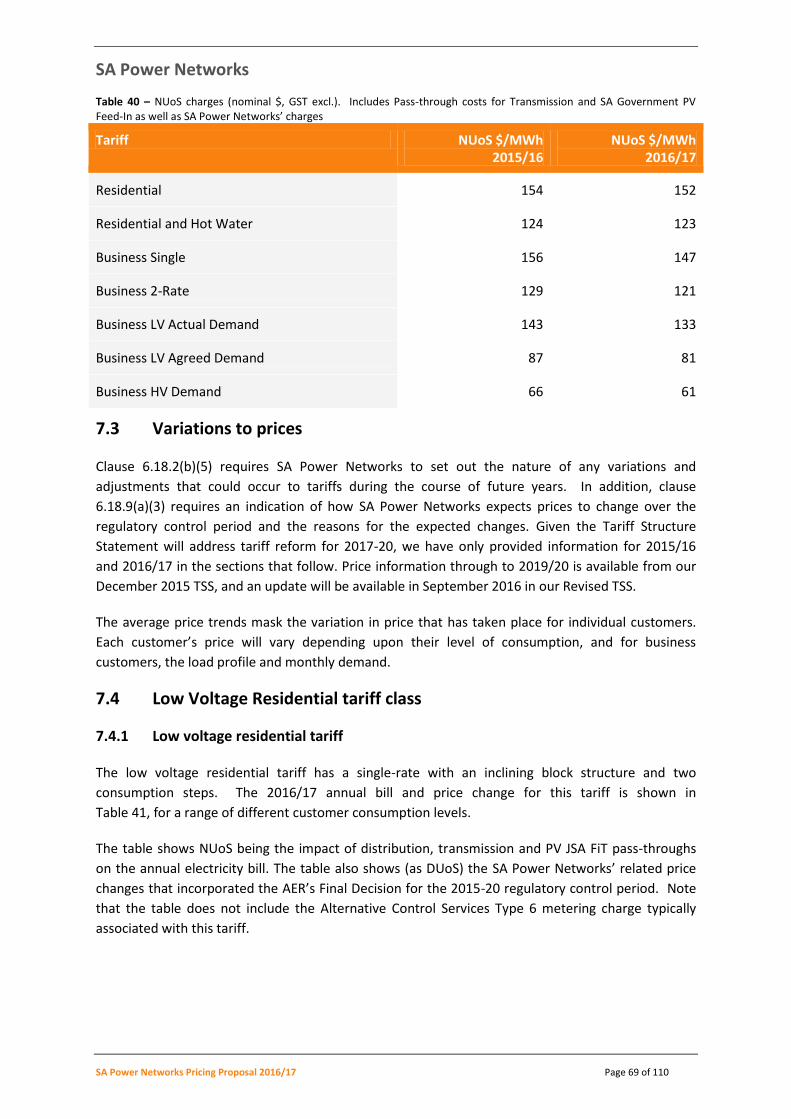
SA Power Networks
SA Power Networks Pricing Proposal 2016/17 Page 69 of 110
Table 40 – NUoS charges (nominal $, GST excl.). Includes Pass-through costs for Transmission and SA Government PV Feed-In as well as SA Power Networks’ charges
Tariff NUoS $/MWh 2015/16
NUoS $/MWh 2016/17
Residential 154 152
Residential and Hot Water 124 123
Business Single 156 147
Business 2-Rate 129 121
Business LV Actual Demand 143 133
Business LV Agreed Demand 87 81
Business HV Demand 66 61
7.3 Variations to prices
Clause 6.18.2(b)(5) requires SA Power Networks to set out the nature of any variations and
adjustments that could occur to tariffs during the course of future years. In addition, clause
6.18.9(a)(3) requires an indication of how SA Power Networks expects prices to change over the
regulatory control period and the reasons for the expected changes. Given the Tariff Structure
Statement will address tariff reform for 2017-20, we have only provided information for 2015/16
and 2016/17 in the sections that follow. Price information through to 2019/20 is available from our
December 2015 TSS, and an update will be available in September 2016 in our Revised TSS.
The average price trends mask the variation in price that has taken place for individual customers.
Each customer’s price will vary depending upon their level of consumption, and for business
customers, the load profile and monthly demand.
7.4 Low Voltage Residential tariff class
7.4.1 Low voltage residential tariff
The low voltage residential tariff has a single-rate with an inclining block structure and two
consumption steps. The 2016/17 annual bill and price change for this tariff is shown in
Table 41, for a range of different customer consumption levels.
The table shows NUoS being the impact of distribution, transmission and PV JSA FiT pass-throughs
on the annual electricity bill. The table also shows (as DUoS) the SA Power Networks’ related price
changes that incorporated the AER’s Final Decision for the 2015-20 regulatory control period. Note
that the table does not include the Alternative Control Services Type 6 metering charge typically
associated with this tariff.
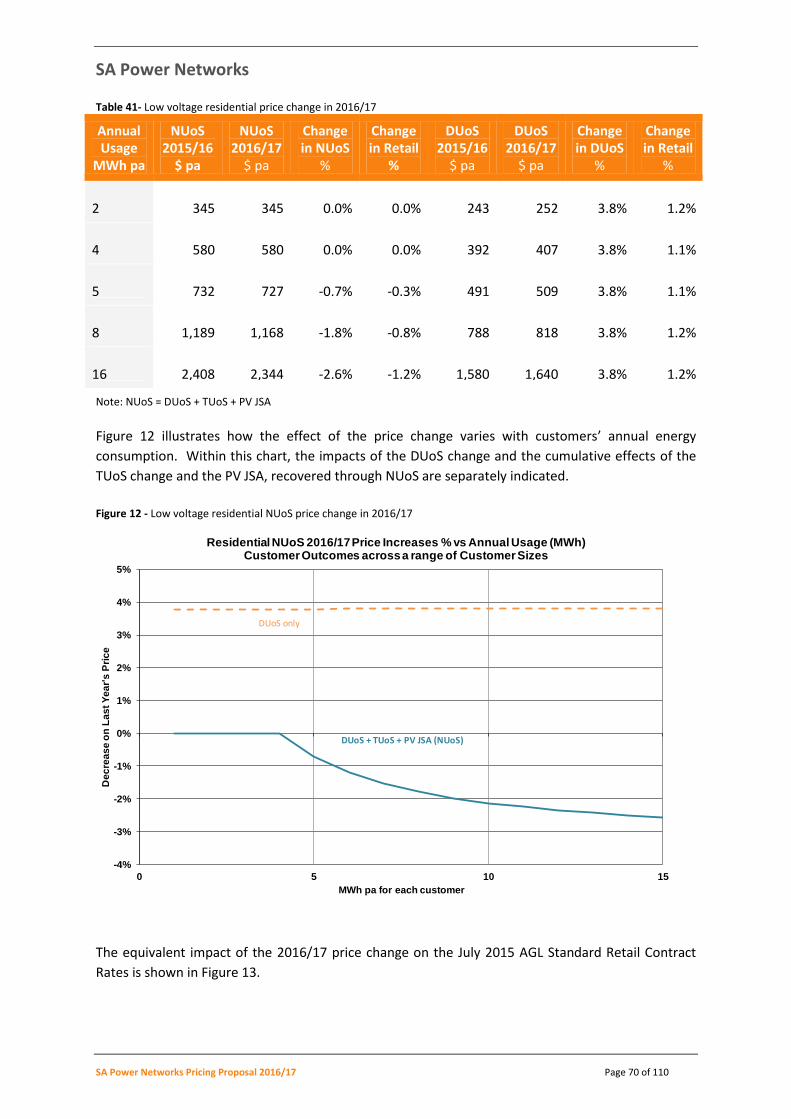
SA Power Networks
SA Power Networks Pricing Proposal 2016/17 Page 70 of 110
Table 41- Low voltage residential price change in 2016/17
Annual Usage
MWh pa
NUoS 2015/16
$ pa
NUoS 2016/17
$ pa
Change in NUoS
%
Change in Retail
%
DUoS 2015/16
$ pa
DUoS 2016/17
$ pa
Change in DUoS
%
Change in Retail
%
2 345 345 0.0% 0.0% 243 252 3.8% 1.2%
4 580 580 0.0% 0.0% 392 407 3.8% 1.1%
5 732 727 -0.7% -0.3% 491 509 3.8% 1.1%
8 1,189 1,168 -1.8% -0.8% 788 818 3.8% 1.2%
16 2,408 2,344 -2.6% -1.2% 1,580 1,640 3.8% 1.2%
Note: NUoS = DUoS + TUoS + PV JSA
Figure 12 illustrates how the effect of the price change varies with customers’ annual energy
consumption. Within this chart, the impacts of the DUoS change and the cumulative effects of the
TUoS change and the PV JSA, recovered through NUoS are separately indicated.
Figure 12 - Low voltage residential NUoS price change in 2016/17
The equivalent impact of the 2016/17 price change on the July 2015 AGL Standard Retail Contract
Rates is shown in Figure 13.
-4%
-3%
-2%
-1%
0%
1%
2%
3%
4%
5%
0 5 10 15
De
cre
as
e o
n L
as
t Y
ea
r's
Pri
ce
MWh pa for each customer
Residential NUoS 2016/17 Price Increases % vs Annual Usage (MWh)Customer Outcomes across a range of Customer Sizes
DUoS + TUoS + PV JSA (NUoS)
DUoS only
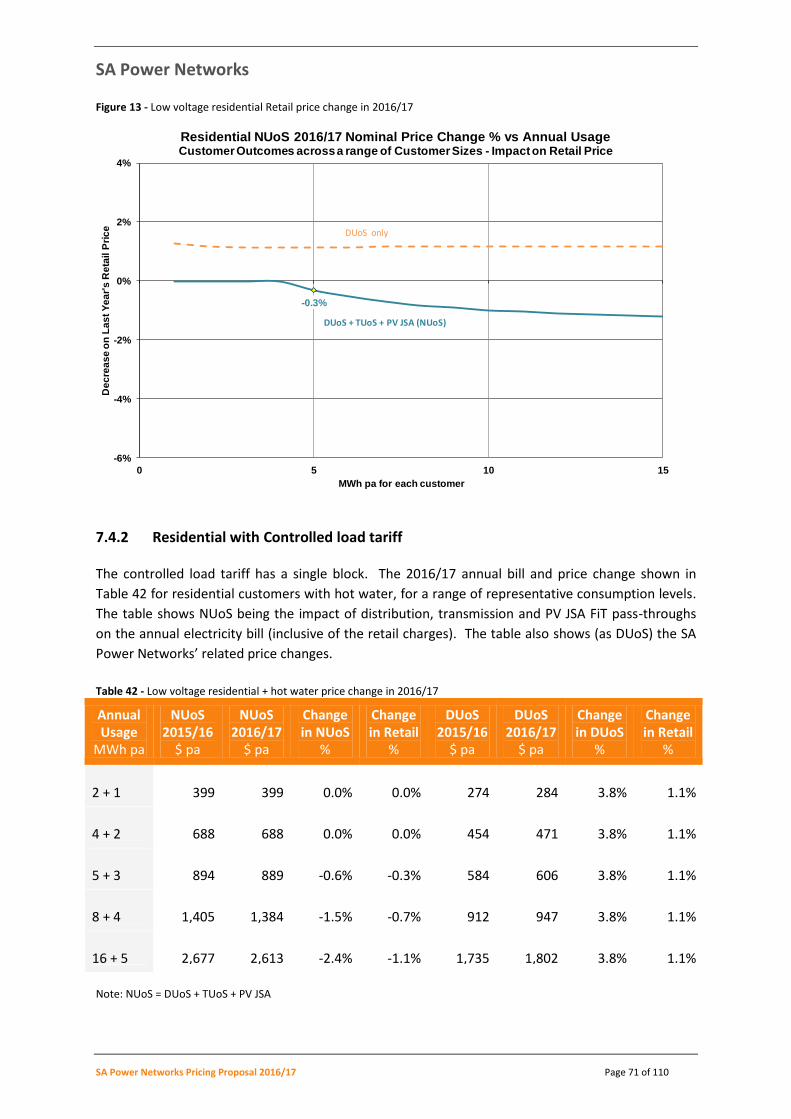
SA Power Networks
SA Power Networks Pricing Proposal 2016/17 Page 71 of 110
Figure 13 - Low voltage residential Retail price change in 2016/17
7.4.2 Residential with Controlled load tariff
The controlled load tariff has a single block. The 2016/17 annual bill and price change shown in
Table 42 for residential customers with hot water, for a range of representative consumption levels.
The table shows NUoS being the impact of distribution, transmission and PV JSA FiT pass-throughs
on the annual electricity bill (inclusive of the retail charges). The table also shows (as DUoS) the SA
Power Networks’ related price changes.
Table 42 - Low voltage residential + hot water price change in 2016/17
Annual Usage
MWh pa
NUoS 2015/16
$ pa
NUoS 2016/17
$ pa
Change in NUoS
%
Change in Retail
%
DUoS 2015/16
$ pa
DUoS 2016/17
$ pa
Change in DUoS
%
Change in Retail
%
2 + 1 399 399 0.0% 0.0% 274 284 3.8% 1.1%
4 + 2 688 688 0.0% 0.0% 454 471 3.8% 1.1%
5 + 3 894 889 -0.6% -0.3% 584 606 3.8% 1.1%
8 + 4 1,405 1,384 -1.5% -0.7% 912 947 3.8% 1.1%
16 + 5 2,677 2,613 -2.4% -1.1% 1,735 1,802 3.8% 1.1%
Note: NUoS = DUoS + TUoS + PV JSA
-0.3%
-6%
-4%
-2%
0%
2%
4%
0 5 10 15
De
cre
as
e o
n L
as
t Y
ea
r's
Re
tail P
ric
e
MWh pa for each customer
Residential NUoS 2016/17 Nominal Price Change % vs Annual UsageCustomer Outcomes across a range of Customer Sizes - Impact on Retail Price
DUoS + TUoS + PV JSA (NUoS)
DUoS only
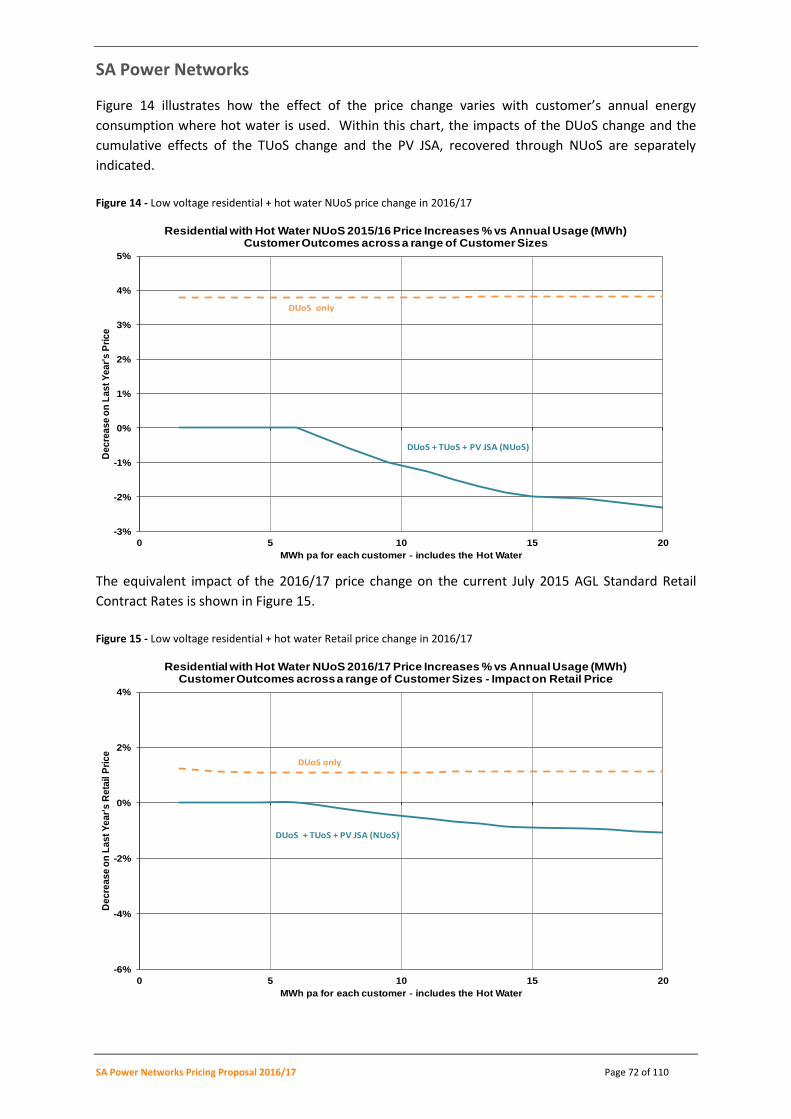
SA Power Networks
SA Power Networks Pricing Proposal 2016/17 Page 72 of 110
Figure 14 illustrates how the effect of the price change varies with customer’s annual energy
consumption where hot water is used. Within this chart, the impacts of the DUoS change and the
cumulative effects of the TUoS change and the PV JSA, recovered through NUoS are separately
indicated.
Figure 14 - Low voltage residential + hot water NUoS price change in 2016/17
The equivalent impact of the 2016/17 price change on the current July 2015 AGL Standard Retail
Contract Rates is shown in Figure 15.
Figure 15 - Low voltage residential + hot water Retail price change in 2016/17
-3%
-2%
-1%
0%
1%
2%
3%
4%
5%
0 5 10 15 20
De
cre
as
e o
n L
as
t Y
ea
r's
Pri
ce
MWh pa for each customer - includes the Hot Water
Residential with Hot Water NUoS 2015/16 Price Increases % vs Annual Usage (MWh)Customer Outcomes across a range of Customer Sizes
DUoS + TUoS + PV JSA (NUoS)
DUoS only
-6%
-4%
-2%
0%
2%
4%
0 5 10 15 20
De
cre
as
e o
n L
as
t Y
ea
r's
Re
tail
Pri
ce
MWh pa for each customer - includes the Hot Water
Residential with Hot Water NUoS 2016/17 Price Increases % vs Annual Usage (MWh)Customer Outcomes across a range of Customer Sizes - Impact on Retail Price
DUoS + TUoS + PV JSA (NUoS)
DUoS only
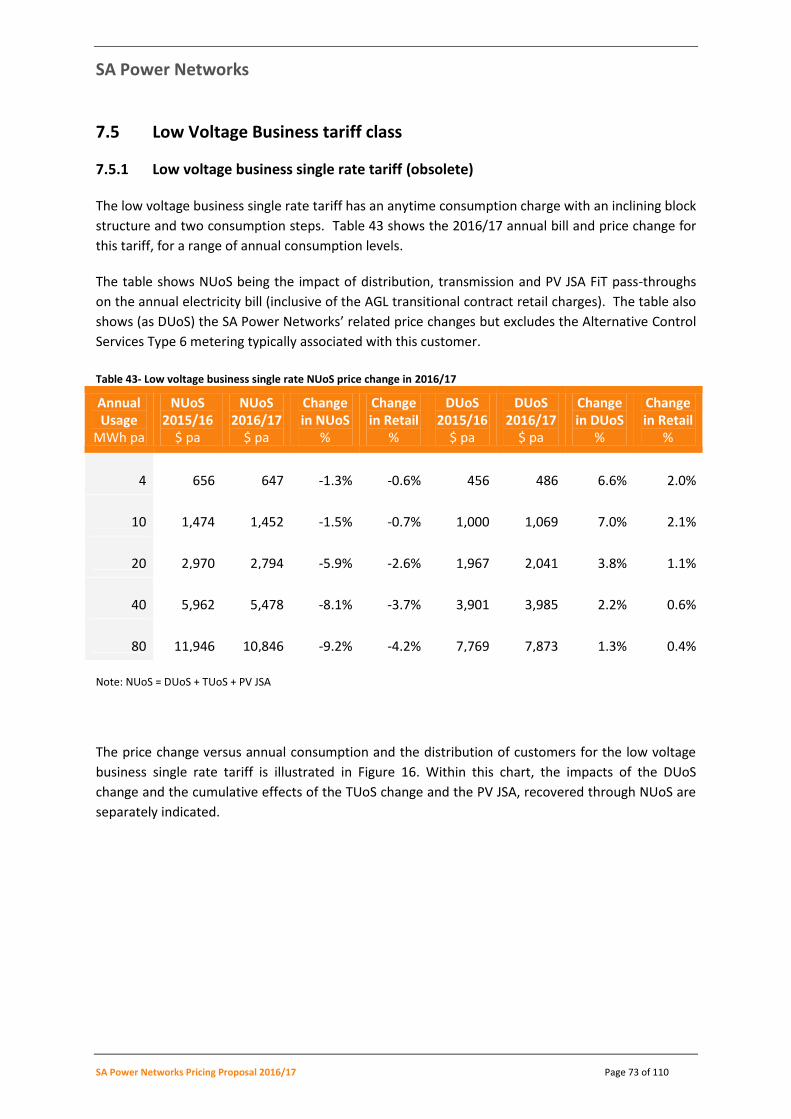
SA Power Networks
SA Power Networks Pricing Proposal 2016/17 Page 73 of 110
7.5 Low Voltage Business tariff class
7.5.1 Low voltage business single rate tariff (obsolete)
The low voltage business single rate tariff has an anytime consumption charge with an inclining block
structure and two consumption steps. Table 43 shows the 2016/17 annual bill and price change for
this tariff, for a range of annual consumption levels.
The table shows NUoS being the impact of distribution, transmission and PV JSA FiT pass-throughs
on the annual electricity bill (inclusive of the AGL transitional contract retail charges). The table also
shows (as DUoS) the SA Power Networks’ related price changes but excludes the Alternative Control
Services Type 6 metering typically associated with this customer.
Table 43- Low voltage business single rate NUoS price change in 2016/17
Annual Usage
MWh pa
NUoS 2015/16
$ pa
NUoS 2016/17
$ pa
Change in NUoS
%
Change in Retail
%
DUoS 2015/16
$ pa
DUoS 2016/17
$ pa
Change in DUoS
%
Change in Retail
%
4 656 647 -1.3% -0.6% 456 486 6.6% 2.0%
10 1,474 1,452 -1.5% -0.7% 1,000 1,069 7.0% 2.1%
20 2,970 2,794 -5.9% -2.6% 1,967 2,041 3.8% 1.1%
40 5,962 5,478 -8.1% -3.7% 3,901 3,985 2.2% 0.6%
80 11,946 10,846 -9.2% -4.2% 7,769 7,873 1.3% 0.4%
Note: NUoS = DUoS + TUoS + PV JSA
The price change versus annual consumption and the distribution of customers for the low voltage
business single rate tariff is illustrated in Figure 16. Within this chart, the impacts of the DUoS
change and the cumulative effects of the TUoS change and the PV JSA, recovered through NUoS are
separately indicated.
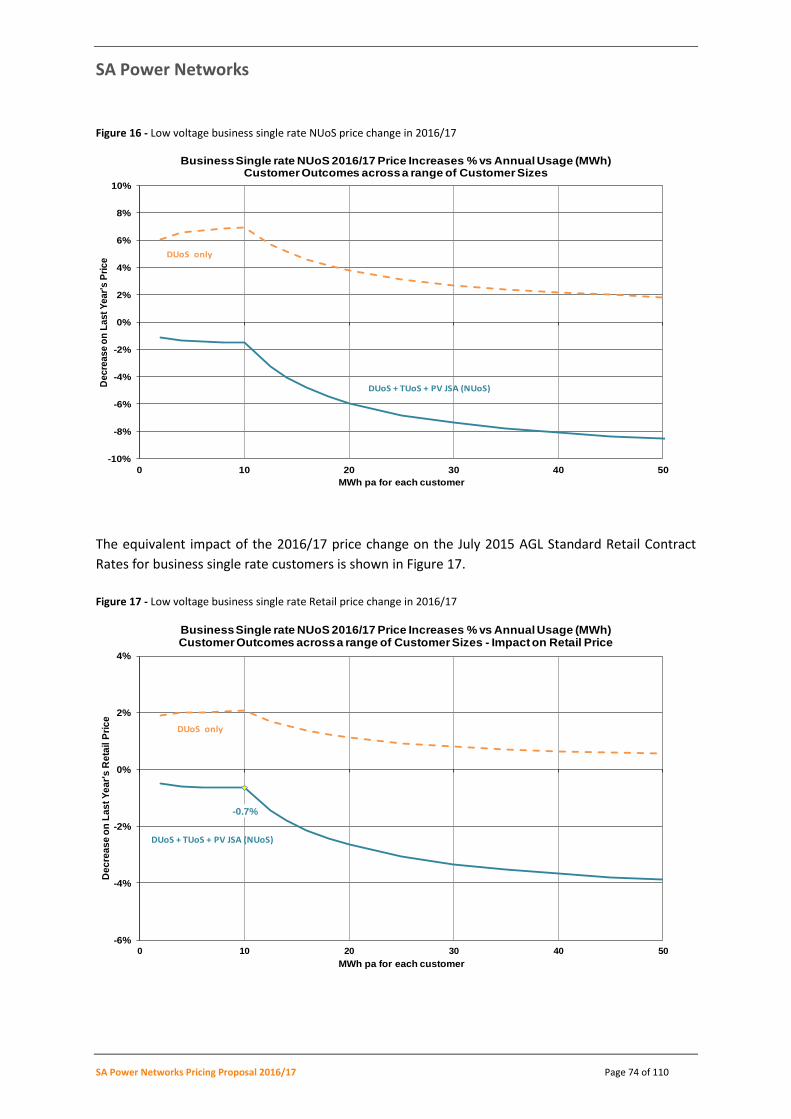
SA Power Networks
SA Power Networks Pricing Proposal 2016/17 Page 74 of 110
Figure 16 - Low voltage business single rate NUoS price change in 2016/17
The equivalent impact of the 2016/17 price change on the July 2015 AGL Standard Retail Contract
Rates for business single rate customers is shown in Figure 17.
Figure 17 - Low voltage business single rate Retail price change in 2016/17
-10%
-8%
-6%
-4%
-2%
0%
2%
4%
6%
8%
10%
0 10 20 30 40 50
De
cre
as
e o
n L
as
t Y
ea
r's
Pri
ce
MWh pa for each customer
Business Single rate NUoS 2016/17 Price Increases % vs Annual Usage (MWh)Customer Outcomes across a range of Customer Sizes
DUoS + TUoS + PV JSA (NUoS)
DUoS only
-0.7%
-6%
-4%
-2%
0%
2%
4%
0 10 20 30 40 50
De
cre
as
e o
n L
as
t Y
ea
r's
Re
tail P
ric
e
MWh pa for each customer
Business Single rate NUoS 2016/17 Price Increases % vs Annual Usage (MWh)Customer Outcomes across a range of Customer Sizes - Impact on Retail Price
DUoS + TUoS + PV JSA (NUoS)
DUoS only
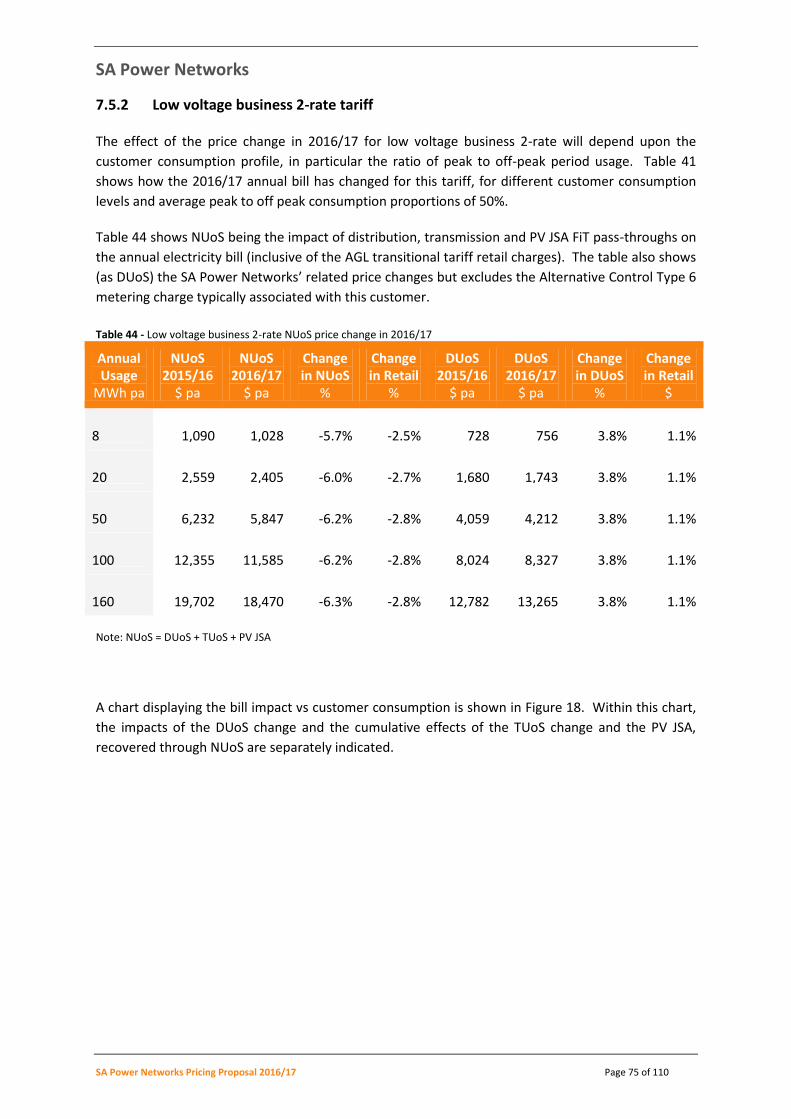
SA Power Networks
SA Power Networks Pricing Proposal 2016/17 Page 75 of 110
7.5.2 Low voltage business 2-rate tariff
The effect of the price change in 2016/17 for low voltage business 2-rate will depend upon the
customer consumption profile, in particular the ratio of peak to off-peak period usage. Table 41
shows how the 2016/17 annual bill has changed for this tariff, for different customer consumption
levels and average peak to off peak consumption proportions of 50%.
Table 44 shows NUoS being the impact of distribution, transmission and PV JSA FiT pass-throughs on
the annual electricity bill (inclusive of the AGL transitional tariff retail charges). The table also shows
(as DUoS) the SA Power Networks’ related price changes but excludes the Alternative Control Type 6
metering charge typically associated with this customer.
Table 44 - Low voltage business 2-rate NUoS price change in 2016/17
Annual Usage
MWh pa
NUoS 2015/16
$ pa
NUoS 2016/17
$ pa
Change in NUoS
%
Change in Retail
%
DUoS 2015/16
$ pa
DUoS 2016/17
$ pa
Change in DUoS
%
Change in Retail
$
8 1,090 1,028 -5.7% -2.5% 728 756 3.8% 1.1%
20 2,559 2,405 -6.0% -2.7% 1,680 1,743 3.8% 1.1%
50 6,232 5,847 -6.2% -2.8% 4,059 4,212 3.8% 1.1%
100 12,355 11,585 -6.2% -2.8% 8,024 8,327 3.8% 1.1%
160 19,702 18,470 -6.3% -2.8% 12,782 13,265 3.8% 1.1%
Note: NUoS = DUoS + TUoS + PV JSA
A chart displaying the bill impact vs customer consumption is shown in Figure 18. Within this chart,
the impacts of the DUoS change and the cumulative effects of the TUoS change and the PV JSA,
recovered through NUoS are separately indicated.
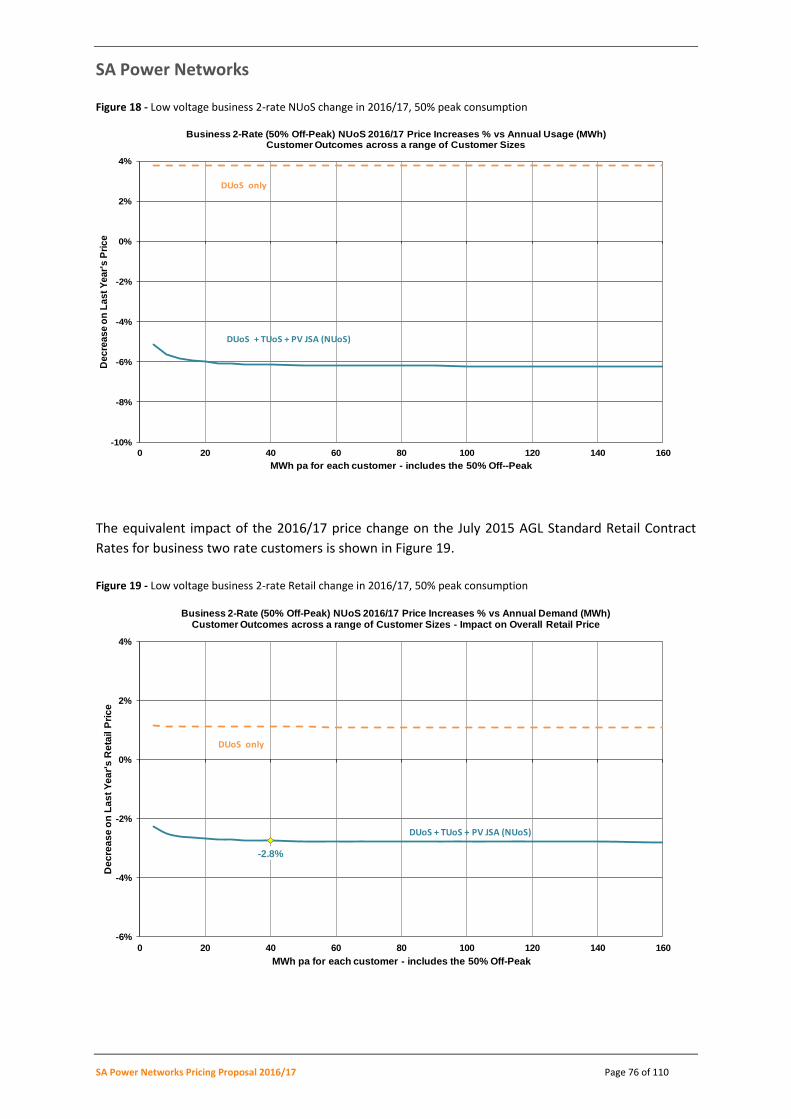
SA Power Networks
SA Power Networks Pricing Proposal 2016/17 Page 76 of 110
Figure 18 - Low voltage business 2-rate NUoS change in 2016/17, 50% peak consumption
The equivalent impact of the 2016/17 price change on the July 2015 AGL Standard Retail Contract
Rates for business two rate customers is shown in Figure 19.
Figure 19 - Low voltage business 2-rate Retail change in 2016/17, 50% peak consumption
-10%
-8%
-6%
-4%
-2%
0%
2%
4%
0 20 40 60 80 100 120 140 160
De
cre
as
e o
n L
as
t Y
ea
r's
Pri
ce
MWh pa for each customer - includes the 50% Off--Peak
Business 2-Rate (50% Off-Peak) NUoS 2016/17 Price Increases % vs Annual Usage (MWh)Customer Outcomes across a range of Customer Sizes
DUoS + TUoS + PV JSA (NUoS)
DUoS only
-2.8%
-6%
-4%
-2%
0%
2%
4%
0 20 40 60 80 100 120 140 160
De
cre
as
e o
n L
as
t Y
ea
r's
Re
tail P
ric
e
MWh pa for each customer - includes the 50% Off-Peak
Business 2-Rate (50% Off-Peak) NUoS 2016/17 Price Increases % vs Annual Demand (MWh)Customer Outcomes across a range of Customer Sizes - Impact on Overall Retail Price
DUoS only
DUoS + TUoS + PV JSA (NUoS)
SA Power Networks
SA Power Networks Pricing Proposal 2016/17 Page 77 of 110
Some business 2-rate customers use more than 50% of their energy during peak times. These
customers will receive a slightly smaller price decrease than indicated above. Other customers use
more than 50% of their energy in off-peak times and will receive a larger decrease. Off-peak NUoS
prices were held at the low 2015/16 price level whilst peak prices were reduced from a high price
level. Figures 20 and 21 below indicate the outcomes for customers using 75% of their energy in off-
peak times.
Figure 20 - Low voltage business 2-rate NUoS change in 2016/17, 25% peak consumption
Figure 21 - Low voltage business 2-rate Retail change in 2016/17, 25% peak consumption
-8%
-6%
-4%
-2%
0%
2%
4%
6%
0 20 40 60 80 100 120 140 160
De
cre
as
e o
n L
as
t Y
ea
r's
Pri
ce
MWh pa for each customer - includes the 75% Off--Peak
Business 2-Rate (75% Off-Pk) NUoS 2016/17 Price Increases % vs Annual Usage MWhCustomer Outcomes across a range of Customer Sizes
DUoS + TUoS + PV JSA (NUoS)
DUoS only
-6%
-4%
-2%
0%
2%
4%
0 20 40 60 80 100 120 140 160
De
cre
as
e o
n L
as
t Y
ea
r's
Re
tail
Pri
ce
MWh pa for each customer - includes the 75% Off-Peak
Business 2-Rate (75% Off-Pk) NUoS 2016/17 Price Increases % vs Annual Usage MWhCustomer Outcomes across a range of Customer Sizes - Impact on Retail Price
DUoS only
DUoS + TUoS + PV JSA (NUoS)
SA Power Networks
SA Power Networks Pricing Proposal 2016/17 Page 78 of 110
7.5.3 Low Voltage kVA agreed demand/actual demand/transition actual demand tariff
The average NUoS price decrease of low voltage kVA cost-reflective customers in 2016/17 is 6%.
7.6 High Voltage Business tariff class
7.6.1 High voltage kVA agreed demand < 400 kVA tariff
The rates of the high voltage < 400 kVA and the low voltage kVA agreed demand tariffs are the same.
The information in Section 7.5.3 above mimics the outcome for these customers.
7.6.2 High Voltage kVA agreed demand/actual demand tariff
The average NUoS price decrease of high voltage kVA agreed demand customers in 2016/17 is 5.4%.
7.7 Major Business tariff class
7.7.1 Zone substation and Sub-transmission kVA agreed demand locational tariffs
There is little variability between the individual price changes for these customers and the averages
for the tariff. The average DUoS/PV FiT price change for these major businesses in 2016/17 is a
decrease of -3%.
SA Power Networks
SA Power Networks Pricing Proposal 2016/17 Page 79 of 110
8 Pricing of standard control services
This Section demonstrates how SA Power Networks’ network tariffs for 2016/17 comply with the
requirements of the Rules and the AER’s Preliminary Decision in respect of the pricing X factors, side
constraints and pricing principles.
8.1 Regulatory requirements
8.1.1 Rules requirements
Rules clause 6.18.2(b) specifies that SA Power Networks’ Pricing Proposal must contain information
concerning the expected revenue to be derived from its tariff classes and tariffs, as follows.
6.18.2 Pricing proposals
(b) A pricing proposal must:
(4) set out, for each tariff class related to standard control services, the expected
weighted average revenue for the relevant regulatory year and also for the
current regulatory year; and
In setting its prices for standard control services, clause 6.18.5 of the Rules requires SA Power
Networks to comply with the following pricing principles.
6.18.5 Pricing principles
(a) For each tariff class, the revenue expected to be recovered should lie on or between:
(1) an upper bound representing the stand alone cost of serving the customers who
belong to that class; and
(2) a lower bound representing the avoidable cost of not serving those customers.
(b) A tariff, and if it consists of 2 or more charging parameters, each charging parameter
for a tariff class:
(1) must take into account the long run marginal cost for the service or, in the case of
a charging parameter, for the element of the service to which the charging
parameter relates; and
(2) must be determined having regard to:
(i) transaction costs associated with the tariff or each charging parameter; and
(ii) whether customers of the relevant tariff class are able or likely to respond to
price signals.
(c) If, however, as a result of the operation of paragraph (b), the Distribution Network
Service Provider may not recover the expected revenue, the provider must adjust its
tariffs so as to ensure recovery of expected revenue with minimum distortion to
efficient patterns of consumption.

SA Power Networks
SA Power Networks Pricing Proposal 2016/17 Page 80 of 110
In respect of pricing side constraints, SA Power Networks is required to comply with clause 6.18.6 of
the Rules:
6.18.6 Side constraints on tariffs for standard control services
(a) This clause applies only to tariff classes related to the provision of standard control
services.
(b) The expected weighted average revenue to be raised from a tariff class for a particular
regulatory year of a regulatory control period must not exceed the corresponding
expected weighted average revenue for the preceding regulatory year by more than the
permissible percentage.
(c) The permissible percentage is the greater of the following:
(1) the CPI-X limitation on any increase in the Distribution Network Service Provider's
expected weighted average revenue between the two regulatory years plus 2%;
Note:
The calculation is of the form (1 + CPI)(1 – X)(1 + 2%)
(2) CPI plus 2%.
Note:
The calculation is of the form (1 + CPI)(1 + 2%)
(d) In deciding whether the permissible percentage has been exceeded in a particular
regulatory year, the following are to be disregarded:
(1) the recovery of revenue to accommodate a variation to the distribution
determination under rule 6.6 or 6.13;
(2) the recovery of revenue to accommodate pass through of charges for
transmission use of system services to customers.
(e) This clause does not, however, limit the extent a tariff for customers with remotely-read
interval metering or other similar metering technology may vary according to the time
or other circumstances of the customer's usage.
8.1.2 Requirements of the AER’s Decision
The principal elements of the AER’s Preliminary Decision are set out in Attachment 14 (Control
Mechanisms) Decision and form the major determinants of prices for standard control services for
2016/17. Section 3.3 of this Pricing Proposal sets out the specific formulae.
8.2 2016/17 prices for standard control services
The fundamental pricing criteria that SA Power Networks has factored into this Pricing Proposal are
that prices should be set to recover the allowed revenue of $733.57M assuming forecast quantities.
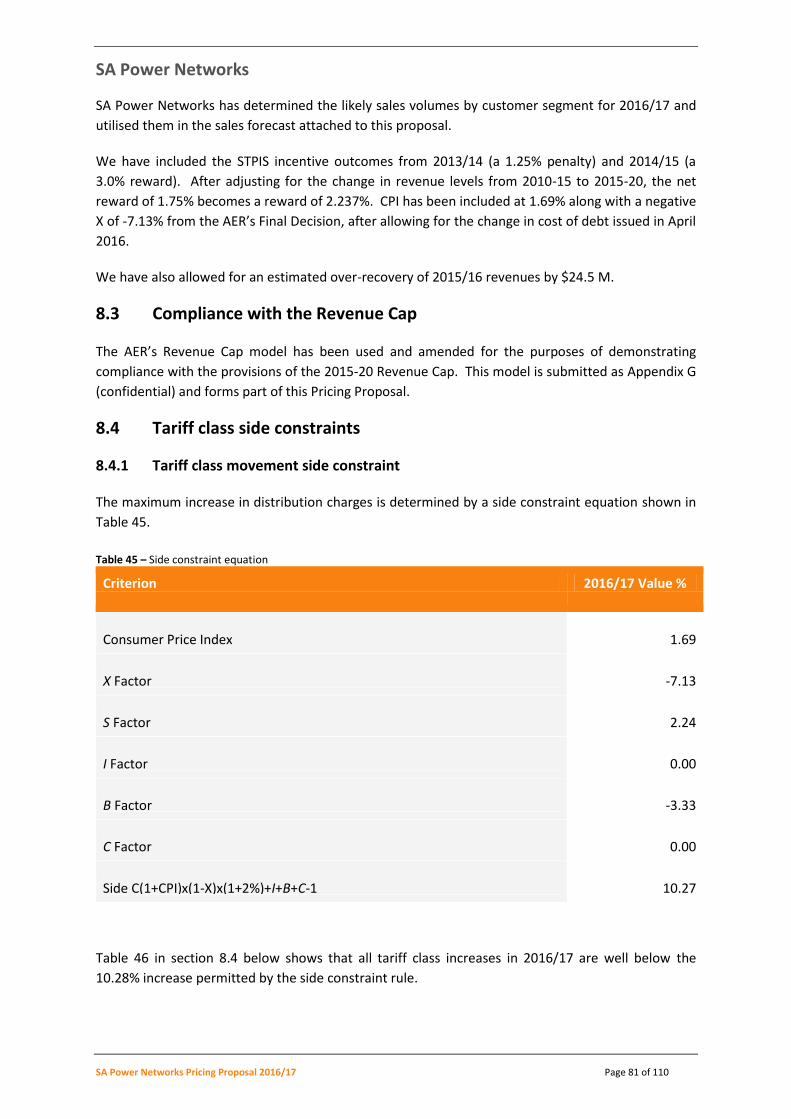
SA Power Networks
SA Power Networks Pricing Proposal 2016/17 Page 81 of 110
SA Power Networks has determined the likely sales volumes by customer segment for 2016/17 and
utilised them in the sales forecast attached to this proposal.
We have included the STPIS incentive outcomes from 2013/14 (a 1.25% penalty) and 2014/15 (a
3.0% reward). After adjusting for the change in revenue levels from 2010-15 to 2015-20, the net
reward of 1.75% becomes a reward of 2.237%. CPI has been included at 1.69% along with a negative
X of -7.13% from the AER’s Final Decision, after allowing for the change in cost of debt issued in April
2016.
We have also allowed for an estimated over-recovery of 2015/16 revenues by $24.5 M.
8.3 Compliance with the Revenue Cap
The AER’s Revenue Cap model has been used and amended for the purposes of demonstrating
compliance with the provisions of the 2015-20 Revenue Cap. This model is submitted as Appendix G
(confidential) and forms part of this Pricing Proposal.
8.4 Tariff class side constraints
8.4.1 Tariff class movement side constraint
The maximum increase in distribution charges is determined by a side constraint equation shown in
Table 45.
Table 45 – Side constraint equation
Criterion 2016/17 Value %
Consumer Price Index 1.69
X Factor -7.13
S Factor 2.24
I Factor 0.00
B Factor -3.33
C Factor 0.00
Side C(1+CPI)x(1-X)x(1+2%)+I+B+C-1 10.27
Table 46 in section 8.4 below shows that all tariff class increases in 2016/17 are well below the
10.28% increase permitted by the side constraint rule.
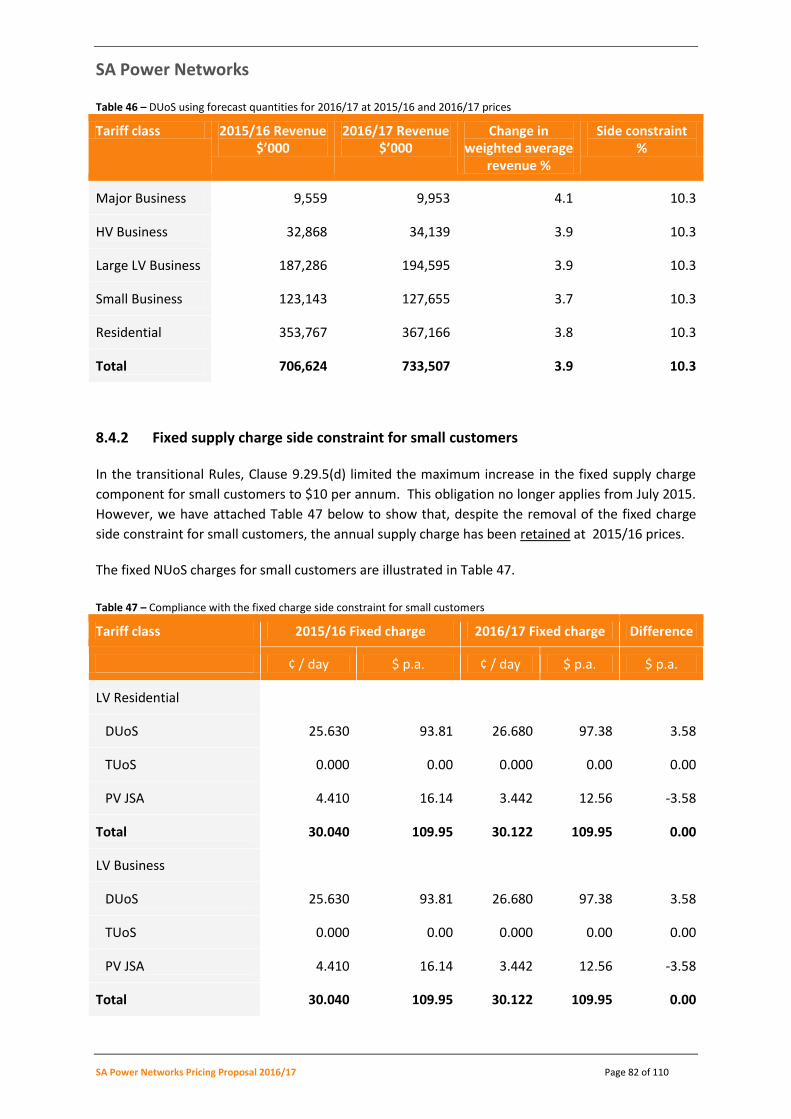
SA Power Networks
SA Power Networks Pricing Proposal 2016/17 Page 82 of 110
Table 46 – DUoS using forecast quantities for 2016/17 at 2015/16 and 2016/17 prices
Tariff class 2015/16 Revenue $’000
2016/17 Revenue $’000
Change in weighted average
revenue %
Side constraint %
Major Business 9,559 9,953 4.1 10.3
HV Business 32,868 34,139 3.9 10.3
Large LV Business 187,286 194,595 3.9 10.3
Small Business 123,143 127,655 3.7 10.3
Residential 353,767 367,166 3.8 10.3
Total 706,624 733,507 3.9 10.3
8.4.2 Fixed supply charge side constraint for small customers
In the transitional Rules, Clause 9.29.5(d) limited the maximum increase in the fixed supply charge
component for small customers to $10 per annum. This obligation no longer applies from July 2015.
However, we have attached Table 47 below to show that, despite the removal of the fixed charge
side constraint for small customers, the annual supply charge has been retained at 2015/16 prices.
The fixed NUoS charges for small customers are illustrated in Table 47.
Table 47 – Compliance with the fixed charge side constraint for small customers
Tariff class 2015/16 Fixed charge 2016/17 Fixed charge Difference
¢ / day $ p.a. ¢ / day $ p.a. $ p.a.
LV Residential
DUoS 25.630 93.81 26.680 97.38 3.58
TUoS 0.000 0.00 0.000 0.00 0.00
PV JSA 4.410 16.14 3.442 12.56 -3.58
Total 30.040 109.95 30.122 109.95 0.00
LV Business
DUoS 25.630 93.81 26.680 97.38 3.58
TUoS 0.000 0.00 0.000 0.00 0.00
PV JSA 4.410 16.14 3.442 12.56 -3.58
Total 30.040 109.95 30.122 109.95 0.00
SA Power Networks
SA Power Networks Pricing Proposal 2016/17 Page 83 of 110
8.5 Compliance with pricing principles
This Section demonstrates SA Power Networks’ compliance with the pricing principles set out in
clause 6.18.5 of the Rules, which requires SA Power Networks to ensure that the revenue recovered
for each tariff class lies between:
An upper bound, representing the stand-alone cost of serving the customers who belong to
that class; and
A lower bound, representing the avoidable cost of not serving those customers.
The Stand-alone and Avoidable cost methodologies are described in detail in Appendix F of this
Proposal. These approaches are used to calculate the revenues for each standard control services
tariff class associated with each cost methodology. These costs are compared with the weighted
average revenue derived from SA Power Networks’ proposed tariffs.
8.5.1 Definition of Stand-alone and Avoidable costs
These two categories of cost may be defined for tariff classes, as follows:
The Stand-alone cost for a tariff class is the cost of supplying only the tariff class
concerned, with all other tariff classes not being supplied. If customers were to pay above
the stand-alone cost then it would be economically beneficial for customers to switch to an
alternative provider, and economically feasible for an alternative provider to operate. This
creates the possibility of inefficient bypass of the existing infrastructure; and
The Avoidable cost for a tariff class is the reduction in network cost that would take place
if the tariff class were not supplied (whilst all other tariff classes remained supplied). If
customers were to be charged below the avoidable cost, it would be economically
beneficial for the business to stop supplying the customers and as the associated costs
would exceed the revenue obtained from the customer.
There are two alternative concepts that could be used to calculate these costs:
To ignore the sunk nature of the existing network and estimate the costs which would be
associated with an optimally designed network, constructed to supply standard control
services to the tariff class(es) concerned; or
To base the estimation of costs on the modification of the existing network to provide
standard control services to the tariff class(es) concerned
The Rules do not prescribe the methodology that should be used to calculate the Stand-alone and
Avoidable costs of tariff classes of the network. SA Power Networks has chosen to base its cost
estimations on the second concept, with hypothetical modification of the existing network, rather
than by devising and costing optimal new network structures. This has been done for two reasons:
To avoid the very substantial resource requirements that would be involved in a full
network redesign; and
In recognition that the economic regulatory framework for distribution supports the
SA Power Networks
SA Power Networks Pricing Proposal 2016/17 Page 84 of 110
existence and value of existing (sunk) network investments and does not support the
optimisation of existing networks.
The derivation of the stand-alone and avoidable cost for tariff classes uses a methodology based on
SA Power Networks’ cost of supply model. This model has been in use for a decade and was
formulated to permit the efficient allocation of network costs to tariff classes and the formulation of
network prices. The cost allocation model has been adapted to include the allocation of non system
costs to tariff classes.
This model is described in the following Sections. This approach was independently reviewed by
KPMG, and certified to be compliant with the Rules in 2010. The approach has not been altered
from that used in the 2010/11 Pricing Proposal and the sole change has been to index the outcomes
by CPI each year.
8.6 Stand-alone costs
The stand-alone cost for each tariff class was derived from an engineering estimate of the
proportions of the cost of providing network capacity that would need to remain in place to service
the load in each of the four tariff classes in turn if the other three tariff classes were no longer
required to be supplied.
The resulting cost allocation for each tariff class has been expressed in $/kVA, using the estimated
coincident contribution to SA Power Networks’ peak system demand and after adjustment for the
average power factor of the tariff class.
The detailed procedure used to calculate the stand-alone cost of tariff classes is set out in Appendix
F of this Pricing Proposal.
8.7 Avoidable costs
In similar manner to the stand-alone cost, the avoidable cost associated with each of the four tariff
classes were derived from an engineering estimate made of the network cost that could be avoided,
in the event that each of the four tariff classes were to be removed in turn.
As with the stand-alone cost, the avoidable network cost was expressed in $/kVA for each tariff
class. The procedure used to calculate the avoidable cost of tariff classes is also set out in Appendix
F of this Pricing Proposal.
8.8 Compliance with Rules clause 6.18.5(a)
The revenue expected to be recovered from each of SA Power Networks’ tariff classes in 2016/17 is
compared with the stand-alone and avoidable costs calculated in Sections 8.6 and 8.7 in Table 48.
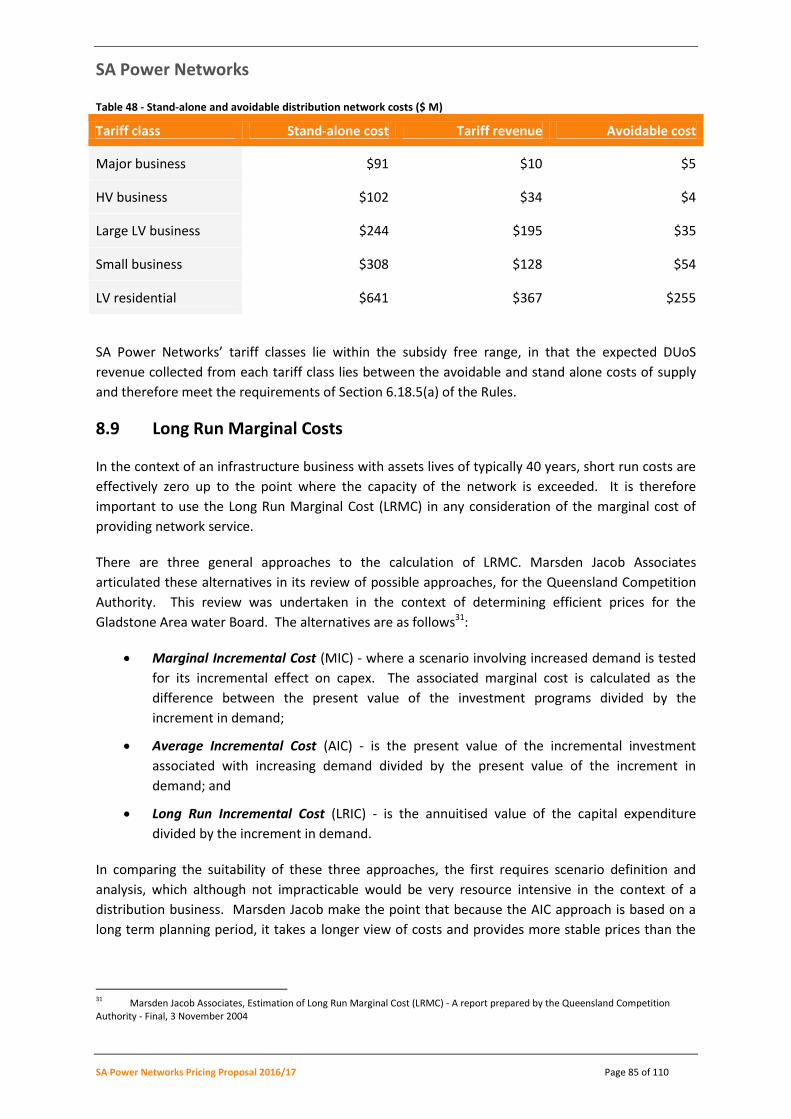
SA Power Networks
SA Power Networks Pricing Proposal 2016/17 Page 85 of 110
Table 48 - Stand-alone and avoidable distribution network costs ($ M)
Tariff class Stand-alone cost Tariff revenue Avoidable cost
Major business $91 $10 $5
HV business $102 $34 $4
Large LV business $244 $195 $35
Small business $308 $128 $54
LV residential $641 $367 $255
SA Power Networks’ tariff classes lie within the subsidy free range, in that the expected DUoS
revenue collected from each tariff class lies between the avoidable and stand alone costs of supply
and therefore meet the requirements of Section 6.18.5(a) of the Rules.
8.9 Long Run Marginal Costs
In the context of an infrastructure business with assets lives of typically 40 years, short run costs are
effectively zero up to the point where the capacity of the network is exceeded. It is therefore
important to use the Long Run Marginal Cost (LRMC) in any consideration of the marginal cost of
providing network service.
There are three general approaches to the calculation of LRMC. Marsden Jacob Associates
articulated these alternatives in its review of possible approaches, for the Queensland Competition
Authority. This review was undertaken in the context of determining efficient prices for the
Gladstone Area water Board. The alternatives are as follows31:
Marginal Incremental Cost (MIC) - where a scenario involving increased demand is tested
for its incremental effect on capex. The associated marginal cost is calculated as the
difference between the present value of the investment programs divided by the
increment in demand;
Average Incremental Cost (AIC) - is the present value of the incremental investment
associated with increasing demand divided by the present value of the increment in
demand; and
Long Run Incremental Cost (LRIC) - is the annuitised value of the capital expenditure
divided by the increment in demand.
In comparing the suitability of these three approaches, the first requires scenario definition and
analysis, which although not impracticable would be very resource intensive in the context of a
distribution business. Marsden Jacob make the point that because the AIC approach is based on a
long term planning period, it takes a longer view of costs and provides more stable prices than the
31 Marsden Jacob Associates, Estimation of Long Run Marginal Cost (LRMC) - A report prepared by the Queensland Competition Authority - Final, 3 November 2004
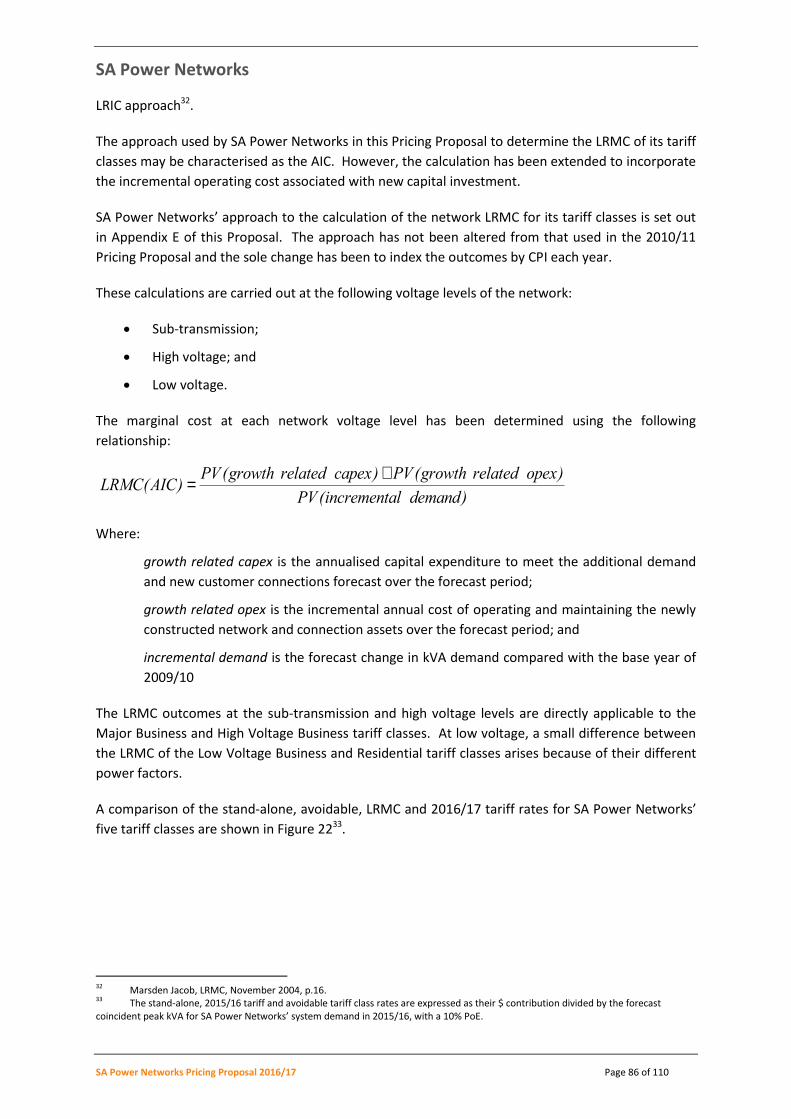
SA Power Networks
SA Power Networks Pricing Proposal 2016/17 Page 86 of 110
LRIC approach32.
The approach used by SA Power Networks in this Pricing Proposal to determine the LRMC of its tariff
classes may be characterised as the AIC. However, the calculation has been extended to incorporate
the incremental operating cost associated with new capital investment.
SA Power Networks’ approach to the calculation of the network LRMC for its tariff classes is set out
in Appendix E of this Proposal. The approach has not been altered from that used in the 2010/11
Pricing Proposal and the sole change has been to index the outcomes by CPI each year.
These calculations are carried out at the following voltage levels of the network:
Sub-transmission;
High voltage; and
Low voltage.
The marginal cost at each network voltage level has been determined using the following
relationship:
Where:
growth related capex is the annualised capital expenditure to meet the additional demand
and new customer connections forecast over the forecast period;
growth related opex is the incremental annual cost of operating and maintaining the newly
constructed network and connection assets over the forecast period; and
incremental demand is the forecast change in kVA demand compared with the base year of
2009/10
The LRMC outcomes at the sub-transmission and high voltage levels are directly applicable to the
Major Business and High Voltage Business tariff classes. At low voltage, a small difference between
the LRMC of the Low Voltage Business and Residential tariff classes arises because of their different
power factors.
A comparison of the stand-alone, avoidable, LRMC and 2016/17 tariff rates for SA Power Networks’
five tariff classes are shown in Figure 2233.
32 Marsden Jacob, LRMC, November 2004, p.16. 33 The stand-alone, 2015/16 tariff and avoidable tariff class rates are expressed as their $ contribution divided by the forecast coincident peak kVA for SA Power Networks’ system demand in 2015/16, with a 10% PoE.
LRMC(AIC) =PV(growth related capex) + PV(growth related opex)
PV(incremental demand)
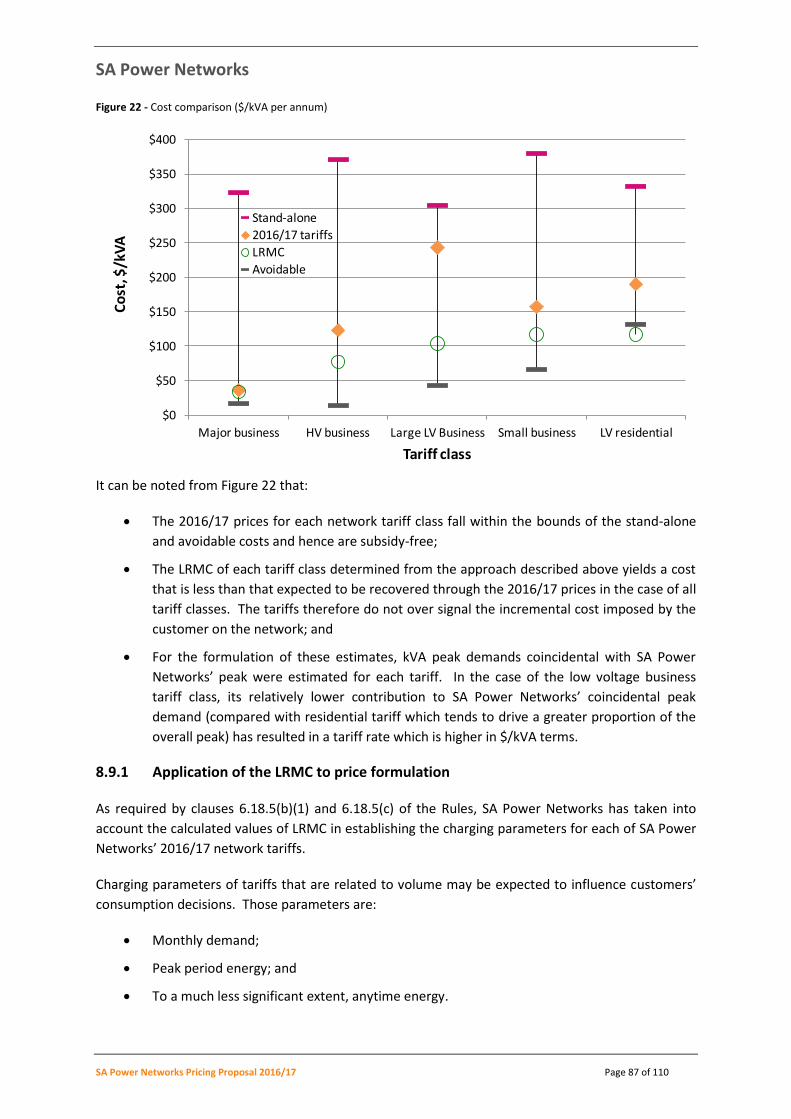
SA Power Networks
SA Power Networks Pricing Proposal 2016/17 Page 87 of 110
Figure 22 - Cost comparison ($/kVA per annum)
It can be noted from Figure 22 that:
The 2016/17 prices for each network tariff class fall within the bounds of the stand-alone
and avoidable costs and hence are subsidy-free;
The LRMC of each tariff class determined from the approach described above yields a cost
that is less than that expected to be recovered through the 2016/17 prices in the case of all
tariff classes. The tariffs therefore do not over signal the incremental cost imposed by the
customer on the network; and
For the formulation of these estimates, kVA peak demands coincidental with SA Power
Networks’ peak were estimated for each tariff. In the case of the low voltage business
tariff class, its relatively lower contribution to SA Power Networks’ coincidental peak
demand (compared with residential tariff which tends to drive a greater proportion of the
overall peak) has resulted in a tariff rate which is higher in $/kVA terms.
8.9.1 Application of the LRMC to price formulation
As required by clauses 6.18.5(b)(1) and 6.18.5(c) of the Rules, SA Power Networks has taken into
account the calculated values of LRMC in establishing the charging parameters for each of SA Power
Networks’ 2016/17 network tariffs.
Charging parameters of tariffs that are related to volume may be expected to influence customers’
consumption decisions. Those parameters are:
Monthly demand;
Peak period energy; and
To a much less significant extent, anytime energy.
$0
$50
$100
$150
$200
$250
$300
$350
$400
Major business HV business Large LV Business Small business LV residential
Co
st, $
/kV
A
Tariff class
Stand-alone
2016/17 tariffs
LRMC
Avoidable
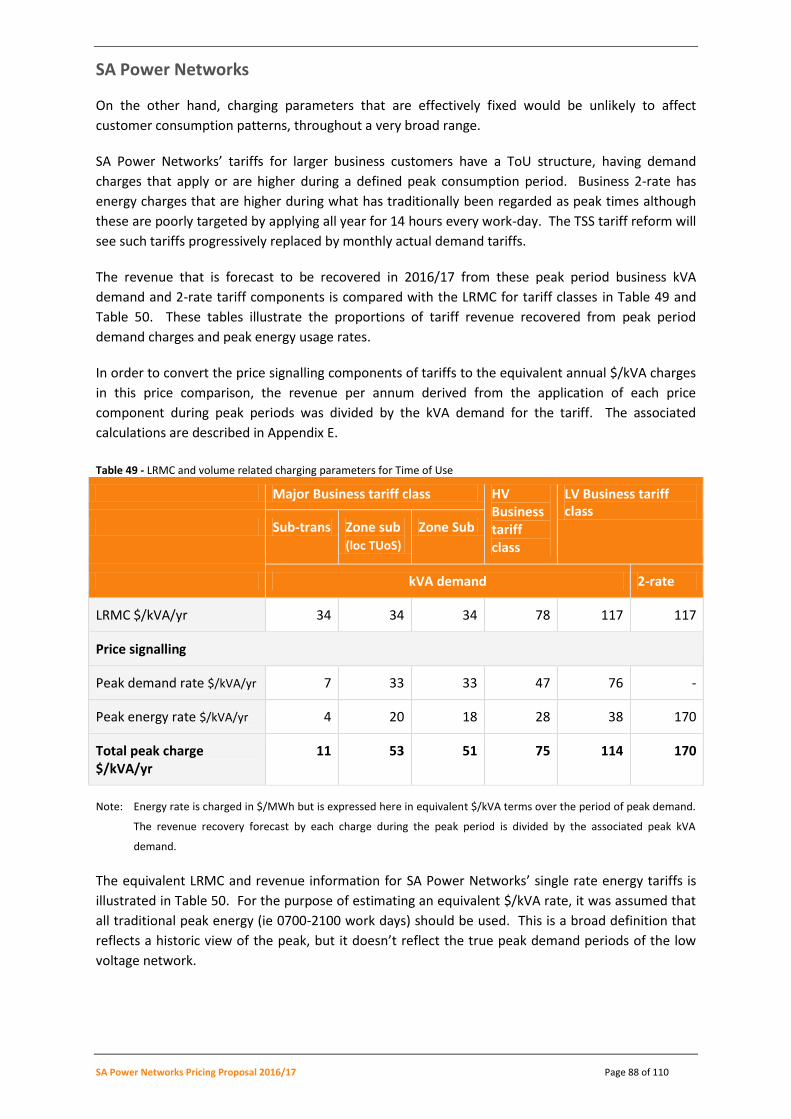
SA Power Networks
SA Power Networks Pricing Proposal 2016/17 Page 88 of 110
On the other hand, charging parameters that are effectively fixed would be unlikely to affect
customer consumption patterns, throughout a very broad range.
SA Power Networks’ tariffs for larger business customers have a ToU structure, having demand
charges that apply or are higher during a defined peak consumption period. Business 2-rate has
energy charges that are higher during what has traditionally been regarded as peak times although
these are poorly targeted by applying all year for 14 hours every work-day. The TSS tariff reform will
see such tariffs progressively replaced by monthly actual demand tariffs.
The revenue that is forecast to be recovered in 2016/17 from these peak period business kVA
demand and 2-rate tariff components is compared with the LRMC for tariff classes in Table 49 and
Table 50. These tables illustrate the proportions of tariff revenue recovered from peak period
demand charges and peak energy usage rates.
In order to convert the price signalling components of tariffs to the equivalent annual $/kVA charges
in this price comparison, the revenue per annum derived from the application of each price
component during peak periods was divided by the kVA demand for the tariff. The associated
calculations are described in Appendix E.
Table 49 - LRMC and volume related charging parameters for Time of Use
Major Business tariff class HV Business tariff class
LV Business tariff class
Sub-trans Zone sub (loc TUoS)
Zone Sub
kVA demand 2-rate
LRMC $/kVA/yr 34 34 34 78 117 117
Price signalling
Peak demand rate $/kVA/yr 7 33 33 47 76 -
Peak energy rate $/kVA/yr 4 20 18 28 38 170
Total peak charge $/kVA/yr
11 53 51 75 114 170
Note: Energy rate is charged in $/MWh but is expressed here in equivalent $/kVA terms over the period of peak demand.
The revenue recovery forecast by each charge during the peak period is divided by the associated peak kVA
demand.
The equivalent LRMC and revenue information for SA Power Networks’ single rate energy tariffs is
illustrated in Table 50. For the purpose of estimating an equivalent $/kVA rate, it was assumed that
all traditional peak energy (ie 0700-2100 work days) should be used. This is a broad definition that
reflects a historic view of the peak, but it doesn’t reflect the true peak demand periods of the low
voltage network.
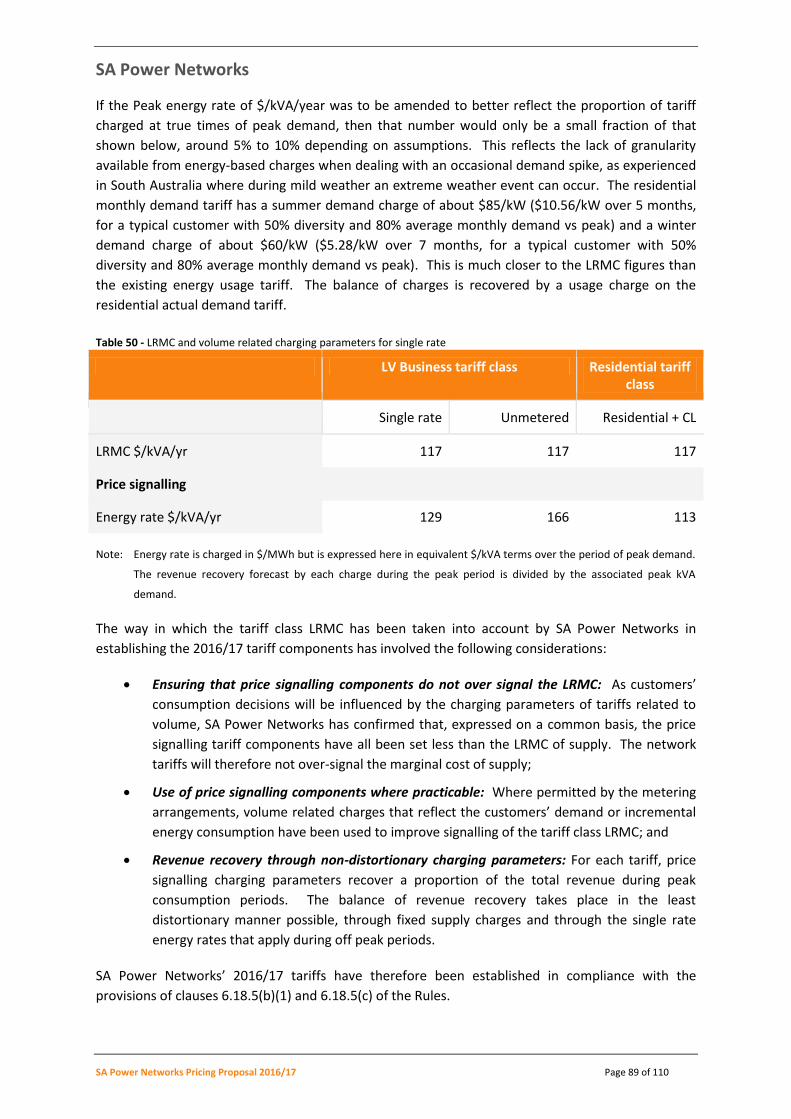
SA Power Networks
SA Power Networks Pricing Proposal 2016/17 Page 89 of 110
If the Peak energy rate of $/kVA/year was to be amended to better reflect the proportion of tariff
charged at true times of peak demand, then that number would only be a small fraction of that
shown below, around 5% to 10% depending on assumptions. This reflects the lack of granularity
available from energy-based charges when dealing with an occasional demand spike, as experienced
in South Australia where during mild weather an extreme weather event can occur. The residential
monthly demand tariff has a summer demand charge of about $85/kW ($10.56/kW over 5 months,
for a typical customer with 50% diversity and 80% average monthly demand vs peak) and a winter
demand charge of about $60/kW ($5.28/kW over 7 months, for a typical customer with 50%
diversity and 80% average monthly demand vs peak). This is much closer to the LRMC figures than
the existing energy usage tariff. The balance of charges is recovered by a usage charge on the
residential actual demand tariff.
Table 50 - LRMC and volume related charging parameters for single rate
LV Business tariff class Residential tariff class
Single rate Unmetered Residential + CL
LRMC $/kVA/yr 117 117 117
Price signalling
Energy rate $/kVA/yr 129 166 113
Note: Energy rate is charged in $/MWh but is expressed here in equivalent $/kVA terms over the period of peak demand.
The revenue recovery forecast by each charge during the peak period is divided by the associated peak kVA
demand.
The way in which the tariff class LRMC has been taken into account by SA Power Networks in
establishing the 2016/17 tariff components has involved the following considerations:
Ensuring that price signalling components do not over signal the LRMC: As customers’
consumption decisions will be influenced by the charging parameters of tariffs related to
volume, SA Power Networks has confirmed that, expressed on a common basis, the price
signalling tariff components have all been set less than the LRMC of supply. The network
tariffs will therefore not over-signal the marginal cost of supply;
Use of price signalling components where practicable: Where permitted by the metering
arrangements, volume related charges that reflect the customers’ demand or incremental
energy consumption have been used to improve signalling of the tariff class LRMC; and
Revenue recovery through non-distortionary charging parameters: For each tariff, price
signalling charging parameters recover a proportion of the total revenue during peak
consumption periods. The balance of revenue recovery takes place in the least
distortionary manner possible, through fixed supply charges and through the single rate
energy rates that apply during off peak periods.
SA Power Networks’ 2016/17 tariffs have therefore been established in compliance with the
provisions of clauses 6.18.5(b)(1) and 6.18.5(c) of the Rules.
SA Power Networks
SA Power Networks Pricing Proposal 2016/17 Page 90 of 110
8.10 Transaction costs
Clause 6.18.5(b)(2)(i) of the Rules requires SA Power Networks to have regard to the transaction
costs arising from its network tariffs, by limiting the complexity of tariff structures and the number
of charging parameters within each tariff. The charging parameters applicable to each tariff are
provided in Section 6 of this Pricing Proposal.
SA Power Networks has simplified the legacy tariffs (residential usage, controlled load, business
single and business 2-rate) and has also reduced the number of significant values in each tariff
element. This should reduce some transaction costs and improve the comprehension of these tariffs
by customers.
8.11 Customer response to price signals
SA Power Networks is required to have regard to the ability of customers to respond to the price
signals provided by its network tariffs, in accordance with clause 6.18.5(b)(2)(ii) of the Rules. The
efficiency gains of marginal cost pricing are realised when a tariff based on the marginal cost of
supply induces the customer to make behavioural change.
To the extent possible within the limitations imposed by network tariff structures and metering
constraints, SA Power Networks signals the long run marginal cost of supply through those tariff
charging parameters with the greatest price elasticity of demand, namely the variable consumption
charges that are based on the customers energy use and maximum demand.
In relation to the operation of clause 6.18.5(c) of the Rules, it is noted that SA Power Networks’
current estimate of LRMC falls near most of the price signalling charging parameters for most of the
tariff classes, as described in Section 8.9.
If the price signalling charging parameters alone (which were set taking into account the LRMC) were
used, the revenue for each tariff class would be insufficient to recover the expected revenue. The
revenue shortfall is recovered through the use of tariff components which would cause minimal
distortion in efficient patterns of consumption, namely:
Fixed charges; and
Anytime energy charges during off peak periods.
SA Power Networks is therefore compliant with this Rules provision. We will be undertaking further
analysis of our pricing structures as part of the Revised Tariff Structure Statement submission, due
for lodgement in September 2016. We will also be updating our calculations of LRMC for that
submission.
SA Power Networks
SA Power Networks Pricing Proposal 2016/17 Page 91 of 110
9 Distribution cost recovery tariffs
This Section sets out the procedures that SA Power Networks will follow to enable the recovery of
distribution related charges.
9.1 Regulatory Requirements
9.1.1 Rules requirements
SA Power Networks’ Pricing Proposal is required under clause 6.18.2(b) of the Rules to set out how
the DUoS charges it incurs are passed on to customers.
6.18.2 Pricing proposals
(b) A pricing proposal must:
(3) set out, for each proposed tariff, the charging parameters and the elements of
service to which each charging parameter relates; and
(4) set out, for each tariff class related to standard control services, the expected
weighted average revenue for the relevant regulatory year and also for the current
regulatory year; and
(5) set out the nature of any variation or adjustment to the tariff that could occur
during the course of the regulatory year and the basis on which it could occur; and
(6) set out how designated pricing proposal charges are to be passed on to
customers and any adjustments to tariffs resulting from over or under recovery of
those charges in the previous regulatory year; and
9.1.2 Requirements of the AER’s Decision
The AER requires SA Power Networks as part of its Pricing Proposal to provide the amounts for the
following entries in its DUoS unders and overs account for the most recently completed regulatory
year (t-2), the current regulatory year (t-1) and the next regulatory year (t)34:
1. opening balance for year t–2, year t–1 and year t;
2. an interest charge for one year on the opening balance for each regulatory year (t–2,
t–1 and t). These adjustments are to be calculated using the approved nominal WACC.
3. the amount of revenue recovered from DUoS charges in respect of that year, less the
total annual revenue for the year in question;
4. an adjustment to the net amount in item 3 by six months of interest. These
adjustments are to be calculated using the approved nominal WACC.
34 AER, Final Decision - South Australia distribution determination 2015–16 to 2019–20, October 2015, Attachment 14 – Control mechanisms pg 15.

SA Power Networks
SA Power Networks Pricing Proposal 2016/17 Page 92 of 110
5. the total of items 1–4 to derive the closing balance for each year.
In the Final Decision, the AER reiterated (in Attachment 14 A) the requirement for SA Power
Networks to maintain a DUoS unders and overs account in a specific format. The AER also requires
SA Power Networks to target a zero expected balance on its DUoS unders and overs account in each
Pricing Proposal.
9.2 Distribution use of system overs and unders account balance
In accordance with Attachment 14 A of the 2015-20 Final Decision, Table 51 provides the forecast 30
June 2016 balance of SA Power Networks’ distribution use of system overs and unders amounts. It is
close to zero at ($64,000) under-recovered.
Table 51 - Distribution overs and unders account balance ($’000)
Overs and unders account 2014/15 Actual
2015/16 Estimate
2016/17 Forecast
Revenue from distribution cost recovery (A) - 706,500 733,507
Less TAR components for regulatory year = - 682,000 759,584
+ Annual smoothed revenues (Art) - 682,000 759,584
+ DMIS carryover amount (It) - - -
+ Approved pass-throughs (Ct) - - -
OVERS AND UNDERS ACCOUNT
Annual rate of interest applicable to balances 9.76% 6.17% 6.19%
Opening balance - - 25,245
Interest on opening balance - - 1,563
(Under)/over recovery for financial year - 24,500 (26,077)
Interest on (under)/over recovery - 745 (795)
Closing balance - 25,245 (64)
SA Power Networks
SA Power Networks Pricing Proposal 2016/17 Page 93 of 110
10 Transmission cost recovery tariffs
This Section sets out the procedures that SA Power Networks will follow to enable the recovery of
transmission related charges, including any avoided TUoS charges paid to the embedded generators
connected to SA Power Networks’ distribution network.
ElectraNet is the Transmission Network Service Provider in South Australia and calculates location
specific transmission prices for the connection points to SA Power Networks’ network, in accordance
with the provisions of the Rules.
ElectraNet’s 2016/17 revenue will again be offset by some amount for revenue from settlement
residue auctions. ElectraNet has not advised the amount of discount that has been applied in tariffs.
ElectraNet provided its pricing advice for 2016/17 on 16 May 2016. Accordingly the prices in this APP
have been adjusted to meet the forecast transmission expense levels.
10.1 Regulatory Requirements
10.1.1 Rules requirements
SA Power Networks’ Pricing Proposal is required under clause 6.18.2(b) of the Rules to set out how
the TUoS charges it incurs are passed on to customers.
6.18.2 Pricing proposals
(b) A pricing proposal must:
(3) set out, for each proposed tariff, the charging parameters and the elements of
service to which each charging parameter relates; and
(6) set out how charges incurred by the Distribution Network Service Provider for
transmission use of system services are to be passed on to customers and any
adjustments to tariffs resulting from over or under recovery of those charges in
the previous regulatory year;
Clause 6.18.7 of the Rules sets out the requirement concerning the recovery of transmission related
charges by SA Power Networks.
6.18.7 Recovery of charges for transmission use of system services
(a) A pricing proposal must provide for tariffs designed to pass on to customers the
charges to be incurred by the Distribution Network Service Provider for transmission
use of system services.
(b) The amount to be passed on to customers for a particular regulatory year must not
exceed the estimated amount of the transmission use of system charges for the
relevant regulatory year adjusted for over or under recovery in the previous
regulatory year.
SA Power Networks
SA Power Networks Pricing Proposal 2016/17 Page 94 of 110
(c) The extent of the over or under recovery is the difference between:
(1) the amount actually paid by the Distribution Network Service Provider by way of
transmission use of system charges in the previous regulatory year; and
(2) the amount passed on to customers by way of transmission use of system charges
by the Distribution Network Service Provider in the previous regulatory year.
10.1.2 Requirements of the AER’s Decision
The AER requires SA Power Networks as part of its Pricing Proposal to provide the amounts for the
following entries in its TUoS unders and overs account for the most recently completed regulatory
year, the current regulatory year and the next regulatory year35:
1. Opening balance for each year.
2. Interest accrued on the opening balance for each year, calculated at the rate of the post–
tax nominal rate of return as approved by the AER in its distribution determination.
3. The amount of revenue recovered from TUOS charges applied in respect of that year, less
the amounts of all transmission related payments made by the DNSP in respect of that
year.
4. Six months interest on the net amount in item 3, accrued at the approved post–tax
nominal rate of return.
5. Summation of the above amounts to derive the closing balance for each year.
In the Final Decision, the AER reiterated (in Attachment 14 B) the requirement for SA Power
Networks to maintain a TUoS unders and overs account in a specific format. The AER also requires
SA Power Networks to target a zero expected balance on its TUoS unders and overs account in each
Pricing Proposal.
10.2 Transmission cost recovery tariff methodology
The key principles of SA Power Networks’ transmission cost recovery (TCR) tariff methodology are:
The total TUoS allocated to network tariffs aligns with the total estimated transmission
charge to be paid by SA Power Networks, adjusted for any overs and unders account
balance;
To the extent possible given the constraints of metering and tariff structures, transmission
charges are allocated to network tariffs in a manner that reflects the cost drivers present in
transmission pricing;
Customers with a demand of 10 MW or consumption in excess of 40 GWh have individually
calculated tariffs with transmission charges allocated in a manner that preserves the
location and time signals of transmission pricing in accordance with the principles in Part J
of Chapter 6A of the Rules; and
35 AER, Final Decision - South Australia distribution determination 2015–16 to 2019–20, October 2015, Attachment 14 – Control mechanisms pg 18.
SA Power Networks
SA Power Networks Pricing Proposal 2016/17 Page 95 of 110
Network tariffs for smaller customer classes have transmission charges allocated on an
energy basis, as location signals cannot be preserved. Small customers are assumed to
have a load factor better suited to using ElectraNet’s Non-locational energy prices than the
capacity-based price. Large business cost-reflective tariffs have costs allocated on a
capacity basis, but is then priced partly as demand and partly as energy. This ensures a
reasonable outcome across the large business tariff classes that do not receive an
individually calculated transmission price.
10.2.1 Avoided TUoS payments
With respect to avoided TUoS for embedded generators, SA Power Networks calculates the avoided
TUoS for all embedded generators that export to its distribution network at the same rates for the
locational component which would be applied to a load of similar size at the same connection point.
These calculations are prepared on a with/without basis.
This payment of avoided TUoS charges to embedded generators is as required under clauses 5.5(h),
5.5(i) and 5.5(j) of the Rules. These avoided TUoS payments to embedded generators would be
recouped through the recovery mechanism for the TUoS charges.
SA Power Networks proposes to make payments in 2015/16 and 2016/17 to the Adelaide-based
land-fill gas generators and to the Bordertown generator, but only to the extent that these
generators are providing network support or have historically reliable generation. These payments
will be at the TUoS locational price for the level of reliable generation.

SA Power Networks
SA Power Networks Pricing Proposal 2016/17 Page 96 of 110
10.3 Transmission use of system overs and unders account balance
In accordance with Attachment 14 B of the 2015-20 Final Decision, Table 52 provides the forecast 30
June 2016 balance of SA Power Networks’ transmission use of system overs and unders amounts. It
is close to zero.
Table 52 - Transmission overs and unders account balance ($’000)
Overs and unders account 2014/15 Actual
2015/16 Estimate
2016/17 Forecast
Revenue from transmission cost recovery 259,328 273,400 239,588
Transmission charges to be paid to TNSP 264,106 260,076 246,216
(Settlement residue payments) - - -
Avoided TUoS payments - 118 118
Inter-DNSP payment - - -
Total transmission related payments 264,106 260,194 246,334
OVERS AND UNDERS ACCOUNT
Annual rate of interest applicable to balances 9.76% 6.17% 6.19%
Opening balance (1,597) (6,759) 6,431
Interest on opening balance (156) (417) 398
Under/over recovery for financial year (4,779) 13,206 (6,746)
Interest on under/over recovery (228) 401 (206)
Closing balance (6,759) 6,431 (123)
Note: As a result of reducing the number of significant figures used in pricing, the June 2016 closing balance cannot be
predicted at $0. However, a forecast closing balance of ($0.044 M) under-recovered compared to forecast annual
recovery of $239,664 M is effectively a zero balance.
10.4 Charging parameters for transmission recovery tariffs
SA Power Networks’ transmission recovery tariffs are included in the bundled NUoS Rates of
customer tariffs. The charging parameters associated with transmission cost recovery tariffs are
shown in Sections 5.3 to 5.6, in Table 8 through to Table 21. For customers with a demand greater
than 10 MW or consumption in excess of 40 MWh the transmission cost recovery tariff is location
specific; for all other customers including small customers it is averaged.
Transmission cost recovery amounts are billed at the same frequency as the relevant tariff for
standard control services.
SA Power Networks
SA Power Networks Pricing Proposal 2016/17 Page 97 of 110
10.5 Transmission recovery tariffs for 2016/17
SA Power Networks’ 2016/17 recovery through transmission tariffs is forecast to decrease from an
estimated $273.4 M in 2015/16 to $239.6 M in 2016/17. This is a 12.4% decrease, which arises for
the following reasons:
The forecast $14 M decrease in annual ElectraNet charges. These result from either;
o Different revenues under their 2013-2018 Price Reset, and also the recovery of
approved MurrayLink revenue,
o any change in ‘discount’ and ‘surcharge’ in ElectraNet’s charges in 2016/17, due to
settlement residues and payments for interstate networks (new arrangements for
interstate networks charges have started in 2015/16); and
o The level of over/under-recovery by ElectraNet of the allowed annual revenue in
2016/17 versus 2015/16. ElectraNet endeavour to set their prices each year to
achieve a zero balance at the end of each year but variations in revenue recovery
and settlements residue occur every year.
Prices are likely to over-recover transmission costs by $13M.
The $7 M under -recovery in pricing required by SA Power Networks in 2016/17 to achieve
a near nil balance.
SA Power Networks has prepared prices for 2016/17 that recover ElectraNet’s charges. Prices for
locational customers are based on the ElectraNet price list.
All other customers have had prices applied on a State-wide non-locational basis, using the pricing
signals provided by ElectraNet, the billing parameters available for that customer segment and the
customer demand assumptions for that customer segment.
SA Power Networks
SA Power Networks Pricing Proposal 2016/17 Page 98 of 110
11 Recovery of the PV Jurisdictional Scheme Amount
The solar feed-in scheme is a South Australian Government initiative which commenced on 1 July
2008 and is to apply for 20 years. It was reviewed by the SA Government in 2009/10 and
amendments to the legislation took effect from 29 July 201136. The amendments to the legislation
introduced two further schemes – one which required application by September 2011 which also
applies till June 2028 and a further scheme for subsequent applications which applies till
September 2016. Entry to these schemes has now closed. Under the SA Government legislation, SA
Power Networks is obliged to make FiT payments to qualifying customers that have solar PV
generators, for energy they export to the grid.
The purpose for the PV Jurisdictional Scheme Amount is to allow SA Power Networks to recover
from all of its customers the cost of the SA Government legislated Feed-in Tariff payments that SA
Power Networks is required to make to those customers that have qualifying solar PV generators.
Under the Jurisdictional Scheme Amount arrangements, SA Power Networks is required to provide
information on the payments and recoveries of PV FiT in the same manner to that used for
transmission (see 10.1.2 above for these requirements). The AER has confirmed in the Final Decision
(Attachment 14 C) that these requirements continue. SA Power Networks recovers the PV JSA as an
additional component of its bundled NUoS charges.
The PV FiT JSO has historically been recovered as uniform percentage uplift across all customer
groups on each component of their DUoS charge. This resulted in a further charge for all customers
to recover the amounts incurred under the SA Government legislation.
This historic approach to the recovery of the PV FiT JSO had the following characteristics:
It was simple, and readily understood;
As it is scaled to the customer’s DUoS charge
o It did not unduly penalise high load factor commercial and industrial customers,
o It was applied to each and every customer, and
o Is represented equal treatment across tariff classes.
The approach did not take account that the primary beneficiary of this scheme was the 25% or so
residential customers eligible for the ‘44 cent’ schemes. Very few small businesses elected to
participate in these initial schemes and large customers were not permitted to access the schemes.
With the closure of the 2016 16 cent scheme imminent (30 September 2016), there will be a near
$30M reduction in annual costs. An approach which retains simplicity but revisits the fairness and
equity of the PV FiT allocation has been considered. In 2016/17, the amount of PV FiT charged to all
tariff classes will be reduced, but proportionally the reduction is larger for business tariff classes than
it is for residential. We will consult with customers on how we should price each tariff class in the
future as part of our revised TSS submission. In this Pricing Proposal, we have applied the tariff class
outcome broadly equally across all tariffs and elements within that tariff class.
36 Government of South Australia, Electricity (Feed-In Scheme—Solar Systems) Amendment Act 2008.
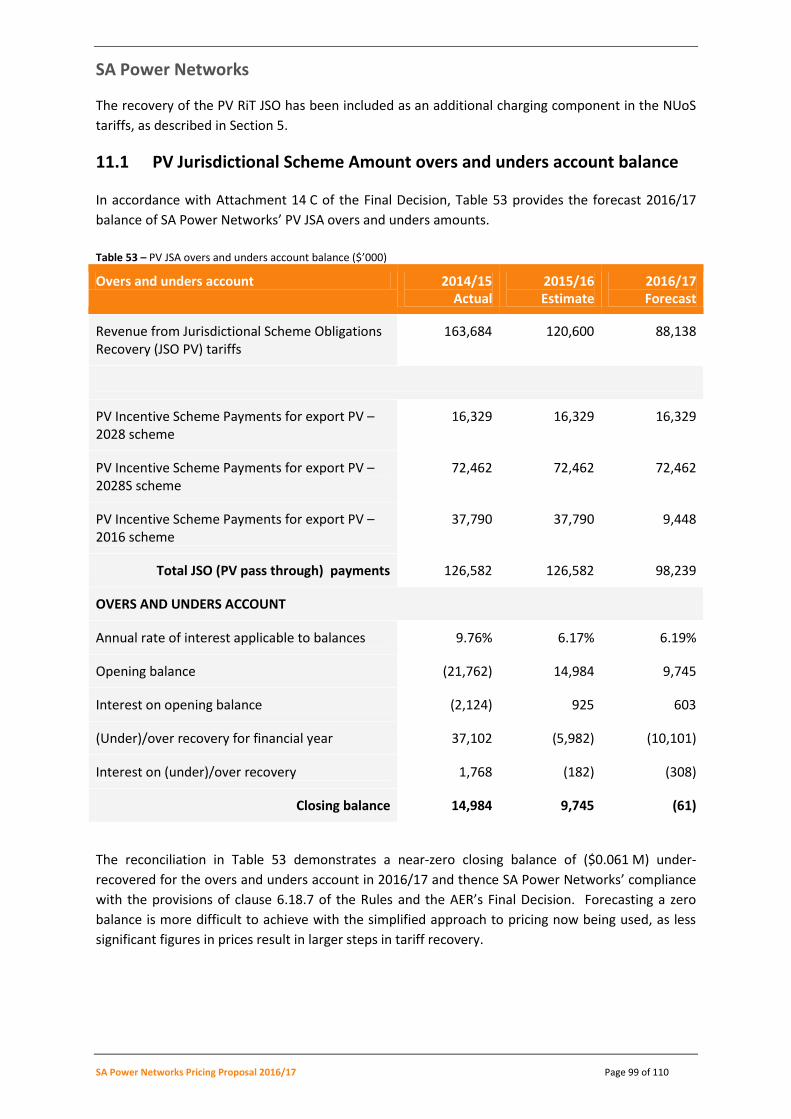
SA Power Networks
SA Power Networks Pricing Proposal 2016/17 Page 99 of 110
The recovery of the PV RiT JSO has been included as an additional charging component in the NUoS
tariffs, as described in Section 5.
11.1 PV Jurisdictional Scheme Amount overs and unders account balance
In accordance with Attachment 14 C of the Final Decision, Table 53 provides the forecast 2016/17
balance of SA Power Networks’ PV JSA overs and unders amounts.
Table 53 – PV JSA overs and unders account balance ($’000)
Overs and unders account 2014/15 Actual
2015/16 Estimate
2016/17 Forecast
Revenue from Jurisdictional Scheme Obligations Recovery (JSO PV) tariffs
163,684 120,600 88,138
PV Incentive Scheme Payments for export PV – 2028 scheme
16,329 16,329 16,329
PV Incentive Scheme Payments for export PV – 2028S scheme
72,462 72,462 72,462
PV Incentive Scheme Payments for export PV – 2016 scheme
37,790 37,790 9,448
Total JSO (PV pass through) payments 126,582 126,582 98,239
OVERS AND UNDERS ACCOUNT
Annual rate of interest applicable to balances 9.76% 6.17% 6.19%
Opening balance (21,762) 14,984 9,745
Interest on opening balance (2,124) 925 603
(Under)/over recovery for financial year 37,102 (5,982) (10,101)
Interest on (under)/over recovery 1,768 (182) (308)
Closing balance 14,984 9,745 (61)
The reconciliation in Table 53 demonstrates a near-zero closing balance of ($0.061 M) under-
recovered for the overs and unders account in 2016/17 and thence SA Power Networks’ compliance
with the provisions of clause 6.18.7 of the Rules and the AER’s Final Decision. Forecasting a zero
balance is more difficult to achieve with the simplified approach to pricing now being used, as less
significant figures in prices result in larger steps in tariff recovery.
SA Power Networks
SA Power Networks Pricing Proposal 2016/17 Page 100 of 110
11.2 Charging parameters for PV JSA cost recovery tariffs
SA Power Networks’ PV JSA cost recovery tariffs are included in the bundled NUoS Rates of customer
tariffs. The charging parameters associated with PV JSA cost recovery tariffs are shown in Sections
5.3 to 5.6, in Table 8 through to Table 21.
PV JSA cost recovery amounts are billed at the same frequency as the relevant tariff for standard
control services.
11.3 PV JSA cost recovery tariffs for 2016/17
SA Power Networks’ 2016/17 PV FiT JSO recovery tariffs are forecast to recover $88 M in 2016/17
($121M is estimated for 2015/16). This will recover three series of payments:
Payments under the original scheme (the ‘2028’ Scheme). This scheme closed to new
applicants in August 2010. Payments of $16.3 M are estimated for 2015/16 and forecast
for 2016/17;
Payments under the subsequent scheme (the ‘2028 Stepped’ Scheme). This scheme
opened to new applicants when the 2028 scheme closed, and required applications to be
approved by September 2011. The number of generators approved under this scheme is
much higher than under the 2028 scheme, and the size of the PV generation in each
installation is also much higher. As a result, payments under this scheme are significantly
higher, with estimated payments in 2015/16 of $72.5 M and forecast for 2016/17 .
Payments under the third scheme (the ‘2016’ Scheme). This scheme opened to new
applicants when the 2028 Stepped scheme closed, ie from 30 September 2011. Payments
are at the rate of 16 cents/kWh until September 2016, whereas the other two schemes
have payments at 44 cents/kWh for qualifying generation until June 2028. Applications
were at a high rate for this scheme, with the size of installation continuing to grow,
resulting in increasing levels of export. As a result, payments under this scheme are
significant despite the lower FiT rate of 16 cents/kWh. Estimated payments in 2015/16 are
$37.8 M and forecast payments in 2016/17 are $9.4 M before the scheme closes at 30
September 2016.
There is also an interest allowance for the timing of these cash flows, as shown in Table 53 above.

SA Power Networks
SA Power Networks Pricing Proposal 2016/17 Page 101 of 110
12 Customer tariff class assignment and reassignment
The requirements concerning the assignment and reassignment of customer to tariff classes are set
out in clause 6.18.4 of the Rules and Attachment 14 Appendix D of the AER’s Final Decision.
12.1 Regulatory Requirements
12.1.1 Rules requirements
In making a distribution determination, the AER is required to formulate provisions for the
assignment and reassignment of customers to tariff classes, in accordance with the principles set out
in clause 6.18.4 of the Rules. This Rule covers the following matters:
Factors governing the assignment of customers to tariff classes;
Equitable treatment of customers with micro-generation;
The review of the DNSP decision on tariff class assignment; and
The review of DNSPs’ tariff structures containing energy or demand related charges.
12.1.2 Requirements of the AER’s Decision
In accordance with the principles in clause 6.18.4 of the Rules, Attachment 14, Appendix D of the
AER’s decision sets out the procedures to apply to assigning or reassigning customers to tariff
classes37. These provisions are in several parts, covering the following aspects:
Assignment of existing retail customers to tariff classes at the commencement of the
forthcoming regulatory control period;
Assignment of new retail customers to a tariff class during the next regulatory control
period;
Reassignment of existing retail customers to another existing or a new tariff during the
next regulatory control period;
Objections to proposed assignments and reassignments; and
System of assessment and review of the basis on which a retail customer is charged.
Assignment of existing retail customers to a tariff classes at the commencement of the
forthcoming regulatory control period
1. SA Power Networks’ retail customers will be taken to be “assigned” to the tariff class to
which SA Power Networks was charging that retail customer immediately prior to 1 July
2015 if:
o they were an SA Power Networks retail customer prior to 1 July 2015
o they continue to be a retail customer of SA Power Networks as at 1 July 2015.
37 AER, Final Decision, October 2015, Attachment 14 pp. 21-23.
SA Power Networks
SA Power Networks Pricing Proposal 2016/17 Page 102 of 110
Assignment of new retail customers to a tariff class during the forthcoming regulatory control
period
2. If, after 1 July 2015, SA Power Networks becomes aware that a person will become a
customer, then SA Power Networks must determine the tariff class to which the new
customer will be assigned.
3. In determining the tariff class to which a retail customer or potential retail customer will
be assigned, or reassigned, in accordance with paragraph 2 or 5 of this section, SA
Power Networks must take into account one or more of the following factors:
(a) the nature and extent of the retail customer’s usage
(b) the nature of the retail customer’s connection to the network38
(c) whether remotely–read interval metering or other similar metering technology
has been installed at the retail customer’s premises as a result of a regulatory
obligation or requirement.
4. In addition to the requirements under paragraph 3 above, SA Power Networks, when
assigning or reassigning a retail customer to a tariff class, must ensure:
(a) retail customers with similar connection and usage profiles are treated equally
(b) retail customers who have micro–generation facilities are not treated less
favourably than retail customers with similar load profiles without such facilities.
Reassignment of existing retail customers to another existing or a new tariff during the next
regulatory control period
5. SA Power Networks may reassign a retail customer to another tariff class if the existing
retail customer’s load characteristics or connection characteristics (or both) have
changed such that it is no longer appropriate for that retail customer to be assigned to
the tariff class to which the retail customer is currently assigned or a retail customer no
longer has the same or materially similar load or connection characteristics as other
retail customers on the retail customer’s existing tariff class, then it may reassign that
retail customer to another tariff class. In determining the tariff class to which a retail
customer will be reassigned, SA Power Networks must take into account paragraphs 3
and 4 above.
Objections to proposed assignments and reassignments
6. SA Power Networks must notify a customer’s retailer in writing of the tariff class to
which the retail customer has been assigned or reassigned, prior to the assignment or
reassignment occurring.
7. A notice under paragraph 6 above must include advice informing the customer’s retailer
that they may request further information from SA Power Networks and that the retail
38 The AER interprets ‘nature’ to include the installation of any technology capable of supporting time based tariffs.
SA Power Networks
SA Power Networks Pricing Proposal 2016/17 Page 103 of 110
customer may object to the proposed reassignment. This notice must specifically
include:
a. a written document describing SA Power Networks’ internal procedures for
reviewing objections, if the customer’s retailer provides express consent, a soft
copy of such information may be provided via email
b. that if the objection is not resolved to the satisfaction of the customer’s retailer
under SA Power Networks’ internal review system within a reasonable
timeframe, then, to the extent that resolution of such disputes are within the
jurisdiction of the South Australian Energy Industry Ombudsman, or like officer,
the customer’s retailer is entitled to escalate the matter to such a body
c. that if the objection is not resolved to the satisfaction of the customer’s retailer
under SA Power Networks’ internal review system and the body noted in
clause7.b above, then the customer or its retailer is entitled to seek a decision of
the AER via the dispute resolution process available under Part 10 of the NEL.
8. If, in response to a notice issued in accordance with paragraph 7 above, SA Power
Networks receives a request for further information from a customer’s retailer, then it
must provide such information within a reasonable timeframe. If SA Power Networks
reasonably claims confidentiality over any of the information requested by the
customer’s retailer, then it is not required to provide that information to the customer’s
retailer. If the customer’s retailer disagrees with such confidentiality claims, he or she
may have resort to the dispute resolution procedures referred to in paragraph 7 (as
modified for a confidentiality dispute).
9. If, in response to a notice issued in accordance with paragraph 7 above, a customer’s
retailer makes an objection to SA Power Networks about the proposed assignment or
reassignment, SA Power Networks must reconsider the proposed assignment or
reassignment. In doing so SA Power Networks must take into consideration the factors
in paragraphs 3 and 4 above, and notify the customer’s retailer in writing of its decision
and the reasons for that decision.
10. If a customer’s retailer’s objection to a tariff assignment or reassignment is upheld by
the relevant body noted in paragraph 7.b and 7.c above, then any adjustment which
needs to be made to tariffs will be done by SA Power Networks as part of the next
annual review of prices.
11. If a customer’s retailer objects to SA Power Networks’ tariff class assignment SA Power
Networks must provide the information set out in paragraph 7 above and adopt and
comply with the arrangements set out in paragraph 8, 9 and 10 above in respect of
requests for further information by the customer’s retailer and resolution of the
objection.

SA Power Networks
SA Power Networks Pricing Proposal 2016/17 Page 104 of 110
12.2 Assignment of new customers to a tariff class during the next regulatory control period
The approach that SA Power Networks applies to the tariff assignment of new and upgraded
customer connections has been developed over the years since the formation of the NEM.
In this Section of the Pricing Proposal, SA Power Networks describes the process it applies to the
initial assignment of customers to tariffs and to their reassignment. Notwithstanding that the
individual tariffs have been grouped within tariff classes in this Pricing Proposal, the existing
approach to managing tariff assignment and reassignment is demonstrated to align with the
requirements established by the AER. Accordingly, no change is required to current practices.
The process whereby new customers are assigned to tariff classes and tariffs, following the receipt of
a connection application by the customer or their retailer, follows the decision tree shown in Figure
23. In the application of this process, a customer that lodges an application to modify or upgrade an
existing network connection is treated in the same manner as a new customer.
Figure 23 – Assignment of new and upgraded customer connections to tariff classes
This decision tree in Figure 23 highlights the existing process whereby customers are assigned to a
tariff class and then to an individual tariff. The process relies upon a systematic sequence of
decisions based on the information provided with the customer’s application for supply. Decisions
associated with assignment to the four tariff classes have been separately identified in red. Second-
order decisions on individual tariffs are also shown. These relate to type of meter, load size and
billing frequency, and lead to the customer’s assignment to a specific tariff within the tariff class.
MRSRIResidential
Subtransmission and HV
With cont. load QBSROPCL
Connectionapplication
HV kVA dem >10MW loct’l TUoSHV kVA demand Zone ZVSHV kVA demand VHVS
ST kVA demand loct’l TUoS
LV kVA demand VLVS2 rate B2R124BSR124With cont. load BSR124OPCL2 rate MB2RMBSRWith cont. load MBSROPCL
MRSRWith cont. load MRSROPCLCont. load only MOPCL
With cont. load MRSRCLICont. load only MOPCLI
Business
Type 1-4
Residential
Tariff Class and Tariff
QRSRWith cont. load QRSROPCLCont. load only QOPCL
2 rate QB2RQBSR
Monthly
Quarterly
VUU
Type 1-4
Monthly
Quarterly
LVUU24OUU
Type ofconsumption?
Tariff class assignment decision point
Tariff assignment decision point
Key:
Type ofmeter?
Size ofload?
Type ofmeter?
Usagepattern
Unmetered
LV Business
Size ofload?
Type 5,6 Billfreq.?
High Voltagezone
High VoltageNetwork
Subtransmission
Unmetered
LowVoltage
Type 5,6
Connection voltage &location?
Billfreq.?

SA Power Networks
SA Power Networks Pricing Proposal 2016/17 Page 105 of 110
The two major decisions that determine the tariff class assessment are as follows:
The nature of a customer’s usage: (ie residential, business, or unmetered); and
For business customers only, the nature and extent of the associated connection to the
network (the connection voltage, whether located within in the network or directly
connected to a zone substation).
The process employed by SA Power Networks therefore appropriately takes account the factors in
clause 3(a) and 3(b) of the AER’s Appendix D39.
Moreover, in the event that remotely–read interval metering or other similar metering technology is
installed at the customer’s premises as a result of a regulatory obligation or requirement during the
2015-20 regulatory control period, SA Power Networks will review this procedure.
12.2.1 Customers with micro-generation
As SA Power Networks’ tariff class assignment process is applied to the net customer demand on the
network, it does not distinguish between customers that have micro-generation and those without.
The only aspects of the connection process that distinguish customers with micro-generation are
technical requirements, principally to ensure public and employee safety in the event of
disconnection of supply to a site with generation.
SA Power Networks’ tariff assignment process therefore ensures that the requirements in clause 4(a)
and 4(b) of the AER’s Appendix D40 are met.
12.3 Reassignment of existing customers to another existing or a new tariff during the next regulatory control period
Within each tariff class, there has been and will continue to be movement between individual tariffs.
This is particularly the case with the customers on the Low Voltage Business tariff class
The five tariff classes that SA Power Networks has established are sufficiently broad to ensure that
all the existing customers are within the appropriate tariff class and that it is unlikely that customers
will seek to migrate or be reclassified to a different tariff class during the course of the
determination. Transfer between tariff classes would be limited to circumstances where the nature
of usage or level of consumption changed significantly, for example where a residence was
redeveloped to become a small business such as a medical surgery or office.
Notwithstanding that the reassignment of customers’ tariff classes is unlikely during the 2015-20
regulatory control period, SA Power Networks would do so in accordance with the provisions of the
AER’s Decision.
SA Power Networks follows the same processes for customers being reassigned to another tariff
within a tariff class as would apply to customers being reassigned to another tariff class. Customers
39 AER, Final Decision, October 2015, Attachment 14 pp. 22. 40 AER, Final Decision, October 2015, Attachment 14 pp. 22.
SA Power Networks
SA Power Networks Pricing Proposal 2016/17 Page 106 of 110
are able to object to such reassignments in the same manner that they are permitted to object to a
tariff class reassignment.
12.4 Objections to proposed assignments and reassignments
The AER has established requirements that SA Power Networks must follow in assigning or
reassigning customers to tariff classes and in responding to objections to SA Power Networks’ tariff
class assignments.
The requirements that SA Power Networks must follow have been documented in an internal
procedure entitled ”Manual 18, Network Tariff Manual”.
This document is attached as to this Pricing Proposal as Appendix K and is published on SA Power
Networks’ web site.
SA Power Networks
SA Power Networks Pricing Proposal 2016/17 Page 107 of 110
13 Alternative Control Services – metering services
In the Final Decision, the AER has determined a price cap for Alternative Control Services (metering
services). Attachment 16 sets out all of the pricing arrangements and the final prices that will apply.
Part A of Attachment 16 sets out the annual metering charges (AER Table 16.11) and the upfront
capital charges (AER Table 16.14, with annual X-factors set out in AER Table 16.15).
The annual metering charges contain a Capital and a non-Capital charge, with different prices
applying to the three categories of alternative control services metering, ie WC, CT and Exceptional
meters.
There are four different combinations of metering fees possible:
Existing customers using SA Power Networks’ meters. These customers continue to pay the
capital and non-Capital charges.
Where an existing customer at June 2015 has the meter replaced by an alternate meter
provider eg a type 4 meter, the customer will continue to pay the Capital-related charge, but
will cease paying the non-Capital related charge.
Where a new customer connects to the network and elects to use an SA Power Networks
meter, the customer incurs an upfront capital charge, and also incurs the annual non-Capital
charge. The customer is not liable for any ongoing capital charges.
Where an existing customer at June 2015 was not using an SA Power Networks meter but
that of an alternate meter provider, eg a type 4 meter, the customer is not liable for any
annual metering charges to SA Power Networks.
We have implemented the AER’s preferred system of meter service pricing. We have implemented a
new meter charging system which can be separated from the standard control services tariffs. We
will use separate, more manual systems to manage the exceptional and CT metering pricing, as
occurs at present. We also use a separate manual process to manage the pricing where an existing
customer’s meter churns to another meter provider.
Table 54 sets out the tariffs that correspond to the price terms contained in the alternative control
services metering services in 2015/16 and 2016/17. The table shows the change in price outcome
for those customers who use a type 5-6 WC meter. This is the overwhelming majority of our
customers today.
Table 54 and Table 55 show the annual metering charges that apply in 2016/17.
Table 54 – Alternative Control Services – Annual metering charges (excludes GST) $ p.a.
Tariff Non-capital only
Capital only Non-capital and capital
Type 1-4 ‘exceptional’ remotely read 185.16 215.83 400.99
Type 5-6 CT connected, manually read 100.79 117.48 218.27
Type 5-6 WC manually read 12.31 14.35 26.66
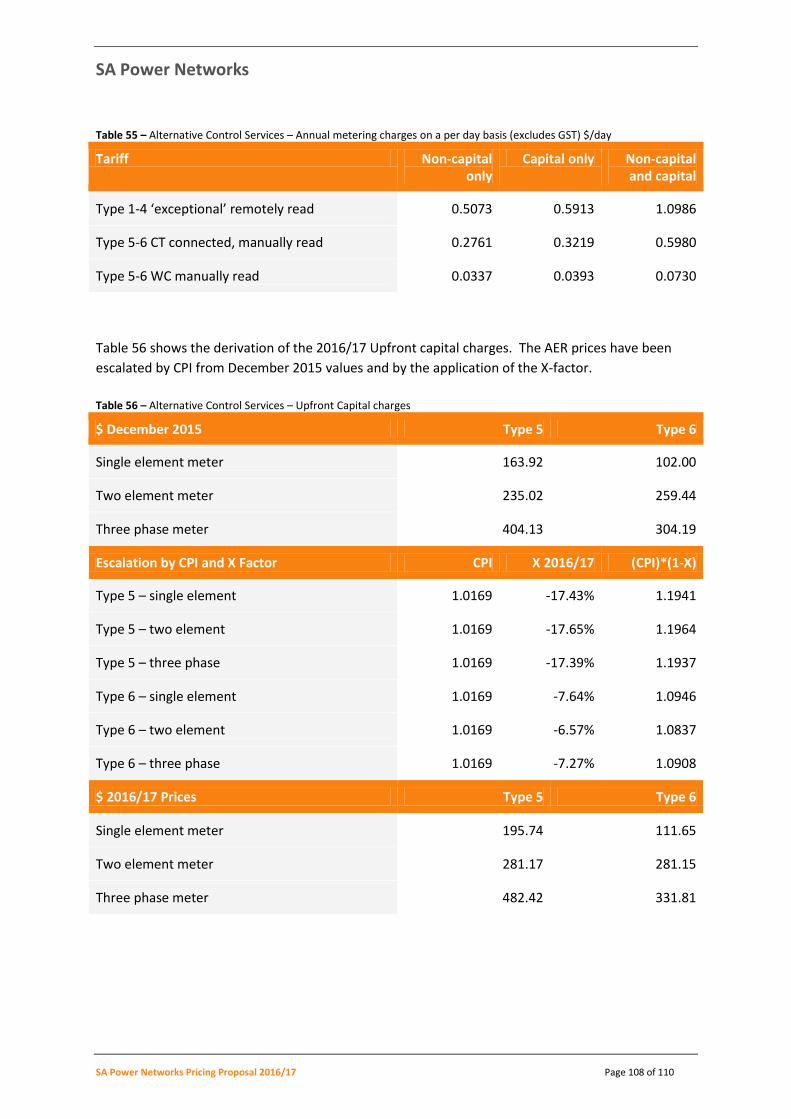
SA Power Networks
SA Power Networks Pricing Proposal 2016/17 Page 108 of 110
Table 55 – Alternative Control Services – Annual metering charges on a per day basis (excludes GST) $/day
Tariff Non-capital only
Capital only Non-capital and capital
Type 1-4 ‘exceptional’ remotely read 0.5073 0.5913 1.0986
Type 5-6 CT connected, manually read 0.2761 0.3219 0.5980
Type 5-6 WC manually read 0.0337 0.0393 0.0730
Table 56 shows the derivation of the 2016/17 Upfront capital charges. The AER prices have been
escalated by CPI from December 2015 values and by the application of the X-factor.
Table 56 – Alternative Control Services – Upfront Capital charges
$ December 2015 Type 5 Type 6
Single element meter 163.92 102.00
Two element meter 235.02 259.44
Three phase meter 404.13 304.19
Escalation by CPI and X Factor CPI X 2016/17 (CPI)*(1-X)
Type 5 – single element 1.0169 -17.43% 1.1941
Type 5 – two element 1.0169 -17.65% 1.1964
Type 5 – three phase 1.0169 -17.39% 1.1937
Type 6 – single element 1.0169 -7.64% 1.0946
Type 6 – two element 1.0169 -6.57% 1.0837
Type 6 – three phase 1.0169 -7.27% 1.0908
$ 2016/17 Prices Type 5 Type 6
Single element meter 195.74 111.65
Two element meter 281.17 281.15
Three phase meter 482.42 331.81
SA Power Networks
SA Power Networks Pricing Proposal 2016/17 Page 109 of 110
Appendices
Appendix A. Network Use of System Tariffs and explanatory notes
Appendix B. CONFIDENTIAL – Audit of 2014/15 quantities
Appendix C. S-Factor calculation
Appendix D. Transmission Prices from ElectraNet – 2016/17 TUoS prices
Appendix E. Long Run Marginal Cost Methodology
Appendix F. Stand-alone and Avoided Cost Methodologies
Appendix G. CONFIDENTIAL – Revenue and Price Compliance Model (standard control)
Appendix H. Not used
Appendix I. Not used
Appendix J. SA Power Networks’ procedure for assigning and reassigning customers to tariff
classes (Tariff Manual)
Appendix K. SA Power Networks’ Regulatory Compliance Checklist