primary crystal nucleation and growth regime … 37 38 39 40 41 42 43 44 45 introduction...
TRANSCRIPT

Primary Crystal Nucleation and Growth Regime Transitionin Isotactic Polypropylene
Annamaria Celli,* Edgar D. Zanotto, and Isak Avramov#
Vitreous Materials Laboratory—LaMaV, Department of Materials
Engineering—DEMa, Federal University of Sao Carlos—Ufscar,
Sao Carlos-SP, Brazil
ABSTRACT
We studied nucleation and crystal growth in two polypropylene samples by analyzing
the number of spherulites, their size, and shape for various treatments in a hot-stage
microscope. The consistency of nucleation and growth data were tested by using
overall crystallization experiments and the Jonhson–Mehl–Avrami–KolmogorovQ1
equation. In isothermal conditions, for temperatures, TC, varying between 1238 and
1388C, the number of crystallites per unit area does not depend on crystallization time
and temperature. Instead, at small undercoolings (for TC . 1388C), the total number of
nuclei per unit area remains independent of crystallization time, but decreases with
increasing temperature. We discuss the implications of this finding for the final
microstructure of the crystallized samples. It is noteworthy that the passage between
these two nucleation behaviors coincides with the transition from regime III to regime
II, observed in the crystal growth kinetic analysis. This remarkable correlation between
primary nucleation and crystal growth regimes is discussed.
Key Words: Primary nucleation; Crystal growth; Regime transition; Crystallization;
Isotactic polypropylene.
387
DOI: 10.1081/MB-120017126 0022-2348 (Print); 1525-609X (Online)
Copyright q 2003 by Marcel Dekker, Inc. www.dekker.com
*Correspondence: Annamaria Celli, Department of Applied Chemistry and Materials Science,
University of Bologna, Viale Risorgimento 2, 40136 Bologna, Italy; E-mail: annamaria.celli@
mail.ing.unibo.it.#Current address: Institute of Physical Chemistry, Bulg. Acad. Sci., 1113 Sofia, Bulgaria.
120017126_MB_042_002_R1_X0.ald 8/1/2003—KALYAN—59029
JOURNAL OF MACROMOLECULAR SCIENCEw
Part B—PhysicsVol. 42, No. 2, pp. 387–401, 2003
1
2
3
4
5
6
7
8
9
10
11
12
13
14
15
16
17
18
19
20
21
22
23
24
25
26
27
28
29
30
31
32
33
34
35
36
37
38
39
40
41
42
43
44
45

INTRODUCTION
Crystallization controls the final microstructure and, consequently, the properties and
applications of semicrystalline polymers. Although crystal growth and overall crystal-
lization kinetics of a plethora of polymers have been extensively analyzed, nucleation
studies are rare. The reason for the paucity of nucleation studies is the difficulty in
obtaining reliable experimental data through the most common thermal analysis
techniques. In fact, nucleation occurring in viscous liquids, cooled from the melting point,
cannot be detected by differential scanning calorimetry (DSC) due to the small quantity of
heat involved, and cannot be directly observed by optical microscopy because of the small
size of the nuclei. Moreover, measurements of hot-stage light depolarization (HSLD)
microscopy do not reveal the first stages of crystallization. Owing to the low sensitivity of
these experimental techniques, results obtained by thermal analyses may be erroneously
evaluated. Only recently have a few studies on nucleation been carried out using other
experimental approaches [e.g., by small- and wide-angle X-ray scattering (SAXS and
WAXS)],[1 – 3] atomic force microscopy,[4] small-angle light scattering,[5] and coupled
SAXS and FTIR analyses.[6] On the other hand, in view of the difficulties involved in
obtaining significant experimental data, theoretical evaluations of nucleation, based on
thermodynamic and kinetic considerations, have also been reported.[7]
In this article, a large effort has been made to obtain significant quantitative data of the
nucleation process by using a classical thermal analysis technique—hot-stage optical
microscopy—and by carefully observing the effects of nucleation on the resulting
microstructures, in particular on the number, size, and shape of spherulites. These data
were completed by crystal growth measurements and overall crystallization studies with
light depolarization microscopy and DSC analyses. The first objective of this article is to
verify the consistency of the nucleation and growth data obtained by the classical thermal
analysis techniques. After this important test, meaningful nucleation and growth rate data
were available to study the primary and secondary nucleation processes and their possible
connections. For the first time, a remarkable correlation between primary nucleation and
the well-known crystallization regimes proposed by Hoffman et al.[8] was observed. If
confirmed in other polymers, this result should be particularly interesting for the
comprehension of crystallization processes in macromolecules.
EXPERIMENTAL
Two isotactic polypropylene (PP) homopolymers[9] produced by Montell (Ferrara,
Italy) were analyzed. Specimen A is characterized by intrinsic viscosity ½h� ¼
3:48 dL g21; Mw ¼ 947; 000; Mw=Mn ¼ 8:7; and isotactic index ¼ 96.5%, determined
by nuclear magnetic resonance triads. Sample B is characterized by ½h� ¼ 0:66 dL g21;Mw ¼ 129; 000; Mw=Mn ¼ 11; and isotactic index ¼ 97%. The addition of 1,600 ppm per
weight of a mixture of Irganox 1010 and Irgafos 168 stabilized the specimens in a 1:2 ratio.
Crystallization studies were performed under nitrogen flux in a Leitz polarizing
microscope (Labor Lux S) equipped with a Linkam TMHS 600 hot-stage camera and
video camera. This experimental apparatus will be designated HSG in the following
120017126_MB_042_002_R1_X0.ald 8/1/2003—KALYAN—59029
Celli, Zanotto, and Avramov388
46
47
48
49
50
51
52
53
54
55
56
57
58
59
60
61
62
63
64
65
66
67
68
69
70
71
72
73
74
75
76
77
78
79
80
81
82
83
84
85
86
87
88
89
90

sections. The calibration of the hot stage was checked by common standards at a heating
rate of 28C/min. The reproducibility and stability of the hot stage were verified by
comparing the kinetic results of different growth cycles.
Cast films, 20mm thick, were obtained from solutions of PP in o-xylene. The films
were heated at 108C/min to the temperature TF ¼ 2008C; above the equilibrium melting
point, kept at this temperature for 5 min, cooled at ,808C/min to the selected
crystallization temperature, TC, and kept at TC for sufficiently long times for significant
crystallization. This thermal treatment is represented in Fig. 1. The fast cooling from TF toF1
TC was obtained by a cold nitrogen flux inside the hot stage: the effective rate, at which the
sample reaches TC, slightly varied for each experiment depending on the undercooling.
The 808C/min represents a good compromise between the highest attainable cooling rate
and the absence of overshooting, as verified by a thermocouple inserted inside the hot-
stage apparatus. The TC range analyzed varied from 1238 to 1508C for both samples. At
these crystallization temperatures, the slow rate of crystallization allows one to easily
follow the spherulitic growth. At each TC, numerous micrographs were taken at different
times (tC), whereas the sample was crystallizing, and the average numbers of spherulites
per unit area were counted as a function of tC. The number of spherulites was assumed to
correspond to the number of stable nuclei per unit area (NS) grown in the melt. The
spherulitic radii (r ) were measured with a grilled system in the video before crystal
impingement. The growth rate (G ) was calculated from the slope of the straight line
obtained from r vs. tC plots.
Overall, crystallization experiments were performed by HSLD and DSC. The
evolution of crystallization was followed by continuous measurements of the light
depolarization signal as a function of time. Measurements were carried out in an Orthoplan
polarizing microscope, equipped with a Mettler FP52 heating device, coupled with a
photosensitive diode in the eyepiece. Crystallization experiments of bulk specimens were
conducted under nitrogen flux in a Perkin–Elmer DSC-7 instrument, using 10–20 mg ofQ2
iso-PP. The temperature scale of DSC was calibrated with high purity standards. For both
Figure 1. Scheme of the thermal treatments in HSG for samples A and B.
120017126_MB_042_002_R1_X0.ald 8/1/2003—KALYAN—59029
Crystal Nucleation and Growth in Polypropylene 389
91
92
93
94
95
96
97
98
99
100
101
102
103
104
105
106
107
108
109
110
111
112
113
114
115
116
117
118
119
120
121
122
123
124
125
126
127
128
129
130
131
132
133
134
135

HSLD and DSC, the experimental procedure consisted of melting at 2008C for 5 min, fast
cooling at 808C/min to TC, isothermal crystallization at TC, followed by reheating from TC
to 2008C at 108C/min. The TC range over which data could be collected was limited to
120–1358C, due to the instrument’s sensitivity. In fact, at TC below 1208C, it was not
possible to obtain a stable signal output before changes in light depolarization signal and in
heat flow, owing to the rapid crystallization. At TC above 1358C, crystallization was too
slow to obtain a significant variation of the baseline. The equilibrium melting temperatures
(Tm8) were determined by extrapolation of the melting temperatures, measured in DSC
thermograms, with respect to the crystallization temperatures TC, according to the
Hoffman–Weeks procedure.[10] It is reported that significant Tm8 data are obtained if the
lamellar thickness is small, defined, and maintained at each TC, and that these conditions
can be verified if the slope of the Tm vs. TC plot is equal to 0.5.[11] Then, the crystallization
conditions, used to determine Tm8; were adequately chosen, mainly in terms of short
crystallization times, to obtain a Tm vs. TC slope very close to 0.5. The resulting Tm8 values
are 184.58C for PP-A and 178.98C for PP-B. The reported Tm8 of iso-PP are somewhat
uncertain: the values of Tm8 obtained by extrapolation of Tm ¼ f ðTCÞ curves fall into two
groups, one around 1868C and the other around 2108C, and strongly depend on the TC
range analyzed. Mezghani et al.[12] discuss about this uncertainty in terms of lamellar
thickening occurring during the isothermal crystallization: by combined SAXS, DSC, and
HSLD measurements, they determine a Tm8 value for iso-PP close to 1868C. Also, other
papers that are focused on the study of the transition regimes in iso-PP report similar
results.[13,14] Therefore, the Tm8 values obtained for samples A and B agree with significant
literature data.
Wide-angle X-ray scattering analysis was performed on samples isothermally
crystallized in DSC and then fast-cooled to room temperature. The PP a-phase was the
polymorphic form crystallized in the TC range analyzed for both samples.
RESULTS AND DISCUSSION
Crystal Nucleation
The nucleation process was studied by observing the crystallization under isothermal
conditions using HSG equipment. In both samples A and B and in all the crystallization
experiments, some small circular particles grow as a-spherulites. By counting them in
photographs taken at different tC, their number remains constant from their appearance to
full growth. Then, the nucleation process in both samples shows no time dependence and
occurs from a limited number of pre-existing sites on the sample surfaces, as observed for
many polymers, including iso-PP (e.g., Refs.[15 – 18]). The predetermined nuclei present in
the melt can be either heterogeneous sites, formed by foreign particles, such as catalysts,
additives, or impurities, or athermal nuclei, due to crystal fragments left from uncompleted
melting. In this latter case, the number of nuclei is strictly dependent on the thermal
T1
history.[19 – 21] It has been reported that only at very large undercoolings, for TC lower than
808C, homogeneous nucleation becomes predominant in iso-PP.[22]
From the micrographs, it was possible to count the number of spherulites per unit
area (NS) characteristic of each TC. These values are reported in Table 1, with
120017126_MB_042_002_R1_X0.ald 8/1/2003—KALYAN—59029
Celli, Zanotto, and Avramov390
136
137
138
139
140
141
142
143
144
145
146
147
148
149
150
151
152
153
154
155
156
157
158
159
160
161
162
163
164
165
166
167
168
169
170
171
172
173
174
175
176
177
178
179
180
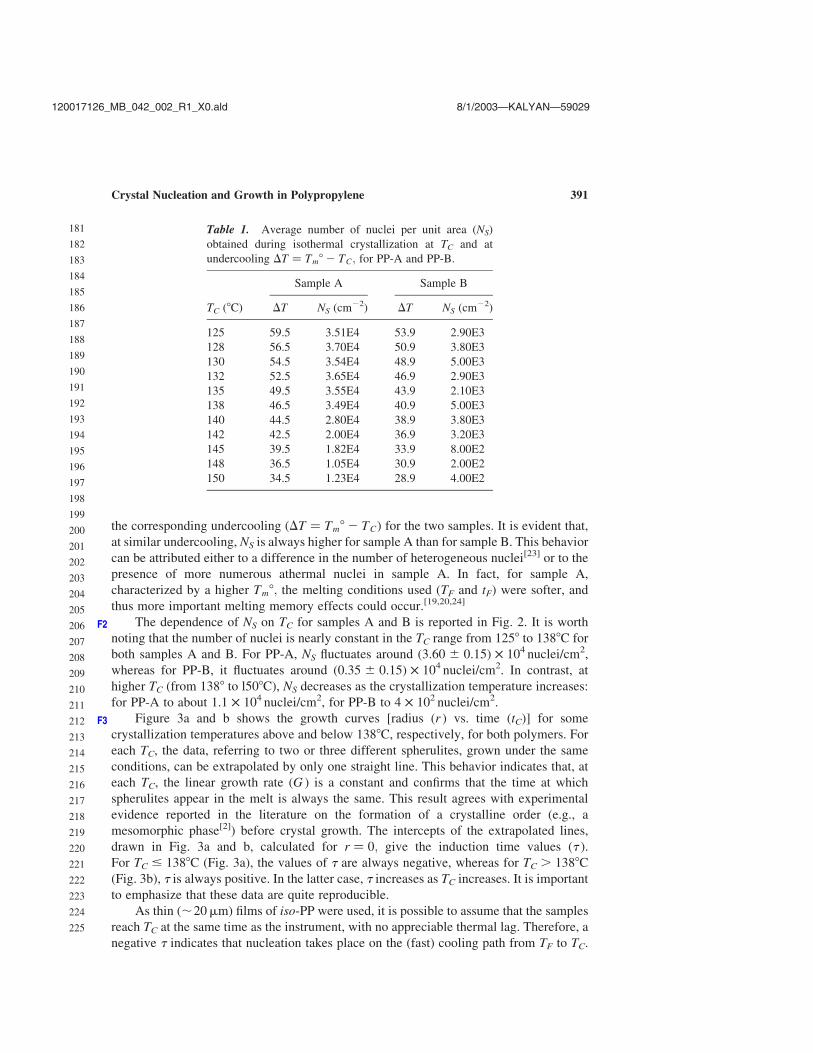
the corresponding undercooling ðDT ¼ Tm8 2 TCÞ for the two samples. It is evident that,
at similar undercooling, NS is always higher for sample A than for sample B. This behavior
can be attributed either to a difference in the number of heterogeneous nuclei[23] or to the
presence of more numerous athermal nuclei in sample A. In fact, for sample A,
characterized by a higher Tm8; the melting conditions used (TF and tF) were softer, and
thus more important melting memory effects could occur.[19,20,24]
The dependence of NS on TC for samples A and B is reported in Fig. 2. It is worthF2
noting that the number of nuclei is nearly constant in the TC range from 1258 to 1388C for
both samples A and B. For PP-A, NS fluctuates around (3.60 ^ 0.15) £ 104 nuclei/cm2,
whereas for PP-B, it fluctuates around (0.35 ^ 0.15) £ 104 nuclei/cm2. In contrast, at
higher TC (from 1388 to l508C), NS decreases as the crystallization temperature increases:
for PP-A to about 1.1 £ 104 nuclei/cm2, for PP-B to 4 £ 102 nuclei/cm2.
Figure 3a and b shows the growth curves [radius (r ) vs. time (tC)] for someF3
crystallization temperatures above and below 1388C, respectively, for both polymers. For
each TC, the data, referring to two or three different spherulites, grown under the same
conditions, can be extrapolated by only one straight line. This behavior indicates that, at
each TC, the linear growth rate (G ) is a constant and confirms that the time at which
spherulites appear in the melt is always the same. This result agrees with experimental
evidence reported in the literature on the formation of a crystalline order (e.g., a
mesomorphic phase[2]) before crystal growth. The intercepts of the extrapolated lines,
drawn in Fig. 3a and b, calculated for r ¼ 0; give the induction time values (t ).
For TC # 1388C (Fig. 3a), the values of t are always negative, whereas for TC . 1388C
(Fig. 3b), t is always positive. In the latter case, t increases as TC increases. It is important
to emphasize that these data are quite reproducible.
As thin (,20mm) films of iso-PP were used, it is possible to assume that the samples
reach TC at the same time as the instrument, with no appreciable thermal lag. Therefore, a
negative t indicates that nucleation takes place on the (fast) cooling path from TF to TC.
Table 1. Average number of nuclei per unit area (NS)
obtained during isothermal crystallization at TC and at
undercooling DT ¼ Tm8 2 TC; for PP-A and PP-B.
Sample A Sample B
TC (8C) DT NS (cm22) DT NS (cm22)
125 59.5 3.51E4 53.9 2.90E3
128 56.5 3.70E4 50.9 3.80E3
130 54.5 3.54E4 48.9 5.00E3
132 52.5 3.65E4 46.9 2.90E3
135 49.5 3.55E4 43.9 2.10E3
138 46.5 3.49E4 40.9 5.00E3
140 44.5 2.80E4 38.9 3.80E3
142 42.5 2.00E4 36.9 3.20E3
145 39.5 1.82E4 33.9 8.00E2
148 36.5 1.05E4 30.9 2.00E2
150 34.5 1.23E4 28.9 4.00E2
120017126_MB_042_002_R1_X0.ald 8/1/2003—KALYAN—59029
Crystal Nucleation and Growth in Polypropylene 391
181
182
183
184
185
186
187
188
189
190
191
192
193
194
195
196
197
198
199
200
201
202
203
204
205
206
207
208
209
210
211
212
213
214
215
216
217
218
219
220
221
222
223
224
225
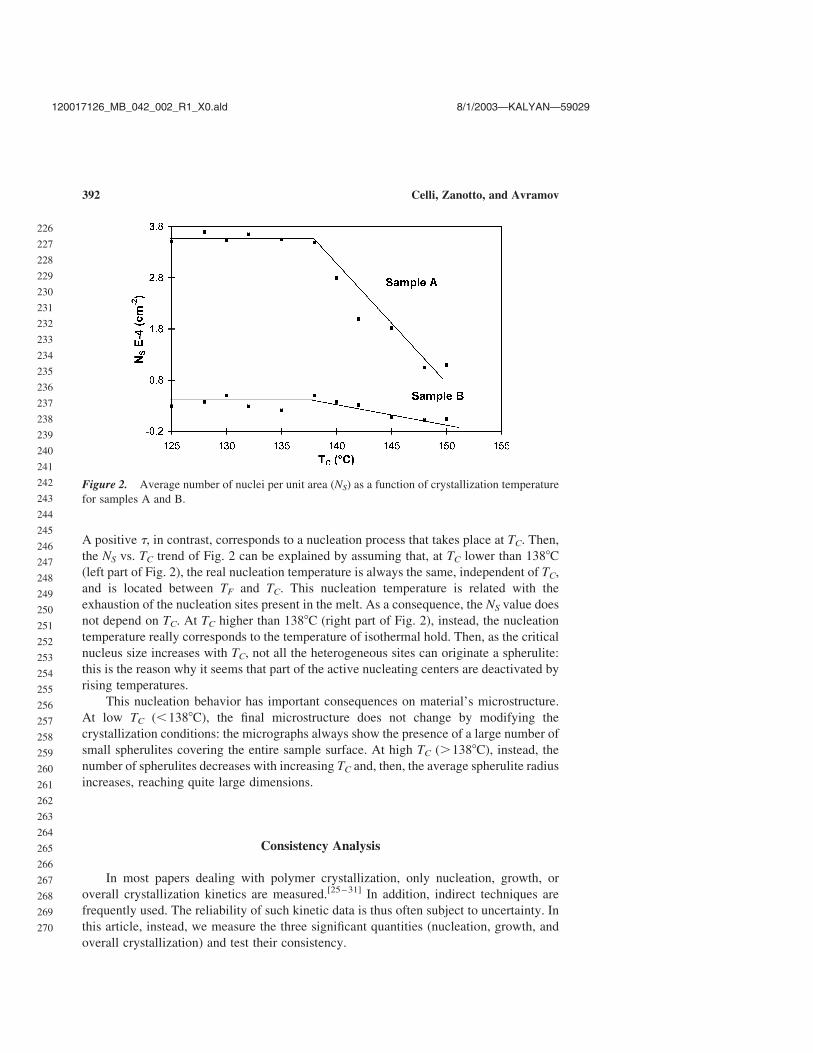
A positive t, in contrast, corresponds to a nucleation process that takes place at TC. Then,
the NS vs. TC trend of Fig. 2 can be explained by assuming that, at TC lower than 1388C
(left part of Fig. 2), the real nucleation temperature is always the same, independent of TC,
and is located between TF and TC. This nucleation temperature is related with the
exhaustion of the nucleation sites present in the melt. As a consequence, the NS value does
not depend on TC. At TC higher than 1388C (right part of Fig. 2), instead, the nucleation
temperature really corresponds to the temperature of isothermal hold. Then, as the critical
nucleus size increases with TC, not all the heterogeneous sites can originate a spherulite:
this is the reason why it seems that part of the active nucleating centers are deactivated by
rising temperatures.
This nucleation behavior has important consequences on material’s microstructure.
At low TC (,1388C), the final microstructure does not change by modifying the
crystallization conditions: the micrographs always show the presence of a large number of
small spherulites covering the entire sample surface. At high TC (.1388C), instead, the
number of spherulites decreases with increasing TC and, then, the average spherulite radius
increases, reaching quite large dimensions.
Consistency Analysis
In most papers dealing with polymer crystallization, only nucleation, growth, or
overall crystallization kinetics are measured.[25 – 31] In addition, indirect techniques are
frequently used. The reliability of such kinetic data is thus often subject to uncertainty. In
this article, instead, we measure the three significant quantities (nucleation, growth, and
overall crystallization) and test their consistency.
Figure 2. Average number of nuclei per unit area (NS) as a function of crystallization temperature
for samples A and B.
120017126_MB_042_002_R1_X0.ald 8/1/2003—KALYAN—59029
Celli, Zanotto, and Avramov392
226
227
228
229
230
231
232
233
234
235
236
237
238
239
240
241
242
243
244
245
246
247
248
249
250
251
252
253
254
255
256
257
258
259
260
261
262
263
264
265
266
267
268
269
270

The significance of the NS and G data, obtained by HSG and reported in Table 1, can
be verified by using a method based on the overall crystallization measurements carried
out by HSLD and DSC. Data are analyzed by using the Jonhson–Mehl–Avrami–
Kolmogorov (JMAK) equations[28 – 31]:
X ¼ 1 2 expð2Kt nÞ ð1Þ
where X is the fraction crystallized under isothermal conditions, and K is a kinetic
constant, which combines both nucleation and growth rates; t is the time; and n is a
constant that depends on the dimensionality of crystal growth and on the nucleation
mechanism. For overall crystallization experiments performed both in HSLD and in DSC,
for samples A and B and for all the temperatures studied, the values of n result indeed at
about 2. In particular n ¼ 1:9 ^ 0:1 for polymer B and n ¼ 1:8 ^ 0:1 for polymer
A. Recalling that, for a constant number of growing crystals per unit surface, NS, and for
Figure 3. Spherulite radius (r ) vs. crystallization time (tC) for both polymers: (a) TC # 1388C and
(b) TC . 1388C.
120017126_MB_042_002_R1_X0.ald 8/1/2003—KALYAN—59029
Crystal Nucleation and Growth in Polypropylene 393
271
272
273
274
275
276
277
278
279
280
281
282
283
284
285
286
287
288
289
290
291
292
293
294
295
296
297
298
299
300
301
302
303
304
305
306
307
308
309
310
311
312
313
314
315
time-independent growth rate (G ), K can be expressed by:
K ¼ pGnNS ð2Þ
we build theoretical curves X ¼ f ðtÞ; combining Eqs. (1) and (2). The value of n is fixed
equal to 2, the G data reported in Table 2 are used, and the NS value is varied. The best fitT2
between these theoretical curves and the experimental data obtained by HSLD is observed
when NS values are included within the experimental limits (Table 1). For example, Fig. 4F4
illustrates the overall crystallization data for sample B at two crystallization temperatures:
solid lines are drawn according to Eqs. (1) and (2). The good agreement observed suggests
that, for samples A and B, the most probable NS values coincide, within experimental
accuracy, with the data obtained by the direct observation of crystallization in HGS. This
method, based on the use of the JMAK equation, provides an important confirmation of the
consistency of the experimental nucleation and growth data that, in turn, allows us to
analyze further if there is any relationship between these kinetic quantities.
Crystal Growth Process
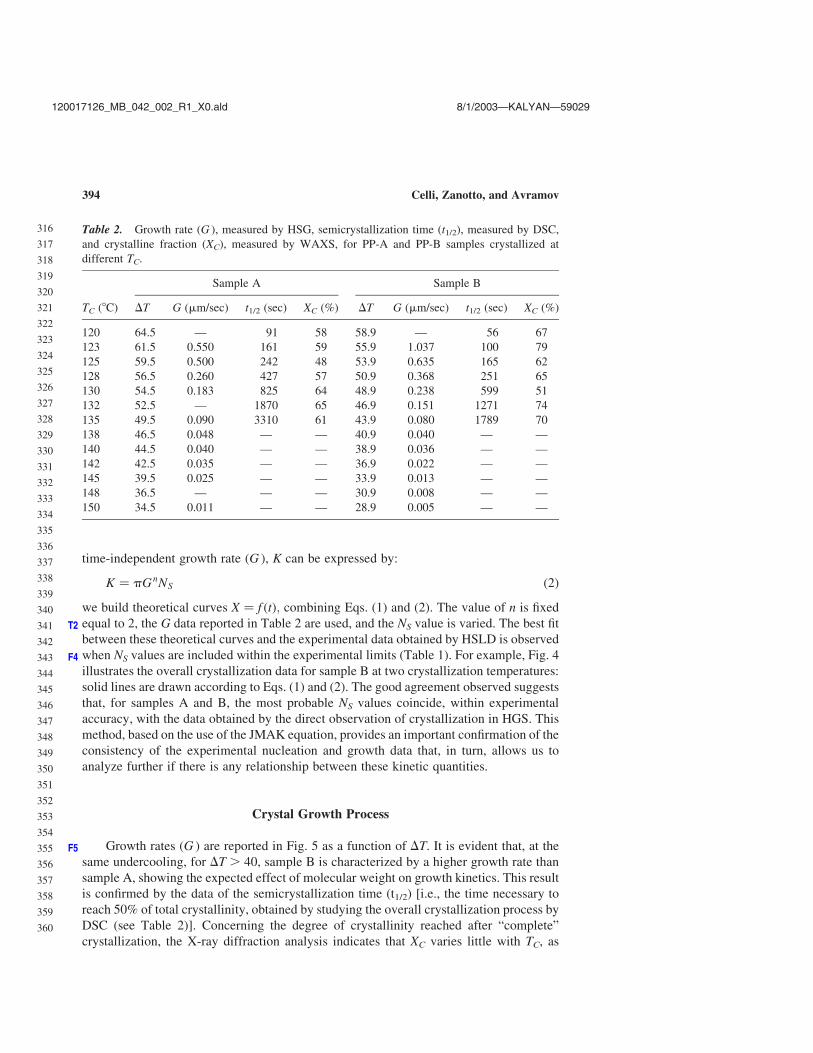
Growth rates (G ) are reported in Fig. 5 as a function of DT. It is evident that, at theF5
same undercooling, for DT . 40, sample B is characterized by a higher growth rate than
sample A, showing the expected effect of molecular weight on growth kinetics. This result
is confirmed by the data of the semicrystallization time (t1/2) [i.e., the time necessary to
reach 50% of total crystallinity, obtained by studying the overall crystallization process by
DSC (see Table 2)]. Concerning the degree of crystallinity reached after “complete”
crystallization, the X-ray diffraction analysis indicates that XC varies little with TC, as
Table 2. Growth rate (G ), measured by HSG, semicrystallization time (t1/2), measured by DSC,
and crystalline fraction (XC), measured by WAXS, for PP-A and PP-B samples crystallized at
different TC.
Sample A Sample B
TC (8C) DT G (mm/sec) t1/2 (sec) XC (%) DT G (mm/sec) t1/2 (sec) XC (%)
120 64.5 — 91 58 58.9 — 56 67
123 61.5 0.550 161 59 55.9 1.037 100 79
125 59.5 0.500 242 48 53.9 0.635 165 62
128 56.5 0.260 427 57 50.9 0.368 251 65
130 54.5 0.183 825 64 48.9 0.238 599 51
132 52.5 — 1870 65 46.9 0.151 1271 74
135 49.5 0.090 3310 61 43.9 0.080 1789 70
138 46.5 0.048 — — 40.9 0.040 — —
140 44.5 0.040 — — 38.9 0.036 — —
142 42.5 0.035 — — 36.9 0.022 — —
145 39.5 0.025 — — 33.9 0.013 — —
148 36.5 — — — 30.9 0.008 — —
150 34.5 0.011 — — 28.9 0.005 — —
120017126_MB_042_002_R1_X0.ald 8/1/2003—KALYAN—59029
Celli, Zanotto, and Avramov394
316
317
318
319
320
321
322
323
324
325
326
327
328
329
330
331
332
333
334
335
336
337
338
339
340
341
342
343
344
345
346
347
348
349
350
351
352
353
354
355
356
357
358
359
360

confirmed by Cheng et al.[14] in the range of DT analyzed, and decreases with increasing
molecular weight, as generally expected.[32,33]
The kinetics of crystal growth in polymers are often analyzed by the Hoffman–
Lauritzen equation[8]:
GðTÞ ¼ Go exp½2U*=ðRðTC 2 T1ÞÞ� exp½2Kg=ð fTCDTÞ� ð3Þ
where Go is a pre-exponential factor containing quantities that are not strongly dependent
on temperature; U* is a “universal” constant, characteristic of the activation energy for
Figure 5. Growth rate (G ) as a function of undercooling (DT ) for samples A and B.
Figure 4. Overall crystallization kinetics for sample B annealed at 1238C and 1258C. Solid lines
are drawn according to Eqs. (1) and (2), with n ¼ 2; G ¼ experimentally determined, and NS ¼ best
fit. The fitted values lie within the experimental limits [i.e., (3.5 ^ 0.15) £ 104 nuclei/cm2].
120017126_MB_042_002_R1_X0.ald 8/1/2003—KALYAN—59029
Crystal Nucleation and Growth in Polypropylene 395
361
362
363
364
365
366
367
368
369
370
371
372
373
374
375
376
377
378
379
380
381
382
383
384
385
386
387
388
389
390
391
392
393
394
395
396
397
398
399
400
401
402
403
404
405

reptation in the melt, which is typically taken as 6,280 J/mol, e.g. Ref.[8]; R is the gas
constant; and T1 represents the theoretical temperature below which all motion associated
with viscous flow or reptation ceases. T1 is usually assumed to be equal to ðTg 2 308CÞ:The term f ¼ 2TC=ðTC þ Tm8Þ is a correction factor introduced to account for the
temperature dependence of the heat of crystallization. The (secondary) nucleation constant
Kg, which controls crystal growth, is expressed by:
KgIII ¼ KgI ¼ 4b1sseTm8=ðDHmkÞ in regimes III and I
and by
KgII ¼ 2bosseTm8=ðDHmkÞ in regime II
bo is the thickness of a single stem on the crystal, s and se are the lateral and fold surface-
free energies, respectively, and k is the Boltzmann constant.
Figure 6 represents a linearized form of Eq. (3) [i.e., the relationship between lnðGÞ þ
U*=ðRðTC 2 T1ÞÞ and 1=ð fTCDTÞ: For both samples, a transition from regime III to
regime II occurs at a temperature close to 1388C, corresponding to an undercooling
DT ¼ 478C for sample A and 418C for sample B. These results are similar to those of Clark
F6
et al.[34] and Janimak et al.,[35] who describe a regime transition from III to II at an
undercooling DT ¼ 488C; for PP fractions of different isotacticity. For each sample, the
two nucleation constants KgIII and KgII are calculated by the slopes of the straight lines of
Fig. 6 and their ratio KgIII/KgII is equal to 2, as predicted by theory.[8] It is noteworthy that
the growth regime transition occurs at the same temperature (,1388C) at which the
nucleation behavior changes and the number of nuclei switches from a constant value to a
temperature-dependent one (Fig. 2). Therefore, correlation between primary nucleation
behavior and growth regime transition seems to exist. The most evident effect of this
correlation is given by observing the final morphology: in regime III, iso-PP samples are
characterized by a very high number of small spherulites, that remains constant,
independent of TC. In regime II, instead, the number of spherulites decreases and,
correspondingly, their size increases by increasing TC. To the best of our knowledge, such
Figure 6. Crystallization regimes III and II for samples A and B.
120017126_MB_042_002_R1_X0.ald 8/1/2003—KALYAN—59029
Celli, Zanotto, and Avramov396
406
407
408
409
410
411
412
413
414
415
416
417
418
419
420
421
422
423
424
425
426
427
428
429
430
431
432
433
434
435
436
437
438
439
440
441
442
443
444
445
446
447
448
449
450
correlation has never been reported in the literature and may be just a coincidence, but it
clearly occurs for both polymers. Hence it deserves further attention.
Numerous papers deal with the problem of finding comprehension of the regime
transitions by correlating them with some physical, morphological, or structural change. In
particular, many authors have tried to interpret the change of crystallization regimes by
morphological modifications.[36 – 42] Indeed, morphological changes are present in samples
A and B only in terms of spherulites number. On the other hand, correlations between crystal
growth kinetics and primary nucleation are not frequently found. Hoffman[36] discusses the
possibility that melting memory effects and, then, primary crystallization, influence
crystallization kinetics; but, he concludes that these effects do not invalidate the secondary
nucleation (that controls crystal growth) theory based on crystallization regimes.
It is possible to discuss primary and secondary nucleation in the same terms: the
formation of a primary nucleus that originates as a spherulite, and the deposit of a
secondary nucleus that causes lamella growth have a common key factor based on the
dependence of the critical nucleus size on temperature. From experimental results, it is
evident that, at TC lower than 1388C, nucleation centers existing in the melt (NS per unit
area) seem to be all active to initiate crystallization. At the same time, in the crystal growth
occurring in regime III, steams are easily deposited on the lamellae, including the tiniest
seeds having a size of the order of the lamellae thickness.
On the other hand, above 1388C, as the critical nucleus size increases with the
temperature, the submicroscopic foreign seeds can act as nucleation catalysts only if they
are at least as large as the critical nucleus. The number of seeds that do not satisfy this
condition and that will become inactive, will increase with temperature (as seen in Fig. 2,
where NS decreases with TC). Correspondingly, during growth that occurs in regime II, a
significant barrier for attachment of first steam is present.[8,36] Therefore, part of the seeds
is deactivated and the dependence of the growth rate with temperature has a break (shown
in Fig. 6). Then, the coincident behavior between primary and secondary nucleation can be
expressed in terms of substrate activity as a function of temperature.
CONCLUSIONS
Although numerous papers study nucleation, crystal growth, or overall crystallization
of iso-PP, complete and simultaneous analyses of nucleation, growth, and overall
crystallization on the same samples—in the same temperature range—are quite rare. Such
experimental approach, if carefully performed, can give interesting information about the
thermal behavior of polymers.
In the present article, the results of a detailed study on the evolution of average
number, size, and shape of spherulites and on overall crystallization rate are reported and
discussed. It is noteworthy that all the thermal data, even those obtained by different
experimental techniques, are consistent, as tested by the JMAK equation.
The dependence of the nuclei number on the crystallization temperature and time
shows that athermal heterogeneous nucleation is predominant in iso-PP. Moreover, it is
significant that at large undercoolings, for TC , 1388C, the number of crystallites does not
depend on time or annealing temperature. At small undercoolings, on the other hand, for
120017126_MB_042_002_R1_X0.ald 8/1/2003—KALYAN—59029
Crystal Nucleation and Growth in Polypropylene 397
451
452
453
454
455
456
457
458
459
460
461
462
463
464
465
466
467
468
469
470
471
472
473
474
475
476
477
478
479
480
481
482
483
484
485
486
487
488
489
490
491
492
493
494
495
TC . 1388C, the number of spherulites does not depend on time, but decreases with
increasing temperature.
Surprisingly, this change in nucleation behavior at 1388C coincides with the growth
regime transition III ! II: Consequently, in regime III, a constant (high) number of small
spherulites is present, independent of temperature, whereas in regime II, the number of
spherulites decreases and their size increases as temperature increases. This remarkable
correlation observed between nucleation and growth behavior has been interpreted as due
to the substrate activity as a function of temperature.
To the best of our knowledge, this coincident behavior between primary and
secondary nucleation has never been reported in the literature: in general, the relationship
between crystal growth regimes and microstructural features was not discussed in terms of
primary nucleation behavior. However, the results observed for iso-PP-A and iso-PP-B
may be coincidental. Thus, further studies, with other polymers, will be necessary to
generalize or not the present finding. If confirmed, there will be scope to improve the
understanding of the correlation existing between primary and secondary crystallization.
NOMENCLATURE
DSC differential scanning calorimetry
HSG hot-stage microscopy equipped with camera and videocamera for G
determination
HSLD hot-stage light depolarization
JMAK Jonhson–Mehl–Avrami–Kolmogorov
PP polypropylene
SAXS small-angle X-ray scattering
WAXS wide-angle X-ray scattering
Tm melting temperature of the sample
Tm8 equilibrium melting temperature
TF temperature at which the polymers are melted in HSG, HSLD, and DSC
tF time of isotherm at TF
TC isothermal crystallization temperature
tC isothermal crystallization time
DT (Tm8 2 TC), undercooling
G spherulitic growth rate
r spherulitic radius
NS average number of nuclei per unit area
XC crystalline fraction measured by WAXS
REFERENCES
1. Terrill, N.J.; Fairclough, P.A.; Towns-Andrews, E.; Komanschek, B.U.; Young, R.J.;
Ryan, A.J. Density fluctuations: the nucleation event in isotactic polypropylene
crystallization. Polymer 1998, 39, 2381–2385.
120017126_MB_042_002_R1_X0.ald 8/1/2003—KALYAN—59029
Celli, Zanotto, and Avramov398
496
497
498
499
500
501
502
503
504
505
506
507
508
509
510
511
512
513
514
515
516
517
518
519
520
521
522
523
524
525
526
527
528
529
530
531
532
533
534
535
536
537
538
539
540

2. Wang, Z.-G.; Hsiao, B.S.; Srinivas, S.; Brown, G.M.; Tsou, A.H.; Cheng, S.Z.D.;
Stein, R.S. Phase transformation in quenched mesomorphic isotactic polypropylene.
Polymer 2001, 42, 7561–7566.
3. Iijima, M.; Strobl, G. Isothermal crystallization and melting of isotactic
polypropylene analyzed by time- and temperature-dependent small-angle x-ray
scattering experiments. Macromolecules 2000, 33, 5204–5214.
4. Li, L.; Chan, C.-M.; Li, J.-X.; Ng, K.-M.; Yeung, K.-L.; Weng, L.-T. A direct
observation of the formation of nuclei and the development of lamellae in polymer
spherulites. Macromolecules 1999, 32, 8240–8242.
5. Pogodina, N.V.; Siddiquee, S.K.; van Egmond, J.W.; Winter, H.H. Correlation of
rheology and light scattering in isotactic polypropylene during early stages of
crystallization. Macromolecules 1999, 32, 1167–1174.
6. Sasaki, S.; Tashiro, K.; Kobayashi, M.; Izumi, Y.; Kobayashi, K. Microscopically
viewed structural change of PE during the isothermal crystallization from the melt II.
Conformational ordering and lamellar formation mechanism derived from the
coupled interpretation of time-resolved SAXS and FTIR data. Polymer 1999, 40,
7125–7135.
7. Janeschitz-Kriegl, H. Conditions of nucleation in crystallizable polymers:
reconnaissance of positions—a critical evaluation. Colloid Polym. Sci. 1997, 275,
1121–1135.
8. Hoffman, J.D.; Davis, G.T.; Lauritzen, J.I., Jr. Treatise on Solid-State Chemistry;
Plenum Press: New York, 1976; Vol. 3, Chap 7.
9. Celli, A.; Zanotto, E.D. Polymer crystallization: fold surface free energy
determination by different thermal analysis techniques. Thermochim. Acta 1995,
269/270, 191–199.
10. Hoffman, J.D.; Weeks, J.J. J. Res. Natl. Bur. Stand. (A) 1962, 66, 13.
11. Mandelkern, L. Crystallization and melting. Comprehensive Polymer Science;
Pergamon Press: Oxford, 1989; Vol. 2.
12. Mezghani, K.; Campbell, A.R.; Phillips, P.J. Lamellar thickening and the
equilibrium melting point of polypropylene. Macromolecules 1994, 27,
997–1002.
13. Cheng, S.Z.D.; Janimak, J.J.; Zhang, A.; Cheng, H.N. Regime transitions in fractions
of isotactic polypropylene. Macromolecules 1990, 23, 298–303.
14. Cheng, S.Z.D.; Janimak, J.J.; Zhang, A.; Hsieh, E.T. Isotacticity effect on
crystallization and melting in polypropylene fractions: 1. Crystalline structures and
thermodynamic property changes. Polymer 1991, 32, 648–655.
15. Binsbergen, F.L. Natural and artificial heterogeneous nucleation in polymer
crystallization. J. Polym. Sci.: Polym. Symp. 1977, 59, 11–29.
16. Price, F.P. Nucleation; Zettlemoyer, A.C., Ed.; Marcel Dekker: New York, 1969;
Chap. 8.
17. Sharples, A. Introduction to Polymer Crystallization; Edward Amold Ltd: London,
1965.
18. Wunderlich, B. Macromolecular Physics, Vol. 2, Crystal Nucleation, Growth,
Annealing; Academic: New York, 1976; .
19. Ziabicki, A.; Alfonso, G.C. Memory effects in isothermal crystallization I. Theory.
Colloid Polym. Sci. 1994, 272, 1027–1042.
120017126_MB_042_002_R1_X0.ald 8/1/2003—KALYAN—59029
Crystal Nucleation and Growth in Polypropylene 399
541
542
543
544
545
546
547
548
549
550
551
552
553
554
555
556
557
558
559
560
561
562
563
564
565
566
567
568
569
570
571
572
573
574
575
576
577
578
579
580
581
582
583
584
585
20. Alfonso, G.C.; Ziabicki, A. Memory effects in isothermal crystallization II. Isotactic
polypropylene. Colloid Polym. Sci. 1995, 273, 317–323.
21. Janeschitz-Kriegl, H.; Ratajski, E.; Wippel, H. The physics of athermal nuclei in
polymer crystallization. Colloid Polym. Sci. 1999, 277, 217–226.
22. Bartczak, Z.; Galeski, A. Homogeneous nucleation in polypropylene and its blends
by small-angle light scattering. Polymer 1990, 31, 2027–2038.
23. Deslandes, Y.; Sabir, F.-N.; Roovers, J. Effect of molecular weight on the spherulitic
growth rate of poly(aryl ether ether ketone). Polymer 1991, 32, 1267–1273.
24. Varga, J. Supermolecular structure of isotactic polypropylene. J. Mater. Sci. 1992,
27, 2557–2579.
25. Bicerano, J. Crystallization of polypropylene and poly(ethylene terephthalate).
J.M.S. Rev. Macromol. Chem. Phys. 1998, C38, 391–479.
26. Bartzack, Z.; Galeski, A.; Pracella, M. Spherulite nucleation in blends of isotactic
polypropylene with high-density polyethylene. Polymer 1986, 27, 537–543.
27. Galeski, A. Polypropylene Structure, Blends and Composites; Chapman & Hall:
London, 1995; Vol. 1, Chap. 4.
28. Galeski, A.; Bartczak, Z.; Pracella, M. Spherulite nucleation in polypropylene blends
with low density polyethylene. Polymer 1984, 25, 1323–1326.
29. von Falkai, B. Schmelz- und Kristallisationserscheinungen bei makromolekularen
substanzen. Makromol. Chem. 1960, 41, 86–109.
30. Binsbergen, F.L.; De Lange, B.G.M. Heterogeneous nucleation in the crystallization
of polyolefins: part 2. Kinetics of crystallization of nucleated polypropylene.
Polymer 1970, 11, 309–332.
31. Menczel, J.; Varga, J. Influence of nucleating agent on crystallization of
polypropylene I. Talc as nucleating agent. J. Therm. Anal. 1983, 28, 161–174.
32. Day, M.; Deslandes, Y.; Roovers, J.; Suprunchuk, T. Effect of molecular weight on
the spherulitic growth rate of poly(aryl ether ether ketone): a differential scanning
calorimetry study. Polymer 1991, 32, 1258–1266.
33. Alamo, R.; Fatou, J.G.; Guzman, J. Crystallization of polyformals: 1. Crystallization
kinetics of poly(1,3-dioxolane). Polymer 1982, 23, 374–378.
34. Clark, E.J.; Hoffman, J.D. Regime III crystallization in polypropylene.
Macromolecules 1984, 17, 878–885.
35. Janimak, J.J.; Cheng, S.Z.D.; Giusti, P.A.; Hsieh, E.T. Isotacticity effect on
crystallization and melting in poly(propylene) fractions. 2. Linear crystal growth rate
and morphology study. Macromolecules 1991, 24, 2253–2260.
36. Hoffman, J.D.; Miller, R.L. Kinetics of crystallization from the melt and chain
folding in polyethylene fractions reviseted: theory and experiments. Polymer 1997,
38, 3151–3212.
37. Hoffman, J.D. Regime III crystallization in melt-crystallized polymers: the variable
cluster mode of chain folding. Polymer 1983, 24, 3–26.
38. Monasse, B.; Haudin, J.M. Growth transition and morphology change in
polypropylene. Colloid Polym. Sci. 1985, 263, 822–831.
39. Monasse, B.; Haudin, J.M. Effect of random copolymerization on growth transition
and morphology change in polypropylene. Colloid Polym. Sci. 1988, 266, 679–687.
40. Allen, R.C.; Mandelkern, L. On regimes I and II during polymer crystallization.
Polym. Bull. 1987, 17, 473–480.
120017126_MB_042_002_R1_X0.ald 8/1/2003—KALYAN—59029
Celli, Zanotto, and Avramov400
586
587
588
589
590
591
592
593
594
595
596
597
598
599
600
601
602
603
604
605
606
607
608
609
610
611
612
613
614
615
616
617
618
619
620
621
622
623
624
625
626
627
628
629
630
41. Alamo, R.; Fatou, J.G.; Guzman, J. Crystallization of polyformals: 2. Influence of
molecular weight and temperature on the morphology and growth rate in
poly(1,3-dioxolane). Polymer 1982, 23, 379–384.
42. Roitman, D.B.; Marand, H.; Miller, R.L.; Hoffman, J.D. Kinetics of crystallization
and morphology of poly(pivalolactone): regime II ! III transition and nucleation
constants. J. Phys. Chem. 1989, 93, 6919–6926.
Received March 7, 2002
Accepted May 27, 2002
120017126_MB_042_002_R1_X0.ald 8/1/2003—KALYAN—59029
Crystal Nucleation and Growth in Polypropylene 401
631
632
633
634
635
636
637
638
639
640
641
642
643
644
645
646
647
648
649
650
651
652
653
654
655
656
657
658
659
660
661
662
663
664
665
666
667
668
669
670
671
672
673
674
675