primary maths - prim-ed publishing - ff sample unit.… · primary maths is a photocopiable,...
TRANSCRIPT

2014 CurriculumPRIMARY
MATHS
Year 6Book 2 of 2
Resources and
teacher ideas for every objective
of the 2014 Curriculum
PM Year 6 Book 2 of 2.indd 1 26/11/2014 15:42:29

Primary Maths Prim-Ed Publishing www.prim-ed.com iii
Foreword
Primary Maths is a photocopiable, six-level, year–specific series designed to address the Primary National Curriculum for Mathematics objectives of: • number • ratioandproportion • algebra • measurement • geometry • statistics.
Each book in the Primary Maths series includes: • atleastoneactivitypageforeachobjective • comprehensiveteachersnotestoaccompanyeachactivity • additionalteachersnotesonactivitiesandgames • assessmentchecklists • additionalphotocopiableresources • interactive whiteboard resources available to download.
The Year 6 books in the Primary Maths series are: Primary Maths - Number, Ratio, Proportion and Algebra Primary Maths - Measurement, Geometry and Statistics
Measurement ..................................2–35 Conversions ........................................ 2–19
Area and perimeter ........................20–29
Volume ..............................................30–35
Geometry ......................................36–77 2-D shapes .......................................36–39
3-D shapes .......................................40–45
Nets ....................................................46–51
Classifying shapes ..........................52–57
Angles in shapes .............................58–65
Circles ................................................66–67
Angles ................................................ 68–71
Coordinates ......................................72–77
Teachers notes: How to use this book ............................. iv–v
Setting up a maths classroom ...................vi
Activities and games ............................vi–vii
Assessment checklists ..........................viii–x
Additional resources ..........................xi–xvii
Pupil activities with accompanying teachers notes:
Statistics .......................................78–99 Pie charts ..........................................78–87
Line graphs .......................................88–91
Averages ...........................................92–99
Contents

iv www.prim-ed.com Prim-Ed Publishing Primary Maths
How to use this book
The Primary Maths series provides teachers with a number of varied and challenging activities. At least one activity, often more, is provided for each objective of the Primary National Curriculum for Mathematics.
Suggestions for using the activities in this book:
Objective:• Decide which curriculum objective you wish to address and choose the appropriate activity page(s).
Oral work and mental calculation starter:• Choose which oral and mental activities you will use, from the list provided, to introduce the lesson or sharpen
pupils’ skills.• Someoftheactivitieshaveaccompanyinginteractivewhiteboardactivitiestohelpintroducethelessonandcapture
pupils’ attention.• These activities should occupy the first 5–10 minutes of the lesson.
Main teaching activity:• Decide how much teacher input you will provide for the main activity and whether pupils will be working
individually, in pairs or as a group.• Depending upon the abilities of the pupils in your class, decide whether any additional activities will be needed, from
the list provided, or whether these can be used during subsequent lessons.• This activity should occupy approximately 40 minutes.
Plenary:• Decide what opportunities will be provided during the plenary session. Will pupils be given the opportunity to share
and explain work, compare strategies used or summarise the key facts they have learnt?• Think about how you can use the plenary session to assess pupils’ progress and therefore inform your future
planning.• The plenary should occupy the final 15 minutes of the lesson.
Pupil activity pages:The pupil activities follow a common format:
Title explanation
After initial discussion, some activities can be completed individually, and others in small groups or as a whole class.
The ‘Challenge’ activity can be completed by early finishers or those pupils requiring extension of the task. Pupils may need to complete the activity on the back of the worksheet or investigate an activity further by using concrete materials or creating their own ideas linked to the objective.
The objective provides the teacher with the focus of the activity. It is written in the form of a general objective.
Teachers notes
An icon denotes the curriculum strand for each activity.
Number
Measurement
Geometry
Statistics
GGeometry
NNumber
MMeasurement
SStatistics

Primary Maths Prim-Ed Publishing www.prim-ed.com v
AAssessment
How to use this book
AssessmentAssessmentchecklistshavebeenincludedfortheYear6‘Measurement’,‘Geometry’and‘Statistics’objectives.Seepages viii–x. These can be used to assess each pupil’s understanding of the key objectives covered.
• Teachingnotesforthe‘Measurement’,‘Geometry’and‘Statistics’strandshavebeenincludedonpagesvi–vii.These comprise background information and suggested activities and games.
• Extra teacher resources have been included on pages xi–xvii. These can be enlarged if necessary and used in appropriate activities or as display posters.
• Interactivewhiteboardactivitieshavebeenprovidedtohelpteachsomeoftheobjectives.Thesecanbedownloaded from www.prim-ed.com.
The objective tells the teacher which strand and objective from the Primary National Curriculum for Mathematics is being covered.
Oral work and mental calculation activities are suggested, for introducing the lesson or sharpening/developing oral and mental skills. The activities should occupy the first 10 minutes of the lesson.
Some activities have interactive whiteboard activities available to download. If an interactive activity is provided it is listed here.
The title of the main teaching activity is given. The photocopiable activity is on the page facing the teachers notes. The main activity should occupy approximately 40 minutes.
Answers to all activities are provided.
Suggest ions for addit iona l activities are provided. They can be completed during the lesson, or in subsequent lessons. They can be used to aid differentiation.
Teachers pagesAteacherspageaccompanieseachpupilworksheet.Itprovidesthefollowinginformation:
Use the key to write the appropriate code next to each task the pupil completes.
A summary of the tasks pupils will complete.
Teachers notes

vi www.prim-ed.com Prim-Ed Publishing Primary Maths
Setting up a mathematics classroom
By having the following materials and visual representations around them, pupils can better engage in mathematical learning.
• Allowroomtomovesopupilscaninvestigatethingsaround the room. Organise desks and floor space appropriately.
• Displaya‘Numbers’chartthatincludesthousands,ten thousands, hundred thousands and millions.
• Displayanumberlineatalevelwherepupilscanuseit.Includenegativenumbersonthenumberline.
• Display numbers, number words and a visualrepresentation of numbers.
• Displayaplacevaluechartwhichincludesfractions(tenths, hundredths and thousandths).
• Displaya100square.
• Ensureyouhaveagoodrangeofmathsgamesanduse them regularly.
• Providecalculators.
• Display‘timestables’charts.
• Haveananalogueanddigitalclockintheclassroom(12-hour and 24-hour).
• Displaypicturesoflabelled2-Dand3-Dshapes.
• Provideathermometer.
• Provideconstructionmaterials suchas cardboardboxes, cylinders, paper, scissors and so on.
• Ensure youhaveadequate concretematerials toteach each strand (refer to pages vi–vii).
• Allowpupilsopportunitiestoinvestigateoutsidetheclassroom in the school environment.
• Display a chart showing equivalent fractions,decimals and percentages.
• Displayormakevariousgraphssuchaspictograms,bar charts, block graphs, Venn diagrams, Carroll diagrams, line graphs and pie charts.
• Displaya classbirthdaychartwhich includes themonths of the year.
• Displayanduseacalendar.
• Display a poster showing equivalentmetric andimperial measures.
• Have computer software related tomathematicsavailable for use on the classroom computer(s) or in the computer room.
• Displayapostershowingdifferentangles.
• Providearangeofmeasuringequipmentforlength,mass and capacity.
• Displaytheeightcompassdirections:N,S,E,W,NE,NW,SE,SW.
• Ensure youhave a good selection of interactivemaths resources for use on a whiteboard (refer to www.prim-ed.com).
Teachers notes
Statistics — Activities and games
Brainstorm a list of topics pupils would like to collect data about. Collect the data and record it on a pie chart. Complete a table recording daily temperature for one month. Display as a line graph. Calculate the mean, range, mode and the median.
Materials required
• gridpaper• graphpaper• tapemeasure
Materials required
• gridpaper• graphpaper(pagexvii)• variousgraphsforreference

Primary Maths Prim-Ed Publishing www.prim-ed.com vii
Measurement – Activities and games
• Useapieceofwool,cottonorstring24cmlong.Jointhe ends to make a loop. Use a sheet of grid paper to find the smallest and largest area you can cover using the loop. Draw outlines on the grid paper. Record the perimeter and area of each.
• Provideopportunitiestoreadscaleswhereeachcalibration is not labelled; for example, a measuring tape marked in hundredths but labelled in tenths, a scale marked in grams but labelled in kilograms.
• Providepupilswithvariousreal-lifesituationsinwhichthey are required to distinguish the difference between perimeter and area; for example, new fencing around the school would require knowing the perimeter of the school. New lawn for a particular area within the school grounds would require knowing the area.
• Withinthelimitsoftheschoolpremises,markoutanarea 100 m x 100 m – one hectare. If space does not allow, mark out either an area 100 m x 50 m or 50 m x 50 m to give pupils an idea of 0.5 or 0.25 of a hectare and, therefore, some indication of the actual size of a hectare.
• Collectavarietyofcontainerstocomparecapacities.– Compare 2 L soft drink bottles, 2 L cordial bottles and
2 L ice-cream containers.– Compare 1 L milk cartons, 1 L standard measuring
containers and 1 L soft drink bottles.– Compare 500 mL containers with each other.– Discuss the actual capacity of each of the containers,
asking for suggestions as to why they change.
• Collectanumberofcardboardpackages—cerealboxes,cake mix boxes etc.—and record the capacity of each box by filling the box with sand, rice or beans.
Measure the capacity by cupfuls. Cut the boxes open and compare their surface areas. Check to see whether the box with the largest surface area also has the largest capacity.
• Useavarietyofcontainerswiththesamebaseareabutdifferent heights – measure both surface area and base area to see what the ratio between surface area and volume is in each case.
• Useasmallnumberofcubestobuildanarrangement.Ask pupils to increase the size of the arrangement by double or triple the amount, so the new arrangement looks the same as the original, just larger.
Materials required
• rulers/metreruler • balancescales• trundlewheel • bathroomscales• 1-cmcubes • tapemeasure• gridpaper• containersofvaryingcapacity
Geometry – Activities and games
• Pupilsdraw3-Dmodels,includingsolidlinesforwhattheycan see and dotted lines for the parts of the models that cannot be seen.
• Pupilsmakeasimpleshapewithdimensionslessthan2cm,putting their initials on one side. Use 2-cm grid paper to draw and describe how they would move their shape from one square to another by flipping, sliding and rotating.
• Pupilsmake their own logowith at least one line ofsymmetry.
Make a logo for their favourite sport with a line of reflectional symmetry.
Design a logo for the school with a line of rotational symmetry.
• UseVenndiagramstoclassifythree-dimensionalshapes.Classifications may include:
– odd and even vertices;
– plane and non-plane faces;
– prisms, pyramids and others;
– regular and irregular;
– square faces, triangular faces and other faces; or
– parallel or perpendicular faces or edges.
• Investigateshapesinbuildings,structures,playequipmentand other parts of the environment. Give reasons why certain shapes are used in particular situations; for example, the triangle for rigidity.
• Useaprotractortomeasureanglesinregular2-Dshapes.Classify the shapes according to whether they have acute, right or obtuse angles.
• Plot coordinates in all four quadrants. Draw a shapeinto one quadrant and its reflection into the other three quadrants.
• Drawnetstoconstruct3-Dshapes.
Materials required
• 2-Dand3-Dshapepictures (see pages xii and xiii)
• 2-Dshapesfortessellation /symmetry
• constructionmaterialfor 3-Dmodels
• mirrors
• patternblocks• modellingclay• protractors• gridpaper• toothpick
Teachers notes

viii www.prim-ed.com Prim-Ed Publishing Primary Maths
AAssessment
Pupils’ namesSo
lve
prob
lem
s in
volv
ing
the
calc
ulat
ion
and
conv
ersi
on o
f un
its o
f m
easu
re.
Use
deci
mal
not
atio
n up
to
thre
e de
cim
al p
lace
s.
Use,
rea
d, w
rite
and
conv
ert
betw
een
stan
dard
uni
ts o
f le
ngth
.
Use,
rea
d, w
rite
and
conv
ert
betw
een
stan
dard
uni
ts o
f m
ass.
Use,
rea
d, w
rite
and
conv
ert
betw
een
stan
dard
uni
ts o
f vo
lum
e.
Use,
rea
d, w
rite
and
conv
ert
betw
een
stan
dard
uni
ts o
f tim
e.
Conv
ert
betw
een
mile
s an
d ki
lom
etre
s.
Reco
gnis
e th
at s
hape
s w
ith t
he s
ame
area
can
hav
e di
ffer
ent
perim
eter
s.
Reco
gnis
e th
at s
hape
s w
ith t
he s
ame
perim
eter
can
hav
e di
ffer
ent
area
s.
Reco
gnise
whe
n it
is po
ssib
le t
o us
e fo
rmul
ae f
or a
rea.
Reco
gnise
whe
n it
is po
ssib
le t
o us
e fo
rmul
ae f
or v
olum
es o
f sh
apes
.
Calc
ulat
e th
e ar
ea o
f pa
ralle
logr
ams.
Calc
ulat
e th
e ar
ea o
f tr
iang
les.
Calc
ulat
e, e
stim
ate
and
com
pare
vol
ume
of c
ubes
and
cub
oids
.
KeyD = DemonstratedNFO = Needs further
opportunity
Year 6 Measurement – assessment checklist

Primary Maths Prim-Ed Publishing www.prim-ed.com ix
AAssessmentYear 6 Geometry – assessment checklist
Pupils’ names Draw
2-D
sha
pes,
give
n di
men
sion
s.
Draw
2-D
sha
pes,
give
n an
gles
.
Reco
gnis
e, d
escr
ibe
and
build
sim
ple
3-D
shap
es.
Reco
gnis
e, d
escr
ibe
and
build
net
s.
Com
pare
and
cla
ssify
geo
met
ric s
hape
s ba
sed
on t
heir
prop
ertie
s an
d si
zes.
Find
unk
now
n an
gles
in t
riang
les.
Find
unk
now
n an
gles
in r
egul
ar
poly
gons
.
Illus
trat
e an
d na
me
part
s of
circ
les.
Know
tha
t th
e di
amet
er o
f a
circ
le is
tw
ice
the
radi
us.
Reco
gnise
ang
les
whe
re t
hey
mee
t at
a
poin
t.
Reco
gnise
ang
les
whe
re t
hey
are
on a
st
raig
ht li
ne.
Reco
gnise
ang
les
that
are
ver
tical
ly
oppo
site.
Find
miss
ing
angl
es.
Desc
ribe
posit
ions
on
the
full
coor
dina
te g
rid.
Draw
, tra
nsla
te a
nd re
flect
sim
ple
shap
es.
KeyD = DemonstratedNFO = Needs further
opportunity

x www.prim-ed.com Prim-Ed Publishing Primary Maths
AAssessment
Pupils’ names
Inte
rpre
t pi
e ch
arts
.
Cons
truc
t pi
e ch
arts
.
Use
pie
char
ts t
o so
lve
prob
lem
s.
Inte
rpre
t lin
e gr
aphs
.
Cons
truc
t lin
e gr
aphs
.
Use
line
grap
hs t
o so
lve
prob
lem
s.
Calc
ulat
e an
d in
terp
ret
the
mea
n as
an
ave
rage
.
KeyD = DemonstratedNFO = Needs further
opportunity
Year 6 Statistics – assessment checklist

Primary Maths Prim-Ed Publishing www.prim-ed.com xi
AAssessmentTeachers notes
12 12
3
4
5678
9
1011
0013
14
15
16
1718
19
20
21
22
2312 1
2
3
4
5678
9
1011
0013
14
15
16
1718
19
20
21
22
23
12 12
3
4
5678
9
1011
0013
14
15
16
1718
19
20
21
22
2312 1
2
3
4
5678
9
1011
0013
14
15
16
1718
19
20
21
22
23
24-hr clocks

Teacher resources
xii www.prim-ed.com Prim-Ed Publishing Primary mathematics
2-D shapes

Teacher resources
Primary mathematics Prim-Ed Publishing www.prim-ed.com xiii
3-D shapes
Teacher resources
xiv www.prim-ed.com Prim-Ed Publishing Primary mathematics
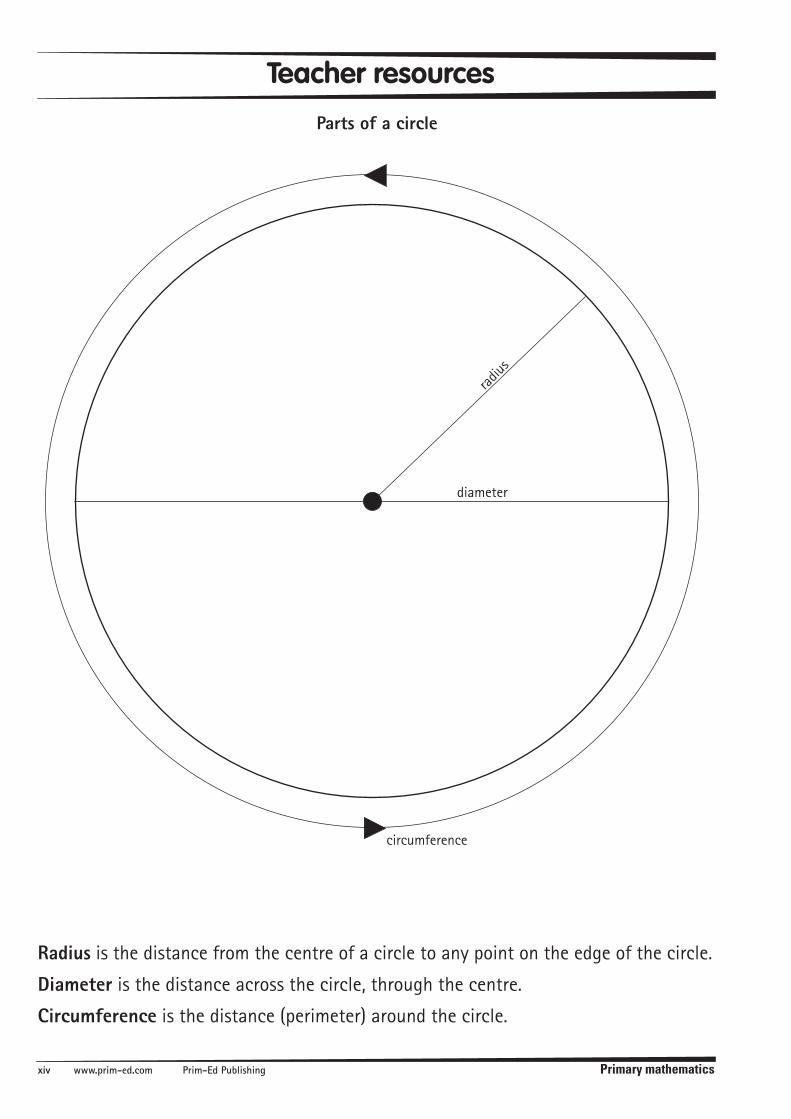
Parts of a circle
radius
diameter
circumference
Radius is the distance from the centre of a circle to any point on the edge of the circle.
Diameter is the distance across the circle, through the centre.
Circumference is the distance (perimeter) around the circle.

Teacher resources
Primary mathematics Prim-Ed Publishing www.prim-ed.com xv
Angles

Teacher resources
xvi www.prim-ed.com Prim-Ed Publishing Primary mathematics
Coordinates in four quadrants
-10 -9 -8 -7 -6 -5 -4 -3 -2 -1 1
1
2
2
3
3
4
4
5
5
6
6
7
7
8
8
9
9
10
10Y
X
-10
-9
-8
-7
-6
-5
-4
-3
-2
-1

Teacher resources
Primary mathematics Prim-Ed Publishing www.prim-ed.com xvii
Bar/Line graphs

TEACHER INFORMATION
92 www.prim-ed.com Prim-Ed Publishing Primary Maths
STATISTICS
SStatistics
Objectives• Interpretandconstructlinegraphsandusethesetosolveproblems. • Calculateandinterpretthemeanasanaverage. Oral work and mental calculation• Usethevocabulary:average, mode, range, most
common, most frequent, spread.
• Investigatetheanswertoaquestion;forexample,What is the most common shoe size in our class? Discuss how to collect the information and how to record it. Display the shoe sizes in order from smallest to largest. Which shoe size is the most common? (This is the mode). What are the smallest and largest shoe sizes? (This is the range).
• Writeaselectionofnumbersontheboard;forexample, 4, 8, 9, 6, 8. Ask pupils to name the mode and the range.
Interactive whiteboard activityInteractive whiteboard activity available to support this copymaster. Visit www.prim-ed.com.
Main teaching activityMode and range of data (page 93)
Additional activities suitable for developing the objectives• Provideaselectionofnumbers;forexample,16,17,
12, 14, 18, 17, 13. Ask pupils to write them from smallest to largest, then identify the mode and range.
• Measureandrecordthetemperatureat12nooneachday for one week. State the mode and the range.
• Lookatagraphshowingtestscoresorracetimes.Work out the mode and range.
Answers1. (a) 8, 22, 22, 23, 26, 29 (b) 22 (c) 8 to 29
2. (a) 18 ºC (b) 14 ºC to 23 ºC
3. (a) 16 ºC, 17 ºC, 18 ºC, 19 ºC, 21 ºC, 21 ºC, 21 ºC, 23 ºC, 24 ºC, 24 ºC, 26 ºC, 27 ºC (b) 21 ºC (c) 16 ºC to 27 ºC
Challenge: Teacher check

Objective
Primary Maths Prim-Ed Publishing www.prim-ed.com 93
SStatistics
CHALLENGEMeasure the height of five classmates. What is the:
(a) mode height? (b) range of heights? to
MODE AND RANGE OF DATA
Finds the mode and range of a set of data.
1. The following runs were scored during a class game of cricket. Calculate the mode (average) by finding the most common score.
Pupils RunsMark 22
Holly 26
Michelle 29
John 22
Sandra 23
Will 8
(a) Order the scores from lowest to highest.
, , , , ,
(b) The mode is .
(c) The range of scores is from to .
2. The temperature was recorded for one week. Calculate the mode (average) temperature for that week.
Sunday 21 ºC
Monday 19 ºC
Tuesday 14 ºC
Wednesday 18 ºC
Thursday 18 ºC
Friday 20 ºC
Saturday 23 ºC
(a) The mode is ºC.
(b) The range of temperatures is from
ºC to ºC.
Mode: The most frequently occurring score and there may be more than one mode; e.g. The data are bimodal, having 8 and 9 occurring the most frequently.
Range: The spread of scores from the lowest to the highest, or a spread in which a category may be placed.
3. Look at the line graph.
(a) Order the temperatures from lowest to highest.
, , , ,
, , , ,
, , ,
(b) The mode is ºC.
(c) The range of temperatures is from
ºC to ºC.

TEACHER INFORMATION
94 www.prim-ed.com Prim-Ed Publishing Primary Maths
STATISTICS
SStatistics
Objective• Calculateandinterpretthemeanasanaverage.
Oral work and mental calculation• Usethevocabulary:average, mode, range, median,
most common, most frequent, spread.
• Investigatetheanswertoaquestion;forexample,What is the most common shoe size in our class? Discuss how to collect the information and how to record it. Display the shoe sizes in order from smallest to largest. Which shoe size is the most common? (This is the mode). What are the smallest and largest shoe sizes? (This is the range). If the shoe sizes are arranged from smallest to largest, what is the middle size? (This is the median).
• Writeaselectionofnumbersontheboard;forexample, 4, 8, 9, 6, 8. Ask pupils to name the mode, range and median.
Main teaching activityMode/Range/Median (page 95)
Additional activities suitable for developing the objective• Provideaselectionofnumbers;forexample,16,17,
12, 14, 18, 17, 13. Ask pupils to write them from smallest to largest, then identify the mode, range and median.
• Measureandrecordthetemperatureat12nooneachday for one week. State the mode, range and median.
• Lookatagraphshowingtestscoresorracetimes.Work out the mode, range and median.
• Inputtestscoresintoacomputer.Usethecomputerto work out the mode, range and median of the test scores.
• Comparethemode,medianandrangeofthetimestaken to travel to school by those pupils who walk and those pupils who travel by car.
• Investigatewhichfootballteamfromagivenselection scored the most goals in one season. Calculate the mode, range and median.
Answers1. (a) 14°C, 15°C, 15°C, 16°C, 17°C, 18°C, 19°C
(b) 14°C to 19°C (c) 16°C (d) 15°C (e) No
2. (a) 5, 7, 8, 10, 12, 12, 14, 15 (b) 5 to 15 (c) 11 (d) 12 (e) No
3. (a) 43%, 52%, 52%, 54%, 61%, 61%, 61%, 69%, 76%, 83%, 89%, 89%, 92%, 95% (b) 43% to 95% (c) 65% (d) 61% (e) No
Challenge: Teacher check

Objective
Primary Maths Prim-Ed Publishing www.prim-ed.com 95
SStatistics
CHALLENGEFind out the class size of every class in your school. Work out the:
(a) range (b) median (c) mode
MODE/RANGE/MEDIAN
Calculatestherange,medianandmodeofasetofdata.
Sunday 17°CMonday 15°CTuesday 14°CWednesday 16°CThursday 15°CFriday 19°CSaturday 18°C
1. The temperature was recorded for one week.(a) Order the temperatures from lowest to highest.
, , , , , , .
(b) The range of temperatures is from to .
(c) The median temperature is .
(d) The mode temperature is .
(e) Are the median and mode temperatures the same? yes no
2. The number of goals scored were recorded for five weeks.(a) Order the number of goals from lowest to highest.
, , , , , , , .
(b) The range of goals scored is from to .
(c) The median score is .
(d) The mode score is .
(e) Are the median and mode scores the same? yes no
3. Look at the maths test results.
(a) Order the test results from lowest to highest.
, , , , , , , , , , , , ,
(b) The range of scores is from to . (c) The median score is .
(d) The mode score is . (e) Are the median and mode scores the same? yes no
Range: The spread of scores from the lowest to the highest, or a spread in which a category may be placed.
Median: The middle score, when scores are arranged in ascending or descending order; e.g. 1, 3, 6, 8 (median), 8, 9, 9 Note: If there were only six scores, then the median would be found 1, 3, 6, 8, 8, 9 6 + 8 14 ÷ 2 = 7 2
Mode: The most frequently occurring score. There may be more than one mode; e.g. The data are bimodal, having 8 and 9 occurring most frequently.
Sunday 17°CMonday 15°CTuesday 14°CWednesday 16°CThursday 15°CFriday 19°CSaturday 18°C
Arsenal 5Aston Villa 12Chelsea 7Manchester United 15Newcastle United 12Liverpool 10Tottenham 14West Ham 8
Arsenal 5Aston Villa 12Chelsea 7Manchester United 15Newcastle United 12Liverpool 10Tottenham 14West Ham 8
52% 76% 61% 54% 52% 95% 61% 69% 83% 89% 43% 89% 61% 92%52% 76% 61% 54% 52% 95% 61% 69% 83% 89% 43% 89% 61% 92%

TEACHER INFORMATION
96 www.prim-ed.com Prim-Ed Publishing Primary Maths
STATISTICS
SStatistics
Objective• Calculateandinterpretthemeanasanaverage.
Oral work and mental calculation• Usethevocabulary:average, mode, range, median,
mean, most common, most frequent, spread.
• Demonstratehowtocalculatethemeanbyaddinga group of data and dividing by the number in the group.
• Investigatetheanswertoaquestion;forexample,What is the most common shoe size in our class? Discuss how to collect the information and how to record it. Display the shoe sizes in order from smallest to largest. Which shoe size is the most common? (This is the mode). What are the smallest and largest shoe sizes? (This is the range). If the shoe sizes are arranged from smallest to largest, what is the middle size? (This is the median). Which is the average shoe size? (This is the mean).
• Writeaselectionofnumbersontheboard;forexample, 4, 8, 9, 6, 8. Ask pupils to name the mode, range, median and mean.
Main teaching activityCalculating the mean (page 97)
Additional activities suitable for developing the objective• Provideaselectionofnumbers;forexample,16,17,
12, 14, 18, 17, 13. Ask pupils to write them from smallest to largest, then identify the mode, range, median and mean.
• Measureandrecordthetemperatureat12nooneachday for one week. State the mode, range, median and mean.
• Lookatagraphshowingtestscoresorracetimes.Work out the mode, range, median and mean.
• Inputtestscoresintoacomputer.Usethecomputerto work out the mode, range, median and mean of the test scores.
• Comparethemode,mean,medianandrangeofthetimes taken to travel to school by those pupils who walk and those pupils who travel by car.
• Investigatewhichfootballteamfromagivenselection scored the most goals in one season. Calculate the mode, mean, range and median.
Answers1. 156 ÷ 6 = 26
2. (a) 168 mm ÷ 12 (b) 14 mm
3. Teacher check
4. 95%
5. 328.6 km
Challenge: £565 299.80

Objective
Primary Maths Prim-Ed Publishing www.prim-ed.com 97
SStatistics
CHALLENGEUse your calculator to find the mean house price.
£285 499, £585 000, £420 500, £555 000, £980 500
CALCULATING THE MEAN
Calculatesthemeanofasetofdata.
You can calculate the mean or average of something by adding a group of data and dividing the total by the number in the group; for example, Harry weighs 44 kg, Alex weighs 40 kg, Jessica weighs
38 kg and Belinda weighs 42 kg; therefore, 44 + 40 + 38 + 42 = 164 kg ÷ 4 pupils = 41 kg. 41 kg is the average weight of the four children.
1. The following goals were scored and recorded during a football season. Calculate the mean (average) by adding the scores together then dividing that number by the number of goal kickers there are. You may wish to use a calculator.
Total score =
÷
Mean (average) goals =
2. The rainfall was recorded monthly for one year. Calculate the mean (average) monthly rainfall.
(a) Total = mm ÷
(b) The average monthly rainfall was mm.
3. Measure the height of five classmates in centimetres and record the results. Find the mean by adding the amounts together then dividing by five.
Mean = cm
4. Find the mean of the following results.
100%, 95%, 80%, 100%, 100%, 90%, 95%, 100%.
Players Goals
William 27
Xin 36
Thomas 15
Hajid 21
Jade 39
Tarah 18
5. Calculate the mean distance travelled over five days.
139 km, 522 km, 381 km, 413 km, 188 km.
Jan. Feb. March April May June July Aug. Sep. Oct. Nov. Dec.
28 mm 26 mm 22 mm 23 mm 8 mm 5 mm 3 mm 4 mm 9 mm 11 mm 13 mm 16 mm
Jan. Feb. March April May June July Aug. Sep. Oct. Nov. Dec.
28 mm 26 mm 22 mm 23 mm 8 mm 5 mm 3 mm 4 mm 9 mm 11 mm 13 mm 16 mm
Name
Height
Name
Height

TEACHER INFORMATION
98 www.prim-ed.com Prim-Ed Publishing Primary Maths
STATISTICS
SStatistics
Objectives• Interpretandconstructlinegraphsandusethesetosolveproblems.
• Calculateandinterpretthemeanasanaverage.
Oral work and mental calculation• Usethevocabulary:average, mode, range, median,
mean, most common, most frequent, spread.
• Investigatetheanswertoaquestion;forexample,What is the most common shoe size in our class? Discuss how to collect the information and how to record it. Display the shoe sizes in order from smallest to largest. Which shoe size is the most common? (This is the mode). What are the smallest and largest shoe sizes? (This is the range). If the shoe sizes are arranged from smallest to largest, what is the middle size? (This is the median). Which is the average shoe size? (This is the mean).
• Writeaselectionofnumbersontheboard;forexample, 4, 8, 9, 6, 8. Ask pupils to name the mode, range, median and mean.
Interactive whiteboard activityInteractive whiteboard activity available to support this copymaster. Visit www.prim-ed.com.
Main teaching activityMode/Range/Median/Mean (page 99)
Additional activities suitable for developing the objectives• Provideaselectionofnumbers;forexample,16,17,
12, 14, 18, 17, 13. Ask pupils to write them from smallest to largest, then identify the mode, range, median and mean.
• Measureandrecordthetemperatureat12nooneachday for one week. State the mode, range, median and mean.
• Lookatagraphshowingtestscoresorracetimes.Work out the mode, range, median and mean.
• Inputtestscoresintoacomputer.Usethecomputerto work out the mode, range, median and mean of the test scores.
• Comparethemode,mean,medianandrangeofthetimes taken to travel to school by those pupils who walk and those pupils who travel by car.
• Investigatewhichfootballteamfromagivenselection scored the most goals in one season. Calculate the mode, mean, range and median.
Answers1. (a) 16 °C to 27 °C (b) 21.42 °C
(c) 21 °C (d) 21 °C
Challenge: Teacher check

Objective
Primary Maths Prim-Ed Publishing www.prim-ed.com 99
SStatistics
CHALLENGE
Calculate the range, mean, median and mode for a set of class test results.
MODE/RANGE/MEDIAN/MEAN
Calculatestherange,median,meanandmodeofasetofdata.
1. Look at the line graph below.
(a) The range of measures are from
to .
(b) The mean temperature for Newtown
Community is .
(c) The median temperature is .
(d) The mode temperature for Newtown
Community is .
Range: The spread of scores from the lowest to the highest, or a spread in which a category may be placed.
Median: The middle score, when scores are arranged in ascending or descending order; e.g. 1, 3, 6, 8 (median), 8, 9, 9 Note: If there were only six scores, then the median would be found 1, 3, 6, 8, 8, 9 6 + 8 14 ÷ 2 = 7 2
Mean: The total of a set of scores divided by the number of scores; e.g. 1 + 3 + 6 + 8 + 8 + 9 + 9 7
Mode: The most frequently occurring score. There may be more than one mode; e.g. The data are bimodal, having 8 and 9 occurring most frequently.