primary school examination preliminary … · results of the 2011 primary school examination (pse)....
TRANSCRIPT

Ministry of Education and YouthTo Educate! To Transform! To Liberate!
PRIMARY SCHOOL EXAMINATION PRELIMINARY RESULTS 2011
The Ministry of Education and Youth hereby issues the official results of the 2011 Primary School Examination (PSE).
Student PopulationA total of 6,962 students (including private candidates as well as those who attend alternative schools) registered for the PSE in 2011. Of this total 177 were absent for all parts of the examination while 32 were present for some parts but not all.
Purpose and Intended Use of the Primary School ExaminationThe PSE assesses achievement of curriculum content and skills in the four (4) areas of English, Mathematics, Social Studies and Science of the National Primary School Curriculum. The examination is criterion-referenced meaning that performance of “each individual is compared with a preset standard for acceptable achievement…The performance of other examinees is irrelevant.”1 In this way, the examination seeks not to rank students in comparison to other students (as in norm-referencing) but to report what each student has achieved for individual skills. This is expressed as a percentage score. The results of the examination are intended to be used for two main purposes:
1. Certification of Students at the completion of primary school in four content areas of the primary curriculum; and
2. Educational decision-making to inform policy, planning and practice at national, district, school and classroom levels.
The PSE is not and was never intended to be used as the sole criteria for entrance into secondary schools. Secondary schools are advised to use multiple sources of evidence of students’ achievement and holistic development at primary school to get a more complete picture of the students’ abilities, strengths and
1 See the following link for comparison criterion and norm-referenced tests: http://chiron.valdosta.edu/whuitt/col/measeval/crnmref.html

weaknesses in informing acceptance to and placement in high schools.
While the Ministry of Education will be recognizing outstanding students who have done well on the PSE, the Ministry of Education cautions that making judgments about schools and teachers on the basis of individual student performances is inappropriate. In the first instance, the performance of one or a few may not be reflective of the many, and secondly schools are not all the same. Therefore making judgments of individual schools’ effectiveness on this basis without considering inputs (resources) available to individual schools and without considering background and contextual factors (socio-economic and family backgrounds and communities in which schools are located) of each school is not only inappropriate, but unfair. Additionally, there is a tendency to either praise or criticize the Standard six teachers depending on the performance of students on the PSE. The Ministry of Education wishes to note that it is the school as a whole that is responsible for delivering the curriculum—educating the students. Teachers should therefore not be considered independent practitioners, like general practitioner doctors, for whom the school is simply a base. Rather it is the school as a whole that is responsible for the educational development of the students, rather than individual teachers alone. Therefore, the school is to be viewed as a team of teachers led by a principal who is instructional as well as administrative leader with the management being responsible for monitoring and providing support. Schools, teachers and managements should not use resources (or lack thereof) or background and contextual factors of their students and schools as justification to sit back and not seek improvement. There should be collective responsibility and ownership to always seek improvements in quality.
What the PSE Attempts to Assess/MeasureFollowing from the purpose of the PSE, the construction of the examination is guided by a table of specifications which specifies what curriculum content and skills are to be tested, that is what curriculum content and skills will form the basis of the questions set. See attached annexes for Table of Specifications.
The Primary School Examination Results for 2011

Below are tables showing various statistics for this year’s PSE as well an 12-year trend of performance by subject (for Social Studies an 8-year trend is shown since Social Studies was re-introduced in 2004) for each district and the country as a whole. Scores are interpreted according to the following grade bands indicating different levels of achievement/performance.
Letter Grade Description (Grade Range/Band)A Excellent (80-100%)B Competent (70-79%)C Satisfactory (60-69%)D Adequate (50-59%)E Inadequate (49% and below)
National Performance on PSE by Subjects
Mean Median
Mode Grade/Description/ Grade Range
Science Total (100) 64.38 66.00 C (Satisfactory, 60-69)Social Studies Total (100)
63.85 66.00 C (Satisfactory, 60-69)
Combined Math Total (100)
47.16 45.00 E (Inadequate, below 50)
Combined English Total (100)
54.9 56.00 E (Inadequate, below 49)
In English, the mean score was in the adequate range at 54.9 About 39% of the students earned a grade C (Satisfactory Level of Performance) or better but of concern is that roughly 32% scored E’s. Half the number of students’ scores were below and half above the score of 56 as indicated by the median score.
In Math, the mean score of 47.16 was in the inadequate range. The mode grade of E (0-49) indicates that most students scored in the inadequate range. About 28% of students earned a grade C (Satisfactory Level of Performance) or better. Half the number of students were above and half below the median score of 45.
In Social Studies, the mean score was 63.85 in the satisfactory band while the mode grade of C (60-69) indicates that most students were in the satisfactory range. Sixty-six (66%) of students earned a grade C (Satisfactory Level of Performance) or better. The median score of 66 indicates that half the students were above and half below this score.
In Science, the mean score of 64.38 was in the satisfactory band. The mode grade of C (60-69) indicates that most students scored

50.5
54.9
55.3
57.3
52.7
60.2
58.4
5863.5
54.9
41.8
41.9
54.9
42.8
45.8
45.6
53.7
46.2
52.9
47.2
58.9
526753.3
54.3
59.1
64.6
60.9
69.9
64.4
60.9
60.7
59.2
59.9
68.8
60.7
63.8
63.9
010203040506070802002
2003
2004
2005
2006
2007
2008
2009
2010
2011
English
Math
Science
Social Studies
at the satisfactory level. Sixty-seven (67%) percent of the students earned a grade C (Satisfactory Level of Performance) or better. Half the students scored above 66 and half below as indicated by the median score.
Trends in Mean PerformanceThe graph below shows the trends in mean performance by subject since 2002.
Graph 1
Examining trends in national mean performance by subject since 2002, much fluctuation over the years is observed with scores ranging mostly between 40% to 60% with some spikes above 60% in Science and Social Studies. Over the 10 years shown national mean scores in various subjects have remained more or less stable.
The graphs that follow show trends in mean performance by individual subject over the twelve year period 2000-2011. The straight line above/across the bars indicates the trend over this period. Again in each case, fluctuations are noted.
Graph 2-English
10-Year National Mean Performance Trend by Subject

52.8 52.9 50.5 54.9 55.3 57.3 52.7
60.2 58.4 58 63.5
54.9
0
10
20
30
40
50
60
70
2000 2001 2002 2003 2004 2005 2006 2007 2008 2009 2010 2011
Mean Performance - English
In English, the mean score (54.9%) shows an 8 percentage point decrease compared to the 2010 mean score. With the spikes in 2007 and 2010 to the satisfactory level, the data suggests that greater national achievement gains are possible.
Graph 3-Math

44 46.5 41.8 41.9
54.9
42.8 45.8 45.6
53.7
46.2
52.9 47.1
0
10
20
30
40
50
60
2000 2001 2002 2003 2004 2005 2006 2007 2008 2009 2010 2011
Mean Performance - Math
For Math, the national mean score has remained more or less constant over the twelve years shown with spikes in 2004, 2008 and 2010. The 2011 mean score of 47.16 represents a decrease of more than 5 percentage points over last year.
Graph 4-Social Studies
60.9 60.7 59.2 59.9 68.8 60.7 63.8 63.8
0
10
20
30
40
50
60
70
80
2004 2005 2006 2007 2008 2009 2010 2011
Mean Performance - Social Studies
In Social Studies, the scores have remained more or less steady from 2004 to 2007 and in 2009 but a sharp increase is noted in 2008. In 2010 and 2011, the mean scores of 63.8 and 63.85 respectively are lower than the spike seen in 2008 but it is an increase over all other years including 2009. Overall, performance in Social Studies achievement appears to be stable.
Graph 5- Science
51.3
58 58.9 52
67
53.3 54.3 59.1 64.6 60.9
69.9 64.3
0
10
20
30
40
50
60
70
80
2000 2001 2002 2003 2004 2005 2006 2007 2008 2009 2010 2011
Mean Performance - Science
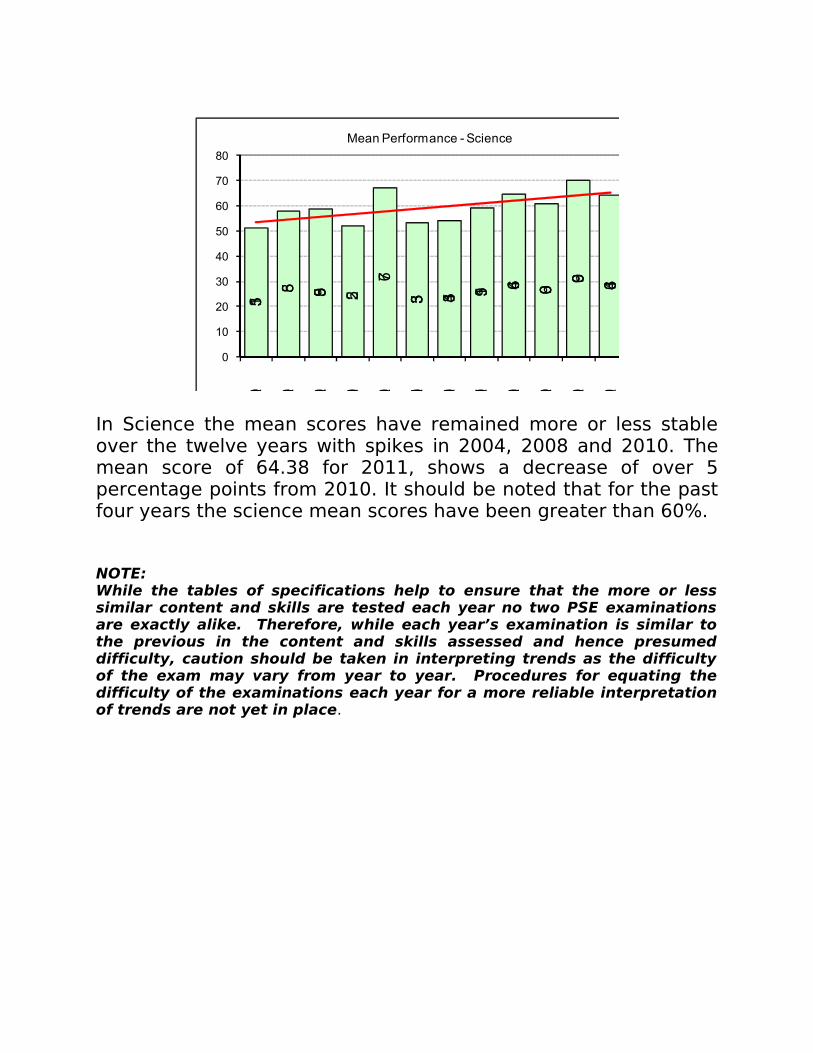
In Science the mean scores have remained more or less stable over the twelve years with spikes in 2004, 2008 and 2010. The mean score of 64.38 for 2011, shows a decrease of over 5 percentage points from 2010. It should be noted that for the past four years the science mean scores have been greater than 60%.
NOTE:While the tables of specifications help to ensure that the more or less similar content and skills are tested each year no two PSE examinations are exactly alike. Therefore, while each year’s examination is similar to the previous in the content and skills assessed and hence presumed difficulty, caution should be taken in interpreting trends as the difficulty of the exam may vary from year to year. Procedures for equating the difficulty of the examinations each year for a more reliable interpretation of trends are not yet in place.

USING THE EXAMINATION RESULTS TO IMPROVE TEACHING AND LEARNING: WHAT IS TO BE DONEThe results show that national mean performance by subject on PSE has remained more or less stable over the last eleven years with slight upward trend in each subject. It is important to note however, that means or averages do not necessarily give the most complete picture of performance. It is therefore important to note how our students are distributed across the various grade ranges/bands which appear below in this release.
Overall results on the PSE 2011 show a dip in all areas tested. While there seems to have been an overall upward trend over the years there have been fluctuations in the results from year to year. It is difficult to say with certainty that this year’s decline is not due to the normal variability from year to year. That said, the results this year give cause for concern, particularly in the areas of English and Mathematics.
It is important to note that the emphasis here is and will not be to blame, point fingers, or attempt to shame teachers and schools. Pointing fingers or blaming does no good if we are to improve. Rather the emphasis must be on how we can improve teaching and learning in our schools. The improvement of teaching and learning in classrooms is not merely a matter for teachers but for principals and managements as well. All concerned—teachers, principals, parents, managements and the Ministry of Education and Youth—must take ownership for the quality of education in our schools. The Ministry of Education is currently piloting a Quality Schools Framework and accompanying process at which ownership for the quality of education services delivered is a central principle. Therefore, while the Ministry of Education will take the lead in this endeavor, it is also the responsibility of the managements and individual schools to analyze their own school results to determine areas of strengths and weaknesses and to plan and implement interventions to address the areas of weakness. This must be done with a sense of collective responsibility.
In this regard, the Ministry of Education and Youth, through support from the Inter-American Development Bank, will be piloting a teacher training module in the teaching of primary education mathematics and to develop capacity within the Ministry of Education and Youth in the areas of teaching of mathematics. This is expected to commence in the coming school year. Additionally, as a short-term measure, the Ministry of Education and Youth is planning summer school in English and Math in each district for students going into Standard 6 identified to be in need additional support in these areas.

Distribution of Scores by Grade Band by SubjectEnglish Science Mathematics Social Studies
Grade
Score
Range
Description No. of
Students
% of Studen
tsNo. of
Students
% of Studen
ts
No. of Stude
nts
% of Studen
ts
No. of Stude
nts
% of Studen
ts
A80-100
Excellent209 3 1024 15 497 7 973 14
B 70-79Competen
t 799 12 1686 25 579 9 1746 26
C 60-69Satisfacto
ry 1589 24 1813 27 826 12 1754 26D 50-59 Adequate 1942 29 1238 18 973 14 1189 18
E 0-49Inadequat
e 2185 32 982 14 3865 57 1078 16Totals 6724 100.0% 6724 100.0% 6740 100.0% 6740 100.0%
% Students with Satisfactory Performance (Grade C) or
Better 39% 67% 28% 66%
Percentages highlighted in red indicate the grade band where the greatest proportion of students scored for the given subject and overall.Note: In the figures above if a student was absent for a part of the exam there score was not included in the calculations for that part.This accounts for different totals for each subject and overall

District and Country Performance by Subject by Abilities (Skills Assessed)
SUBJECT District Comprehension (30 items^)Mechanics(20 items)
Letter Writing(20 points)
Composition(30 points)
English
Belize 64.4% 55.0% 51.7% 49.8%
Cayo 64.5% 53.6% 50.5% 50.6%
Corozal 62.0% 54.1% 50.2% 49.4%Orange Walk 63.4% 53.8% 53.5% 50.3%Stann Creek 59.2% 49.6% 49.7% 47.3%
Toledo 57.5% 48.7% 45.9% 48.5%
Country 61.8% 52.5% 50.2% 49.3%
SUBJECT District Computation (20 items)Concepts(30 items) Problem Solving^^ (50 pts)
Math
Belize 50.6% 43.9% 43.9%
Cayo 51.5% 46.5% 45.4%
Corozal 54.2% 49.5% 46.7%Orange Walk 53.6% 49.7% 51.0%Stann Creek 48.3% 42.3% 42.2%
Toledo 47.2% 42.1% 42.8%
Country 50.9% 45.7% 45.3%
^Note: An item is a question (multiple choice in this case) on the test. Each multiple choice is valued 1pt.
^^Note: The Problem Solving Section of the Mathematics is not multiple choice but word problems which require candidates to show their working.
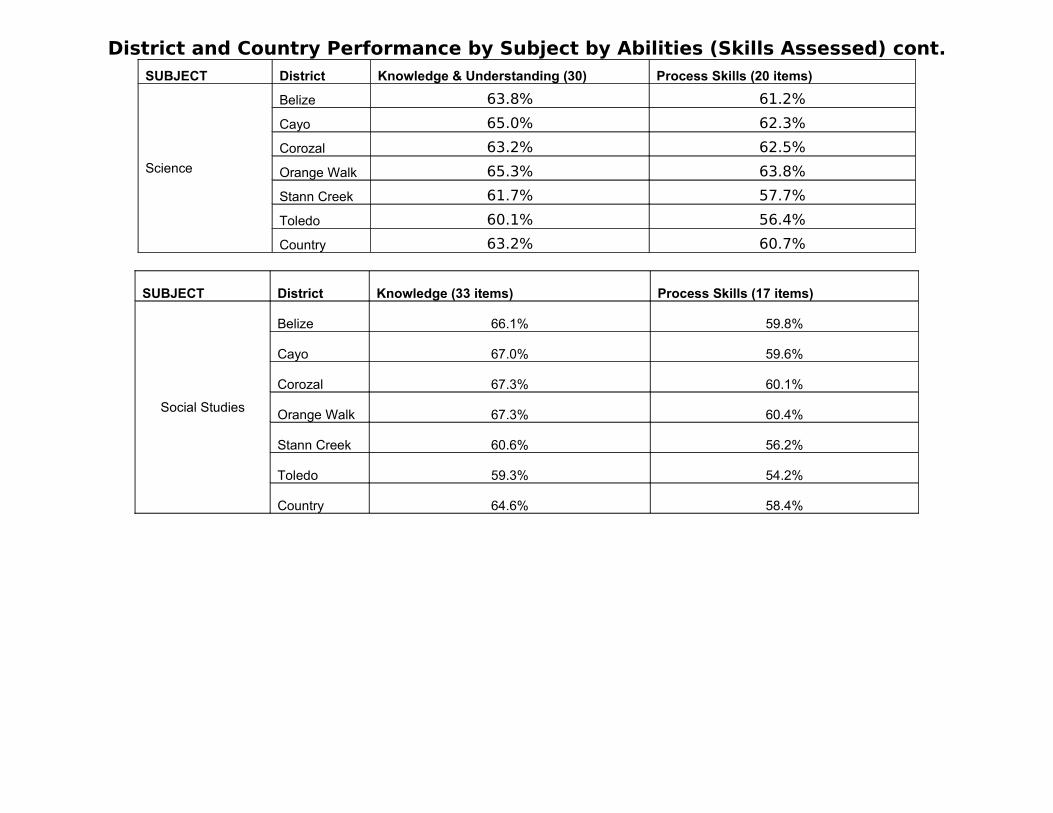
District and Country Performance by Subject by Abilities (Skills Assessed) cont.SUBJECT District Knowledge & Understanding (30) Process Skills (20 items)
Science
Belize 63.8% 61.2%
Cayo 65.0% 62.3%
Corozal 63.2% 62.5%
Orange Walk 65.3% 63.8%
Stann Creek 61.7% 57.7%
Toledo 60.1% 56.4%
Country 63.2% 60.7%
SUBJECT District Knowledge (33 items) Process Skills (17 items)
Social Studies
Belize 66.1% 59.8%
Cayo 67.0% 59.6%
Corozal 67.3% 60.1%
Orange Walk 67.3% 60.4%
Stann Creek 60.6% 56.2%
Toledo 59.3% 54.2%
Country 64.6% 58.4%
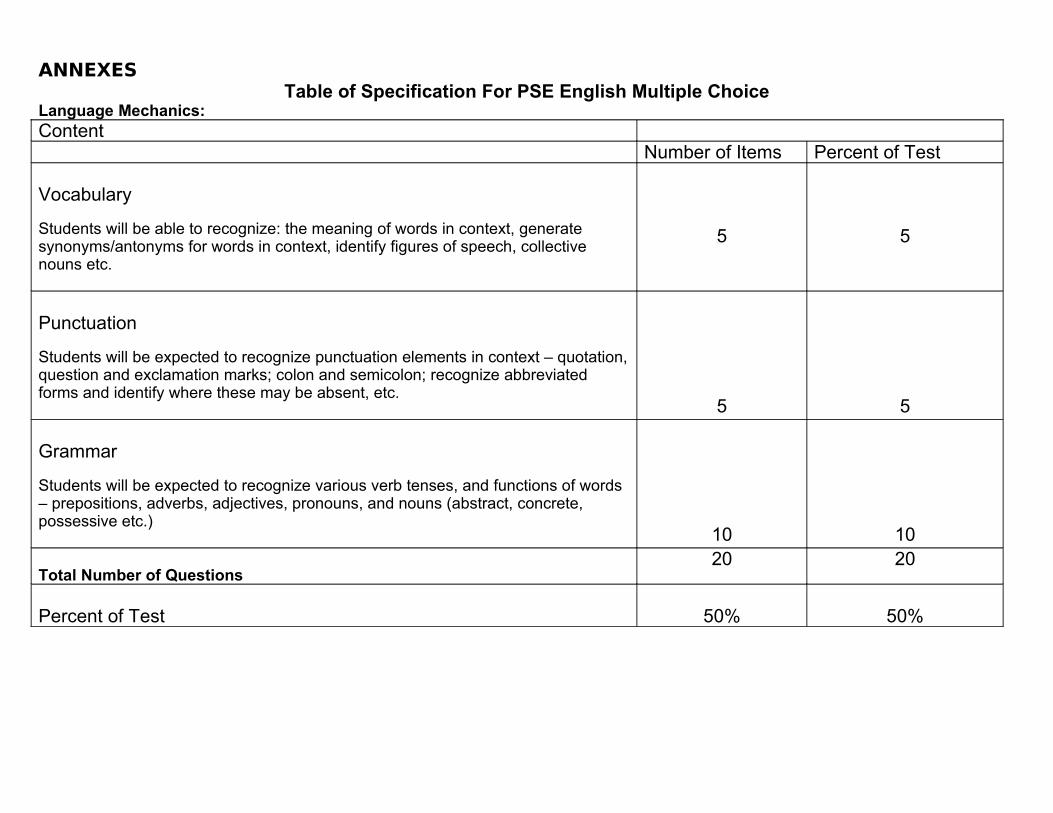
ANNEXESTable of Specification For PSE English Multiple Choice
Language Mechanics:Content
Number of Items Percent of Test
Vocabulary
Students will be able to recognize: the meaning of words in context, generate synonyms/antonyms for words in context, identify figures of speech, collective nouns etc.
5 5
Punctuation
Students will be expected to recognize punctuation elements in context – quotation, question and exclamation marks; colon and semicolon; recognize abbreviated forms and identify where these may be absent, etc.
5 5
Grammar
Students will be expected to recognize various verb tenses, and functions of words – prepositions, adverbs, adjectives, pronouns, and nouns (abstract, concrete, possessive etc.)
10 10
Total Number of Questions20 20
Percent of Test 50% 50%

ANNEXES cont.Reading Comprehension:Content Questions Number of
QuestionsPercent of TestInformal Narrative
Literal Comprehension
Students should be able to recognize explicit relationships among settings, events, characters, and ideas presented in reading selections.
3 3 6 20%
Critical Comprehension
Students should be able to analyze the reading selections and recognize the author’s techniques, determine the author’s purpose, and use text and typographical features to assist in interpreting the selections.
3 4 7 23%
Inferential Comprehension
Students should be able to recognize inferred or implicit relationships among settings, events, characters, and ideas presented in the reading selections.
5 5 10 33%
Insightful Comprehension
Students should be able to draw conclusions, make generalizations, and/or predict plausible outcomes by synthesizing information from the entire reading selection.
3 4 7 23%
Total Number of Questions 14 16 30 100%
Percent of Test 47% 53% 100%
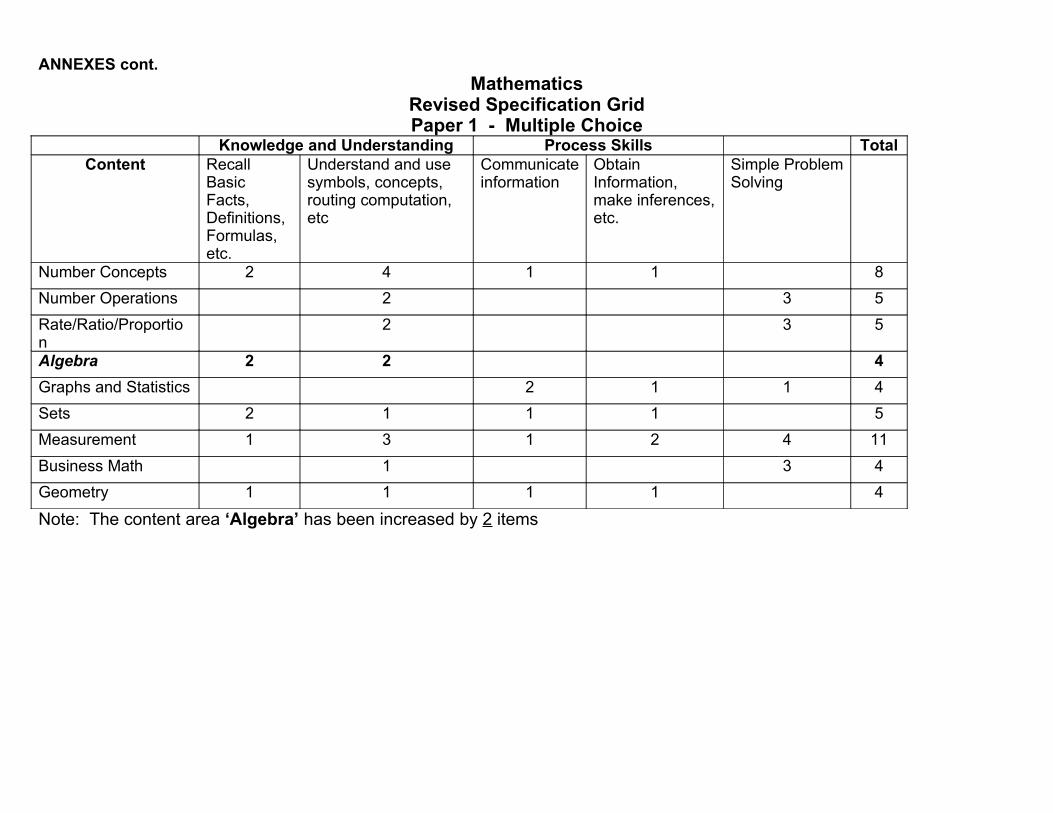
ANNEXES cont.Mathematics
Revised Specification GridPaper 1 - Multiple Choice
Knowledge and Understanding Process Skills TotalContent Recall
Basic Facts, Definitions, Formulas, etc.
Understand and use symbols, concepts, routing computation, etc
Communicate information
Obtain Information, make inferences, etc.
Simple Problem Solving
Number Concepts 2 4 1 1 8
Number Operations 2 3 5
Rate/Ratio/Proportion
2 3 5
Algebra 2 2 4
Graphs and Statistics 2 1 1 4
Sets 2 1 1 1 5
Measurement 1 3 1 2 4 11
Business Math 1 3 4
Geometry 1 1 1 1 4
Note: The content area ‘Algebra’ has been increased by 2 items

ANNEXES cont.Mathematics
Revised Specification GridPaper 2 – Problem Solving
Content Number of items Percent of testNumber Operations 1 5Graphs and Statistics 1 5Measurement 3 15Business Math 3 15Rate/Ratio/Proportion 2 10
Total 10 50Note: The content area ‘Number Operations’ has been added to this paper replacing Rational Numbers in paper 1.

ANNEXES cont.Specification Grid for PSE Science
The following is a Blueprint Summary Table displaying the reporting categories, Number of test items in each category, learning outcomes included in each category and the ability levels at which items are distributed. It is designed to show links between the PSE Science Table of Specifications and the outcome areas in the national comprehensive curriculum.
Item DistributionReporting Categories National Syllabus
Reporting Categories PSE Table of Specifications
Curriculum Outcomes Knowledge and Understanding
Process Skills
Total
Living ThingsHealth lifestylesHealthy EnvironmentSpread of Disease
OurselvesST7.a;
H1.a; H1.b; H1.c; H1.dH2.aH3.a
10 5 15
Living ThingsThe Environment Plants, Rocks and Soil
ST7.a; ST7.bST8.a; ST8.b
5 5 10
Time and Motion, Forces and Simple Machines
Pushes and Pulls MachinesST6.b 2 2 4
Gravity and All ThatST3.a; ST4.a; ST6.a 3 2 5
Making things moveST6.a; ST6.b 3 1 4
Matter and Energy Light ST5.a; ST5.b 3 1 4Heat ST5.a; ST5.b 2 2 4
Sound ST5.a; ST5.b 2 2 4Total 30 20 50
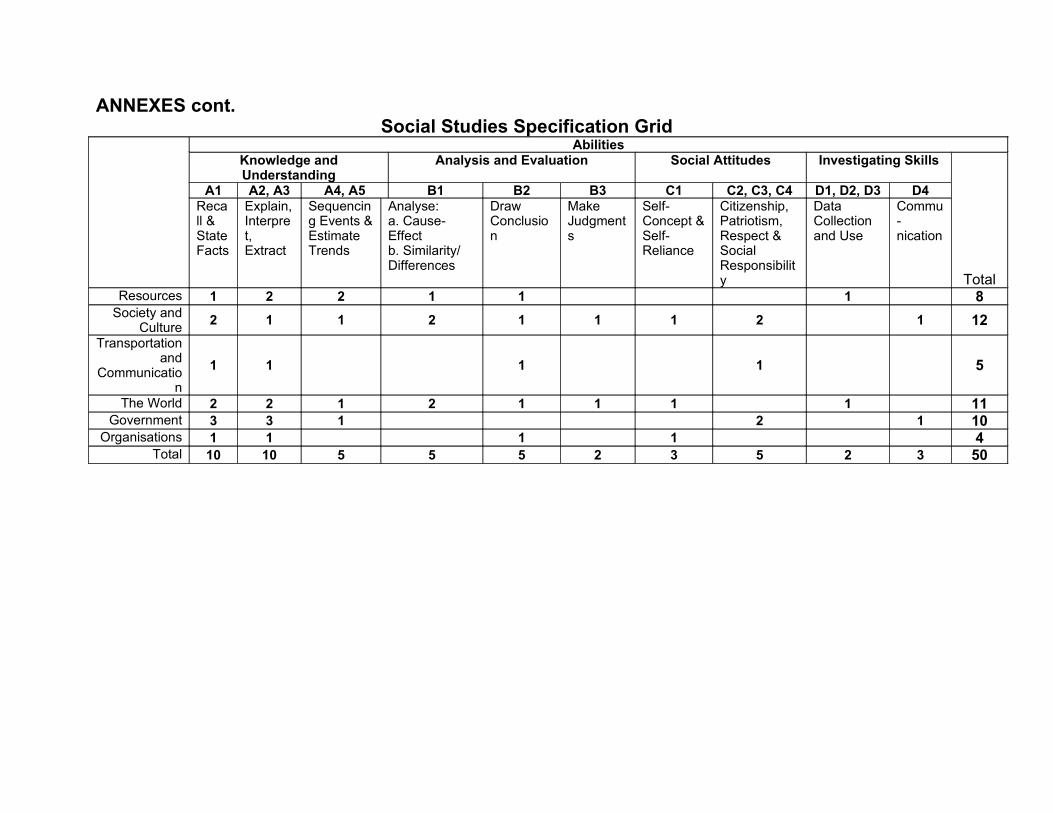
ANNEXES cont.Social Studies Specification Grid
AbilitiesKnowledge and Understanding
Analysis and Evaluation Social Attitudes Investigating Skills
Total
A1 A2, A3 A4, A5 B1 B2 B3 C1 C2, C3, C4 D1, D2, D3 D4Recall & State Facts
Explain, Interpret, Extract
Sequencing Events & Estimate Trends
Analyse: a. Cause-Effectb. Similarity/ Differences
Draw Conclusion
Make Judgments
Self-Concept & Self-Reliance
Citizenship, Patriotism, Respect & Social Responsibility
Data Collection and Use
Commu-nication
Resources 1 2 2 1 1 1 8Society and
Culture2 1 1 2 1 1 1 2 1 12
Transportation and
Communication
1 1 1 1 5
The World 2 2 1 2 1 1 1 1 11Government 3 3 1 2 1 10
Organisations 1 1 1 1 4Total 10 10 5 5 5 2 3 5 2 3 50

PSE 2011 – NATIONAL TOP PERFORMERSRAN
K NAME SCHOOLTOTA
LLETTE
RDESCRIPTIO
N
1 MARIN ALIYAH L HOLY REEDEMER BZ 385 A Excellent
2 MCGANN JOSETTE AUNITED EVRGREEN CY 376 A Excellent
3 MURILLO JORDAN A BZE ELEMENTARY BZ 369 A Excellent
4GUTIERREZ ALESSANDRA SAN PEDRO RC BZ 368 A Excellent
5 RAMIREZ KATE BERNICE YORKE BZ 368 A Excellent
6ARMSTRONG ADRIAN A LOUISIANA GOV OW 368 A Excellent
7 HUNG EMILELADY OF GUAD RC CY 367 A Excellent
8 CAN JOSHUA ST JOSEPH RC BZ 365 A Excellent
9 FABRO LUANI M HOLY REEDEMER BZ 364 A Excellent
10 WU GIN YUAN BZE ELEMENTARY BZ 364 A Excellent
11 CRAIG ALYSSA AHORIZON ACADEMY BZ 364 A Excellent
12 MYVETTE JASMINE U PANCOTTO PRI BZ 363 A Excellent
13 CHANG ERIC S BZE ELEMENTARY BZ 362 A Excellent
14 CASTILLO AMERIE A HOLY REEDEMER BZ 361 A Excellent
15MAGANA ALEJANDRO O
UNITED EVRGREEN CY 361 A Excellent
16HERNANDEZ GISELLIE LOUISIANA GOV OW 360 A Excellent
17 OCHAETA ELODIA BERNICE YORKE BZ 360 A Excellent
18 CHAVEZ JUAN JUNITED EVRGREEN CY 360 A Excellent
19 VASQUEZ KENSIE J ST IGNATIUS RC BZ 360 A Excellent
20 CASTILLO ILENE ILADY OF GUAD RC CY 359 A Excellent
21 ALAMINA ALEYDA M HOLY REEDEMER BZ 359 A Excellent
22 XIAO JIA YI BZE ELEMENTARY BZ 359 A Excellent
23 VALLE ISAIASSHEPHERDS ACAD CY 358 A Excellent
24 RODRIGUEZ GISELLE LOUISIANA GOV OW 358 A Excellent
25 BURROWES KAYLA AHUMMINGBIRD ELE BZ 358 A Excellent

PSE 2011 –TOP PERFORMERS BY DISTRICTBELIZE DISTRICT
NO NAME SCHOOL SCORE
1 MARIN ALIYAH LHOLY REEDEMER BZ
385 A
Excellent
2 MURILLO JORDAN ABZE ELEMENTARY BZ
369 A
Excellent
3GUTIERREZ ALESSANDRA SAN PEDRO RC BZ
368 A
Excellent
4 RAMIREZ KATE BERNICE YORKE BZ368 A
Excellent
5 CAN JOSHUA ST JOSEPH RC BZ365 A
Excellent
6 WU GIN YUANBZE ELEMENTARY BZ
364 A
Excellent
7 FABRO LUANI MHOLY REEDEMER BZ
364 A
Excellent
8 CRAIG ALYSSA AHORIZON ACADEMY BZ
364 A
Excellent
9 MYVETTE JASMINE U PANCOTTO PRI BZ363 A
Excellent
10 CHANG ERIC SBZE ELEMENTARY BZ
362 A
Excellent
CAYO DISTRICT
1 MCGANN JOSETTE AUNITED EVRGREEN CY
376 A
Excellent
2 HUNG EMILELADY OF GUAD RC CY
367 A
Excellent
3MAGANA ALEJANDRO O
UNITED EVRGREEN CY
361 A
Excellent
4 CHAVEZ JUAN JUNITED EVRGREEN CY
360 A
Excellent
5 CASTILLO ILENE ILADY OF GUAD RC CY
359 A
Excellent
6 VALLE ISAIASSHEPHERDS ACAD CY
358 A
Excellent
7WADE ANWAR JAMAAL BISHOP MARTIN CY
355 A
Excellent
8 MURPHY KUANYEE KLADY OF GUAD RC CY
355 A
Excellent
9 HULSE GABRIELLE MLADY OF GUAD RC CY
354 A
Excellent
10 COYE ALEXANDERLADY OF GUAD RC CY
354 A
Excellent
COROZAL DISTRICT
1 CHANG SAMUEL COROZAL METH CZ357 A
Excellent
2MAGANA GEOVAHN A CALCUTTA SDA CZ
352 A
Excellent
3 SMART GIA CALCUTTA SDA CZ348 A
Excellent
4 SALAZAR DANIECE J MARY HILL RC CZ347 A
Excellent

5 LOPEZ ERICK JR ST FRANCIS XR CZ346 A
Excellent
6 SWASO KIMANI K COROZAL METH CZ346 A
Excellent
7 SU XIAOHUA ST FRANCIS XR CZ344 A
Excellent
8 VARGAS JOSHUA E MARY HILL RC CZ344 A
Excellent
9 CASTANEDA JAHDIELSANTA CLA ROMAN CZ
344 A
Excellent
10LEONARDO VANNIA L MARY HILL RC CZ
343 A
Excellent
ORANGE WALK DISTRICTNO NAME SCHOOL SCORE
1ARMSTRONG ADRIAN A
LOUISIANA GOV OW
368 A
Excellent
2HERNANDEZ GISELLIE
LOUISIANA GOV OW
360 A
Excellent
3RODRIGUEZ GISELLE
LOUISIANA GOV OW
358 A
Excellent
4 BAEZA VLADIMIRLOUISIANA GOV OW
356 A
Excellent
5DOMINGUEZ RUAN M
LA INMACULADA OW
354 A
Excellent
6 TUN DANISHA MLA INMACULADA OW
354 A
Excellent
7FIGUEROA AMILCAR N COMPASSION OW
353 A
Excellent
8 MOLINA CHRISTIANTRIAL FARM GOV OW
352 A
Excellent
9 OSORIO PAOLALA INMACULADA OW
348 A
Excellent
10 PEREZ MARIA VLOUISIANA GOV OW
345 A
Excellent
STANN CREEK DISTRICT
1MIRANDA CHRISTIAN
SACRED HEART RC SC
351 A
Excellent
2 MOLINA WUILSONSACRED HEART RC SC
348 A
Excellent
3 BAILEY ISAIAHSOLID ROCK CRST SC
345 A
Excellent
4 MOREIRA NKACEY MHOLY GHOST RC SC
344 A
Excellent
5 MELGAR YENI OHOLY GHOST RC SC
341 A
Excellent
6YSAGUIRRE AALIYAH
SACRED HEART RC SC
340 A
Excellent
7 OJEDA ABIMAEL SHOLY FAMILY RC SC
338 A
Excellent
8 PAAU JOSE MBELLA VISTA RC SC
338 A
Excellent
9MANZANERO JOSHUA D
HOLY ANGELS RC SC
333 A
Excellent
10FERGUSON GLENROY M
SOLID ROCK CRST SC
331 A
Excellent
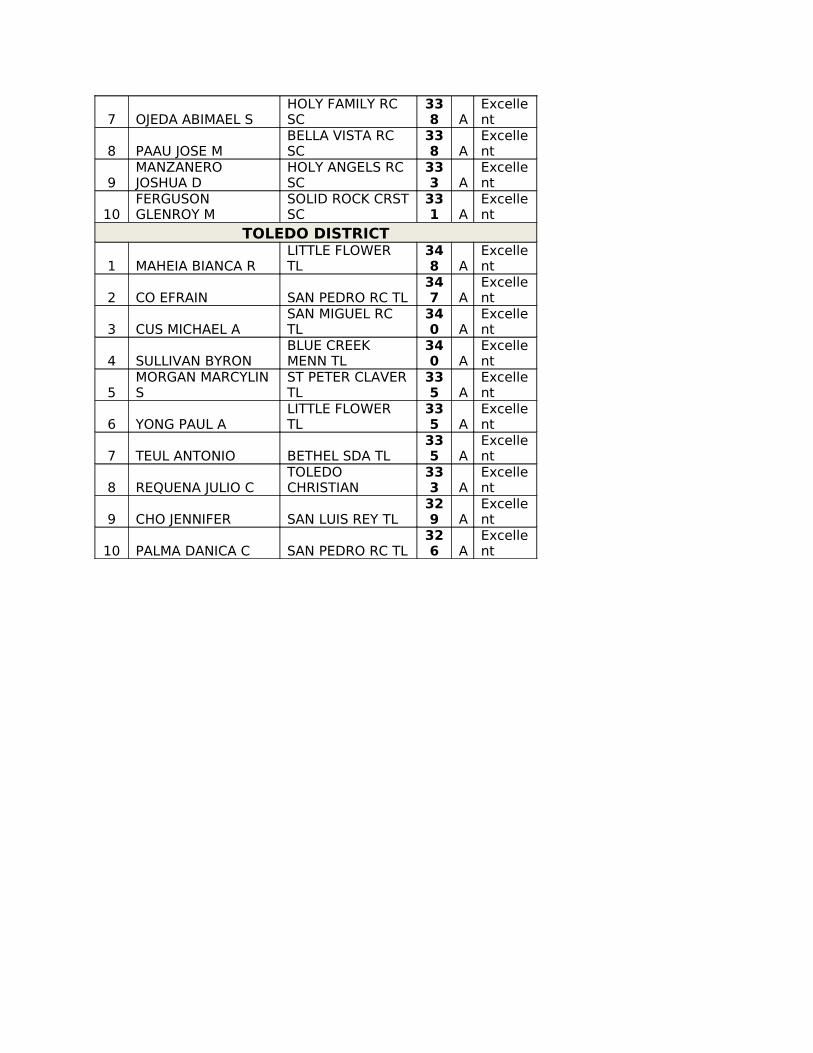
TOLEDO DISTRICT
1 MAHEIA BIANCA RLITTLE FLOWER TL
348 A
Excellent
2 CO EFRAIN SAN PEDRO RC TL347 A
Excellent
3 CUS MICHAEL ASAN MIGUEL RC TL
340 A
Excellent
4 SULLIVAN BYRONBLUE CREEK MENN TL
340 A
Excellent
5MORGAN MARCYLIN S
ST PETER CLAVER TL
335 A
Excellent
6 YONG PAUL ALITTLE FLOWER TL
335 A
Excellent
7 TEUL ANTONIO BETHEL SDA TL335 A
Excellent
8 REQUENA JULIO CTOLEDO CHRISTIAN
333 A
Excellent
9 CHO JENNIFER SAN LUIS REY TL329 A
Excellent
10 PALMA DANICA C SAN PEDRO RC TL326 A
Excellent