primary velocity distribution in open channels with ...envhydro.yonsei.ac.kr/japan-korea...
TRANSCRIPT

Hiroshima University The Ohta River
in Hiroshima city
Primary Velocity Distribution in Open Channels
with Different Vegetation Layout
- Experiment and Numerical Simulation -
Yoshihisa KAWAHARA
Dept. of Civil and Environmental Engineering
Hiroshima University, Japan
The 4th Japan-Korea Mini-Symposium on Modeling and Measurement of Hydraulic Flow
March 28, 2014, Yonsei University, Korea
OUTLINE OF PRESENTATION
Introduction
Experimental setup & conditions
Numerical model
Comparison between experiment and
numerical simulation
Summary
Hiroshima University

BACKGROUND OF THE STUDY
Vegetation is a key factor in river management. It has multi-
functions, such as
• To change magnitude and direction of flood flow
• To stabilize alluvial channels
• To create different habitats suitable for biodiversity
Hiroshima University
Wash-out of vegetation and erosion of floodplain in Ota River
due to a big flood in 2005.

BACKGROUND OF THE STUDY
Vegetation exerts significant effects on the morphological
behaviors of alluvial channels by stabilizing channels and
banks.
Vegetation growth
in the Tama River
after dam construction
(photos by Keihin work
office, MLIT)
Hiroshima University

BACKGROUND OF THE STUDY
Hiroshima University
• Many studies have been carried out to reveal the effects of
vegetation on mass and momentum transfer in open channels
with vegetation.
• Compound channels flows with vegetation have been studied
by researchers, such as Pasche and Rouve (1985), Naot et al.
(1996), Bennett (2002), Kang and Choi (2006), Rameshwaran
and Shiono (2007), etc.
• There still remain many unknowns with respect to flow-
vegetation interaction modeling, in particular in the presence of
large horizontal vortices and patched vegetation belts.

OBJECTIVES OF THE STUDY
To gain insight into mean flow field and large vortices in a prismatic
open channel in the presence of emergent vegetation,
To clarify the performance of a non-linear k-ε model coupled with a
vegetation model for turbulent flows in a straight channel with
different layout of vegetation.
We need a reliable numerical method that can predict momentum and
sediment transfer in the presence of vegetation which may topple or be
washed out during floods.
Hiroshima University

EXPERIMENTAL SETUP
Hiroshima University
Flow
Case-1 Vegetation: continuous,
along the channel center
Bed slope: 1/555
Vegetation Unit
Length: 99 cm
Width: 27 cm
Model Vegetation
Emergent rigid cylinders
Diameter: 3.0 mm
Height: 6.0 cm
Spacing: 3.0 cm
27 cm 80 cm
x
y
yd
Vegetation Belt
Flow
2,200 cm

EXPERIMENTAL SETUP & CONDITIONS
Hiroshima University
Case-1 Vegetation: continuous,
along the channel center
Case-2 Vegetation: continuous,
along a side wall
Case-3 Vegetation: continuous,
off the channel center
27 cm 80 cm
x
y
26.5 cm
Vegetation Belt
Flow
27 cm
80 cm
x
y Flow
27 cm 80 cm
x
y Flow 9.5 cm
27 cm 80 cm
x
y
26.5 cm
Flow
99.0 cm 99.0 cm Case-4 Vegetation: patched,
along the channel center
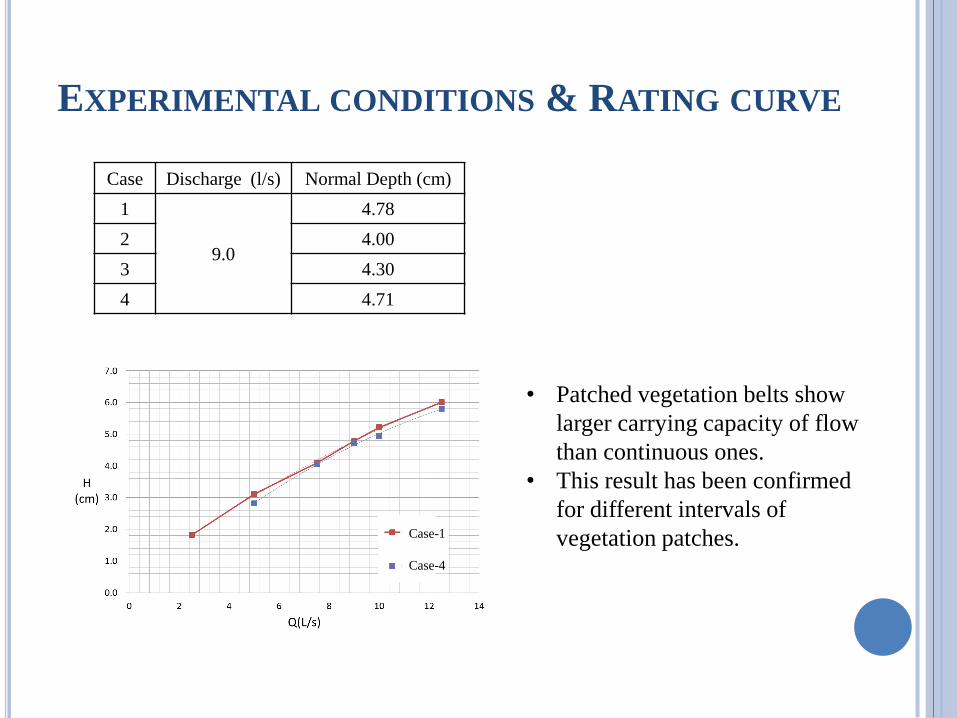
EXPERIMENTAL CONDITIONS & RATING CURVE
Case Discharge (l/s) Normal Depth (cm)
1
9.0
4.78
2 4.00
3 4.30
4 4.71
Case-1
Case-4
• Patched vegetation belts show
larger carrying capacity of flow
than continuous ones.
• This result has been confirmed
for different intervals of
vegetation patches.

FLOW VISUALIZATION
Case-1 Vegetation: continuous,
along the channel center
Case-2 Vegetation: continuous,
along a side wall
Case-3 Vegetation: continuous,
off the channel center
Large Vortex
Lx: 80~100 cm
T: 3.5~4.5 sec
Large Vortex
Lx=80~100 cm
T=3.5~4.5 sec
Large Vortex
Lx: 90~110 cm
T: 4.0~5.0 sec
Large Vortex
Lx (right): 80~100 cm
Lx (left): 30~40 cm
T(right): 4.0~5.0 sec
T(left): 3.0~4.0 sec Hiroshima University

FLOW VISUALIZATION
Case-1 Vegetation: continuous,
along the channel center
Case-4 Vegetation: patched,
along the channel center
Large Vortex
Lx: 80~100 cm
T: 3.5~4.5 sec
Large Vortex
Lx=80~100 cm
T=3.5~4.5 sec
Large Vortex
Lx: 80~100 cm
T: 3.5~4.5 sec
Hiroshima University
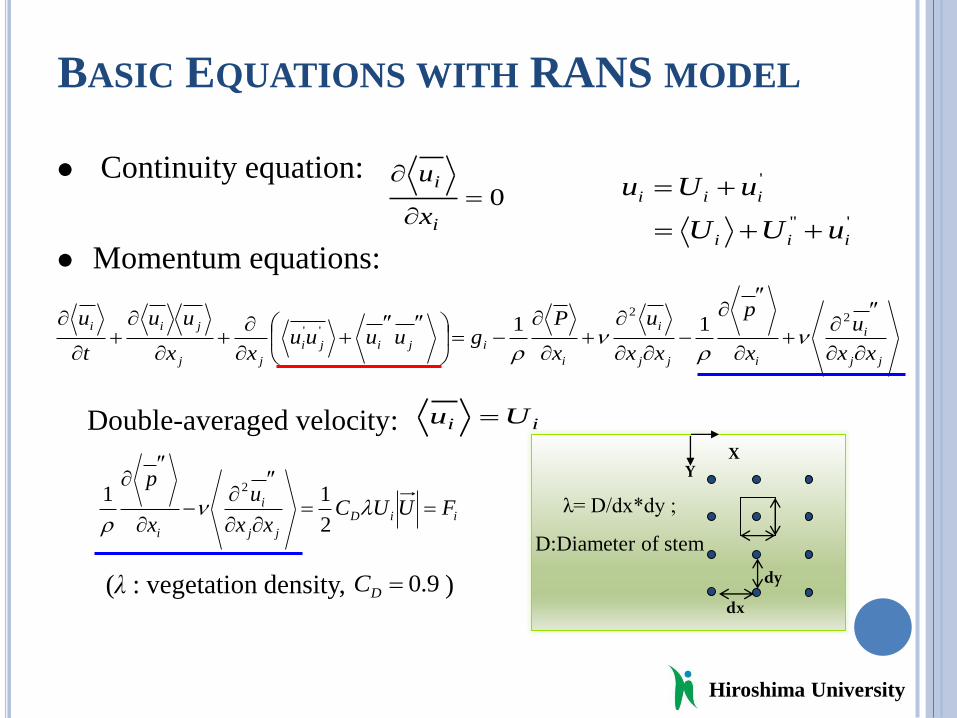
jj
i
ijj
i
i
ijiji
jj
jii
xx
u
x
p
xx
u
x
Pguuuu
xx
uu
t
u
22
'' 11
BASIC EQUATIONS WITH RANS MODEL
Momentum equations:
iiD
jj
i
i
FUUCxx
u
x
p
2
11 2
ii Uu Double-averaged velocity:
0
i
i
x
u
λ= D/dx*dy ;
D:Diameter of stem
X Y
dx
dy
'''
'
iii
iii
uUU
uUu
Continuity equation:
Hiroshima University
(λ : vegetation density, ) 9.0DC

TURBULENCE MODELS
ijtijjiji Skuuuu
3
2''
Linear k-ε Model
Non-Linear k-ε Model (Kimura-Hosoda)
2
2
09.01
3.0,09.0min;
MC
kCt
)3
1(
3
2''
3
1
ijijtijtijjiji SSCk
Skuuuu
i
j
j
iij
i
j
j
iij
x
U
x
U
x
U
x
US
;
ijijijijij
kSS
kS
2
1;
2
1
),max( SM
The non-linear terms are found to be necessary to produce
• secondary currents of the second kind,
• large horizontal vortices at the interface between vegetation and flow region.
Hiroshima University

TURBULENCE ENERGY AND DISSIPATION
RATE
krodmk
t
mj
jSP
x
k
xx
kU
t
k
SCP
kC
xxx
U
trod
m
t
mj
j
21
Transport equations for k and ε :
kUCUFS Diik 2
Source/ Sink term for k: kS
Source/ Sink term for ε : S
UCUFk
S Dii 4.12
3
Hiroshima University
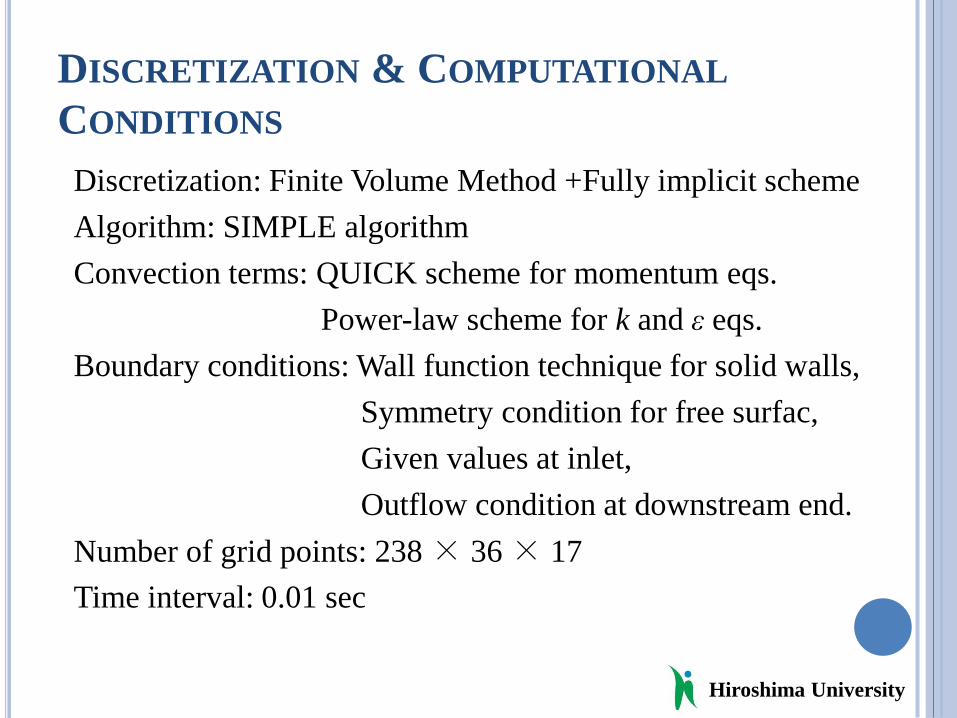
DISCRETIZATION & COMPUTATIONAL
CONDITIONS
Discretization: Finite Volume Method +Fully implicit scheme
Algorithm: SIMPLE algorithm
Convection terms: QUICK scheme for momentum eqs.
Power-law scheme for k and ε eqs.
Boundary conditions: Wall function technique for solid walls,
Symmetry condition for free surfac,
Given values at inlet,
Outflow condition at downstream end.
Number of grid points: 238 × 36 × 17
Time interval: 0.01 sec
Hiroshima University

INSTANTANEOUS VELOCITY & WATER LEVEL
20cm/s
20cm/s
20cm/s
Velocity vectors – mean streamwise velocity at interface
20cm/s
20cm/s
20cm/s
Case 1 (z=1.9cm) Case 1
Case 2 (z=2.1cm) Case 2
Case 3 (z=1.8cm) Case 3
• A series of large
vortices develop
along the interface.
• The calculated size
of large vortices
are slightly
underestimated.
• The core of large
vortices has low water
level.
Hiroshima University

FLUCTUATION OF WATER LEVEL
26.5 cm
x
y
2.0 cm
Flow
53.5 cm
(cm)
(s)
(cm)
(s)
h h
h h
Either side of vegetation belt
Either side of flow region
Either side of vegetation belt
Either side of flow region
Experiment Numerical Simulation
Case-1

FLUCTUATION OF VELOCITY COMPONENTS
26.5 cm x
y Flow
u'
v’
Experiment (z=2.5cm) Numerical Simulation (z=2.9cm)
u'
v’
(s)
(cm/s)
u’ and v’ at the interface between vegetation belt and flow region (y=26.5cm)
Case-1
Hiroshima University

FLUCTUATIONS OF WATER LEVEL AND
VELOCITY COMPONENTS
x
y
Flow 53.5 cm
h' h'
u’ and v’ (z=2.0cm)
Water level
Experiment Numerical Simulation
Case-2
Water level
u'
v’
u' and v’ (z=2.1cm)

FLUCTUATIONS OF VELOCITY COMPONENTS
x
y
Flow 44.5 cm
u’ and v’ (z=2.2cm)
Experiment Numerical Simulation
Case-3
u'
v’
u' and v’ (z=2.2cm)
u'
v’
Hiroshima University

FLUCTUATIONS OF WATER LEVEL
27 cm
x
y 26.5 cm
99 cm 99 cm
x=1260cm x=1360cm
Case-4 53.5 cm
26.5 cm
2.0 cm
h'
h'
h'
h' Out of phase
In phase

FLUCTUATIONS OF VELOCITY COMPONENTS
27 cm
x
y 26.5cm
99cm 99cm
x=1260cm x=1360cm
Case-4 26.5 cm
u'
v'
u'
v'
x=1260cm, y=26.5cm, z=2.5cm x=1360cm, y=26.5cm, z=2.5cm

MEAN VELOCITY (U/UM)
Case-1
Case-1
Case-2 Case-2
Case-3 Case-3
Experiment Numerical Simulation
Hiroshima University

MEAN VELOCITY (U/UM)
Hiroshima University
x
y
x=1203cm
x=1250cm
x=1296cm
x=1302cm
x=1349cm
x=1203cm
x=1250cm
x=1296cm
x=1302cm
x=1200cm
x=1349cm

SUMMARY
1. Large vortices have developed along the edge of
vegetation belt. Their scale and dominant frequency
depend on the vegetation layout.
2. The present numerical model can reproduce mean flow
field and large vortices reasonably well even when the
primary velocity shows large difference across the
vegetation belt. However, it tends to underestimate the
fluctuating primary velocity, which needs further
discussion.
3. The numerical model needs further validation for flows
with large coherent vortices and patched vegetation belts.
Hiroshima University

Thank you for your kind attention.
Any questions?
Hiroshima University
Hii River with active sand movement