prince william sound area salmon fisheries, 2014: a …special publication no. 14-15 prince william...
TRANSCRIPT

Special Publication No. 14-15
Prince William Sound Area Commercial Salmon Fisheries, 2014: a Report to the Alaska Board of Fisheries
by
Jeremy Botz
and
Thomas Sheridan
November 2014
Alaska Department of Fish and Game Divisions of Sport Fish and Commercial Fisheries
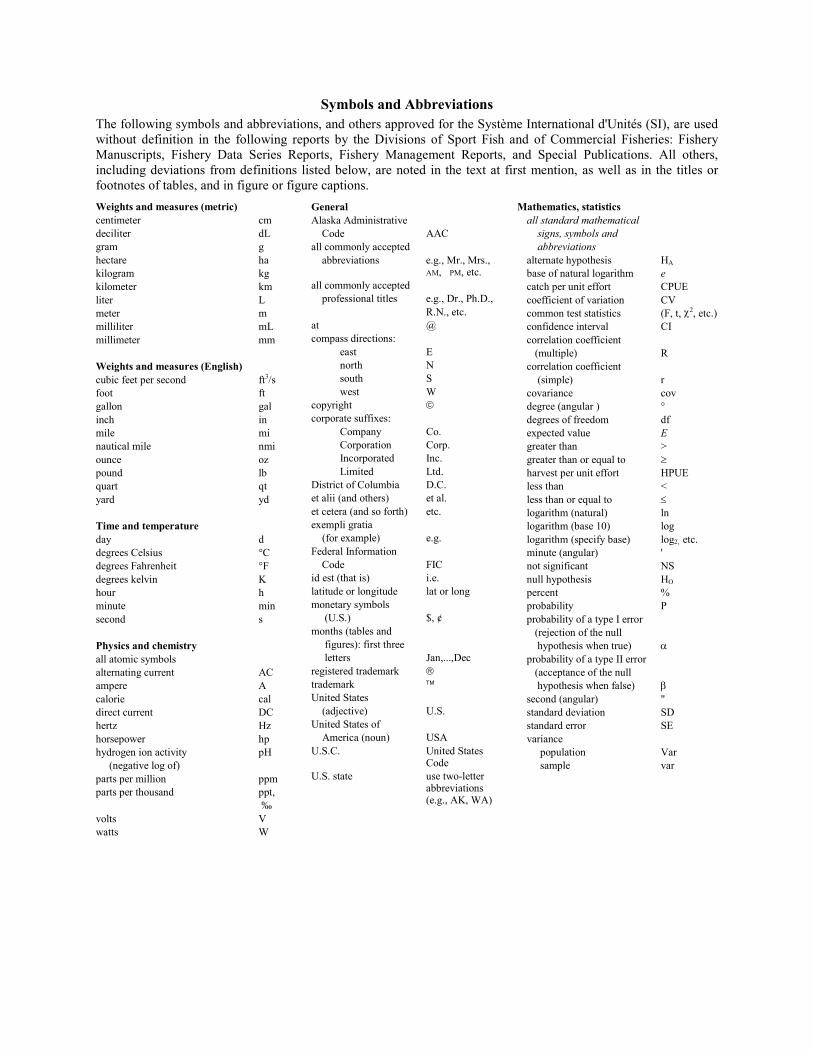
Symbols and Abbreviations The following symbols and abbreviations, and others approved for the Système International d'Unités (SI), are used without definition in the following reports by the Divisions of Sport Fish and of Commercial Fisheries: Fishery Manuscripts, Fishery Data Series Reports, Fishery Management Reports, and Special Publications. All others, including deviations from definitions listed below, are noted in the text at first mention, as well as in the titles or footnotes of tables, and in figure or figure captions. Weights and measures (metric) centimeter cm deciliter dL gram g hectare ha kilogram kg kilometer km liter L meter m milliliter mL millimeter mm Weights and measures (English) cubic feet per second ft3/s foot ft gallon gal inch in mile mi nautical mile nmi ounce oz pound lb quart qt yard yd Time and temperature day d degrees Celsius °C degrees Fahrenheit °F degrees kelvin K hour h minute min second s Physics and chemistry all atomic symbols alternating current AC ampere A calorie cal direct current DC hertz Hz horsepower hp hydrogen ion activity pH (negative log of) parts per million ppm parts per thousand ppt, ‰ volts V watts W
General Alaska Administrative Code AAC all commonly accepted abbreviations e.g., Mr., Mrs.,
AM, PM, etc. all commonly accepted professional titles e.g., Dr., Ph.D., R.N., etc. at @ compass directions:
east E north N south S west W
copyright corporate suffixes:
Company Co. Corporation Corp. Incorporated Inc. Limited Ltd.
District of Columbia D.C. et alii (and others) et al. et cetera (and so forth) etc. exempli gratia (for example) e.g. Federal Information Code FIC id est (that is) i.e. latitude or longitude lat or long monetary symbols (U.S.) $, ¢ months (tables and figures): first three letters Jan,...,Dec registered trademark trademark United States (adjective) U.S. United States of America (noun) USA U.S.C. United States
Code U.S. state use two-letter
abbreviations (e.g., AK, WA)
Mathematics, statistics all standard mathematical signs, symbols and abbreviations alternate hypothesis HA base of natural logarithm e catch per unit effort CPUE coefficient of variation CV common test statistics (F, t, χ2, etc.) confidence interval CI correlation coefficient (multiple) R correlation coefficient (simple) r covariance cov degree (angular ) ° degrees of freedom df expected value E greater than > greater than or equal to ≥ harvest per unit effort HPUE less than < less than or equal to ≤ logarithm (natural) ln logarithm (base 10) log logarithm (specify base) log2, etc. minute (angular) ' not significant NS null hypothesis HO percent % probability P probability of a type I error (rejection of the null hypothesis when true) α probability of a type II error (acceptance of the null hypothesis when false) β second (angular) " standard deviation SD standard error SE variance population Var sample var

SPECIAL PUBLICATION NO. 14-15
PRINCE WILLIAM SOUND AREA COMMERCIAL SALMON FISHERIES, 2014: A REPORT TO THE ALASKA BOARD OF FISHERIES
by Jeremy Botz and Thomas Sheridan
Alaska Department of Fish and Game, Division of Commercial Fisheries, Cordova
Alaska Department of Fish and Game Division of Sport Fish, Research and Technical Services 333 Raspberry Road, Anchorage, Alaska, 99518-1565
November 2014

The Special Publication series was established by the Division of Sport Fish in 1991 for the publication of techniques and procedures manuals, informational pamphlets, special subject reports to decision-making bodies, symposia and workshop proceedings, application software documentation, in-house lectures, and became a joint divisional series in 2004 with the Division of Commercial Fisheries. Special Publications are intended for fishery and other technical professionals. Special Publications are available through the Alaska State Library, Alaska Resources Library and Information Services (ARLIS) and on the Internet http://www.adfg.alaska.gov/sf/publications/. This publication has undergone editorial and peer review.
Jeremy Botz and Thomas Sheridan Alaska Department of Fish and Game, Division of Commercial Fisheries,
P.O. Box 669 Cordova, AK 99574, USA This document should be cited as: Botz, J., and T. Sheridan. 2014. Prince William Sound area salmon fisheries, 2014: a report to the Alaska Board of
Fisheries. Alaska Department of Fish and Game, Special Publication No. 14-15, Anchorage.
The Alaska Department of Fish and Game (ADF&G) administers all programs and activities free from discrimination based on race, color, national origin, age, sex, religion, marital status, pregnancy, parenthood, or disability. The department administers all programs and activities in compliance with Title VI of the Civil Rights Act of 1964, Section 504 of the Rehabilitation Act of 1973, Title II of the Americans with Disabilities Act (ADA) of 1990, the Age Discrimination Act of 1975, and Title IX of the Education Amendments of 1972.
If you believe you have been discriminated against in any program, activity, or facility please write: ADF&G ADA Coordinator, P.O. Box 115526, Juneau, AK 99811-5526
U.S. Fish and Wildlife Service, 4401 N. Fairfax Drive, MS 2042, Arlington, VA 22203 Office of Equal Opportunity, U.S. Department of the Interior, 1849 C Street NW MS 5230, Washington DC 20240
The department’s ADA Coordinator can be reached via phone at the following numbers: (VOICE) 907-465-6077, (Statewide Telecommunication Device for the Deaf) 1-800-478-3648,
(Juneau TDD) 907-465-3646, or (FAX) 907-465-6078 For information on alternative formats and questions on this publication, please contact:
ADF&G, Division of Sport Fish, Research and Technical Services, 333 Raspberry Rd, Anchorage AK 99518 (907) 267-2375

TABLE OF CONTENTS Page
LIST OF TABLES......................................................................................................................................................... ii
LIST OF FIGURES ....................................................................................................................................................... ii
ABSTRACT .................................................................................................................................................................. 1
INTRODUCTION ......................................................................................................................................................... 1
Prince William Sound Salmon Fisheries ....................................................................................................................... 1 Management Area.......................................................................................................................................................... 1 Salmon Harvest Overview 2012–2014 .......................................................................................................................... 2 Gillnet Fisheries ............................................................................................................................................................. 3
Coghill District ......................................................................................................................................................... 3 Eshamy District ........................................................................................................................................................ 4 Port Chalmers Subdistrict ......................................................................................................................................... 4 Gillnet Season Summary 2012 ................................................................................................................................. 4 Gillnet Season Summary 2013 ................................................................................................................................. 6 Gillnet Season Summary 2014 ................................................................................................................................. 7
Purse Seine Fisheries ..................................................................................................................................................... 8 Purse Seine Season Summary 2012 .......................................................................................................................... 9 Purse Seine Season Summary 2013 ........................................................................................................................ 10 Purse Seine Season Summary 2014 ........................................................................................................................ 11
Prince William Sound Management and Salmon Enhancement Allocation Plan ........................................................ 12 2012 Allocation ...................................................................................................................................................... 12 2013 Allocation ...................................................................................................................................................... 13 2014 Allocation ...................................................................................................................................................... 13 2015 Allocation ...................................................................................................................................................... 13
ACKNOWLEDGEMENTS ......................................................................................................................................... 13
TABLES AND FIGURES ........................................................................................................................................... 15
i

LIST OF TABLES Table Page 1 Average price paid to permit holders for salmon, Prince William Sound, 1988–2014. ................................ 16 2 Estimated exvessel value of the total commercial salmon harvest by gear type with previous 10-year
average, Prince William Sound, 2004–2014. ................................................................................................ 17 3 Commercial salmon harvest by species for all gear types, Prince William Sound, Copper, and Bering
districts 1980–2014. ...................................................................................................................................... 19 4 Prince William Sound Management Area commercial salmon harvest by district and gear type, 2012. ...... 20 5 Mean price and estimated exvessel value of the total commercial salmon harvest by gear type, Prince
William Sound, 2012. .................................................................................................................................... 21 6 Prince William Sound Management Area commercial salmon harvest by district and gear type, 2013. ...... 22 7 Mean price and estimated exvessel value of the total commercial salmon harvest by gear type, Prince
William Sound, 2013. .................................................................................................................................... 23 8 Prince William Sound Management Area commercial salmon harvest by district and gear type, 2014. ...... 24 9 Mean price and estimated exvessel value of the total commercial salmon harvest by gear type, Prince
William Sound, 2014. .................................................................................................................................... 25 10 Preseason harvest projections for the 2012 commercial salmon fishery by district and species, Prince
William Sound Area. ..................................................................................................................................... 26 11 Preseason harvest projections for the 2013 commercial salmon fishery by district and species, Prince
William Sound Area. ..................................................................................................................................... 27 12 Preseason harvest projections for the 2014 commercial salmon fishery by district and species, Prince
William Sound Area. ..................................................................................................................................... 28 13 Harvest values and allocation percentages by gear type for Area E, 2000–2013. ......................................... 29 14 Five year rolling average allocation percentages by gear type for Area E, 2000–2013. ............................... 29
LIST OF FIGURES Figure Page 1 Prince William Sound Management Area showing towns, commercial fishing districts, salmon
hatcheries, weir locations, and the Miles Lake sonar camp. .......................................................................... 30 2 Commercial salmon harvests in Prince William Sound, 1980–2014. ........................................................... 31 3 Exvessel value of the commercial salmon harvest by gear type, 2004–2014. ............................................... 32
ii

ABSTRACT The 2012–2014 Prince William Sound Area commercial salmon total (all species) harvest average of 61.4 million fish is above the 10 year (2002–2011) harvest average of 46.8 million fish for this area. The 2012–2014 total harvest average was made up of 54.7 million pink (Oncorhynchus gorbuscha), 3.1 million sockeye (O. nerka), 1.9 million chum (O. keta), 347,000 coho (O. kisutch), and 19,000 Chinook salmon (O. tshawytscha). Approximately 8.0% (4.9 million fish) of the total harvest average was composed of hatchery cost recovery and broodstock fish. The majority, 92.0% (56.5 million fish), were harvested in the common property fishery. The most significant events that have occurred since the 2011 Alaska Board of Fisheries meeting include 1) the largest pink salmon harvest on record in 2013, 2) improved salmon prices and record exvessel values for all gear groups, 3) PWS allocation came back into parity and then returned to favor the purse seine gear group due to record pink salmon harvests and high pink salmon values, and 4) participation in all commercial salmon fisheries is at historically high levels.
Key words: Prince William Sound, Pacific salmon Oncorhynchus spp., harvest, drift gillnet, set gillnet, purse seine, common property fishery, hatchery, cost recovery.
INTRODUCTION PRINCE WILLIAM SOUND SALMON FISHERIES This report summarizes Prince William Sound (PWS) commercial fishery performance (including the Copper and Bering districts) for the years 2012, 2013 and 2014, and highlights significant events that have occurred since the 2011 PWS Alaska Board of Fisheries (BOF) meeting. At the time of writing this report, 2014 commercial fisheries were ongoing and complete harvest data were not available. Because the season has not concluded, an abbreviated 2014 season summary with preliminary harvest data is provided. Detailed annual summaries are available for 2012 and 2013 in the Prince William Sound area finfish management report for each year that also provide historical data for comparisons and examination of trends.
Salmon returns and harvests have been consistently strong over the past 3 years. Wild pink Oncorhynchus gorbuscha and chum O. keta salmon stocks in PWS have met the majority of district-specific escapement goals since 2011, and there are no stocks of concern. PWS wild pink salmon escapements were within or above escapement goals from 2012 to 2014 and were near record levels in 2013. Wild chum salmon escapements were within escapement goal ranges for the years 2012–2104. Adequate wild stock escapements have allowed for liberal time and area management of purse seine fisheries. Broad area fisheries allow for a wide distribution of fishing effort, which relieves congestion and alleviates gear conflict issues to some extent.
The most significant events that occurred since the 2011 BOF meeting include 1) the largest pink salmon harvest on record in 2013, 2) increased salmon prices and record exvessel values for all gear groups, 3) PWS allocation came back into parity and then returned to a higher purse seine gear group proportion due to record pink salmon harvests (2010 and 2013) and high pink salmon values, and 4) participation in all salmon fisheries is at historically high levels (Tables 1 and 2).
MANAGEMENT AREA The PWS management area encompasses all coastal waters and inland drainages entering the north central Gulf of Alaska between Cape Suckling and Cape Fairfield. This area includes the Bering River, Copper River, and all of PWS with a total adjacent land area of approximately 38,000 square miles (Figure 1). While the Copper River lies within the PWS management area, Copper River salmon fisheries will be described in a separate report.
1

The salmon management area is divided into 11 districts that correspond to the local geography and distribution of the 5 species of salmon harvested by the commercial fishery. The management objective for all districts is achievement of escapement goals for the major salmon species while allowing for the orderly harvest of all fish surplus to spawning requirements and inriver goals. In addition, the Alaska Department of Fish and Game (ADF&G) follows regulatory plans to manage fisheries and assist private nonprofit (PNP) hatcheries in achieving cost recovery and broodstock objectives.
There are 6 hatcheries that contribute to the area’s fisheries and 5 are operated by the regional aquaculture association, Prince William Sound Aquaculture Corporation (PWSAC). Gulkana Hatchery in Paxson augments production of sockeye salmon O. nerka to the Copper River. Cannery Creek Hatchery (CCH), located on the north shore of the sound, and Armin F. Koernig (AFK) Hatchery in the southwestern sound produce pink salmon O. gorbuscha. Wally H. Noerenberg (WNH) Hatchery in the northwestern sound produces pink, chum O. keta, and coho O. kisutch salmon, and Main Bay Hatchery (MBH) in the western sound produces sockeye salmon. Valdez Fisheries Development Association (VFDA) operates Solomon Gulch Hatchery (SGH) in Port Valdez and produces pink and coho salmon. Hatchery production, especially pink salmon production, has increased since inception of the hatcheries (Figure 2).
Gear for the salmon fishery includes purse seine, drift gillnet, and set gillnet. Drift gillnet permits are the most numerous (536) and are allowed in the Bering River, Copper River, Coghill, Unakwik, and Eshamy districts. Set gillnet gear (29 permits) is allowed only in the Eshamy District. Purse seine gear (258 permits) is allowed in the Eastern, Northern, Unakwik, Coghill, Northwestern, Southwestern, Montague, and Southeastern districts.
SALMON HARVEST OVERVIEW 2012–2014 The 2012–2014 Prince William Sound Area (including the Copper and Bering districts) commercial salmon harvest average of 59.5 million fish is 22% above the 10-year harvest average (48.6 million fish) for this area (Table 3).
The 2012 harvest of 35.4 million salmon was made up of 27.6 million pink, 3.7 million sockeye, 3.8 million chum, 210,000 coho, and 13,100 Chinook salmon (Table 4). Approximately 11.3% (3.9 million fish) of the harvest was composed of hatchery cost recovery and broodstock fish. The majority, 88.7% (31.4 million fish), were harvested in the common property fishery (CPF). During the 2012 season, 522 drift gillnet permit holders, 29 set gillnet permit holders, and 224 purse seine permit holders reported deliveries. The estimated value of the combined 2012 commercial salmon harvest is $115 million, including hatchery sales (Table 5).
The 2013 harvest of 99.7 million salmon was made up of 92.6 million pink, 2.3 million sockeye, 4.1 million chum, 619,000 coho, and 10,800 Chinook salmon (Table 6). Approximately 4.9% (4.9 million fish) of the harvest was composed of hatchery cost recovery and broodstock fish. The majority, 95.1% (94.8 million fish), were harvested in the CPF. During the 2013 season, 526 drift gillnet permit holders, 29 set gillnet permit holders, and 211 purse seine permit holders reported deliveries. The estimated value of the combined 2013 commercial salmon harvest, including hatchery sales, was $168.3 million (Table 7).
The 2014 harvest of 49.3 million salmon was made up of 43.9 million pink, 3.3 million sockeye, 1.5 million chum, 600,000 coho, and 10,100 Chinook salmon (Table 8). Approximately 12% (5.90 million fish) of the harvest was composed of hatchery cost recovery and broodstock fish.
2

The majority, 88% (43.5 million fish), were harvested in the CPF. During the 2014 season, 525 drift gillnet permit holders, 29 set gillnet permit holders, and 222 purse seine permit holders reported deliveries. The preliminary estimated value of the combined 2014 commercial salmon harvest is $107 million, including hatchery sales (Table 9).
There are 6 proposals currently before the BOF that concern allocation in the general PWS area.
• Proposal 10 – Seeks to change set gillnet component of Prince William Sound Management and Salmon Enhancement Allocation Plan.
• Proposal 11 – Seeks to include Valdez Fisheries Development Association (VFDA) enhanced salmon harvest value in the Prince William Sound Management and Salmon Enhancement Allocation Plan.
• Proposal 13 – Seeks to designate an area in the Coghill District north of Point Pakenham to a point on the east side of College Fiord near Golden Lagoon that would be opened to both drift gillnet and purse seine gear by emergency order.
• Proposal 14 – Seeks to allow the purse seine gear group to target sockeye salmon at the Coghill River.
• Proposal 15 – This proposal is a place holder and does not suggest any specific changes to regulation.
• Proposal 16 – Seeks to designate area and establish alternating periods of time for drift gillnet and purse seine gear in portions of the Coghill District after July 21.
There is 1 proposal currently before the BOF that concerns drift gillnet in the general PWS area.
• Proposal 17 – Allow use of monofilament mesh in Prince William Sound drift gillnet fishery.
There are 3 proposals currently before the BOF that concern the use of aircraft in the general PWS area.
• Proposals 19, 20 and 21 – Addresses spotter plane use for purse seine fishery.
GILLNET FISHERIES Coghill District There are 5 proposals currently before the BOF that deal with issues specific to the Coghill District.
• Proposal 13 – Open certain waters of College Fjord to purse seine fishery before July 21.
• Proposal 14 – Reestablish historic purse seine gear access to Coghill Lake sockeye salmon in Coghill River terminal area.
• Proposal 15 – Establish standards to alleviate gear conflicts in Esther Subdistrict during the commercial pink salmon fishery.
• Proposal 16 – Establish alternating purse seine and drift gillnet fishing periods in certain areas to alleviate gear conflicts in Esther Subdistrict during the commercial pink salmon fishery.
3

• Proposal 22 – Identify certain landmarks in description of the Wally Noerenberg Hatchery terminal harvest area using latitude and longitude coordinates.
The Coghill District is located in northwestern PWS and is approximately 45 miles in length. The majority of commercial fisheries in the Coghill District target hatchery salmon from the Wally Noerenberg Hatchery (WNH) and wild sockeye salmon. The hatchery is located on Lake Bay at the southern end of Esther Island (Figure 1) and annually produces chum (~3 million), pink (~9.5 million), and coho (~250,000) salmon. Early-season management of the Coghill District is largely based on Coghill Lake sockeye salmon escapement and WNH chum salmon run strength.
The Coghill District is open for the harvest of chum, sockeye, pink, and coho salmon to drift gillnet permit holders; it opens to purse seine permit holders beginning on July 21 and ends when the harvestable surplus is no longer pink salmon.
PWSAC, in consultation with ADF&G, generally elects to complete a high percentage (80–90%) pink and chum salmon cost recovery harvest before recommending CPF openings. CPF openings in hatchery subdistricts and terminal areas during cost recovery occur as cost recovery progress warrants.
Eshamy District The Eshamy District is located in western PWS and is 15 miles in length. This is the only district in PWS where set gillnet gear is allowed to operate. The Main Bay Subdistrict was established to allow permit holders to harvest enhanced sockeye salmon while minimizing the harvest of wild sockeye returning to Eshamy Lake.
The Eshamy District is open to all drift and set gillnet permits in Area E.
During years in which the set gillnet gear group catches 5% or more of the previous 5-year average exvessel value of the total CPF for enhanced salmon, beginning on July 10, the set gillnet gear group will be limited to no more than 36 hours per week. In the past 3 years the set gillnet gear group remained within the 5% allocation, and no restrictions were triggered.
Port Chalmers Subdistrict (Montague District) The Port Chalmers Subdistrict is located in the northern end of the Montague District. Since 1994, PWSAC has released chum salmon at this remote location.
Based on the allocation plan, the drift gillnet gear group maintained exclusive access to Port Chalmers from 2009 through 2013. In 2014 the Port Chalmers area returned to the purse seine gear group when allocation came back into balance. However, the area will return to the drift gillnet gear group because of the record 2013 pink salmon harvest, which will be included in the allocation calculation for the next 5 years. Following a regulatory change at the 2011 PWS BOF meeting, gillnets greater than 60 meshes in depth were no longer permitted in the Port Chalmers Subdistrict to maintain consistency with gear standards in other fishing districts. Chum salmon runs to the Port Chalmers remote release have been below forecast since 2010 and have had minimal impact in bringing allocation between purse seine and drift gillnet back into parity.
Gillnet Season Summary 2012 The 5 year rolling average allocation calculation used to guide 2012 fisheries management was 61% purse seine, 39% drift gillnet, and 4% set gillnet. As a result, the drift gillnet fleet had
4

exclusive access to the Port Chalmers Subdistrict from June 1 to July 30 in 2012, and the set gillnet fleet was not limited to 36 hours per week after July 10, 2012.
The 2012 PWS commercial drift gillnet salmon harvest was 7.5 million fish. The harvest was composed of 1.2 million pink, 2.9 million chum, 3.2 million sockeye, 184,000 coho, and 12,000 Chinook salmon (Table 4). The 2012 PWS commercial set gillnet salmon harvest was 336,000 fish. The harvest was composed of 17,000 pink, 24,000 chum, 295,000 sockeye, 97 coho, and 14 Chinook salmon (Table 4).
The 2012 wild stock sockeye salmon run to Coghill Lake was forecast at 321,000 fish. During the 2011 BOF meeting, the Coghill Lake sockeye salmon sustainable escapement goal (SEG) range was changed from 20,000–40,000 fish to 20,000–60,000. Achieving a midpoint escapement of 40,000 sockeye salmon will leave approximately 281,000 fish for the CPF.
PWSAC forecasted a harvest of 1.2 million chum salmon to hatchery release sites in 2012 (Table 10). Approximately 380,000 chum salmon were designated for corporate cost recovery and broodstock. The Coghill District enhanced chum salmon and wild sockeye salmon runs were strong compared to the forecast. As a result, fishing area in the district was liberalized throughout the season. The CPF harvest of chum salmon in the Coghill District was 2.5 million fish (92% drift gillnet) and 250% greater than forecast. PWSAC harvested 438,000 chum salmon for corporate cost recovery and broodstock (Table 4). The proportion of wild chum salmon in the Coghill District CPF was 3%.
Coghill Lake sockeye escapement was larger than expected, and weir passage in just 2 days (July 3 and 4) totaled 23,300, exceeding the lower end of the SEG range. The continued strength of the return provided extended fishing time and expanded area. Nonetheless 72,000 sockeye salmon passed the Coghill River weir, which exceeded the SEG range of 20,000–60,000 fish. The total CPF harvest of sockeye salmon in the Coghill District was 436,000 fish (88% drift gillnet) (Table 4). The proportion of wild sockeye salmon in the Coghill District CPF harvest was 81%.
Pink salmon CPF harvest in the Coghill District was 3.4 million fish (33% drift gillnet). The proportion of wild pink salmon in the Coghill District CPF harvest was 19%. The total CPF harvest of coho salmon in the Coghill District was 11,000 fish, the majority of which were likely enhanced from WNH.
Gillnets greater than 60 meshes in depth were not permitted in the Port Chalmers Subdistrict in 2012 due to regulatory changes at the 2011 BOF meeting. These regulatory changes applied the same regulatory start date (the first Monday in July) for deep gear that existed in Coghill, Unakwik, and Eshamy districts. Even with the potential for reduced harvest efficiency, drift gillnet fishing effort appeared to keep up with chum salmon run entry, and no buildups or foregone harvest were observed.
PWSAC forecasted a run of 504,000 chum salmon to the Port Chalmers remote release site in 2012. CPF drift gillnet harvest of 325,000 chum salmon in the Montague District was 36% below that forecast and 46% below the 5 year (2007–2011) CPF average of 599,000 chum salmon. The proportion of wild chum salmon in the Port Chalmers Subdistrict CPF harvest was 3%.
ADF&G’s preseason harvest forecast for Eshamy Lake was 33,000 wild sockeye salmon, and PWSAC forecasted a run of 1.2 million MBH enhanced sockeye salmon (Table 10). Overall, 988,000 sockeye, 255,000 chum, and 89,000 pink salmon were harvested in the Eshamy District
5

by 355 drift gillnet permit holders during the 2012 season. A total of 29 set gillnet permit holders harvested 295,000 sockeye, 24,400 chum, and 17,300 pink salmon (Table 4). Contribution estimates show that wild sockeye salmon comprised 11% of the 1.3 million harvested, wild chum salmon comprised 4% of the 279,000 harvest, and wild pink salmon comprised 74% of the 106,000 harvest in Eshamy District.
The Eshamy River weir did not operate in 2012. Escapement was monitored through a pilot video monitoring project at the outlet of Eshamy Lake. Escapement counts for the season were incomplete because of new project deployment problems, and no escapement estimate is available. The sockeye salmon biological escapement goal (BEG) range for Eshamy Lake is 13,000 to 28,000 fish. Due to uncertainty in escapement at Eshamy River, openings in Eshamy Bay were restricted to one 14-hour period per week starting August 14. Low sockeye salmon harvest in the Eshamy Bay fishery did not support expanded fishing opportunity on the Eshamy Lake sockeye salmon stock.
Gillnet Season Summary 2013 The 5-year rolling average allocation calculation used to guide 2013 fisheries management was 58% purse seine, 42% drift gillnet, and 4% set gillnet. As a result, the drift gillnet fleet had exclusive access to the Port Chalmers Subdistrict from June 1 to July 30 in 2013, and the set gillnet fleet was not limited to 36 hours per week after July 10, 2013.
The 2013 PWS commercial drift gillnet salmon harvest was 7.8 million fish. The harvest was composed of 2.6 million pink, 2.8 million chum, 2.0 million sockeye, 357,000 coho, and 9,000 Chinook salmon (Table 6). The 2013 PWS commercial set gillnet salmon harvest was 265,000 fish. The harvest was composed of 19,000 pink, 43,000 chum, 203,000 sockeye, 360 coho, and 59 Chinook salmon (Table 6).
The enhanced chum salmon CPF harvest was forecast to be 2.5 million fish. PWSAC’s projection for cost recovery and broodstock requirements was approximately 663,000 fish. The Coghill District drift gillnet fishery was largely concentrated in hatchery subdistricts and terminal areas in 2013, focusing fishing effort on a WNH chum salmon run that was stronger than anticipated throughout the season. The CPF harvest of chum salmon in the Coghill District was 2.2 million fish (97% drift gillnet). PWSAC harvested 761,000 chum salmon for corporate cost recovery and broodstock (Table 6). The proportion of wild chum salmon in the Coghill District CPF was 2%.
The 2013 forecast of the sockeye salmon run to Coghill Lake was 156,000 fish. Meeting the midpoint of the SEG range of 20,000–60,000 sockeye salmon would leave 116,000 fish for the CPF (Table 11). Total sockeye salmon escapement past the Coghill River weir was 17,200 fish, which was below the lower SEG bound of 20,000 fish. Also, 360,000 pink salmon passed the Coghill River weir. District pink and chum salmon escapement goals were met.
The total CPF harvest of sockeye salmon in the Coghill District was 96,000 fish (98% drift gillnet), composed of approximately 35,100 wild and 60,600 enhanced sockeye salmon (Table 6). The proportion of wild sockeye salmon in the Coghill District CPF harvest was 37%.
Pink salmon CPF harvest in the Coghill District was 9.1 million fish (27% drift gillnet). The proportion of wild pink salmon in the Coghill District CPF harvest was 12%. The total CPF harvest of coho salmon in the Coghill District was 71,000 fish, the majority of which are assumed to be from WNH (Table 6). Of the 2,290 coho salmon collected for broodstock at
6

WNH, only 319 were viable. WNH coho survival has been highly variable, ranging from nearly 12% for return year 2007 to less than 1% for return year 2012, and broodstock goals have been rarely met.
PWSAC forecasted a run of 634,000 chum salmon to the Port Chalmers remote release site in 2013. The CPF drift gillnet harvest of chum salmon in the Montague District of 484,000 fish was 24% below forecast (Table 6) and 7% below the 5-year average of 516,000 fish. The proportion of wild chum salmon in the Port Chalmers Subdistrict CPF harvest was 5%.
ADF&G’s preseason CPF harvest forecast for Eshamy Lake was 32,000 wild sockeye salmon, and PWSAC forecasted a CPF harvest of 1.1 million MBH enhanced sockeye salmon (Table 11). Overall, 326 drift gillnet permit holders harvested 336,000 sockeye, 184,000 chum, and 62,200 pink salmon. A total of 29 set gillnet permit holders harvested 203,000 sockeye, 42,600 chum, and 19,100 pink salmon (Table 6). Contribution estimates show that wild sockeye salmon comprised 8% of the 539,000 harvested, wild chum salmon comprised 14% of the 227,000 harvest, and wild pink salmon comprised 54% of the 81,000 harvest in Eshamy District. The enhanced sockeye salmon run to MBH fell 483,000 fish (57%) short of the forecast of 1.12 million fish.
The Eshamy River weir did not operate in 2013. Escapement was monitored through a video monitoring project at the outlet of Eshamy Lake. The counts from that project are incomplete and there is no escapement estimate for 2013. The sockeye salmon BEG range for Eshamy Lake is 13,000–28,000 fish. Due to uncertainty in escapement at Eshamy River, openings in Eshamy Bay were restricted to one 14-hour period per week starting August 15. Low sockeye salmon harvest in the Eshamy Bay fishery did not support expanded fishing opportunity on the Eshamy Lake sockeye salmon stock.
Gillnet Season Summary 2014 The 5-year rolling average allocation calculation used to allocate 2014 fisheries came back into balance such that no triggers and set net restrictions were activated. As a result, the purse seine fleet had exclusive access to the Port Chalmers Subdistrict for the first time since 2008.
The 2014 PWS commercial drift gillnet salmon harvest was 5.8 million fish. The harvest was composed of 1.4 million pink, 791,000 chum, 3.0 million sockeye, 556,000 coho, and 9,700 Chinook salmon (Table 8). The 2014 PWS commercial set gillnet salmon harvest was 316,000 fish. The harvest was composed of 36,000 pink, 21,000 chum, 259,000 sockeye, 65 coho, and 22 Chinook salmon (Table 8).
The enhanced chum salmon run to WNH was forecast to be 1.6 million fish. PWSAC’s projection for cost recovery and broodstock requirements was approximately 512,000 fish. The 2014 WNH chum salmon run was weaker than PWSAC’s 1.6 million fish forecast. The CPF harvest of chum salmon in the Coghill District was 671,000 fish. PWSAC harvested 370,000 chum salmon for corporate cost recovery and broodstock (Table 8). Due to higher than anticipated mortality in their broodstock, PWSAC did not make their chum salmon egg take goal. PWSAC’s WNH chum salmon egg take goal was 18% below their goal in 2014, with 136 million green eggs collected towards a final goal of 165 million. The proportion of wild chum salmon in the Coghill District CPF was 11% and escapement (8,000 fish) was met.
The 2014 forecast of the sockeye salmon run to Coghill Lake was 168,000 fish with 138,000 fish available for CPF (Table 12). Total sockeye salmon escapement past the Coghill River weir was
7

21,200 fish, just above the lower SEG bound of 20,000 fish. The total CPF harvest of sockeye salmon in the Coghill District was 166,000 fish (Table 8). Otolith contribution estimates indicate that approximately 42,000 wild and 124,000 enhanced MBH sockeye salmon were harvested. The proportion of wild sockeye salmon in the Coghill District CPF harvest was 25%.
CPF (combined gillnet and purse seine) pink salmon harvest is summarized in the purse seine fisheries section. Gillnet pink salmon harvest has remained small compared to purse seine harvest; however, with higher prices for pink in the past 3 years there has been a steady increase in drift gillnet harvest of pink salmon. WNH also produces coho salmon, and in 2014 the Coghill District coho harvest was 147,000 fish. PWSAC harvested 14,000 coho salmon as part of broodstock collection (Table 8).
ADF&G’s 2014 preseason forecast for Eshamy Lake was 53,000 wild sockeye salmon, and PWSAC forecasted a run of 1.0 million MBH enhanced sockeye salmon (Table 12). Overall, 311 drift gillnet permit holders harvested 761,000 sockeye, 78,000 chum, and 190,000 pink salmon in the Eshamy District (Table 8). This is above the 10-year harvest averages of 515,000 sockeye and 81,000 pink salmon and below the 10-year average of 167,000 chum salmon harvested. A total of 29 set gillnet permit holders harvested 259,000 sockeye, 21,000 chum, and 36,000 pink salmon (Table 8). This sockeye and pink salmon harvest total is higher than the previous 10-year averages of 183,000 sockeye salmon and 32,000 pink salmon, and this year’s chum salmon harvest is lower than the 10-year average of 31,000 chum salmon. Preliminary contribution estimates show that wild sockeye salmon comprised 6% of the 1.0 million harvested, wild chum salmon comprised 26% of the 101,000 harvested, and wild pink salmon comprised 52% of the 228,000 harvested in Eshamy District. The enhanced sockeye salmon run to MBH, 1.2 million fish, was 14% larger than the preseason harvest forecast of 1.0 million fish.
The Eshamy River weir did not operate in 2014. Escapement was monitored through a video monitoring project at the outlet of Eshamy Lake, but those counts are incomplete, and no estimate of escapement is available. The sockeye salmon BEG range for Eshamy Lake is 13,000 to 28,000 fish. Due to uncertainty in escapement at Eshamy River, openings in Eshamy District were restricted to waters north of Eshamy Bay, and duration was limited to 36 hours from July 24 through August 19. During this time period, over 35% of the pink salmon harvested were of wild origin. Further limiting area to the Main Bay Subdistrict during this time reduced harvest of wild pink and chum salmon returning to other districts and protected sockeye salmon returning to Eshamy River. Eshamy Lake sockeye salmon run timing and limited fishing effort allowed for expanding fishing area to the entire district after August 21.
PURSE SEINE FISHERIES Purse seine districts include the Eastern, Coghill, Montague, Northern, Northwestern, Southeastern, Southwestern, and Unakwik districts. These districts are managed to achieve wild pink and chum salmon escapement goals by district and to allow for the orderly harvest of surplus wild and enhanced salmon stocks. Hatchery subdistricts are managed cooperatively with PWS hatchery operators to achieve hatchery escapement goals. Escapement of pink and chum salmon is monitored throughout the season by weekly aerial surveys of 215 index streams. Pink and chum salmon escapement trends determine the area and duration of fishing periods within districts. PWS purse seine fisheries primarily target VFDA and PWSAC enhanced salmon.
8

Purse Seine Season Summary 2012 The 2012 pink salmon total run forecast for PWS was 37.5 million fish, of which 30.2 million were anticipated to be available for the CPF. This pink salmon total run forecast included 4.4 million wild stock fish, 13.5 million VFDA fish, and 19.6 million PWSAC hatchery fish. Approximately 2.7 million (20.1%) of the projected 13.5 million pink salmon run to SGH were to be needed for cost recovery and broodstock, leaving 10.8 million for CPF harvest. Approximately 3.44 million (17.6%) of the projected 19.6 million pink salmon run to the PWSAC hatcheries were to be needed for cost recovery and broodstock. The remaining 16.2 million PWSAC pink salmon were to be available for CPF harvest. The 2012 PWS commercial purse seine salmon harvest was 23.5 million fish. The harvest was composed of 22.8 million pink, 504,000 chum, 155,000 sockeye, 22,300 coho, and 186 Chinook salmon (Table 4).
The most important events of the 2012 PWS pink salmon fishery include: 1) the VFDA pink salmon run was 21.8% (2.83 million) below the preseason forecast of 13.5 million fish; 2) the PWSAC pink salmon run was 31.1% (5.92 million) below the preseason forecast of 19.6 million fish; 3) fewer aerial surveys were flown than any year since 1976 due to poor weather conditions; 4) more permits were fished (224) than any year since 1991; and 5) PWSAC’s Cannery Creek Hatchery pink salmon egg take goal was missed by 46% in 2012, with 102 million green eggs collected towards a final goal of 187 million. Total pink salmon harvest was 27.6 million fish, including 3.53 million (2.16 million for PWSAC and 1.37 million for VFDA) fish for hatchery cost recovery and broodstock (Table 4). The 10-year average total pink salmon harvest (2002–2011) in PWS is 40.4 million fish (Table 3).
The 2012 PWS pink salmon escapement estimate of 1.13 million fish was within the SEG range of 793,000 to 1.70 million fish, and supported a harvest of 4.43 million wild stock pink salmon.
The most significant events of the 2012 PWS purse seine chum salmon fishery include: 1) the use of seine gear in the Esther Subdistrict for the purpose of preventing the deterioration of fish quality of the harvestable surplus of chum salmon that was not being adequately harvested by the drift gillnet fleet, as permitted under 5 AAC 24.368 (f), resulting in the purse seine harvest of 186,000 chum salmon; and 2) the AFK chum salmon run was 54.3% (114,000) greater than the preseason forecast of 210,000 fish. Chum salmon CPF harvest in PWS was 3.39 million fish, which was 1.6 million fish greater than the CPF preseason forecast. The purse seine fleet harvested 504,000 chum salmon in 2012.
The 2012 PWS chum salmon escapement was greater than the PWS lower bound SEG and supported a harvest of 246,000 wild stock chum salmon.
Despite liberal fishing time and area, as well as higher than anticipated drift gillnet fishing effort, sockeye salmon escapement at the Coghill River weir was above the upper end of the river’s anticipated cumulative escapement count by July 3. To further slow sockeye salmon escapement, purse seine gear was permitted to fish in the vicinity of the Coghill River prior to the Coghill District’s July 21 regulatory start date. The purse seine fleet harvested 47,400 sockeye salmon during 2 fishing periods on July 5 and 12.
The VFDA enhanced coho salmon forecast was 129,000 fish with an anticipated commercial harvest of 62,000 fish. Due to a weak return, fishing opportunity targeting VFDA coho salmon in
9

Port Valdez was limited in 2012. Total commercial purse seine harvest of coho salmon in PWS was 22,300 fish.
Purse Seine Season Summary 2013 The 2013 pink salmon total run forecast for PWS was 40.7 million fish, of which 34.0 million were anticipated to be available for the CPF. This pink salmon total run forecast included 6.23 million wild stock fish, 13.8 million VFDA fish, and 20.7 million PWSAC hatchery fish. Approximately 2.93 million (21.3%) of the projected 13.8 million pink salmon run to SGH were to be needed for cost recovery and broodstock leaving 10.8 million for CPF harvest. Approximately 2.35 million (11.4%) of the projected 20.7 million pink salmon run to the PWSAC hatcheries were to be needed for cost recovery and broodstock. The remaining 18.3 million PWSAC pink salmon were to be available for CPF harvest.
The 2013 PWS commercial purse seine salmon harvest was 86.7 million fish. The harvest was composed of 85.9 million pink, 487,000 chum, 76,700 sockeye, 222,000 coho, and 775 Chinook salmon (Table 6). The most important events of the 2013 PWS pink salmon fishery include: 1) the PWS pink salmon total run set the new area record (97.3 million fish) and was more than double the preseason forecast; 2) the PWS wild stock pink salmon total run was more than triple the preseason forecast and also set the new area record (22.3 million fish); 3) industry processing capacity was reached and the majority of the purse seine fleet was placed on harvest limits for 2 weeks in August; 4) the VFDA coho salmon return was nearly double the preseason forecast; and 5) a record exvessel value of salmon was harvested by the purse seine group. Participation in the 2013 PWS purse seine fishery was 211 unique permits fished. This participation is 13 permits less than were fished in 2012, but greater than the 10-year average participation from 2002—2011 of 132 permits. Pink salmon CPF harvest in PWS was 88.6 million fish, which was 54.6 million fish greater than the CPF preseason forecast (Table 6). Total pink salmon harvest was 92.6 million fish, including 4.09 million (1.82 million for PWSAC and 2.27 million for VFDA) fish for hatchery cost recovery and broodstock. The 10-year average total pink salmon harvest (2003–2012) in PWS is 41.3 million fish (Table 3). The 2013 PWS pink salmon escapement estimate was 4.68 million fish, or more than twice the upper bound of the odd-year SEG range for all districts, and supported a record harvest of 17.6 million wild stock pink salmon.
The most significant event of the 2013 PWS purse seine chum salmon fishery was the use of seine gear in the Esther Subdistrict between July 11 and 21 for the purpose of preventing the deterioration of fish quality of the harvestable surplus of chum salmon that was not being adequately harvested by the drift gillnet fleet, as permitted under 5 AAC 24.368 (f), resulting in the purse seine harvest of 69,200 chum salmon. Chum salmon CPF harvest in PWS was 3.31 million fish, which was 178,000 fish greater than the CPF preseason forecast. The purse seine fleet harvested 487,000 chum salmon in 2013. Otolith contribution estimates indicate that 319,000 AFK chum salmon were harvested in the PWS CPF, which was greater than the preseason forecast of 306,000 fish.
The 2013 PWS chum salmon escapement estimate was greater than the SEG lower bound, near the 1976–2013 mean escapement index, and supported a harvest of 247,000 wild stock chum salmon in PWS commercial fisheries.
10

The VFDA enhanced coho salmon forecast was 127,000 fish with an anticipated commercial harvest of 67,000 fish. Port Valdez was opened to daily commercial purse seine fishing periods to target surplus VFDA coho salmon on September 3, resulting in the harvest of 138,000 coho salmon. Total commercial purse seine harvest of coho salmon in PWS was 222,000 fish.
Purse Seine Season Summary 2014 The 2014 pink salmon total run forecast for PWS was 38.4 million fish, of which 31.5 million were anticipated to be available for the CPF. This pink salmon total run forecast included 4.30 million wild stock fish, 12.9 million VFDA fish, and 21.2 million PWSAC hatchery fish. Approximately 2.76 million (21.4%) of the projected 12.9 million pink salmon run to SGH were to be needed for cost recovery and broodstock leaving 10.2 million for CPF harvest. Approximately 3.07 million (14.5%) of the projected 21.2 million pink salmon run to the PWSAC hatcheries were to be needed for cost recovery and broodstock. The remaining 18.1 million PWSAC pink salmon were to be available for CPF harvest.
The 2014 PWS commercial purse seine salmon harvest was 37.4 million fish. The harvest was composed of 36.9 million pink, 347,000 chum, 53,100 sockeye, 31,100 coho, and 355 Chinook salmon (Table 8).
The most important events of the 2014 PWS pink salmon fishery were: 1) the VFDA run was twice the preseason forecast and set a new record return for SGH (24.5 million fish); 2) the PWSAC pink salmon run was 17.8% (3.78 million) below the preseason forecast of 21.2 million fish; 3) the number of active permits fished (222 unique permits fished) was the second highest since 1991; and 4) PWSAC’s Cannery Creek Hatchery pink salmon egg take goal was missed by 3% in 2014, with 181 million green eggs collected towards a final goal of 187 million. Pink salmon CPF harvest in PWS was 38.4 million fish, 6.9 million fish greater than the preseason forecast (Table 8). Total pink salmon harvest was 43.9 million fish, including 5.51 million (3.58 million for PWSAC and 1.93 million for VFDA) fish for hatchery cost recovery and broodstock. The 10-year average total pink salmon harvest (2004–2013) in PWS is 45.4 million fish (Table 3).
The 2014 PWS pink salmon escapement estimate was not available at the time of writing this report. However, inseason pink salmon escapement indices were above minimum anticipated aerial survey counts. Overall escapement was likely within the even-year SEG range for all districts and supported a harvest of 1.95 million wild stock pink salmon.
The most significant events of the 2014 PWS purse seine chum salmon fishery include: 1) exclusive access to the Port Chalmers Subdistrict remote release chum salmon fishery for the purse seine gear group, as stipulated in 5 AAC 24.370 (h) (1); and 2) weaker than forecast runs of enhanced chum salmon to PWSAC’s release locations. Chum salmon CPF harvest in PWS was 1.16 million fish, which was 1.20 million fish below the CPF preseason forecast. Preliminary otolith contribution estimates indicate that 86,300 AFK chum salmon and 174,000 Port Chalmers chum salmon were harvested in the PWS CPF, which are both well below (63.3%) preseason expectations of 987,000 fish. The purse seine fleet harvested 347,000 chum salmon in 2014.
The 2014 PWS chum salmon escapement estimate was not available at the time of writing this report. However, inseason chum salmon escapement indices were above minimum anticipated aerial survey counts. Overall escapement was likely greater than the PWS lower bound SEG and supported a harvest of 406,000 wild stock chum salmon.
11

The VFDA enhanced coho salmon forecast was 106,000 fish, with an anticipated commercial harvest of 57,000 fish. Due to a weak run, Port Valdez was not opened to commercial purse seine fishing to target surplus VFDA coho salmon in 2014. Total commercial purse seine harvest of coho salmon in PWS was 31,100 fish.
PRINCE WILLIAM SOUND MANAGEMENT AND SALMON ENHANCEMENT ALLOCATION PLAN In December 2005, the BOF modified the Prince William Sound Management and Salmon Enhancement Allocation Plan (5 AAC 24.370). The modifications removed wild stocks and Valdez Fisheries Development Association enhanced fish from the plan and allocated only PWSAC enhanced fish. Additionally, a 5-year average exvessel value is now used rather than annual value percentages (see Figure 3 for exvessel value from 2004 through 2014). The set gillnet gear group allocation is now 4% of the 5-year average value of PWSAC enhanced salmon stocks. The drift gillnet and purse seine gear groups each receive 50% of the remaining value of PWSAC enhanced salmon stocks. If the set gillnet gear group exceeds 5% of the of the 5-year average value of PWSAC enhanced stocks, they will be limited to no more than 36 hours of fishing time per week beginning July 10 in the year following this calculation. If the drift gillnet gear group harvest value is 45% or less, then in the year following the current calculations, the drift gillnet gear group shall have exclusive access to the Port Chalmers Subdistrict to harvest enhanced salmon returns from June 1 through July 30, during fishing periods established by emergency order. If the purse seine gear group harvest value is 45% or less, then in the year following the current calculations, the purse seine gear group shall have exclusive access to the Esther Subdistrict to harvest enhanced salmon returns from June 1 through July 20, during fishing periods established by emergency order.
The most significant events of relevance to PWS allocation since the 2011 PWS BOF meeting include: 1) a record harvest of PWSAC pink salmon in 2013; 2) large harvests of GH sockeye salmon in 2012 and 2013; 3) large harvests of MBH sockeye salmon in 2012 and 2014; 4) large harvests of WNH chum salmon in 2012 and 2013; and 5) high salmon prices for all species. Large drift gillnet harvests in recent years (Table 13), combined with high salmon prices brought allocation back into parity for the 2014 season (Table 14). However, the record 2013 pink salmon harvest will likely lead to larger purse seine gear group allocation percentages for the next several years, as this value will remain in the allocation calculation through the 2019 Allocation Plan calculation.
In 2011–2014, ADF&G calculated the exvessel value percentages for each gear group using the Commercial Operators Annual Report (COAR) area-specific prices and weights, as well as department harvest estimates of PWSAC enhanced fish by species and gear type.
2012 Allocation The 5-year (2006–2010) average value percentages for each gear type are 39.1% drift gillnet, 60.9% purse seine, and 3.7% set gillnet. As a result, the drift gillnet gear group had exclusive access to the Port Chalmers Subdistrict from June 1 to July 30 in 2012, and the set gillnet gear group was not limited to 36 hours per week beginning July 10, 2012.
12

2013 Allocation The 5-year (2007–2011) average value percentages for each gear type are 42.4% drift gillnet, 57.6% purse seine, and 4.1% set gillnet. As a result, the drift gillnet gear group had exclusive access to the Port Chalmers Subdistrict from June 1 to July 30 in 2013, and the set gillnet gear group was not limited to 36 hours per week beginning July 10, 2013.
2014 Allocation The 5-year (2008–2012) average value percentages for each gear type are 46.3% drift gillnet, 53.7% purse seine, and 4.3% set gillnet. As a result, the purse seine gear group had exclusive access to the Port Chalmers Subdistrict for the entire 2014 fishing season, and the set gillnet gear group was not limited to 36 hours per week beginning July 10, 2014.
2015 Allocation The 5-year (2009–2013) average value percentages for each gear type are 44.6% drift gillnet, 55.4% purse seine, and 4.3% set gillnet. As a result, the drift gillnet gear group will have exclusive access to the Port Chalmers Subdistrict for the entire 2015 fishing season, and the set gillnet gear group will not be limited to 36 hours per week beginning July 10, 2015.
ACKNOWLEDGEMENTS The authors thank Bert Lewis, Tracy Lingnau, Dan Bosch, Davin Holen, Tom Taube, Tom Brookover, Lisa Olson, and Forrest Bowers for their thorough and timely reviews of this report. We would also like to thank Steve Moffitt and Rich Brenner for heading up commercial fisheries data collection and analyses that were critical to the completion of this report, as well as Amanda Weise for her help in finalizing the report. We also thank Shannon Royse for ensuring that the report was brought up to current publications standards in a thorough and expeditious manner.
13

14

TABLES AND FIGURES
15

Table 1.–Average price paid to permit holders for salmon, Prince William Sound, 1988–2014.
Chinook salmon
Sockeye salmon
Coho salmon Pink salmon
Chum salmon
Gillnet Gillnet
Purse seine
Gillnet
Purse seine
Gillnet
Purse seine
Gillnet
Purse seine Year
Copper and
Bering PWS
Copper and
Bering PWS
Copper and
Bering PWS
Copper and
Bering PWS
Copper and
Bering PWS 1988 $2.23 $2.43 $3.20 $2.74 $2.68 $2.35 $1.19 $1.85 ND $0.60 $0.79 ND $0.92 $0.72 1989 $2.25 $0.00 $2.30 $0.00 $2.68 $0.60 $0.00 $1.58 ND $0.00 $0.48 ND $0.00 $0.43 1990 $2.24 $1.45 $2.13 $1.59 $1.50 $0.97 $0.69 $0.50 ND $0.30 $0.30 ND $0.70 $0.70 1991 $1.65 $1.00 $1.28 $1.28 $1.00 $0.65 $0.44 $0.45 ND $0.12 $0.12 ND $0.40 $0.40 1992 $2.50 $1.55 $2.50 $1.55 $1.55 $0.90 $0.90 $0.90 ND $0.18 $0.18 ND $0.55 $0.55 1993 $1.82 $0.97 $1.32 $0.87 $0.83 $0.80 $0.66 $0.54 ND $0.17 $0.16 ND $0.71 $0.36 1994 $1.43 $0.84 $1.27 $1.16 $0.89 $0.74 $0.67 $0.54 ND $0.11 $0.16 ND $0.32 $0.24 1995 $2.19 $0.79 $1.67 $1.07 $0.86 $0.52 $0.37 $0.39 ND $0.18 $0.18 ND $0.39 $0.28 1996 $1.96 $0.68 $1.38 $0.85 $0.73 $0.53 $0.24 $0.36 ND $0.04 $0.07 ND $0.14 $0.13 1997 $2.00 $1.00 $0.88 $0.85 $0.85 $0.30 $0.25 $0.30 ND $0.07 $0.12 ND $0.25 $0.30 1998 $2.07 $1.25 $1.49 $1.11 $1.01 $0.46 $0.41 $0.31 ND $0.14 $0.12 ND $0.21 $0.27 1999 $3.44 $0.50 $1.84 $0.89 $0.98 $0.58 $0.23 $0.49 ND $0.06 $0.10 ND $0.15 $0.27 2000 $4.02 $4.04 $1.72 $1.38 $0.90 $0.57 $0.56 $0.42 ND $0.11 $0.15 ND $0.26 $0.28 2001 $3.30 $1.94 $1.35 $0.77 $0.74 $0.32 $0.20 $0.26 ND $0.05 $0.13 ND $0.38 $0.37 2002 $3.34 $1.26 $1.29 $1.14 $0.57 $0.35 $0.09 $0.25 ND $0.05 $0.09 ND $0.15 $0.15 2003 $3.48 $0.00 $1.16 $0.80 $0.71 $0.48 $0.48 $0.42 ND $0.06 $0.07 ND $0.17 $0.17 2004 $4.69 $1.38 $1.81 $0.85 $0.55 $0.69 $0.28 $0.42 ND $0.04 $0.10 ND $0.23 $0.18 2005 $4.70 $0.00 $1.79 $0.92 $0.54 $0.83 $0.69 $0.10 ND $0.05 $0.08 ND $0.28 $0.18 2006 $5.03 $1.20 $1.83 $1.15 $1.05 $0.92 $0.67 $0.60 ND $0.11 $0.16 ND $0.37 $0.33 2007 $4.50 $2.70 $1.81 $1.04 $0.82 $0.90 $0.30 $0.59 ND $0.11 $0.17 ND $0.33 $0.37 2008 $5.96 $1.04 $3.12 $1.24 $1.17 $1.23 $1.24 $1.12 $0.27 $0.33 $0.34 $0.21 $0.55 $0.57 2009 $5.29 $2.06 $2.09 $1.42 $1.32 $1.30 $1.13 $0.42 $0.22 $0.27 $0.24 $0.28 $0.52 $0.53 2010 $5.50 $2.13 $2.58 $1.72 $1.79 $1.27 $0.58 $0.70 $0.29 $0.34 $0.35 $0.36 $0.80 $0.78 2011 $5.66 $3.97 $2.08 $1.56 $1.43 $1.24 $1.09 $1.04 $0.31 $0.40 $0.45 $0.38 $0.90 $0.86 2012 $5.39 $1.44 $1.94 $1.40 $1.42 $1.10 $1.04 $0.69 $0.29 $0.38 $0.42 $0.28 $0.66 $0.68 2013 $5.79 $2.83 $2.47 $1.86 $1.69 $1.39 $1.29 $0.95 $0.27 $0.35 $0.42 $0.11 $0.57 $0.59 10-year average $5.02 $1.59
$2.02 $1.21 $1.08
$1.00 $0.75 $0.61
$0.28 $0.21 $0.24
$0.30 $0.48 $0.47
2014 $6.43 $2.87 $2.44 $1.97 $1.90 $1.17 $1.00 $0.81 $0.13 $0.30 $0.29 $0.22 $0.68 $0.65 Note: ND indicates no data.
16

Table 2.–Estimated exvessel value of the total commercial salmon harvest by gear type with previous 10-year average, Prince William Sound, 2004–2014.
Purse seine Previous Species 2004 2005 2006 2007 2008 2009 2010 2011 2012 2013 10 year avg. 2014 Chinook 1,270 1,787 4,940 9,330 2,487 985 634 6,120 3,279 15,444 4,628 $7,913 Sockeye 46,573 207,022 219,984 338,262 540,113 584,595 705,231 560,497 1,449,007 796,220 544,750 $547,367 Coho 121,688 103,312 1,426,736 546,805 2,056,932 22,522 48,476 633,076 117,259 1,608,923 668,573 $185,624 Pink 4,293,551 13,104,242 6,688,126 28,839,799 39,059,344 7,890,237 78,063,374 35,834,331 37,732,043 100,334,069 35,183,912 $35,542,741 Chum 1,228,965 773,620 3,007,947 3,499,189 8,002,952 1,123,335 1,019,498 691,520 2,450,017 2,157,525 2,395,457 $1,770,780
$5,692,047 $14,189,982 $11,347,734 $33,233,386 $49,661,828 $9,621,674 $79,837,212 $37,725,543 $41,751,606 $104,912,182 $38,797,319 $38,054,424
Drift gillnet Species
Chinook 4,050,947 3,575,253 3,145,401 3,886,795 1,511,402 956,053 1,025,380 2,148,066 1,352,540 973,720 2,262,556 $1,116,059 Sockeye 13,436,808 15,849,204 19,375,916 26,169,047 11,533,354 17,386,798 18,486,735 36,356,087 37,444,516 29,389,403 22,542,787 $41,307,876 Coho 3,561,659 2,374,703 3,972,107 1,391,204 3,937,198 3,197,336 3,523,008 2,031,963 1,646,222 3,986,567 2,962,197 $5,126,103 Pink 12,134 84,308 54,070 82,356 1,195,812 363,373 3,446,356 1,025,474 1,659,983 2,465,469 1,038,933 $1,510,359 Chum 976,553 1,965,383 845,703 2,542,327 10,853,908 9,227,837 11,973,968 8,669,206 13,170,829 11,654,134 7,187,985 $3,869,082
$22,038,101 $23,848,851 $27,393,197 $34,071,729 $29,031,674 $31,131,396 $38,455,447 $50,230,797 $55,274,091 $48,469,293 $35,994,458 $52,929,479
Set gillnet Species
Chinook 189 0 143 1,267 533 1,302 756 1,832 230 3,015 927 $769 Sockeye 454,709 608,528 822,232 1,318,799 1,238,739 1,451,897 3,103,081 2,993,318 2,454,505 2,278,575 1,672,438 $2,881,576 Coho 1,635 4,737 1,869 873 1,414 241 250 2,297 509 2,556 1,638 $451 Pink 7,439 23,542 8,325 5,416 20,966 3,419 20,573 21,931 28,480 17,062 15,715 $35,588 Chum 17,261 6,880 29,925 53,380 231,785 197,332 450,989 163,884 121,995 188,004 146,143 $106,524
$481,233 $643,687 $862,493 $1,379,735 $1,493,437 $1,654,191 $3,575,649 $3,183,261 $2,605,720 $2,489,211 $1,836,862 $3,024,908
Hatchery sales Species
Chinook 0 0 0 0 0 0 0 0 59 0 6 $0 Sockeye 997,020 2,383,400 2,173,808 1,790,819 0 1,088,363 0 0 7,749 110 844,127 $0 Coho 35,733 0 102,792 161,995 67,879 145,267 44,808 280,215 217 214,752 105,366 $20,128 Pink 5,718,678 7,288,894 7,300,390 6,809,392 7,574,535 5,208,870 8,911,203 11,867,472 12,381,620 8,765,309 8,182,636 $11,504,489 Chum 779,268 1,704,693 2,893,174 2,105,903 2,465,426 1,816,012 2,894,835 2,802,681 2,952,252 3,424,927 2,383,917 $1,514,775 $7,530,699 $11,376,987 $12,470,164 $10,868,110 $10,107,840 $8,258,512 $11,850,846 $14,950,368 $15,341,896 $12,405,098 $11,516,052 $13,039,393
-continued-
17

Table 2.–Page 2 of 2.
Other gear Previous Species 2004 2005 2006 2007 2008 2009 2010 2011 a 2012a 2013a 10 year avg. 2014a Chinook 493 81 0 0 0 0 0 0 0 0 57 ND Sockeye 614 289 0 0 0 0 0 16 159 0 108 ND Coho 0 0 0 0 0 0 0 0 0 0 0 ND
Pink 0 0 0 0 0 0 0 11,123 27 0 1,115 ND
Chum 0 0 0 0 0 0 0 1,169 1,090 243 250 ND
$1,107 $370 $0 $0 $0 $0 $0 $12,308 $1,275 $243 $1,530 ND
Average earnings Purse seine $54,210 $137,767 $299,400 $447,404 $352,212 $518,423 $216,813 $206,151 $186,391 $497,214 $291,598 $171,416 Drift gillnet $42,219 $46,807 $68,971 $57,375 $57,262 $75,255 $96,784 $97,916 $105,889 $92,853 $74,133 $100,818 Set gillnet $17,823 $23,840 $53,067 $57,440 $59,737 $132,431 $109,768 $109,768 $89,852 $88,900 $74,263 $104,307
Number of permits fished Purse seine 105 103 111 111 141 154 174 183 224 211 152 222 Drift gillnet 522 508 494 506 507 511 519 513 522 522 512 525 Set gillnet 27 27 26 26 25 27 29 29 29 28 27 29 Note: ND – No data a Confiscated fish.
18
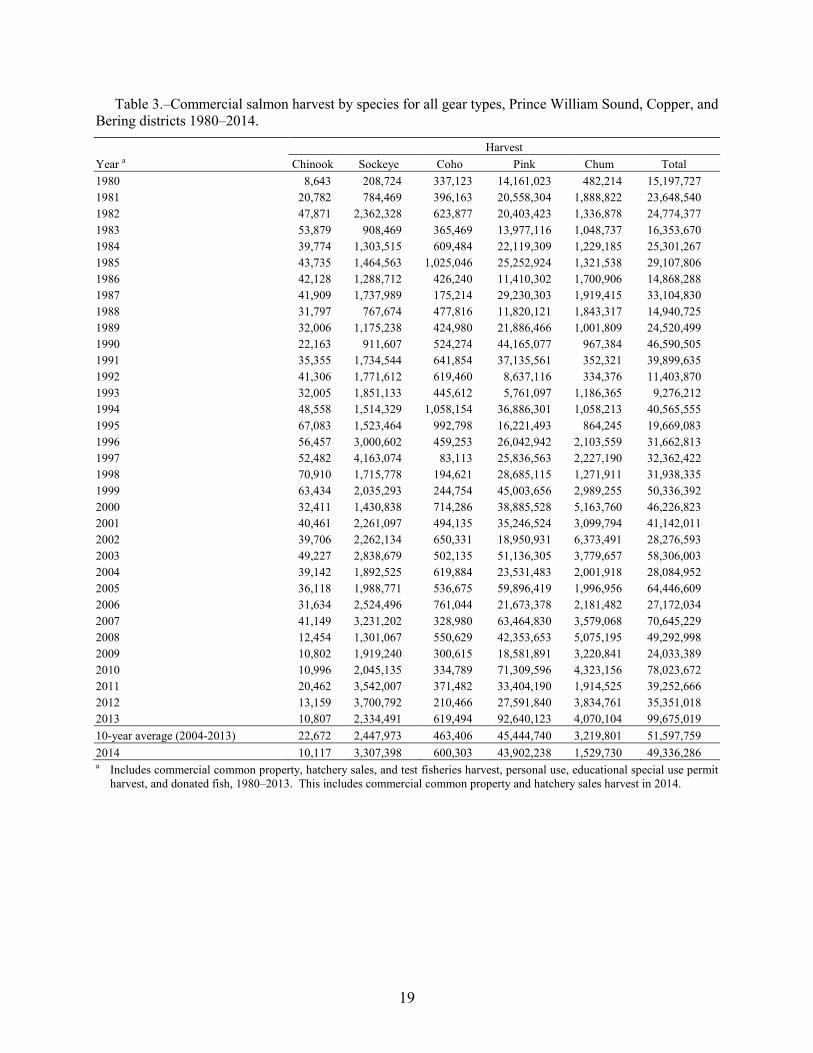
Table 3.–Commercial salmon harvest by species for all gear types, Prince William Sound, Copper, and Bering districts 1980–2014.
Harvest Year a Chinook Sockeye Coho Pink Chum Total 1980 8,643 208,724 337,123 14,161,023 482,214 15,197,727 1981 20,782 784,469 396,163 20,558,304 1,888,822 23,648,540 1982 47,871 2,362,328 623,877 20,403,423 1,336,878 24,774,377 1983 53,879 908,469 365,469 13,977,116 1,048,737 16,353,670 1984 39,774 1,303,515 609,484 22,119,309 1,229,185 25,301,267 1985 43,735 1,464,563 1,025,046 25,252,924 1,321,538 29,107,806 1986 42,128 1,288,712 426,240 11,410,302 1,700,906 14,868,288 1987 41,909 1,737,989 175,214 29,230,303 1,919,415 33,104,830 1988 31,797 767,674 477,816 11,820,121 1,843,317 14,940,725 1989 32,006 1,175,238 424,980 21,886,466 1,001,809 24,520,499 1990 22,163 911,607 524,274 44,165,077 967,384 46,590,505 1991 35,355 1,734,544 641,854 37,135,561 352,321 39,899,635 1992 41,306 1,771,612 619,460 8,637,116 334,376 11,403,870 1993 32,005 1,851,133 445,612 5,761,097 1,186,365 9,276,212 1994 48,558 1,514,329 1,058,154 36,886,301 1,058,213 40,565,555 1995 67,083 1,523,464 992,798 16,221,493 864,245 19,669,083 1996 56,457 3,000,602 459,253 26,042,942 2,103,559 31,662,813 1997 52,482 4,163,074 83,113 25,836,563 2,227,190 32,362,422 1998 70,910 1,715,778 194,621 28,685,115 1,271,911 31,938,335 1999 63,434 2,035,293 244,754 45,003,656 2,989,255 50,336,392 2000 32,411 1,430,838 714,286 38,885,528 5,163,760 46,226,823 2001 40,461 2,261,097 494,135 35,246,524 3,099,794 41,142,011 2002 39,706 2,262,134 650,331 18,950,931 6,373,491 28,276,593 2003 49,227 2,838,679 502,135 51,136,305 3,779,657 58,306,003 2004 39,142 1,892,525 619,884 23,531,483 2,001,918 28,084,952 2005 36,118 1,988,771 536,675 59,896,419 1,996,956 64,446,609 2006 31,634 2,524,496 761,044 21,673,378 2,181,482 27,172,034 2007 41,149 3,231,202 328,980 63,464,830 3,579,068 70,645,229 2008 12,454 1,301,067 550,629 42,353,653 5,075,195 49,292,998 2009 10,802 1,919,240 300,615 18,581,891 3,220,841 24,033,389 2010 10,996 2,045,135 334,789 71,309,596 4,323,156 78,023,672 2011 20,462 3,542,007 371,482 33,404,190 1,914,525 39,252,666 2012 13,159 3,700,792 210,466 27,591,840 3,834,761 35,351,018 2013 10,807 2,334,491 619,494 92,640,123 4,070,104 99,675,019 10-year average (2004-2013) 22,672 2,447,973 463,406 45,444,740 3,219,801 51,597,759 2014 10,117 3,307,398 600,303 43,902,238 1,529,730 49,336,286 a Includes commercial common property, hatchery sales, and test fisheries harvest, personal use, educational special use permit
harvest, and donated fish, 1980–2013. This includes commercial common property and hatchery sales harvest in 2014.
19

Table 4.–Prince William Sound (PWS) Management Area commercial salmon harvest by district and gear type, 2012.
District Permits Chinook Sockeye Coho Pink Chum Total Eastern 216 41 11,907 8,210 10,601,626 102,046 10,723,830 Northern 171 1 534 502 3,677,080 2,149 3,680,266 Coghill 136 15 52,893 3,269 2,304,364 199,010 2,559,551 Northwestern 11 0 58 28 87,010 37 87,133 Southwestern 190 94 84,521 9,950 5,722,240 164,913 5,981,718 Montague 10 0 20 148 187,075 280 187,523 Southeastern 67 35 4,599 219 225,255 35,560 265,668 Unakwik 3 0 353 0 0 1 354 Purse seine 224 186 154,885 22,326 22,804,650 503,996 23,486,043 Bering River 48 1 0 46,169 1 0 46,171 Copper River 510 11,764 1,866,541 130,261 6,011 27,333 2,041,910 Coghill 359 147 383,289 7,724 1,125,888 2,256,915 3,773,963 Eshamy 355 52 987,619 192 88,951 254,774 1,331,588 Montague 54 46 486 27 13,525 325,137 339,221 Unakwik 5 0 1,337 0 16 2 1,355 Drift gillnet 522 12,010 3,239,272 184,373 1,234,392 2,864,161 7,534,208 Eshamy 29 14 294,632 97 17,311 24,368 336,422 Set gillnet 29 14 294,632 97 17,311 24,368 336,422 Solomon Gulch 1 9 1,198 2,372 1,373,104 2,675 1,379,358 Cannery Creek 1 0 0 0 106,625 0 106,625 Wally Noerenberg 1 0 0 0 1,378,093 438,266 1,816,359 Main Bay 0 0 0 0 0 0 0 Armin F. Koernig 1 0 0 0 674,036 0 674,036 Hatchery a 9 1,198 2,372 3,531,858 440,941 3,976,378 Misc total 940 10,805 1,298 3,629 1,295 17,967 PWS total 13,159 3,700,792 210,466 27,591,840 3,834,761 35,351,018 a Hatchery sales for hatchery operating costs.
20
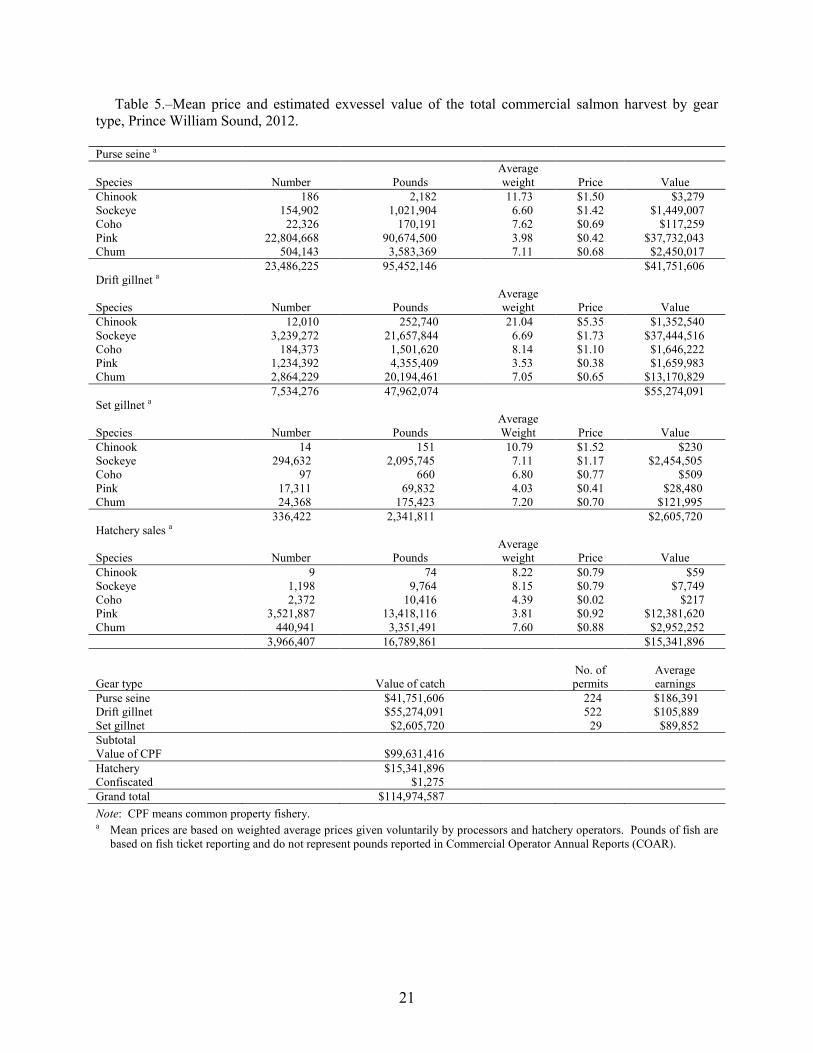
Table 5.–Mean price and estimated exvessel value of the total commercial salmon harvest by gear type, Prince William Sound, 2012.
Note: CPF means common property fishery. a Mean prices are based on weighted average prices given voluntarily by processors and hatchery operators. Pounds of fish are
based on fish ticket reporting and do not represent pounds reported in Commercial Operator Annual Reports (COAR).
Purse seine a
Species Number Pounds Average weight Price Value
Chinook 186 2,182 11.73 $1.50 $3,279 Sockeye 154,902 1,021,904 6.60 $1.42 $1,449,007 Coho 22,326 170,191 7.62 $0.69 $117,259 Pink 22,804,668 90,674,500 3.98 $0.42 $37,732,043 Chum 504,143 3,583,369 7.11 $0.68 $2,450,017
23,486,225 95,452,146
$41,751,606
Drift gillnet a
Species Number Pounds Average weight Price Value
Chinook 12,010 252,740 21.04 $5.35 $1,352,540 Sockeye 3,239,272 21,657,844 6.69 $1.73 $37,444,516 Coho 184,373 1,501,620 8.14 $1.10 $1,646,222 Pink 1,234,392 4,355,409 3.53 $0.38 $1,659,983 Chum 2,864,229 20,194,461 7.05 $0.65 $13,170,829
7,534,276 47,962,074
$55,274,091
Set gillnet a
Species Number Pounds Average Weight Price Value
Chinook 14 151 10.79 $1.52 $230 Sockeye 294,632 2,095,745 7.11 $1.17 $2,454,505 Coho 97 660 6.80 $0.77 $509 Pink 17,311 69,832 4.03 $0.41 $28,480 Chum 24,368 175,423 7.20 $0.70 $121,995
336,422 2,341,811
$2,605,720
Hatchery sales a
Species Number Pounds Average weight Price Value
Chinook 9 74 8.22 $0.79 $59 Sockeye 1,198 9,764 8.15 $0.79 $7,749 Coho 2,372 10,416 4.39 $0.02 $217 Pink 3,521,887 13,418,116 3.81 $0.92 $12,381,620 Chum 440,941 3,351,491 7.60 $0.88 $2,952,252 3,966,407 16,789,861 $15,341,896
No. of Average
Gear type
Value of catch
permits earnings Purse seine
$41,751,606
224 $186,391
Drift gillnet
$55,274,091
522 $105,889 Set gillnet $2,605,720 29 $89,852 Subtotal
Value of CPF $99,631,416 Hatchery
$15,341,896
Confiscated
$1,275 Grand total $114,974,587
21

Table 6.–Prince William Sound (PWS) Management Area commercial salmon harvest by district and gear type, 2013.
District Permits Chinook Sockeye Coho Pink Chum Total Eastern 208 217 13,024 159,236 25,566,365 94,277 25,833,119 Northern 178 18 3,462 3,261 17,062,533 6,326 17,075,600 Coghill 130 32 1,978 7,573 6,690,850 70,271 6,770,704 Northwestern 10 0 471 97 110,432 171 111,171 Southwestern 188 238 46,574 48,276 33,510,249 275,290 33,880,627 Montague 10 0 11 2,085 413,816 41 415,953 Southeastern 71 270 8,392 1,455 2,570,809 40,929 2,621,855 Unakwik - 0 2,815 1 81 159 3,056 Purse seine 211 775 76,727 221,984 85,925,135 487,464 86,712,085 Bering River 56 16 3,286 46,959 2 16 50,279 Copper River 515 8,826 1,607,992 244,985 65,366 10,169 1,937,338 Coghill 388 259 93,734 62,968 2,450,108 2,100,341 4,707,410 Eshamy 326 74 336,061 1,724 62,176 184,334 584,369 Montague 151 140 2,077 255 28,097 483,686 514,255 Unakwik - 1 776 0 203 28 1,008 Drift gillnet 526 9,316 2,043,926 356,891 2,605,952 2,778,574 7,794,659 Eshamy 29 59 203,019 360 19,114 42,630 265,182 Set gillnet 29 59 203,019 360 19,114 42,630 265,182 Solomon Gulch 1 0 9 39,946 2,274,237 75 2,314,267 Cannery Creek 1 0 0 0 0 0 0 Wally Noerenberg 1 0 0 0 1,318,914 761,280 2,080,194 Main Bay 0 0 0 0 0 0 0 Armin F. Koernig 1 0 0 0 496,523 0 496,523 Hatchery a 0 9 39,946 4,089,674 761,355 4,890,984 Misc total 657 10,810 313 248 81 12,109 PWS total 10,807 2,334,491 619,494 92,640,123 4,070,104 99,675,019 a Hatchery sales for hatchery operating costs.
22

Table 7.–Mean price and estimated exvessel value of the total commercial salmon harvest by gear type, Prince William Sound, 2013. Purse seine a Average
Species Number Pounds weight Price Value Chinook 775 8,201 10.58 $1.88 $15,444 Sockeye 76,727 470,891 6.14 $1.69 $796,220 Coho 221,984 1,697,940 7.65 $0.95 $1,608,923 Pink 85,925,135 238,018,132 2.77 $0.42 $100,334,069 Chum 487,464 3,683,581 7.56 $0.59 $2,157,525
86,712,085 243,878,745
$104,912,182
Drift gillnet a
Average Species Number Pounds Weight Price Value
Chinook 9,316 172,845 18.55 $5.63 $973,720 Sockeye 2,043,926 12,493,882 6.11 $2.35 $29,389,403 Coho 356,891 2,892,610 8.11 $1.38 $3,986,567 Pink 2,605,952 7,179,124 2.75 $0.34 $2,465,469 Chum 2,778,574 20,609,389 7.42 $0.57 $11,654,134
7,794,659 43,347,850
$48,469,293
Set gillnet a
Average Species Number Pounds Weight Price Value
Chinook 59 1,005 17.03 $3.00 $3,015 Sockeye 203,019 1,200,938 5.92 $1.90 $2,278,575 Coho 360 2,501 6.95 $1.02 $2,556 Pink 19,114 52,786 2.76 $0.32 $17,062 Chum 42,630 318,383 7.47 $0.59 $188,004
265,182 1,575,613
$2,489,211
Hatchery sales a
Average Species Number Pounds weight Price Value
Chinook 0 0 0.00 $0.00 $0 Sockeye 9 65 7.22 $1.69 $110 Coho 39,946 307,494 7.70 $0.70 $214,752 Pink 4,089,674 11,226,239 2.75 $0.78 $8,765,309 Chum 761,355 5,638,467 7.41 $0.61 $3,424,927 4,890,984 17,172,265 $12,405,098
No. of Average Gear type Value of catch permits earnings Purse seine
$104,912,182
211 $497,214
Drift gillnet
$48,469,293
522 $92,853 Set gillnet $2,489,211 28 $88,900 Subtotal
Value of CPF catch $155,870,686 Hatchery
$12,405,098
Confiscated
$243 Grand total $168,276,028
Note: CPF means common property fishery. a Mean prices are based on weighted average prices given voluntarily by processors and hatchery operators. Pounds of fish are
based on fish ticket reporting and do not represent pounds reported in Commercial Operator Annual Reports (COAR).
23

Table 8.–Prince William Sound (PWS) Management Area commercial salmon harvest by district and gear type, 2014.
District Permits Chinook Sockeye Coho Pink Chum Total Eastern 217 27 9,474 1,998 19,288,176 87,740 19,387,415 Northern 164 4 3,343 2,020 4,989,618 2,862 4,997,847 Coghill 65 0 332 7,683 918,143 299 926,457 Northwestern 10 0 418 139 70,684 5,884 77,125 Southwestern 191 114 28,360 18,386 8,779,636 58,245 8,884,741 Montague 113 210 10,850 873 2,881,396 179,413 3,072,742 Southeastern 4 0 4 0 10,144 12,747 22,895 Unakwik 9 0 346 0 0 112 458 Purse seine 222 355 53,127 31,099 36,937,797 347,302 37,369,680 Bering River 83 0 50 98,041 4 0 98,095 Copper River 518 9,626 2,068,418 317,259 11,614 42,610 2,449,527 Coghill 284 79 165,596 139,732 1,214,725 670,790 2,190,922 Eshamy 311 35 760,706 607 189,940 77,647 1,028,935 Unakwik 4 0 275 0 3 23 301 Drift gillnet 525 9,740 2,995,045 555,639 1,416,286 791,070 5,767,780 Eshamy 29 22 259,226 65 35,681 20,882 315,876 Set gillnet 29 22 259,226 65 35,681 20,882 315,876 Solomon Gulch 1 0 0 0 1,928,557 0 1,928,557 Cannery Creek 1 0 0 0 303,099 0 303,099 Wally Noerenberg 1 0 0 13,500 2,180,361 370,476 2,550,837 Main Bay 0 0 0 0 0 0 0 Armin F. Koernig 1 0 0 0 1,100,457 0 1,100,457 Hatchery a
0 0 13,500 5,512,474 370,476 5,882,950
PWS total 10,117 3,307,398 600,303 43,902,238 1,529,730 49,335,828 a Hatchery sales for hatchery operating costs.
24

Table 9.–Mean price and estimated exvessel value of the total commercial salmon harvest by gear type, Prince William Sound, 2014.
Purse seine
Average
Species Number Pounds a weight Price a
Value
Chinook 355 4,541 12.79 $1.74
$7,913
Sockeye 53,127 288,719 5.43 $1.90
$547,367
Coho 31,099 229,212 7.37 $0.81
$185,624
Pink 36,937,797 124,318,479 3.37 $0.29
$35,542,741
Chum 347,302 2,714,550 7.82 $0.65 $1,770,780
37,369,680 127,555,501
$38,054,424
Drift gillnet a
Average
Species Number Pounds weight Price Value
Chinook 9,740 174,104 17.88 $6.41
$1,116,059
Sockeye 2,995,045 17,868,696 5.97 2.31
$41,307,876
Coho 555,639 4,538,873 8.17 $1.13
$5,126,103
Pink 1,416,286 5,022,652 3.55 0.30
$1,510,359
Chum 791,070 5,973,743 7.55 $0.65 $3,869,082
5,767,780 33,578,068
$52,929,479
Set gillnet a
Average
Species Number Pounds weight Price Value
Chinook 22 328 14.91 $2.35
$769
Sockeye 259,226 1,457,775 5.62 $1.98
$2,881,576
Coho 65 511 7.86 $0.88
$451
Pink 35,681 119,268 3.34 $0.30
$35,588
Chum 20,882 159,036 7.62 $0.67 $106,524
315,876 1,736,918
$3,024,908
Hatchery sales a
Average
Species Number Pounds weight Price Value
Chinook 0 0 0.00 $0.00
$0
Sockeye 0 0 0.00 $0.00
$0
Coho 13,500 84,510 6.26 $0.24
$20,128
Pink 5,512,474 18,632,162 3.38 $0.62
$11,504,489
Chum 370,476 2,811,913 7.59 $0.54
$1,514,775
5,896,450 21,528,585
$13,039,393
No. of
Average
Gear type Value of catch permits earnings
Purse seine
$38,054,424
222
$171,416
Drift gillnet
$52,929,479
525
$100,818
Set gillnet $3,024,908 29 $104,307
Subtotal-
Value of CPF catch $94,008,811
Hatchery
$13,039,393
Grand total $107,048,205 Note: CPF means common property fishery. a Mean prices are based on weighted average prices given voluntarily by processors and hatchery operators. Pounds of fish are
based on fish ticket reporting and do not represent pounds reported in Commercial Operator Annual Reports (COAR).
25

Table 10.–Preseason harvest projections for the 2012 commercial salmon fishery by district and species (thousands of fish), Prince William Sound Area.
Chinook Sockeye Coho a Pink Chum
Point
Point
Point
Point
Point
District/facility b Forecast type c estimate Range estimate Range estimate Range estimate Range estimate Range Copper River d CPF harvest 27 6–60 1,190 520–1,860 281 7–555
Bering River e CPF harvest
17 0–52 53 0–117
Coghill f CPF harvest
291 154–428
Eshamy f CPF harvest
33 9–57
Unakwik g CPF harvest
7 2–11
General districts CPF harvest
3,240 1,610–6,710 36 0–182 Total wild stock 27 6–60 1,538 853–2,223 334 55–615 3,240 1,610–6,710 36 0–182 SGH CPF harvest
118 10,832
AFK CPF harvest
6,327
210 WNH h CPF harvest
261
5,218
1,164
CCH CPF harvest
4,620
MBH i CPF harvest
1,191
GH CPF harvest
230 100–370
Total hatchery 1,421 379 26,997 1,374
Total hatchery and wild 27 2,959 713 30,237 1,410 Note: Prince William Sound (PWS) Area hatchery facility abbreviations include SGH (Solomon Gulch Hatchery), AFK (Armin F. Koernig Hatchery), WNH (Wally Noerenberg
Hatchery), CCH (Cannery Creek Hatchery), MBH (Main Bay Hatchery), and GH (Gulkana Hatchery). a ADF&G provides commercial common property (CCPF) harvest forecasts for Copper River and Bering River coho salmon. b ADF&G provides common property fishery (CPF) harvest forecasts for all wild stocks and Gulkana Hatchery sockeye salmon. Hatchery operators provide CPF forecasts for
PWS hatchery returns and Gulkana Hatchery sockeye salmon. Harvest projections do not include salmon harvested by hatcheries for cost recovery. c Formal forecast procedures are used for estimating wild stock runs of pink and chum salmon in PWS. Hatchery contributions are based on known fry releases and average
marine survival rates. Harvest estimates are made only for species that constitute a significant portion of the catch. d Formalized sibling model forecast procedures are used for Copper River sockeye salmon runs. Copper River Chinook and coho salmon harvest estimates are based on the mean
annual harvest (5-year for Chinook and 10-year for coho salmon). e Bering River coho and sockeye salmon harvest estimates are based on 10-year mean annual harvest. f Formalized sibling model forecast procedures are used for Coghill and Eshamy District sockeye salmon runs. The Coghill District's wild pink and chum salmon harvest is
included in the "General (PWS) districts" projection. g The Unakwik District sockeye salmon harvest estimate is based on the 10-year mean annual harvest. h Wally Noerenberg Hatchery chum and coho salmon harvest estimates include all on-site and remote release runs of chum and coho salmon. i Main Bay Hatchery sockeye salmon harvest estimate includes all on-site and remote release runs of sockeye salmon.
26

Table 11.–Preseason harvest projections for the 2013 commercial salmon fishery by district and species (thousands of fish), Prince William Sound Area.
Chinook
Sockeye
Coho a
Pink Chum
Point
Point
Point
Point
Point
District/facility b Forecast type c estimate Range estimate Range estimate Range estimate Range estimate Range Copper River d CPF harvest 20 1–48 1,220 550–1,890 240 18–463
Bering River e CPF harvest
17 0–52 47 0–98
Coghill f CPF harvest
126 58–300
Eshamy f CPF harvest
32 9–57
Unakwik g CPF harvest
6 1–10
General districts CPF harvest
4,751 0–22,151 312 18–631 Total wild stock 20 1–48 1,401 727–2,100 287 60–516 4,751 0–22,151 312 18–631 SGH CPF harvest
106 10,872
AFK CPF harvest
6,123
306 WNH h CPF harvest
72
5,497
2,513
CCH CPF harvest
6,728
MBH i CPF harvest
1,128
GH CPF harvest
280 130–440
Total hatchery 1,408 178 29,220 2,819
Total hatchery and wild 20 2,809 465 33,971 3,131 Note: Prince William Sound (PWS) Area hatchery facility abbreviations include SGH (Solomon Gulch Hatchery), AFK (Armin F. Koernig Hatchery), WNH (Wally Noerenberg
Hatchery), CCH (Cannery Creek Hatchery), MBH (Main Bay Hatchery), and GH (Gulkana Hatchery). a ADF&G provides commercial common property (CCPF) harvest forecasts for Copper River and Bering River coho salmon. b ADF&G provides common property fishery (CPF) harvest forecasts for all wild stocks and Gulkana Hatchery sockeye salmon. Hatchery operators provide CPF forecasts for
PWS hatchery returns and Gulkana Hatchery sockeye salmon. Harvest projections do not include salmon harvested by hatcheries for cost recovery. c Formal forecast procedures are used for estimating wild stock runs of pink and chum salmon in PWS. Hatchery contributions are based on known fry releases and average
marine survival rates. Harvest estimates are made only for species that constitute a significant portion of the catch. d Formalized sibling model forecast procedures are used for Copper River sockeye salmon runs. Copper River Chinook and coho salmon harvest estimates are based on the mean
annual harvest (5-year for Chinook and 10-year for coho salmon). e Bering River coho and sockeye salmon harvest estimates are based on 10-year mean annual harvest. f Formalized sibling model forecast procedures are used for Coghill and Eshamy District sockeye salmon runs. The Coghill District's wild pink and chum salmon harvest is
included in the "General (PWS) districts" projection. g The Unakwik District sockeye salmon harvest estimate is based on the 10-year mean annual harvest. h Wally Noerenberg Hatchery chum and coho salmon harvest estimates include all on-site and remote release runs of chum and coho salmon. i Main Bay Hatchery sockeye salmon harvest estimate includes all on-site and remote release runs of sockeye salmon.
27

Table 12.–Preseason harvest projections for the 2014 commercial salmon fishery by district and species (thousands of fish), Prince William Sound Area.
Chinook Sockeye Coho a Pink Chum
Point
Point
Point
Point
Point
District/facility b Forecast type c estimate Range estimate Range estimate Range estimate Range estimate Range Copper River d CPF harvest 22 10–40 1,340 768–1,905 229 23–434
Bering River e CPF harvest
15 0–52 46 0–96
Coghill f CPF harvest
168 92–363
Eshamy f CPF harvest
32 9–57
Unakwik g CPF harvest
6 1–11
General districts CPF harvest
3,140 0–17,840 245 0–522 Total wild stock 22 10–40 1,561 983–2,160 275 64–486 3,140 0–17,840 245 0–522 SGH CPF harvest
57 10,182
AFK CPF harvest
5,919
492 WNH h CPF harvest
214
8,003
1,233
CCH CPF harvest
4,009
MBH i CPF harvest
1,029
GH CPF harvest
265 152–378
Total hatchery 1,294 152–378 271 28,113 1,725
Total hatchery and wild 22 2,855 546 31,253 1,970 Note: Prince William Sound (PWS) Area hatchery facility abbreviations include SGH (Solomon Gulch Hatchery), AFK (Armin F. Koernig Hatchery), WNH (Wally Noerenberg
Hatchery), CCH (Cannery Creek Hatchery), MBH (Main Bay Hatchery), and GH (Gulkana Hatchery). a ADF&G provides commercial common property (CCPF) harvest forecasts for Copper River and Bering River coho salmon. b Formal forecast procedures are used for estimating wild stock runs of pink and chum salmon in PWS. Hatchery contributions are based on known fry releases and average
marine survival rates. Harvest estimates are made only for species that constitute a significant portion of the catch. c ADF&G provides common property fishery (CPF) harvest forecasts for all wild stocks and Gulkana Hatchery sockeye salmon. Hatchery operators provide CPF forecasts for
PWS hatchery returns and Gulkana Hatchery sockeye salmon. Harvest projections do not include salmon harvested by hatcheries for cost recovery. d Formalized sibling model forecast procedures are used for Copper River sockeye salmon runs. Copper River Chinook and coho salmon harvest estimates are based on the mean
annual harvest (5-year for Chinook and 10-year for coho salmon). e Bering River coho and sockeye salmon harvest estimates are based on 10-year mean annual harvest. f Formalized sibling model forecast procedures are used for Coghill and Eshamy District sockeye salmon runs. The Coghill District's wild pink and chum salmon harvest is
included in the "General (PWS) districts" projection. g The Unakwik District sockeye salmon harvest estimate is based on the 10-year mean annual harvest. h Wally Noerenberg Hatchery chum and coho salmon harvest estimates include all on-site and remote release runs of chum and coho salmon. i Main Bay Hatchery sockeye salmon harvest estimate includes all on-site and remote release runs of sockeye salmon.
28

Table 13.–Harvest values (millions) and allocation percentages by gear type for Area E, 2000–2013.
Year DGN %DGN PS %PS SGN %SGN Annual Total 2000 $8.96 47.8% $9.79 52.2% $0.51 2.7% $19.26 2001 $8.29 68.3% $3.85 31.7% $0.95 7.3% $13.09 2002 $8.83 65.0% $4.76 35.0% $1.17 7.9% $14.76 2003 $6.94 44.3% $8.72 55.7% $1.07 6.4% $16.73 2004 $4.03 71.0% $1.65 30.0% $0.42 6.9% $6.10 2005 $4.37 34.5% $8.31 65.6% $0.43 3.3% $13.11 2006 $7.01 54.5% $5.85 45.5% $0.78 5.7% $13.64 2007 $8.37 33.8% $16.39 66.2% $1.29 4.9% $26.05 2008 $18.06 33.2% $36.41 66.9% $1.30 2.3% $55.77 2009 $15.55 61.5% $9.72 38.5% $1.58 5.9% $26.85 2010 $36.55 36.0% $64.98 64.0% $3.41 3.2% $104.93 2011 $25.24 65.2% $13.46 34.8% $2.87 6.9% $41.57 2012 $30.38 58.7% $21.36 41.3% $3.13 5.7% $54.86 2013 $25.05 31.2% $55.19 68.8% $2.41 2.9% $82.65 Note: Drift gillnet (DGN), purse seine (PS), set gillnet (SGN).
Table 14.–Five year rolling average allocation percentages by gear type for Area E, 2006–2015.
Year DGN PS SGN 2006 56.3% 43.7% 5.9% 2007 54.3% 45.7% 6.3% 2008 51.6% 48.4% 6.0% 2009 42.9% 57.1% 5.3% 2010 37.9% 62.1% 3.7% 2011 41.0% 59.0% 4.0% 2012 39.1% 60.9% 3.7% 2013 42.4% 57.6% 4.1% 2014 46.3% 53.7% 4.3% 2015 44.6% 55.4% 4.3% Note: Drift gillnet (DGN), purse seine (PS), set gillnet (SGN).
29

Figure 1.–Prince William Sound Management Area showing towns, commercial fishing districts, salmon hatcheries, weir locations, and the
Miles Lake sonar camp.
Whittier
Valdez
Cordova
30

Figure 2.–Commercial salmon harvests in Prince William Sound, 1980–2014.
Chinook
31

Figure 3.–Exvessel value of the commercial salmon harvest by gear type, 2004–2014.
32