principals' systems thinking: the meaning and measure of a
TRANSCRIPT
PRINCIPALS' SYSTEMS THINKING MEASURE 1
Principals' Systems Thinking:
The Meaning and Measure of a Leadership Construct
Haim Shaked - Hemdat Hadarom College of Education
Pascale Benoliel - Bar Ilan University
Nechama Nadav - Bar Ilan University
Chen Schechter - Bar Ilan University
(Chapter in the book Leading Holistically: How Schools, Districts, and States Improve Systemically)
Abstract
The present chapter explores the meaning of systems thinking (ST) in schools and reports on
our development of a measure of elementary school principals' ST (PST). During the scale’s
development, data were collected in three waves, from three different samples totalling 414
mid-level school leaders in Israel, who rated the ST of the principals in their elementary
schools. First, relevant items were developed and pilot-tested through principal components
analysis. Then, exploratory and confirmatory factor analyses of items were conducted using
two new independent samples to assess factorial validity. Findings indicated that a four-factor
model of PST was the best fit between the empirical results and the conceptual formulation.
Thus, according to mid-level leaders’ perceptions, PST comprises the following factors:
Evaluating significance; Openness to a variety of opinions; Leading wholes; and Adopting a
multidimensional view. Further, supporting criterion-related validity, the PST Scale was
found to correlate significantly with two relevant established constructs: instructional
leadership and organizational commitment. The PST instrument developed in this study
opens new avenues for research regarding school leaders’ effects on organizational
characteristics and student outcomes. Practically, measuring PST may be valuable at various
stages throughout principals' professional and career development.
A school is an inherently complex organization, involving a vast number of
interacting functions, people, and purposes (Crick, Barr, Green, & Pedder, 2017; Ng, 2015).
As such, school leaders often encounter conflicts concerning potential choices of action, each
with its pros and cons, as well as conflicts emanating from various stakeholders' diverse or
even incompatible aspirations, views, expectations, and demands (Saiti, 2015). Practitioners

PRINCIPALS' SYSTEMS THINKING MEASURE 2
and researchers alike agree that recent years have brought even more challenging
complexities to school leadership (Fullan, 2014; Hargreaves & Braun, 2013). Hence, the
traditional “toolkit” that school principals have at their disposal is often insufficient to
provide effective strategies for meeting today's almost incredible array of difficulties and
expectations (Louis, Leithwood, Wahlstrom, & Anderson, 2010). Therefore, school
principals sorely need comprehensive theoretical frameworks accompanied by
complementary strategies to guide them toward success (Fullan, 2014). Particularly, current
school principals facing today's educational leadership complexities may benefit from the
holistic perspective of systems thinking.
Systems thinking (ST), which does not try to break systems down into parts in order
to understand them but rather concentrates on how the parts function together in networks of
interaction (Gharajedaghi, 2011; Senge, 2006), has been recognized as an effective
management approach (Brown, 2012; Jolly, 2015; Wilson & Van Haperen, 2015) with a wide
range of applications (e.g., Holmes, Finegood, Riley, & Best, 2012; Leischow et al., 2008;
Tejeda & Ferreira, 2014). For example, strong statistical correlations have been found
between ST and project performance (Elm & Goldenson, 2012).
However, in the context of school leadership, ST has not yet received sufficient
empirical attention (Shaked & Schechter, 2017). Several educational guidebooks have
suggested ways to implement ST into schools, offering practical advice on the use of such
thinking to confront present-day educational demands and challenges, including structured
models for successful educational reforms (e.g., Fullan, 2005; Senge et al., 2012). Yet, few
researchers have empirically examined the dimensions of principals' ST (PST) and their
application in school practices. Based on our recent conceptualization of ST in school
leadership and qualitative exploration of PST characteristics (Shaked & Schechter, 2014,
2017), in this chapter we report on our development of a valid, reliable instrument to measure

PRINCIPALS' SYSTEMS THINKING MEASURE 3
PST as it is manifested in today’s schools. Before describing the scale’s development and
testing, we first present theoretical background on ST in general, and ST in the context of
school principals, and PST’s expected associations with two other relevant, established
constructs: instructional leadership and organizational commitment.
The Systems Thinking (ST) Framework and Definitions
ST is not a discipline in and of itself, but rather an interdisciplinary conceptual
framework that is employed in a wide range of areas. It may be regarded as a type of
orientation or approach toward the world at large, or a model for thinking and learning about
any given system – scientific, organizational, personal, or public (Cabrera & Cabrera, 2015).
Thus, the literature on ST encompasses a broad range of fields, yielding a variety of
definitions for the concept. Mainly representing the interdisciplinary area of systems science,
these definitions cover complex systems, cybernetics and dynamical systems theory, and
applications in the natural and social sciences as well as in engineering (Hieronymi, 2013).
Here are some of the definitions and explanations for ST formulated by scholars in
recent decades, presented in chronological order: Senge (1990, p. 68) defined ST as “a
discipline for seeing wholes. It is a framework for seeing interrelationships rather than things,
for seeing patterns of change rather than static ‘snapshots.’ It is a set of general principles…
It is also a set of specific tools and techniques.” Richmond (1994, p. 141) asserted that ST is
“the art and science of making reliable inferences about behavior by developing an
increasingly deep understanding of underlying structure.” Sterman (2000, p. 4) viewed ST as
“the ability to see the world as a complex system, in which we understand that ‘you can't just
do one thing’ and that ‘everything is connected to everything else.’” Arnold and Wade (2015,
p. 675) opined that ST is “a set of synergistic analytic skills used to improve the capability of
identifying and understanding systems, predicting their behaviors, and devising modifications
to them in order to produce desired effects. These skills work together as a system.”

PRINCIPALS' SYSTEMS THINKING MEASURE 4
Despite the absence of one commonly accepted definition for ST, these diverse
definitions clearly yield two basic complementary meanings of the construct: rising above the
separate components to see the whole system, and thinking about each separate component as
part of the whole system (Shaked & Schechter, 2014, 2017). Thus, ST advocates stepping
back to focus not only on the trees but also on the forest – where the trees are particular
situations or limited domains, while the forest is an overall view (Richmond, 2000). From the
ST perspective, people should not get “snagged” by the details. Instead, one must discern an
overall pattern from the mass of detail, aggregating and integrating this data into a holistic
framework (Frank, 2012). The only way to fully understand a system is to understand its
parts in relation to the whole, because the system's defining characteristics comprise the
characteristics of that very whole, which cannot be found in the isolated parts. Once the
system is analyzed – taken apart – these defining characteristics of the whole get lost
(Jackson, 2010).
According to ST, the many interactions that transpire within each system cannot be
reduced to a single cause-effect relationship. The first event is likely to contribute to the
second event, but many additional events are also seen as contributing to that second event.
Thus, all explanations for the second event should take into account the influence of multiple
factors. The explanation for any phenomenon within a system cannot be too simplistic,
and the impact of the environment cannot be ignored (Hitchins, 2007). That is, causation in
systems is less straightforward and salient, necessitating a broader understanding of the
system as a whole (Senge, 2006).
ST is considered to be a key management competency (Brown, 2012). Especially in
the 21st century, as the world becomes ever more tightly interwoven globally and the pace of
change continues to grow, managers need to become increasingly "system-wise," applying
ST principles and practices in their organizations (Jolly, 2015; Wilson & Van Haperen,

PRINCIPALS' SYSTEMS THINKING MEASURE 5
2015). The benefits of ST in various management areas (e.g., Holmes et al., 2012; Leischow
et al., 2008; Tejeda & Ferreira, 2014) suggest that ST may also be valuable for school
principals.
Characteristics of School Principals' Systems Thinking (PST)
The existing literature on ST in school leadership, which we recently reviewed
(Shaked & Schechter, 2017), is important, albeit limited. To advance knowledge in this
domain, we conducted a qualitative study (Shaked & Schechter, 2014, 2017) to pinpoint the
characteristics of PST. This study identified four major ways in which principals apply the
ST approach and perform at the ST level in their schools:
(1) Leading wholes. This characteristic of “leading wholes” refers to principals'
holistic perspective, oriented toward seeing the big picture and not only its individual parts.
Such principals perceive and conceptualize all aspects of school life as one large system.
Sub-characteristics include, for example, the capacity to tolerate ambiguity and uncertainty,
which derives from an ability to understand that a current situation’s seemingly separate or
confusing details are actually parts of one big picture.
(2) Influencing indirectly. This characteristic refers to principals' ability to address
school goals and challenges circuitously, based on their awareness that countless reciprocal
influences are at play among various school elements, each of which is connected to others,
affecting them and being affected by them. Sub-characteristics include, for example, the
ability to motivate teachers through responsibility rather than through blame, which derives
from principals' recognition of the indirect influences of their own actions on the staff's
functioning.
(3) Adopting a multidimensional view. This characteristic refers to the principal’s
contemplation of several aspects of a given issue simultaneously. Any given issue's
emergence and existence will be regarded by effective principals as stemming from a wide

PRINCIPALS' SYSTEMS THINKING MEASURE 6
range of potential sources. They will consider the issue's consequences, before proceeding to
predict various optional courses of future action or development. Sub-characteristics include,
for example, openness to a variety of opinions, which enables seeing the multiple aspects of
any situation within school.
(4) Evaluating significance. This characteristic refers to the principal’s ability to
envision elements of school life according to their significance for the entire system.
Principals prioritize issues to be resolved according to their degree of importance and
urgency, while also identifying patterns as they go along. Sub-characteristics include, for
example, the capacity to balance internal and external relationships and needs, thereby
successfully negotiating between internal desires and capacities and outside demands and
expectations.
These four characteristics clearly tie in with the two major meanings of ST. Leading
wholes and adopting a multidimensional view reflect seeing the whole beyond its parts, while
influencing indirectly and evaluating significance are related to seeing the parts in the context
of the whole.
To date, ST in school leadership was rarely explored empirically, and then only
through qualitative methodology, which did not yet yield a valid instrument to measure this
construct and distinguish its characteristics. The present chapter presents our study that aimed
to design such an instrument in line with the theoretical model and structural characteristics
of PST, while testing its criterion-related validity by examining the newly developed scale’s
correlations with two established, related constructs: instructional leadership and
organizational commitment.
Systems Thinking (ST), Instructional Leadership (IL), and Organizational
Commitment (OC)
In recent decades, principals have faced superintendents’ and policy makers’ clear

PRINCIPALS' SYSTEMS THINKING MEASURE 7
expectation to become “instructional leaders” – who focus efforts squarely on the
improvement of teaching and learning as the school’s primary goal (May & Supovitz, 2011;
Rigby, 2014). The instructional leadership (IL) framework arose from the close connections
identified between teachers' quality of instruction and students' academic results (Murphy,
Neumerski, Goldring, Grissom, & Porter, 2016). Thus, as instructional leaders, principals are
expected to give student learning top priority, with everything else revolving around the
enhancement of that learning (Hallinger, 2011; Supovitz, Sirinides, & May, 2010).
Practically, IL reflects those actions that a principal takes to promote growth in student
learning and academic success (Armstrong, 2007; Stronge, Richard, & Catano, 2008; Walker
& Slear, 2011). The links between principals' IL and students' achievements, predominantly
through indirect means, have been clearly established through research (Glickman, Gordon,
& Ross-Gordon, 2014).
IL may be related to PST because, as an approach that allows a view of the whole
picture, ST enables managers to concentrate on the organization's main goals (Frank, 2012).
It allows managers to keep focused on the organization's key objectives, and not to be
distracted by other events or pressures (Brown, 2012; Jolly, 2015). Therefore, PST may be
linked to IL, which calls upon principals to maintain their focus on achieving the school’s
central goal – to improve teaching and learning in order to affect student achievements
(Neumerski, 2012).
In addition, the current study explored the relations between the characteristics of PST
and teachers' organizational commitment (OC). OC as defined by Mowday, Steers, and Porter
(1979) is “the relative strength of an individual's identification with and involvement in a
particular organization” (p. 226). ST was found to be advantageous for various managerial
aspects (Holmes et al., 2012; Tejeda & Ferreira, 2014), including increased OC among
employees. Specifically, in schools, the OC of teachers is important for school effectiveness

PRINCIPALS' SYSTEMS THINKING MEASURE 8
and indirectly affects students' outcomes (Park, 2005). The OC concept is based on three
factors: identification – acceptance of the organization's goals and values; involvement –
willingness to invest effort on behalf of the organization; and loyalty – the importance
attached to keeping up membership in the organization (Bogler & Somech, 2004). Several
studies indicated that teachers' commitment to the school can be an important predictor of
teachers' job performance because it is positively related to their dedication to attaining
organizational goals (Dee, Henkin, & Singleton, 2006; Sammons et al., 2007). When a
manager is running at systems level, employees' psychological attachment to the organization
is expected to increase (Brown, 2012; Jolly, 2015). Thus, PST may be related to teachers'
OC.
Development of the PST Scale
To empirically assess the characteristics of PST, we sought to identify the practical
ways in which principals might lead schools through the ST framework, as perceived by the
mid-level school leaders working in everyday situations under the principal. Mid-level
leaders constitute the “intermediate layer” in the school's organizational structure, located
between the senior leadership – which usually includes the principal and assistant principal –
and the classroom teachers (Crane, 2014; Gurr & Drysdale, 2013). Inasmuch as they hold
management responsibility either for staff or for a certain aspect of the school's work, such as
grade-level coordinators or subject coordinators, their role involves close work with
principals (Fleming & Amesbury, 2012; Thorpe & Bennett-Powell, 2014). Thus, they were
chosen as reliable informants to reporting on the everyday ST of their principals.
As described below, we developed the Principal System Thinking (PST) Scale in two
phases, examining three independent samples. In Phase 1, we first generated relevant items
for the PST Scale based on our prior qualitative research (Shaked & Schechter, 2014, 2017).
These potential items were then pooled, subjected to content validation, and pilot-tested on

PRINCIPALS' SYSTEMS THINKING MEASURE 9
185 mid-level elementary school leaders using Principal Components Analysis to explore the
scale’s factor structure, reliability, and validity. In Phase 2, a revised scale was created, the
items were submitted to exploratory factor analysis (N = 129), and then the proposed scale
was validated by confirmatory factor analysis (N = 100). Then, we examined correlations of
PST with the two other established constructs, IL and OC, to check criterion-related validity.
Phase 1: Item Generation, Content Validation, and Pilot Testing (N = 185)
Item generation. To design a measure based on Shaked and Schechter's (2014, 2017)
aforementioned four characteristics of ST in school leadership, we have developed empirical
indicators specifically formulated for mid-level school leaders to assess practical indicators of
their principals' competencies. Thus, we initially designed 45 items with the following
characteristic-level distribution: Leading wholes (14 items); Influencing indirectly (7 items);
Adopting a multidimensional view (18 items); and Evaluating significance (6 items).
Content validation. Proposed items’ applicability was evaluated by five experts from
the educational administration field and two additional experts from the ST field. Experts
were asked to evaluate the 45 proposed PST Scale items, and to either retain or generate a
modification/replacement for each item. Thereafter, each member of our research team
independently reviewed the full list of potential items and the experts' comments. Based on
this procedure, a draft version of the PST Scale was devised.
Next, 60 teachers from various elementary schools in Israel evaluated the draft
version of the proposed Hebrew scale. Their remarks regarding items' clarity and response
scale, as well as their recommendations for modifying, adding, and deleting items, were
considered. This procedure yielded a 38-item pilot scale to be rated along a 5-point Likert-
type response scale ranging from Never (1) to Always (5). The pilot PST Scale had the
following subscale distribution according to the four characteristics: Leading wholes (13
items); Influencing indirectly (5 items); Adopting a multidimensional view (15 items); and

PRINCIPALS' SYSTEMS THINKING MEASURE 10
Evaluating significance (5 items).
Pilot study: Item reduction (Principal Components Analysis). The 38-item pilot
scale was distributed to a sample of 185 mid-level leaders (response rate = %70 ) from 43
randomly selected elementary schools in Israel. These mid-level leaders had a mean age of
38.30 years (SD = 8.01), 50.3% were women, and their mean job tenure in the profession was
12.32 years (SD = 7.88). Participation was voluntary, the purpose of the study was explained,
anonymity was guaranteed, and the importance of candid answers was emphasized.
Data collected from these 185 mid-level leaders were subjected to principal
components factor analysis with varimax rotation of the items, identifying common factors
with eigenvalues greater than 1. In general, factor loadings were strong, above .50. Seven
items, which loaded on more than one factor at .40 or above, and six items which loaded
lower than .35 on any one factor, were eliminated. Moreover, four items that substantially
reduced subscales’ internal consistency (Cronbach coefficient alpha) were also deleted (Items
3, 10, 11, 12). The weightings of Items 14, 16, 19, 29, 35, 36, and 37 could not be classified
under any of the categories; thus, these items were omitted from the final scale. Items 5, 15,
24, 26, 33, and 38 were removed in order to resolve some of the multicollinearity between
factors and to improve alphas. Finally, one factor was judged problematic (Items 1, 2) and
thus was classified as non-interpretable because no single grouping of items representing the
intended factor emerged as the dominant source for the factor.
Thus, altogether, a total of 19 items were eliminated during this procedure. Deleted
items included: “The principal tends to react to anything that happens in the school, big or
small; The principal takes into account that action in one realm indirectly affects others;
When the principal tries to understand why a certain event occurred in school, he/she usually
come up with only one explanation for it.” This process resulted in a set of 19 items to
measure PST, entering Phase 2.

PRINCIPALS' SYSTEMS THINKING MEASURE 11
Phase 2: Exploratory Factor Analyses (N = 129), Confirmatory Factor Analyses and
Criterion Validity (N = 100)
Exploratory factor analysis. We conducted this analysis to explore the number of
factors that account for covariation between variables due to insufficient a priori evidence to
form a hypothesis about the number of factors underlying the data (Stevens, 1996). We
distributed the 19-item scale to a new sample of 129 mid-level leaders (response rate = 90%)
from 42 new randomly selected elementary schools. This sample was %63 female, with mean
age of 37.79 years (SD = 6.23) and mean job tenure in the profession of 11.33 years (SD =
7.03). As before, participation was voluntary, and we explained the study’s purpose,
guaranteed anonymity, and emphasized the importance of candid answers.
Exploratory factor analysis of the item matrix was performed to study which items
clustered together and which did not. For this purpose, a principal-axis factor analysis, rotated
using Kaiser's (1958) varimax criterion, was used to examine the 19-item measure and to
identify common factors with eigenvalues greater than 1. Items 8 and 17 were removed in
order to resolve some of the multicollinearity between factors and to improve alphas. This
analysis enabled us to discern a 4-factor structure among the remaining 17 items, which
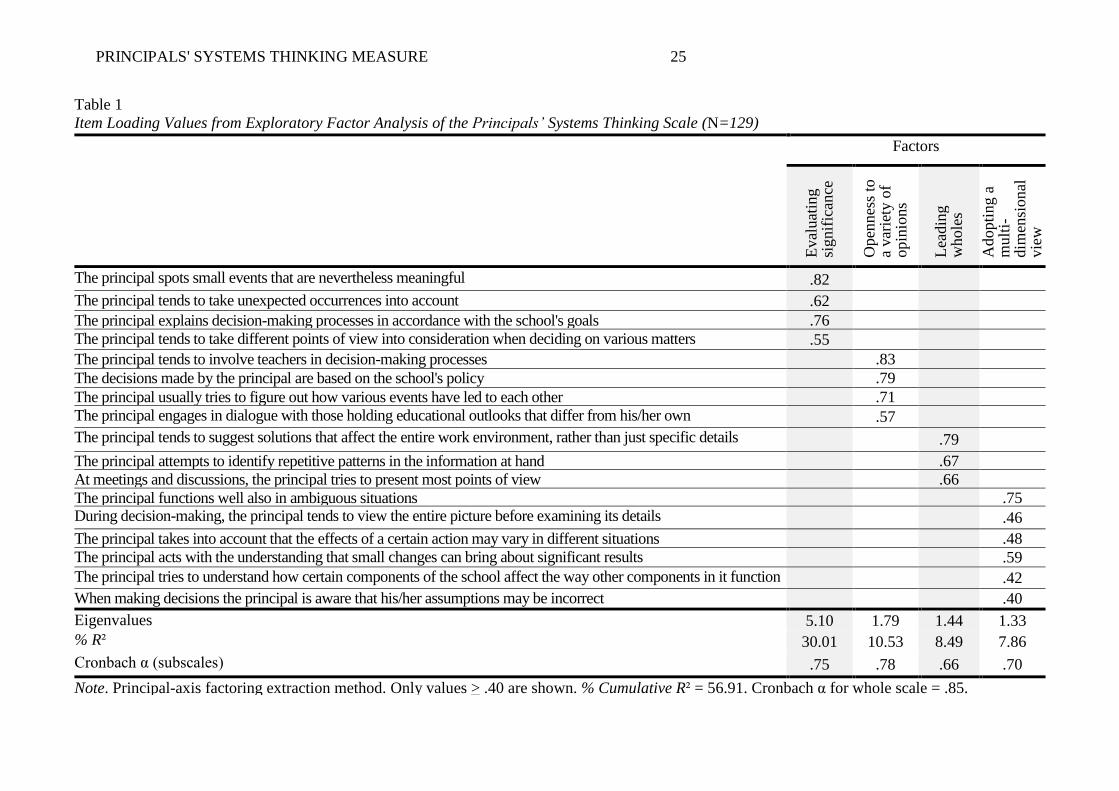
explained 56.91 percent of the variance. As seen in Table 1 (which presents rotated factor
loadings for each of the 17 items), all four factors had eigenvalues greater than 1 (ranging
from 5.10 to 1.33). After examining the items that loaded on each factor, the four
characteristics of PST were identified: Evaluating significance (4 items; α = .75(; Openness
to a variety of opinions (4 items; α = .78); Leading wholes (3 items; α = .66); and Adopting a
multidimensional view (6 items; α = .70). The PST Scale demonstrated a high level of
internal consistency (α = .85).
Confirmatory factor analysis. This procedure used AMOS 21.0 structural equation
modeling software to validate the 17-item PST Scale, as administered to a new independent
PRINCIPALS' SYSTEMS THINKING MEASURE 12
sample of 100 elementary school mid-level leaders. This sample size is considered
appropriate for confirmatory factor analysis model testing because the ratio of sample size to
items surpassed the minimum of 5:1 (Hair, Anderson, Tatham, & Black, 1998). This third
sample was 62% female, with mean age of 40.06 years (SD = 8.30) and mean job tenure in
the profession of 13.49 years (SD = 7.97). As before, participation was voluntary, and we
explained the study’s purpose, guaranteed anonymity, and emphasized the importance of
candid answers.
This analysis was based on the covariance matrix, and we used maximum likelihood
estimation, yielding the results shown on Table 2. Fit indices provide feedback about the
appropriateness of hypothesized research models based on the covariance structure of the
observed data. As recommended by researchers (Jöreskog & Sörbom, 1993; Kline, 1998), we
used several goodness-of-fit indices: the chi-square statistic divided by the degrees of
freedom ( 2/df) is recommended to be less than 3; the values of comparative fit index (CFI),
incremental fit index (IFI) and Tucker-Lewis index (TLI) are recommended to be greater than
.90; root mean square error of approximation (RMSEA) is recommended to be up to .05, and
acceptable up to .08 (Steiger, 2007).
We compared four models: the proposed second-order model (Model 1) and three
first-order models (Models 2 to 4). Model 1 denotes that the 17 observable items load on the
four first-order factors (Adopting a multidimensional view; Openness to a variety of
opinions; Leading wholes; and Evaluating significance), which in turn load on the second-
order factor (PST). The specific PST competencies were the indicators of one second-order
latent factors. Model 2 denotes that the 17 observable items load on the four first-order
factors (Adopting a multidimensional view; Openness to a variety of opinions; Leading
wholes; and Evaluating significance). Model 3 denotes that the 17 items are accounted for by
a single first-order factor, PST. Model 4 denotes that the 17 observable items are accounted

PRINCIPALS' SYSTEMS THINKING MEASURE 13
for by three first-order factors (Evaluating significance; Openness to a variety of opinions;
and two factors merged together as one – Leading wholes and Adopting a multidimensional
view).
Fit indices (Table 2) and the chi-squared differences revealed that the three alternative
models were significantly weaker than the second-order model ( 2 /df =1.272, CFI = .956,
TLI = .946, IFI = .958, RMSEA = .052). This confirmed that PST is a second-order structure
(Bollen, 1989). All items had significant loadings on the intended PST characteristics, and all
characteristics had significant loadings on the intended second-order latent factor. Figure 1
shows the factor loading values of all items in the confirmatory factor analysis, which ranged
from .38 to .93.
Together, the results of both the exploratory and confirmatory factor analysis support
a multidimensional conceptualization of the PST construct, identifying four characteristics.
Table 3 indicates the range of factor loadings, descriptive statistics, alpha coefficients, and
correlation analysis for PST. The results reveal several insights. Overall, in all subscales, the
means were close to 4 (“often shown”), indicating high means for all competencies. Second,
the results regarding the internal consistency coefficients for the latent factors indicated good
results (ranging from .73 to .83). The 17 items of the PST Scale demonstrated a reliability of
.90. Finally, the results of the intercorrelations for the PST subscales (see Variables 2-5 on
Table 4) indicated relatively moderate to high degrees of association between the latent
factors (r = .49-.63, p < .001). These values are appropriate for models that have proposed a
priori that the latent factors (characteristics) are interrelated (Brew, Beatty, & Watt, 2004).
Validation Variables. To test criterion-related validity, the PST Scale was examined
for its correlations with two other well-established constructs: IL and OC. Both the four-
factor model and the whole scale were examined for validity criteria. The 100 elementary
school mid-level leaders who provided the data for the confirmatory factor analysis

PRINCIPALS' SYSTEMS THINKING MEASURE 14
responded to both validity criteria surveys: IL and OC.
Instructional leadership survey. Validity for the PST Scale was measured using an IL
survey completed by the third sample of 100 mid-level leaders. We expected that perceptions
of principals’ higher ST levels would relate positively to principals’ higher IL. For this
purpose, we used an abbreviated version of the Principal Instructional Management Rating
Scale (PIMRS), originally developed by Hallinger and Murphy (1985) and adapted slightly to
accommodate the Israeli context and the elementary school level. The 31-item brief version
has shown adequate reliability and validity estimates (Schechter & Qadach, 2016). It
measures the following three IL subscales: (a) Defining the school's mission (12 items such as
“Defines the responsibilities of the team in achieving the school's educational goals”; α =
.83); (b) Managing the instructional program (10 items such as “Clarifies who is responsible
for coordinating the curricula”; α = .86); and (c) Promoting a positive school-learning
climate (9 items such as “Praises students for high achievements through reinforcements such
as prestigious roles or mentioning them in the school paper or site”; α =.81). Mid-level
leaders responded on a 5-point Likert scale, ranging from Never (1) to Always (5). The whole
scale’s internal reliability was .93.
Organizational commitment survey. Validity for the PST Scale was also measured
using a survey of the OC experienced by the third sample of 100 mid-level leaders. We
expected that principals’ higher ST levels would associate positively with their school mid-
level leaders' higher OC. For this purpose, we used Mowday et al.’s (1979) 15-item OC scale,
which taps the strength of respondents’ identification with and involvement in a particular
organization, adapted by Somech and Bogler (2002) to suit the current educational setting.
This measure includes three subscales: (a) a strong belief in and acceptance of the
organization's goals and values (4 items such as “I find that my values and school values are
very similar”; α = .61); (b) a willingness to exert considerable effort on behalf of the

PRINCIPALS' SYSTEMS THINKING MEASURE 15
organization (3 items such as “I'm willing to invest a lot of effort, even beyond expectations,
to help my school succeed”; α = .63); and (c) a strong desire to maintain membership in the
organization (8 items such as “I'm proud telling others that I work in my school"; α = .74).
Mid-level leaders responded on a 5-point Likert scale, ranging from Strongly disagree (1) to
Strongly agree (5). The whole scale’s internal reliability was α = .80.
Analysis of findings for the two validation constructs. Descriptive statistics and
intercorrelations of the PST and validity variables collected from this sample (N = 100) are
presented in Table 4. Findings indicated a positive relationship between overall PST and IL (r
= .63, p < .001). Also, significant positive correlations relatively moderate to high emerged
between IL and each of the four PST subscales: Evaluating significance (r = .52, p < .001),
Openness to a variety of opinions (r = .48, p < .001), Leading wholes (r = .47, p < .001), and
Adopting a multidimensional view (r = .58, p < .001). More specifically, as seen in Table 4,
each of the four PST subscales revealed significant positive correlations at the p < .001 level
with all three of the IL subscales – School mission, Instructional program, and Climate.
Furthermore, as predicted, the whole PST Scale was significantly and positively
related to the OC survey (r = .37, p < .001). Also, significant positive correlations emerged
between OC and each of the four PST subscales: Evaluating significance (r = .38, p < .001),
Openness to a variety of opinions (r = .28, p < .01), Leading wholes (r = .28, p < .01), and
Adopting a multidimensional view (r = .27, p < .01). More specifically, as seen in Table 4,
each of the four PST subscales revealed significant positive correlations with two out of the
three OC subscales, Accepting goals (at the p < .05 level) and Maintaining membership (at
the p < .01 or .001 level), although not with the third OC subscale of Willingness to exert
effort.
Discussion of the PST Scale and its Implications
Given that the literature has recommended ST’s utilization as an effective approach

PRINCIPALS' SYSTEMS THINKING MEASURE 16
for managers in general (Brown, 2012; Jolly, 2015; Wilson & Van Haperen, 2015), and for
school principals in particular (e.g., Fullan, 2005; Senge et al., 2012), and in light of the lack
of available instruments to measure PST, we undertook the development and testing of the
multidimensional PST Scale. As seen in this chapter, our exploratory and confirmatory factor
analyses provided support for 17 items comprising four PST characteristics, thus providing
evidence of construct validity for these characteristics of ST as manifested in elementary
school principals: Adopting a multidimensional view, Openness to a variety of opinions,
Leading wholes, and Evaluating significance.
The four characteristics emerging from the current factor analyses of this quantitative
scale differ somewhat from the four characteristics that we found in our previous qualitative
research (Shaked & Schechter, 2014, 2017), where we conducted content analysis of
interview and focus-group data that elicited school principals' articulations about PST. First,
openness to a variety of opinions was found to be a characteristic rather than a sub-
characteristic of PST, as originally proposed in the qualitative studies. A principal who
understands that each situation has several aspects and several possible implications seeks to
understand the full picture by listening to other points of view. In order to see the whole
beyond the parts and to see the parts in the context of the whole, principals must be willing to
listen to others and learn from others. Through such openness, principals involve teachers in
decision-making and engage in dialogue with those holding educational perceptions that
differ from their own. Second, influencing indirectly, which did not emerge here as a
distinguishable characteristic of PST but rather was found to be a sub-characteristic
branching out from adopting a multidimensional view. Apparently, the use of an indirect
approach when dealing with tasks and challenges is not considered a central principal
characteristic in the eyes of those mid-level leaders who experience PST in elementary
schools. The differences between the findings of this study and the findings of the previous

PRINCIPALS' SYSTEMS THINKING MEASURE 17
study may be a result of differences in the research method (qualitative vs. quantitative) or in
study participants and data collection (self-report by school principals vs. reports of mid-level
school leaders on their principals). These differences also may stem from the fact that the
present study focused only on primary schools, while participants of the previous study were
principals of primary schools, middle schools, and high schools.
Finally, the relationships that we found for PST with principals' IL and with mid-level
leaders' OC not only provided further support for the PST Scale’s validity but also have
important implications. Links between principals' IL and students' achievements have been
clearly established through research (Glickman et al., 2014; Robinson, Lloyd, & Rowe,
2008). In addition, teachers' OC was found to be a key component of school success, which
positively affects teacher performance and student outcomes (Dee et al., 2006; Park, 2005;
Sammons et al., 2007).
Although these findings are encouraging for the school leadership literature, this
study’s design and context imply some limitations requiring further inquiry before
generalizing our outcomes. First, due to our study’s cross-sectional design, the data cannot
provide direct evidence of causal links between PST and other outcomes like principals’
instructional leadership behaviors or mid-level leaders’ commitment to their schools.
Conceivably, the causal order could be reversed, or causality could be reciprocal.
Furthermore, this scale measures principals’ behavior that reveals a ST approach to school
leadership, but only future research will confirm if such PST tendencies contribute
significantly to student achievements or other desired school outcomes. Second, the research
was conducted in a specific educational context – elementary schools in Israel – limiting
generalizability to other educational and sociocultural contexts and calling for replication in
other populations and settings, to possibly substantiate the scale’s international validity.
Research is already underway to validate this scale for secondary school principals and to

PRINCIPALS' SYSTEMS THINKING MEASURE 18
examine cross-validation by comparing principals’ self-reports with mid-level leaders’ ratings
in the same schools.
Overall, an instrument measuring PST also holds practical implications, opening up
new avenues for research, principal candidate screening, and professional training. The PST
Scale can allow for comparisons of possible ST patterns exhibited by principals who differ in
experience, gender, education, or type of school (e.g., primary vs. secondary, regular vs.
special education). It permits researchers to examine PST’s potentially important relations
with other variables related to the principal (e.g., distributed leadership, transformational
leadership, cognitive complexity), with the school as an organization (e.g., organizational
learning, organizational resilience), with the teaching staff (e.g., motivation, self-efficacy),
and of course with student outcomes.
Measuring PST may be valuable at various stages throughout principals’ career. The
selection process for new principals may be optimized if candidates' capacity for ST is taken
into account. In addition to screening prospective principal candidates for their ST skills
before appointment, new principals' ST capabilities may be reevaluated after several years on
the job. This later reevaluation is required because the development of ST takes time (Shaked
& Schechter, 2017), and it unfolds gradually as an outcome of manifold long-term
experiences. The reevaluation, accompanied by detailed feedback, may help the growing
principal to pinpoint which areas are well-developed and which need further improvement.
Moreover, this screening tool may also help superintendents determine which principals have
not adequately acquired ST capacities and can even suggest which necessary professional
development processes should be tailored to the specific principal to narrow the existing gaps
in his or her holistic leadership development. Measuring PST capacities may be timely even
after the first few years on the job, because principals need to continuously enhance their
skills and consolidate their leadership knowledge. This new scale may thus facilitate the

PRINCIPALS' SYSTEMS THINKING MEASURE 19
exploration and evaluation of professional training processes aimed at developing PST, from
early preservice stages to the mentoring of veteran or experienced principals.
References
Armstrong, T. (2007). The curriculum superhighway. Educational Leadership, 64(8), 16–20.
Arnold, R. D., & Wade, J. P. (2015). A definition of systems thinking: A systems approach.
Procedia Computer Science, 44, 669–678.
Bogler, R., & Somech, A. (2004). Influence of teacher empowerment on teachers'
organizational commitment, professional commitment and organizational citizenship
behavior in schools. Teaching & Teacher Education, 20(3), 277–289.
Bollen, K. A. (1989). Structural equations with latent variables. New York, NY: Wiley.
Brew, C., Beatty, B., & Watt, A. (2004, December). Measuring students' sense of
connectedness with school. Paper presented at the Australian Association for Research
in Education Annual Conference, Melbourne, Australia.
Brown, J. (2012). Systems thinking strategy: The new way to understand your business and
drive performance. Bloomington, IN: iUniverse.
Cabrera, D., & Cabrera, L. (2015). Systems thinking made simple: New hope for solving
wicked problems. Ithaca, NY: Odyssean.
Crane, A. (2014). Year coordinators as middle leaders in independent girls' schools: Their
role and accountability. Leading & Managing, 20(1), 80–92.
Crick, R. D., Barr, S., Green, H., & Pedder, D. (2017). Evaluating the wider outcomes of
schools: Complex systems modelling for leadership decisioning. Educational
Management Administration & Leadership, 45(4), 719–743.
Dee, J. R., Henkin, A. B., & Singleton, C. A. (2006). Organizational commitment of teachers
in urban schools: Examining the effects of team structures. Urban Education, 41(6),

PRINCIPALS' SYSTEMS THINKING MEASURE 20
603–627.
Elm, J, P., & Goldenson, D. R. (2012). The business case for systems engineering study:
Results of the systems engineering effectiveness survey. Pittsburgh, PA: Carnegie
Mellon University.
Fleming, P., & Amesbury, M. (2012). The art of middle management: A guide to effective
subject, year and team leadership. New York, NY: Routledge.
Frank, M. (2012). Engineering systems thinking: Cognitive competencies of successful
systems engineers. Procedia Computer Science, 8, 273–278.
Fullan, M. (2005). Leadership and sustainability: System thinkers in action. Thousand Oaks,
CA: Corwin.
Fullan, M. (2014). The principal: Three keys to maximizing impact. San Francisco, CA:
Jossey-Bass.
Gharajedaghi, J. (2011). Systems thinking, managing chaos and complexity: A platform for
designing business architecture (3rd ed.). Burlington, MA: Morgan Kaufmann.
Glickman, C. D., Gordon, S. P., & Ross-Gordon, J. M. (2014). Supervision and instructional
leadership: A developmental approach (9th ed.). London, UK: Pearson.
Gurr, D., & Drysdale, L. (2013). Middle-level secondary school leaders: Potential, constraints
and implications for leadership preparation and development. Journal of Educational
Administration, 51(1), 55–71.
Hair, J. F., Anderson, R. E., Tatham, R. L., & Black, W. C. (1998). Multivariate data
analysis (5th ed.). Upper Saddle River, NJ: Prentice Hall.
Hallinger, P. (2011). A review of three decades of doctoral studies using the Principal
Instructional Management Rating Scale: A lens on methodological progress in
educational leadership. Educational Administration Quarterly, 47(2), 271–306.
Hallinger, P. & Murphy, P. (1985). Assessing the instructional management behavior
PRINCIPALS' SYSTEMS THINKING MEASURE 21
principals. Elementary School Journal, 86(2), 217–247.
Hargreaves, A., & Braun, H. (2013). Data-driven improvement and accountability. Boulder,
CO: National Education Policy Center.
Hieronymi, A. (2013). Understanding systems science: A visual and integrative approach.
Systems Research and Behavioral Science, 30(5), 580–595.
Hitchins, D. K. (2007). Systems engineering: A 21st century systems methodology.
Chichester, UK: John Wiley.
Holmes, B. J., Finegood, D. T., Riley, B. L., & Best, A. (2012). Systems thinking in
dissemination and implementation research. In R. C. Brownson, G. A. Colditz, & E. K.
Proctor (Eds.), Dissemination and implementation research in health: Translating
science to practice (pp. 175–191). New York, NY: Oxford.
Jackson, M. C. (2010). Reflections on the development and contribution of critical systems
thinking and practice. Systems Research and Behavioral Science, 27(2), 133–139.
Jolly, R. (2015). Systems thinking for business: Capitalize on structures hidden in plain sight.
Portland, OR: Systems Solutions.
Jöreskog, K., & Sörbom, D. (1993). LISREL 8: Structural equation modeling with the
SIMPLIS command language. Chicago, IL: Scientific Software International.
Kaiser, H. F. (1958). The varimax criterion for analytic rotation in factor analysis.
Psychometrics, 23, 187-201.
Kline, P. (1998). The new psychometrics: Science, psychology and measurement. Florence,
KY: Taylor and Francis/Routledge.
Leischow, S. J., Best, A., Trochim, W. M., Clark, P. I., Gallagher, R. S., Marcus, S. E., &
Matthews, E. (2008). Systems thinking to improve the public's health. American
Journal of Preventive Medicine, 35(2S), S196–S203.
Louis, K. S., Leithwood, K., Wahlstrom, K. L., & Anderson, S. E. (2010). Learning from

PRINCIPALS' SYSTEMS THINKING MEASURE 22
leadership: Investigating the links to improved student learning. New York, NY:
Wallace Foundation.
May, H., & Supovitz, J. A. (2011). The scope of principal efforts to improve instruction.
Educational Administration Quarterly, 47(2), 332–352.
Mowday, R. R., Steers, R. M., & Porter, L. W. (1979). The measurement of organizational
commitment. Journal of Vocational Behavior, 14, 224–247.
Murphy, J., Neumerski, C. M., Goldring, E., Grissom, J., & Porter, A. (2016). Bottling fog?
The quest for instructional management. Cambridge Journal of Education, 46(4), 455–
471.
Neumerski, C. M. (2012). Rethinking instructional leadership, a review: What do we know
about principal, teacher, and coach instructional leadership, and where should we go
from here? Educational Administration Quarterly, 49(2), 310–347.
Ng, F. S. D. (2015). Leadership learning for complex organizations. Cogent Education, 2(1),
Article 1017312.
Park, I. (2005). Teacher commitment and its effects on student achievement in American high
schools. Educational Research and Evaluation, 11(5), 461–485.
Richmond, B. (1994). System dynamics/systems thinking: Let's just get on with it. System
Dynamics Review, 10(2-3), 135–157.
Richmond, B. (2000). The "thinking" in systems thinking: Seven essential skills. Waltham,
MA: Pegasus.
Rigby, J. G. (2014). Three logics of instructional leadership. Educational Administration
Quarterly, 50(4), 610–644.
Robinson, V. M. J., Lloyd, C., & Rowe, K. (2008). The impact of leadership on student
outcomes: An analysis of the differential effects of leadership types. Educational
Administration Quarterly, 44(5), 564–588.

PRINCIPALS' SYSTEMS THINKING MEASURE 23
Saiti, A. (2015). Conflicts in schools, conflict management styles and the role of the school
leader: A study of Greek primary school educators. Educational Management
Administration & Leadership, 43(4), 582–609.
Sammons, P., Day, C., Kington, A., Gu, Q., Stobart, G., & Smees, R. (2007). Exploring
variations in teachers' work, lives and their effects on pupils: Key findings and
implications from a longitudinal mixed-method study. British Educational Research
Journal, 33(5), 681–701.
Schechter, C., & Qadach, M. (2016). Principals' learning mechanisms: Exploring an
emerging construct. Leadership and Policy in School, 15(2), 141-167.
Senge, P. (1990). The fifth discipline: The art and practice of the learning organization. New
York, NY: Currency, Doubleday.
Senge, P. (2006). The fifth discipline: The art and practice of the learning organization (2nd
ed.). New York, NY: Currency, Doubleday.
Senge, P. M., Cambron-McCabe, N., Lucas, T., Smith, B., Dutton, J., & Kleiner, A. (2012).
Schools that learn: A fifth discipline fieldbook for educators, parents and everyone who
cares about education. New York, NY: Crown.
Shaked, H., & Schechter, C. (2014). Systems school leadership: Exploring an emerging
construct. Journal of Educational Administration, 52(6), 792–811.
Shaked, H., & Schechter, C. (2017). Systems thinking for school leaders: Holistic leadership
for excellence in education. Cham, Switzerland: Springer.
Somech, A., & Bogler, R. (2002). Antecedents and consequences of teacher organizational
and professional commitment. Educational Administration Quarterly, 38(4), 555–577.
Sterman, J. D. (2000). Business dynamics: Systems thinking and modeling for a complex
world. Boston, MA: McGraw-Hill.

PRINCIPALS' SYSTEMS THINKING MEASURE 24
Steiger, J. H. (1990). Structural model evaluation and modification: An interval estimation
approach. Multivariate Behavioral Research, 25, 173-180.
Stevens, J. (1996). Applied multivariate statistics for the social sciences (3rd ed.). Mahwah,
NJ: Lawrence Erlbaum.
Stronge, J. H., Richard, H. B., & Catano, N. (2008). Qualities of effective principals.
Alexandria, VA: Association for Supervision and Curriculum Development.
Supovitz, J., Sirinides, P., & May, H. (2010). How principals and peers influence teaching
and learning. Educational Administration Quarterly, 46(1), 31–56.
Tejeda, J., & Ferreira, S. (2014). Applying systems thinking to analyze wind energy
sustainability. Procedia Computer Science, 28, 213–220.
Thorpe, A., & Bennett-Powell, G. (2014). The perceptions of secondary school middle
leaders regarding their needs following a middle leadership development programme.
Management in Education, 28(2), 52–57.
Walker, J., & Slear, S. (2011). The impact of principal leadership behaviors on the efficacy of
new and experienced middle school teachers. National Association of Secondary School
Principals Bulletin, 95(1), 46–64.
Wilson, B., & Van Haperen, K. (2015). Soft systems thinking, methodology and the
management of change. London: Palgrave.
PRINCIPALS' SYSTEMS THINKING MEASURE 25
Table 1
Item Loading Values from Exploratory Factor Analysis of the Principals’ Systems Thinking Scale (N=129)
Factors
Eval
uat
ing
signif
ican
ce
Open
nes
s to
a
var
iety
of
opin
ions
Lea
din
g
whole
s
Adop
ting a
m
ult
i-dim
ensi
on
al
vie
w
The principal spots small events that are nevertheless meaningful .82
The principal tends to take unexpected occurrences into account
.62
The principal explains decision-making processes in accordance with the school's goals
.76
The principal tends to take different points of view into consideration when deciding on various matters .55
The principal tends to involve teachers in decision-making processes .83
The decisions made by the principal are based on the school's policy .79
The principal usually tries to figure out how various events have led to each other .71
The principal engages in dialogue with those holding educational outlooks that differ from his/her own
.57
The principal tends to suggest solutions that affect the entire work environment, rather than just specific details
.79
The principal attempts to identify repetitive patterns in the information at hand .67
At meetings and discussions, the principal tries to present most points of view
.66
The principal functions well also in ambiguous situations .75 During decision-making, the principal tends to view the entire picture before examining its details .46
The principal takes into account that the effects of a certain action may vary in different situations .48
The principal acts with the understanding that small changes can bring about significant results .59
The principal tries to understand how certain components of the school affect the way other components in it function .42
When making decisions the principal is aware that his/her assumptions may be incorrect
.40
Eigenvalues 5.10 1.79 1.44 1.33
% R² 30.01 10.53 8.49 7.86
Cronbach α (subscales) .75 .78 .66 .70
Note. Principal-axis factoring extraction method. Only values > .40 are shown. % Cumulative R² = 56.91. Cronbach α for whole scale = .85.

PRINCIPALS' SYSTEMS THINKING MEASURE 26
Table 2
Comparison of Competing Models’ Fit Indices for Principals’ Systems Thinking Scale
(N=100)
Model
description χ2 df
Compared
with Model 1
∆ χ2
χ2/df CFI IFI TLI RMSEA
Model 1:
Second-order 139.921 110 1.272 .956 .958 .946 .052
Model 2:
Four-factor
model
139.141 108 .78 1.288 .954 .956 .943 .054
Model 3:
Three-factor
model
186.145 111 46.22** 1.677 .890 .894 .865 .083
Model 4:
One-factor
model
248.175 117 **108.25 2.121 .808 .813 .777 .106
Note. χ2 improvement is reflected by a lower value. CFI = comparative fit index; IFI =
incremental fit index; TLI = Tucker–Lewis index; RMSEA = root mean square error of
approximation.
** p < .01.

PRINCIPALS' SYSTEMS THINKING MEASURE 27
Table 3
Range of Factor Loadings, Descriptive Statistics, Alpha Coefficients, and Correlation Analysis for the Principals’ Systems Thinking Scale
(N=100)
Composite factors No. of
items
Range of
factor loadings
M SD Cronbach
alpha
Correlations
2 3 4
1 Evaluating significance 4 .45 to .71 3.42 .72 .73 .53*** .53*** .56***
2 Openness to a variety of opinions 4 .42 to .93 3.51 .71 .83 1 .63*** .56***
3 Leading wholes 3 .62 to .81 3.48 .80 .79 1 .49***
4 Adopting a multidimensional view 6 .38 to .70 3.58 .62 .78 1
Note. Response scale from Never (1) to Always (5).
*** p < .001.

PRINCIPALS' SYSTEMS THINKING MEASURE 28
Table 4
Descriptive Statistics and Correlations Among the Principals’ Systems Thinking (PST) Scale and Validity Variables (N=100)
Variables M SD (1) (2) (3) (4) (5) (6) (7) (8) (9) (10) (11) (12) (13)
(1) PST: Total 3.51 .57 1 .80*** .82*** .78*** .84*** .64*** .49*** .66*** .57*** .37*** .28** .01 .39***
(2) PST: Evaluating significance 3.42 .71 1 .53*** .53*** .56*** .52*** .37*** .58*** .47*** .38*** .24* .08 .43***
(3) PST: Openness to variety of opinions 3.51 .71 1 .63** .56*** .48*** .37*** .49*** .45*** .28** .23* -.02 .28**
(4) PST: Leading wholes 3.48 .80 1 .49*** .47*** .37*** .51*** .40*** .28** .22* -.02 .32**
(5) PST: Adopting multidimensional view 3.58 .62 1 .58*** .48*** .57*** .51*** .27** .22* .01 .26**
(6) IL: Total 3.76 .62 1 .91*** .87*** .91*** .40*** .30*** -.11 .45***
(7) IL: School mission 3.64 .66 1 .65*** .78*** .36*** .30** -.09 .39***
(8) IL: Instructional program 3.94 .73 1 .70*** .42*** .35*** .01 .45***
(9) IL : Climate 3.73 .70 1 .27** .14 -.23* .38***
(10) OC: Total 3.54 .49 1 .86*** .59*** .91***
(11) OC: Accepts school goals, values 3.30 .52 1 .55*** .63***
(12) OC: Willing to exert effort 3.21 .66 1 .34***
(13) OC: Maintains membership 3.75 .52 1
Note. IL = principals’ instructional leadership. OC = mid-level leaders’ organizational commitment.
*p < .05; **p < .01; ***p < .001.

PRINCIPALS' SYSTEMS THINKING MEASURE 29
Figure 1. Results of the confirmatory factor analysis for 17 principals' systems thinking (PST) items.
χ2 = 139.912; df = 110; CFI = .956; IFI = .958; TLI = .946; RMSEA = .052.
Evaluating
significance
Openness to a
variety of
opinions
Leading
wholes
Adopting a
multidimensional view
ST 2
ST 5
ST 6
ST 4
ST 1
ST 3
.70
.67 .65
.81 .62
.42
.93
.73
.45
.71
.70
.55
.68
.38
.80
.82
.86
.78
Principals’
systems
thinking
.64
.63
.81
ST 7
ST 9
ST 10
ST 11
ST 12
ST 19
ST 18
ST 16
ST 15
ST 14
ST 13