principles of macroeconomics: econ101. recurrent swings (up and down) in real gdp; alternating...
TRANSCRIPT
Principles of MacroEconomics: Econ101
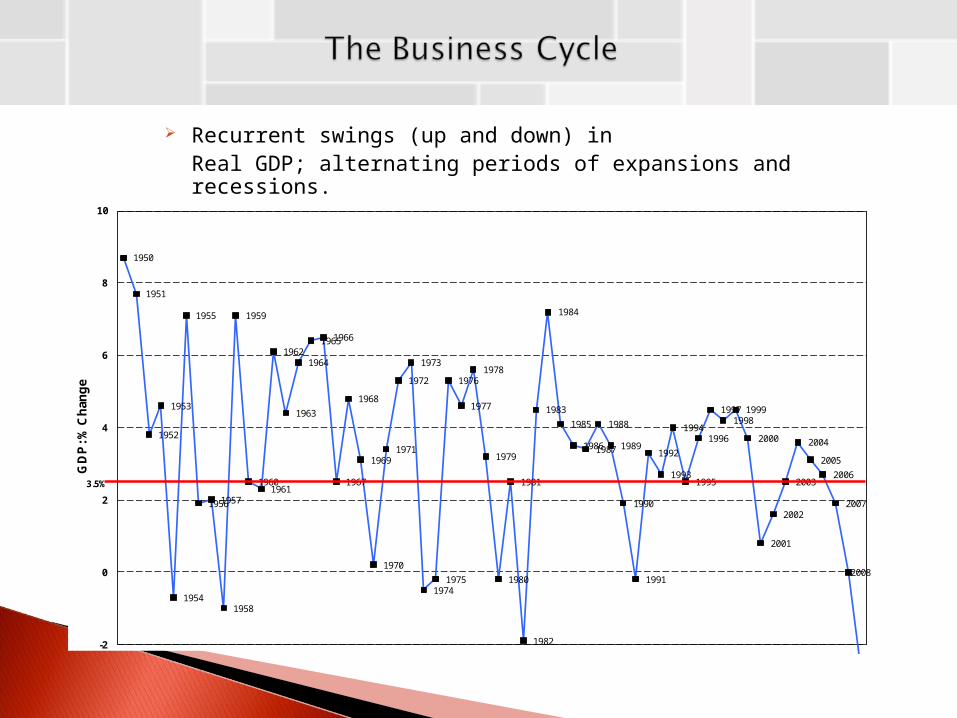
Recurrent swings (up and down) inReal GDP; alternating periods of expansions and recessions.
1950
1951
1952
1953
1954
1955
19561957
1958
1959
19601961
1962
1963
1964
19651966
1967
1968
1969
1970
1971
1972
1973
19741975
1976
1977
1978
1979
1980
1981
1982
1983
1984
1985
19861987
1988
1989
1990
1991
1992
1993
1994
1995
1996
19971998
1999
2000
2001
2002
2003
2004
2005
2006
2007
2008
-2
0
2
4
6
8
10
GD
P: %
Ch
ang
e
3.5%
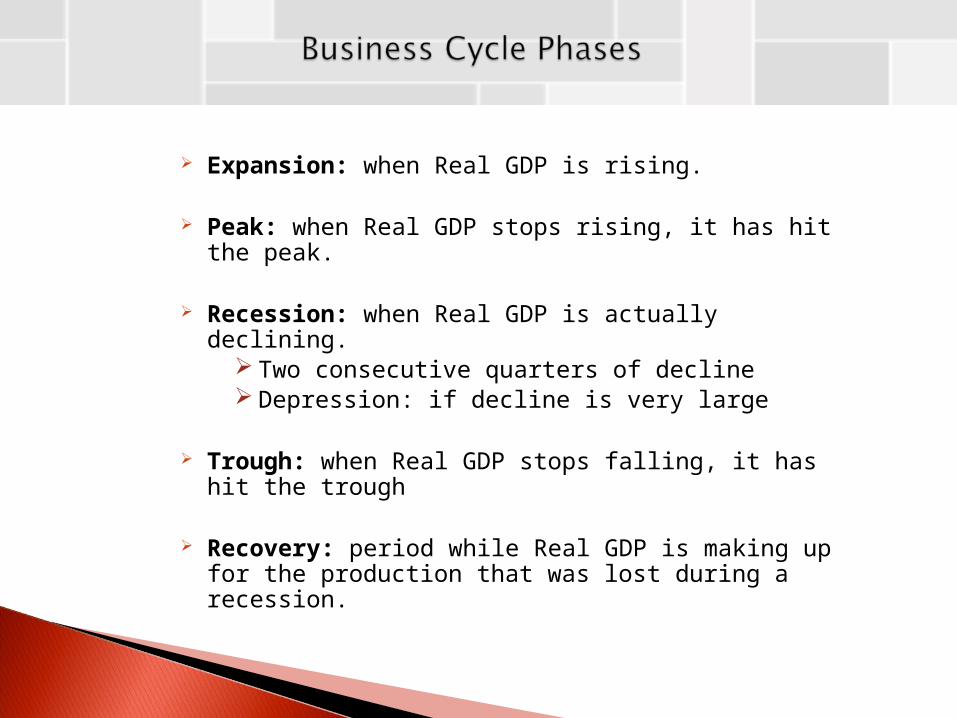
Expansion: when Real GDP is rising.
Peak: when Real GDP stops rising, it has hit the peak.
Recession: when Real GDP is actually declining. Two consecutive quarters of decline Depression: if decline is very large
Trough: when Real GDP stops falling, it has hit the trough
Recovery: period while Real GDP is making up for the production that was lost during a recession.
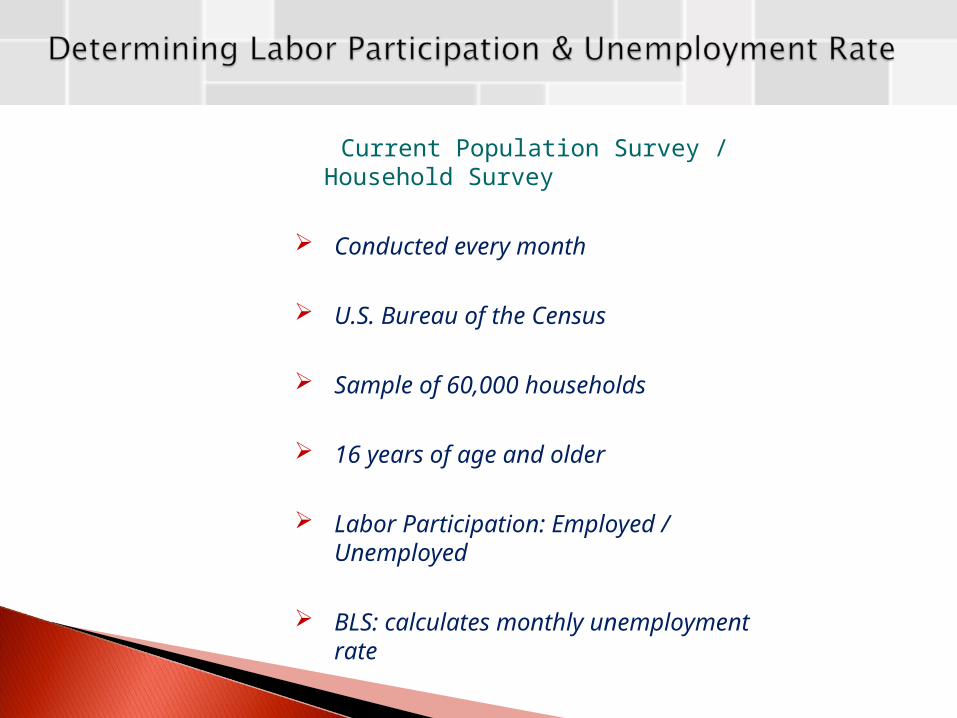
Current Population Survey / Household Survey
Conducted every month
U.S. Bureau of the Census
Sample of 60,000 households
16 years of age and older
Labor Participation: Employed / Unemployed
BLS: calculates monthly unemployment rate
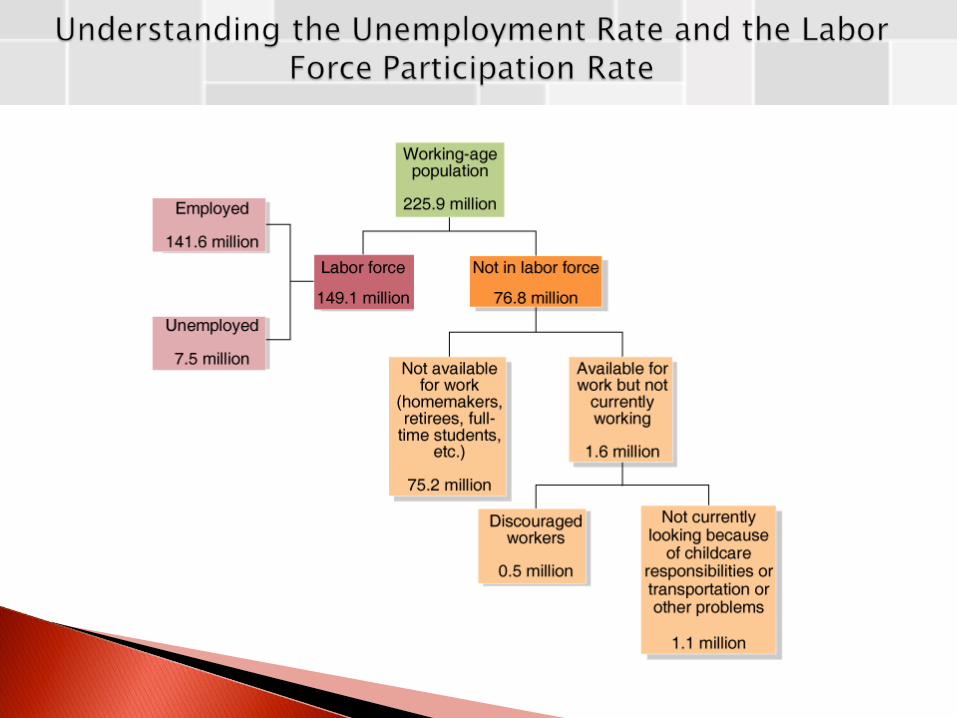
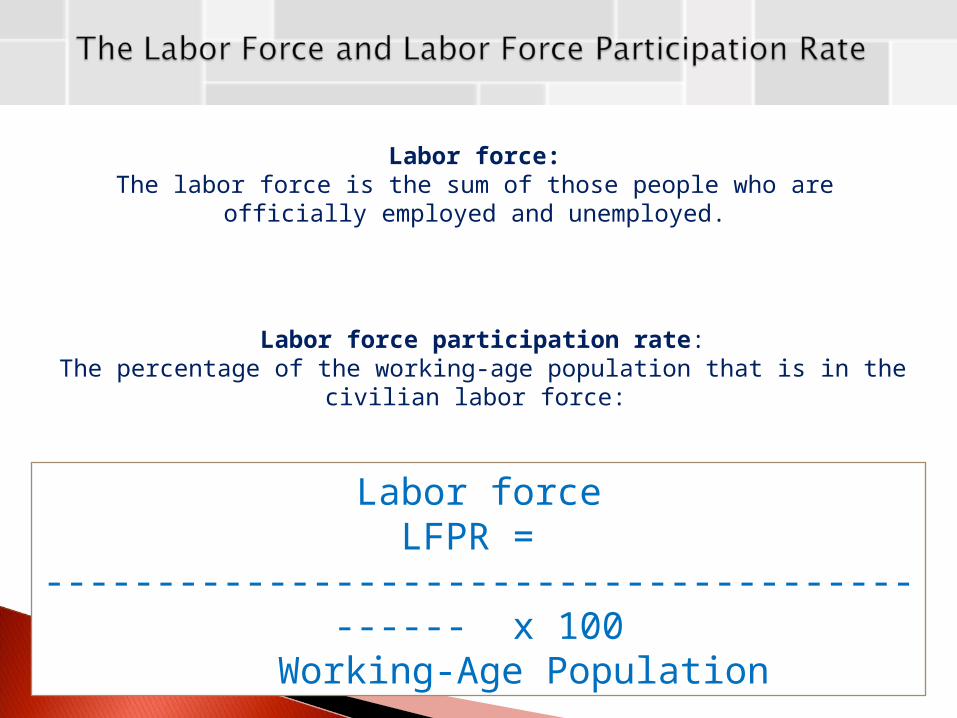
Labor force participation rate:The percentage of the working-age population that is in the civilian labor force:
Labor forceLFPR = --------------------------------------------- x 100
Working-Age Population
Labor force:The labor force is the sum of those people who are officially employed and
unemployed.
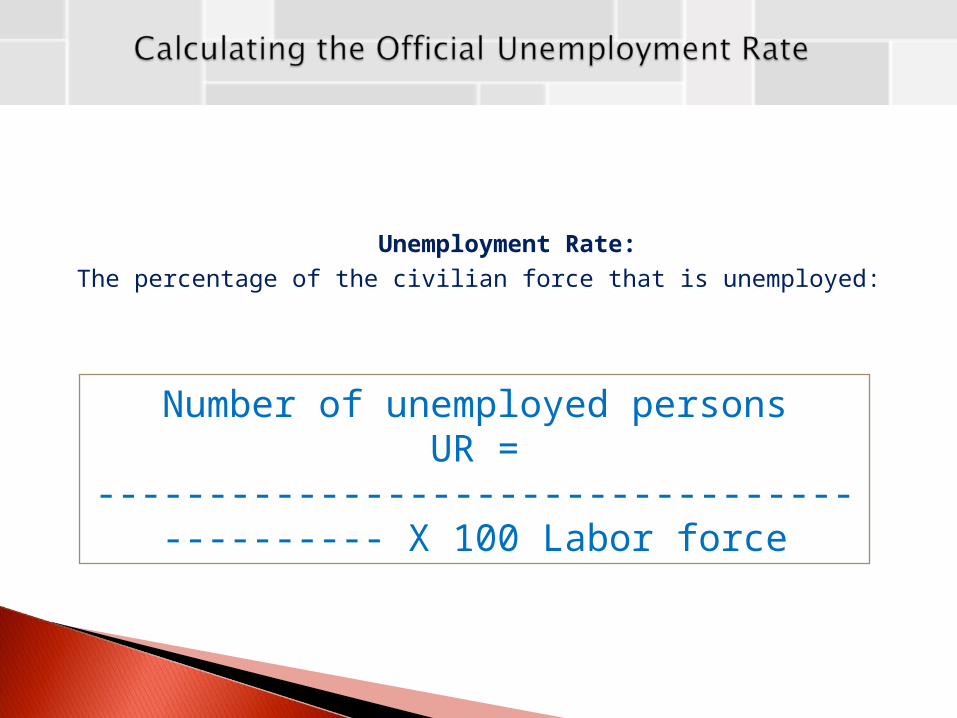
Unemployment Rate:
The percentage of the civilian force that is unemployed:
Number of unemployed personsUR = -------------------------------------------- X 100
Labor force
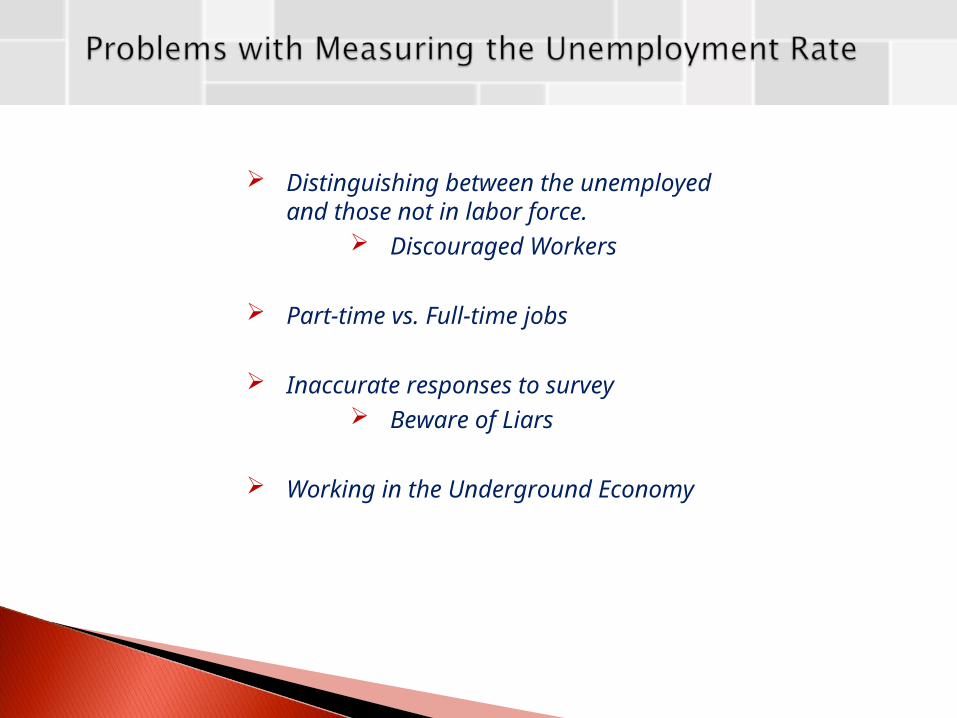
Distinguishing between the unemployed and those not in labor force.
Discouraged Workers
Part-time vs. Full-time jobs
Inaccurate responses to survey Beware of Liars
Working in the Underground Economy
Frictional unemployment:
Short-term unemployment arising from the process of matching workers with jobs.
Structural unemployment:
Unemployment arising from a persistent mismatch between the skills and characteristics of workers and the requirements of jobs.
Cyclical unemployment:
Unemployment caused by a business cycle recession.
Natural rate of unemployment:
The normal rate of unemployment, consisting of structural unemployment plus frictional unemployment.
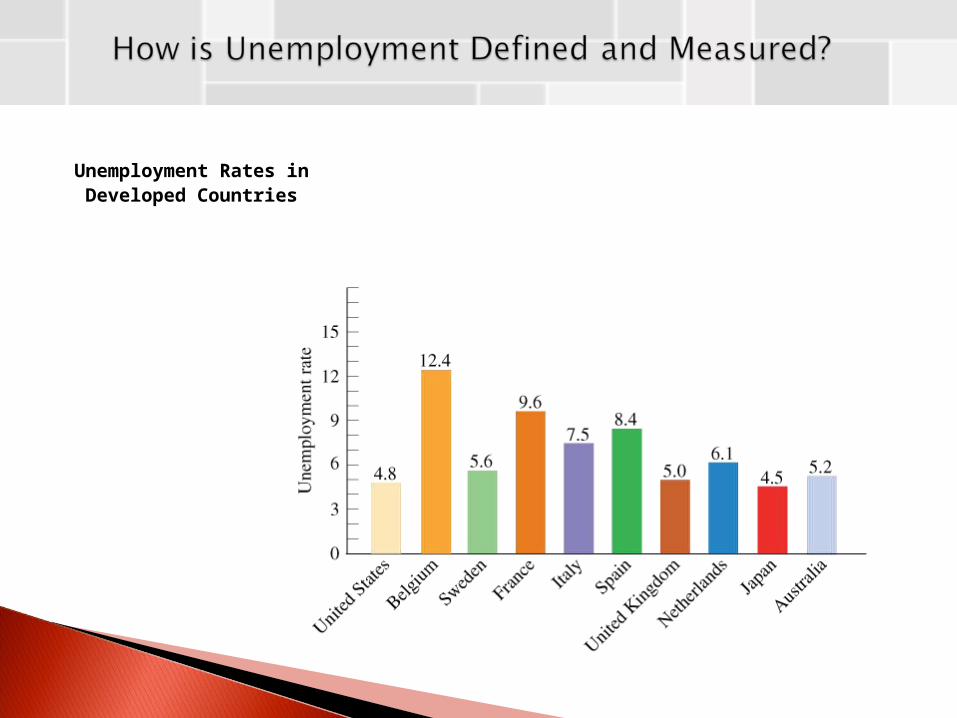
Unemployment Rates in Developed Countries
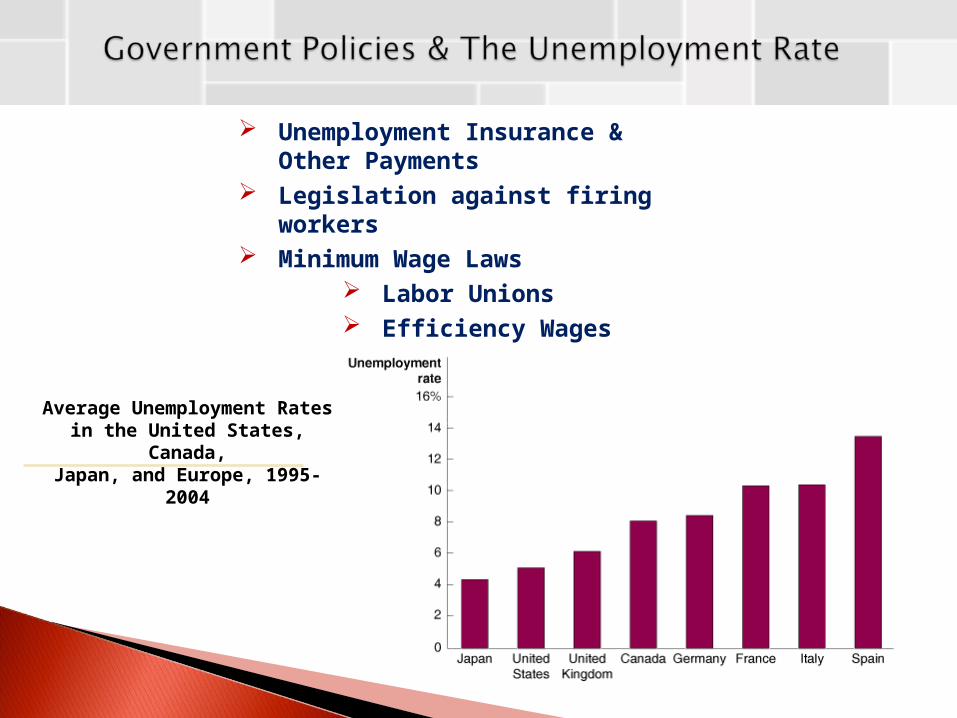
Unemployment Insurance & Other Payments
Legislation against firing workers Minimum Wage Laws
Labor Unions Efficiency Wages
Average Unemployment Ratesin the United States, Canada,Japan, and Europe, 1995-2004
Potential Real GDP:The amount of production we need to have in order to have full employment. Potential GDP is a goal – the amount an economy would like to produce in order to have full employment.
Real GDP: Remember………..Real GDP is the amount we actually produce
GDP Gap: The difference between the actual Real GDP and the Potential Real GDP
Recessionary Gap:Occurs when Real GDP falls below Potential Real GDP. Therefore, in this case, the unemployment rate is above the natural rate of unemployment. That is, the economy is not exhibiting full employment.
Inflationary Gap:Occurs when Real GDP falls above Potential Real GDP. Therefore, in this case, the unemployment rate is below the natural rate of unemployment. That is, the economy can provide jobs to whomever wants one and inflation is on the rise.

1. What is the major difference between a person who is frictionally unemployed and one who is structurally unemployed?
The frictionally unemployed person has readily transferable skills, and the structurally unemployed person does not.
2. If the cyclical unemployment rate is positive, what does this imply?
It implies that the (actual, measured) unemployment rate in the economy is greater than the natural unemployment rate. For example, if the unemployment rate is 8 percent and the natural unemployment rate is 6 percent, the cyclical unemployment rate is 2 percent.
Defining Price Level and Inflation Calculating the Consumer Price Index (CPI) COLA Calculating Percentage Changes in the CPI Overstating the CPI GDP Deflator Nominal Interest Rate vs. Real Interest Rate The Effects of Inflation
Price Level:
A weighted average of the prices of all good and services.
Inflation:
An increase in the price level
Deflation:
A decrease of the price level
Price Index:
A measure of the price level
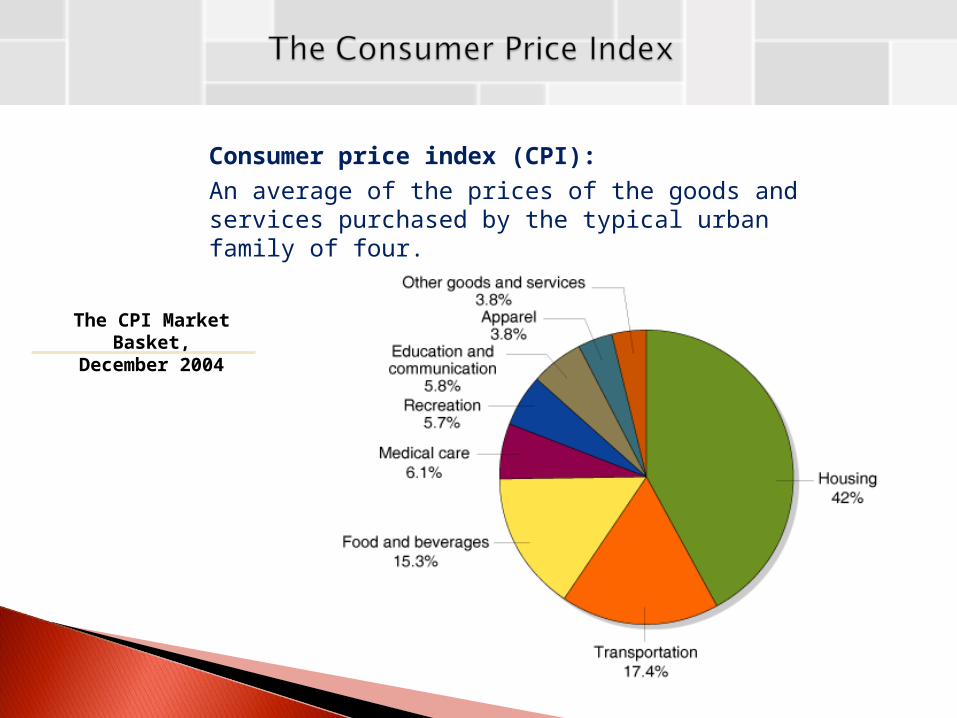
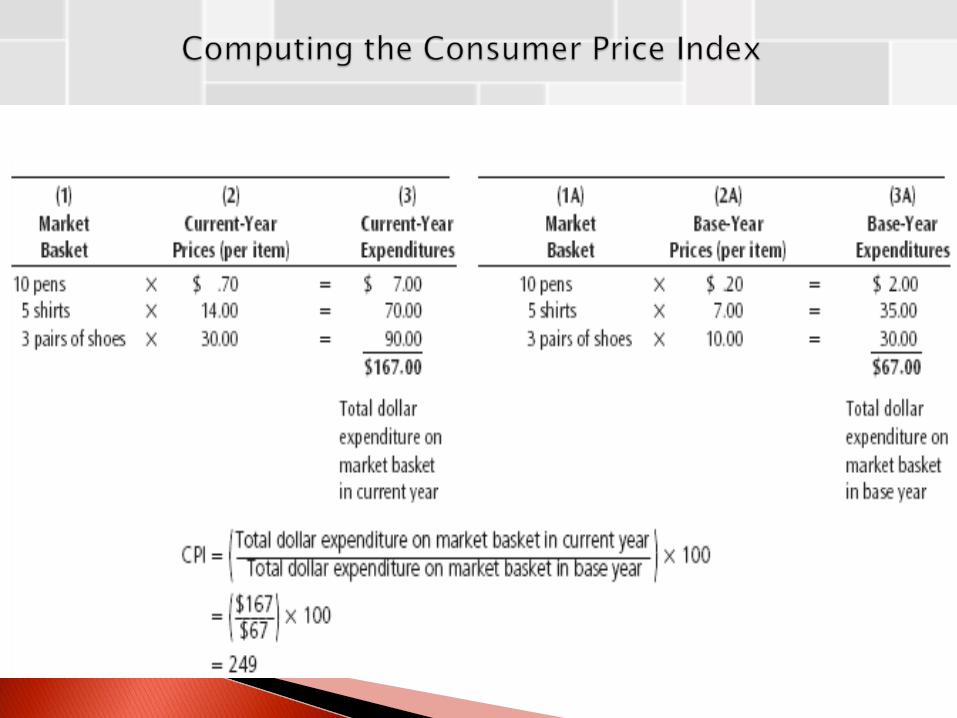
Consumer price index (CPI):
An average of the prices of the goods and services purchased by the typical urban family of four.
The CPI Market Basket,December 2004
Base Year:
The year chosen as a point of reference or basis of comparison for prices in other years; a benchmark year.
COLA:
Cost of living adjustment…….income is adjusted automatically to reflect the increases in prices, as measured by the increase in the CPI.
Substitution Bias
Outlet Bias
Increase in Quality Bias
Overstated by 1%?
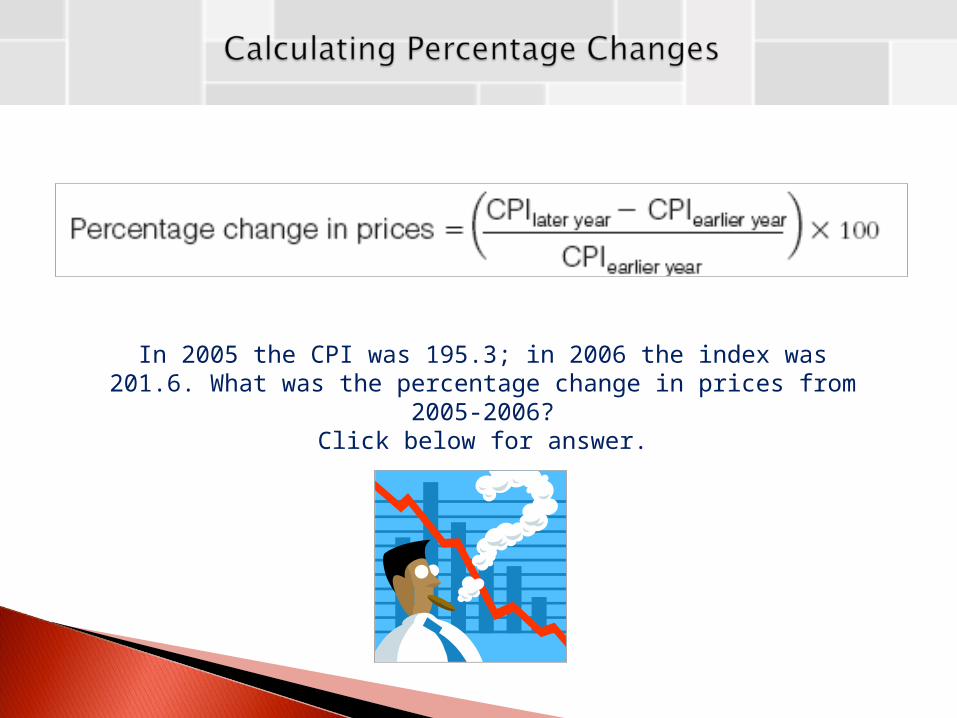
In 2005 the CPI was 195.3; in 2006 the index was 201.6. What was the percentage change in prices from 2005-2006?
Click below for answer.
3.23 %
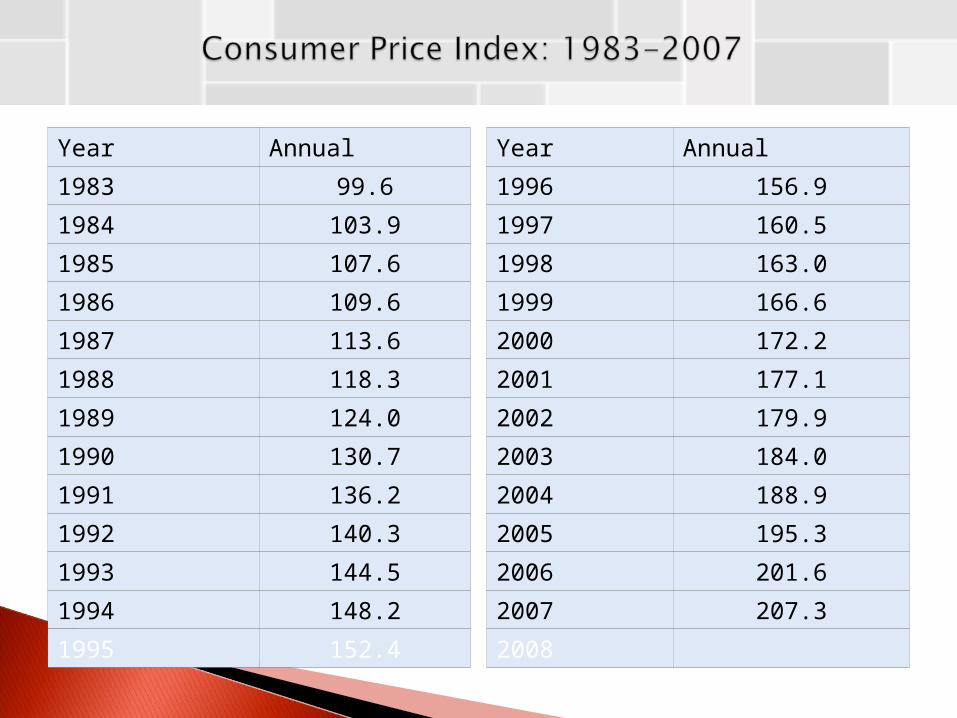
Year Annual
1983 99.6
1984 103.9
1985 107.6
1986 109.6
1987 113.6
1988 118.3
1989 124.0
1990 130.7
1991 136.2
1992 140.3
1993 144.5
1994 148.2
1995 152.4
Year Annual
1996 156.9
1997 160.5
1998 163.0
1999 166.6
2000 172.2
2001 177.1
2002 179.9
2003 184.0
2004 188.9
2005 195.3
2006 201.6
2007 207.3
2008
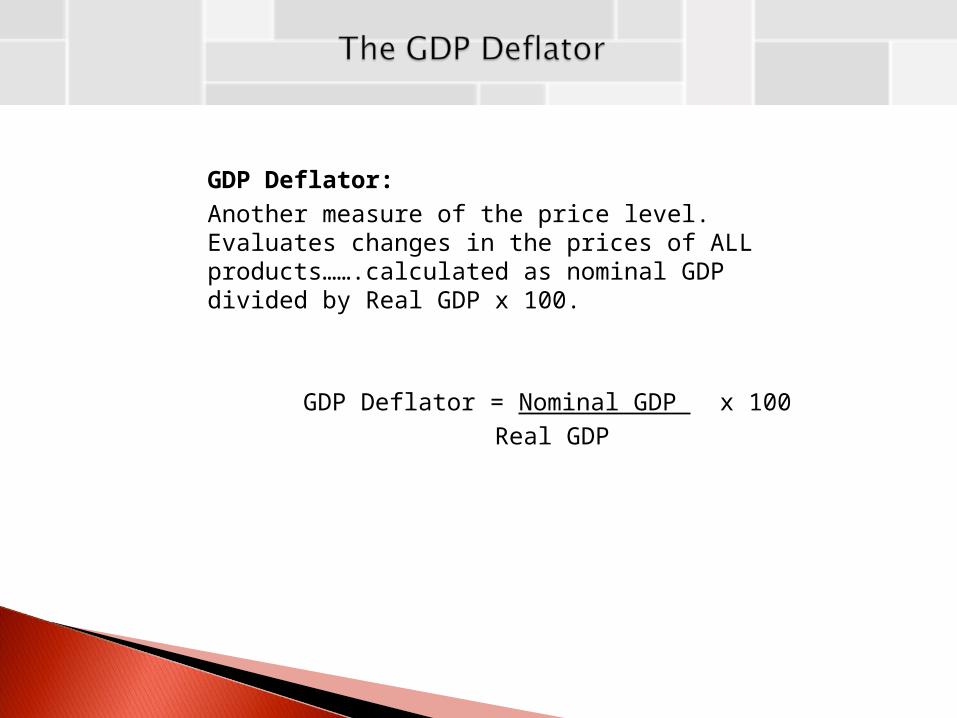
GDP Deflator:
Another measure of the price level. Evaluates changes in the prices of ALL products…….calculated as nominal GDP divided by Real GDP x 100.
GDP Deflator = Nominal GDP x 100
Real GDP
No fixed Market Basket
Base Year is different from CPI
GDP Deflator measures changes in the prices of all goods and services, whereas the CPI measures only a basket of goods.
Winners Debtors
Nominal interest rate: interest rate quoted
Real interest rate: nominal interest rate minus the rate of inflation
Homeowners Wage earners Government
Losers Creditors Savers Wage Earners
1. What is a base year?
It is a year that is used for comparison purposes with other years.
2. Explain how the CPI is calculated.
The CPI is calculated as follows:
(1) define a market basket,(2) determine how much it would cost to purchase
the market basket in the current year and in the base year
(3) divide the dollar cost of purchasing the market basket in the current year by the dollar cost of purchasing the market basket in the base year, and
(4) multiply the quotient by 100.
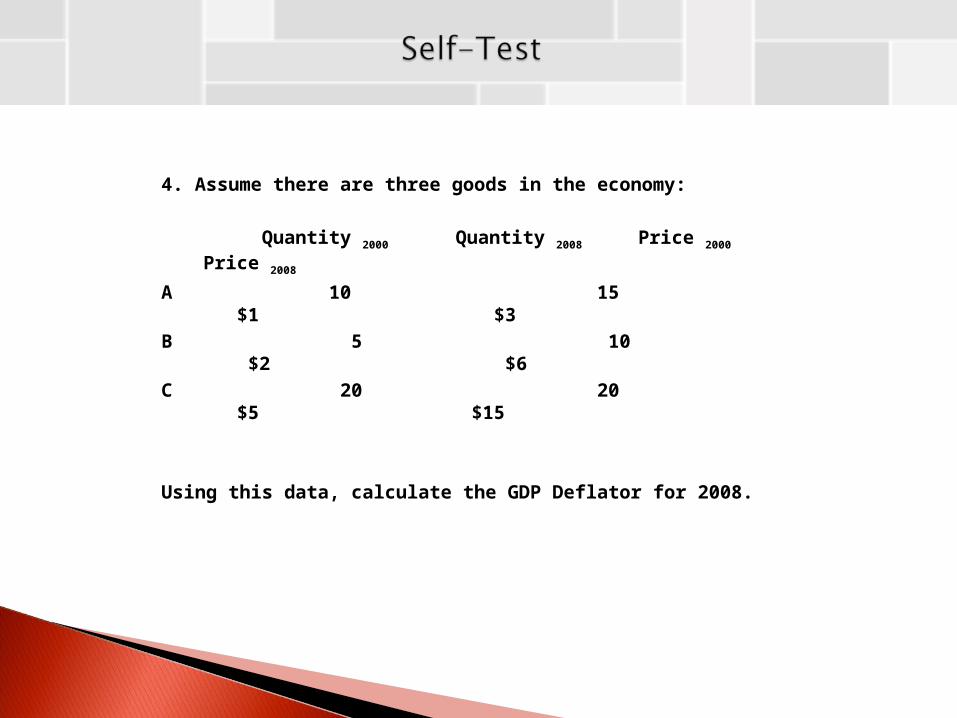
4. Assume there are three goods in the economy:
Quantity 2000 Quantity 2008 Price 2000 Price 2008
A 10 15 $1 $3
B 5 10 $2 $6
C 20 20 $5 $15
Using this data, calculate the GDP Deflator for 2008.