prioritization of green manufacturing drivers in indian
TRANSCRIPT

U.P.B. Sci. Bull., Series D, Vol. 80, Iss. 2, 2018 ISSN 1454-2358
PRIORITIZATION OF GREEN MANUFACTURING DRIVERS
IN INDIAN SMEs THROUGH IF-TOPSIS APPROACH
Piyush JAISWAL1, Amaresh KUMAR2, Sumit GUPTA3
The issues of global warming, landfill problems, climate change and
depleting natural resources have gained significant attention because of massive
environmental pollution by manufacturing industries. Green manufacturing (GM)
has been proposed as a solution to overcome these issues. It is important to identify
essential drivers that influence adoption of GM in SMEs. Thus, this study
investigates the common drivers and their prioritization by employing intuitionistic
fuzzy technique for order of preference by similarity to ideal solution approach.
Study suggests that “financial benefits” is the most important and “socio-cultural
responsibility” is the least important driver for GM implementation in Indian SMEs.
Keywords: Green manufacturing, Drivers, IF-TOPSIS, India, SMEs,
Manufacturing
1. Introduction
Various environmental issues have arisen in developing countries owing to
the recent growth in the manufacturing sectors. This has led to a huge pressure on
the manufacturing companies to improve their environmental performance [1].
The manufacturing industries are well known for fulfilling the requirements of
society by producing products as per the customers need. Moreover, they play a
significant role in enhancing the lifestyle of the people and society as a whole.
The developing countries are continuously working on meeting the demands and
uplifting the living style of their rising population that has an adverse effect on the
environment. In order to reduce the negative impact on the environment, there is
an urgent need to improve manufacturing processes that can reduce the waste
generated by industries. In India, large scale industries cause less industrial
pollution as compared to small and medium enterprises (SMEs) as they have
adopted new technologies which have minimal impact on the environment. Their
economic performance has also improved as a result of employing new eco-
friendly technologies. SMEs have emerged out as highly prominent sector of the
1 Reseach Scholar, Department of Manufacturing Engineering, National Institute of Technology
Jamshedpur, India, email: [email protected] 2 Associate Professor, Department of Manufacturing Engineering, National Institute of
Technology Jamshedpur, India 3 Assitant Professor, Department of Mechanical Engineering, Amity School of Engineering &
Technology Noida, India

278 Piyush Jaiswal, Amaresh Kumar, Sumit Gupta
Indian economy over the last decade [2]. SMEs are also supporting
industrialization of backward and rural areas to reduce the regional disparity and
to generate ample of employment opportunity for the youth of the nation [3]. In
India, more than 48 million SMEs generate 40% employment of the total Indian
workforce and contribute 17% to the total gross domestic product (GDP) of the
country [4]. These benefits from SMEs drive it to an important position in one
hand but on the other hand they are creating more pollution as compared to large
scale industries. The reason behind is lack of adoption of new eco-friendly
manufacturing system like green manufacturing (GM). According to Dornfeld
David [5] “Green manufacturing is a process or system which has a minimal,
nonexistent, or negative impact on the environment”. In order to sustain and grow
in the competitive global market, SMEs need to resolve these critical issues by
adopting innovative approaches such as GM, in their operations and supply chain.
The sustainability elements of GM process assist the management to effectively
address the manufacturing cost, power consumption, waste management, eco-
friendliness, operational safety and worker personnel health in organization.
Indian SMEs fears to adopt new technology as it is expensive and an endless
process with a high obsolescence rate. The management of SMEs tends to view
these new technologies as an expense rather than as a strategic investment. Hence,
implementation of any new manufacturing strategy particularly in SMEs needs a
strong motivational factor that can influence the management to adopt it. Thus, a
suitable methodology is required to facilitate the SMEs to identify their key
drivers of GM implementation. This study employs integrated intuitionistic fuzzy
technique for order performance by similarity to ideal solution (IF-TOPSIS)
approach to prioritize the common drivers. The intuitionistic fuzzy based TOPSIS
provide comprehensive method for effectively handle the vagueness and
uncertainty in complex environments through measuring the inherent ambiguity
of decision makers (DMs) judgment in multi criteria decision making (MCDM)
area. Based on the literature review and experts opinion, eighteen drivers in the
context of Indian SMEs are extracted that influence adoption of GM. The novelty
of this research study lies in the fact that it presents a systematic approach to
prioritize the common drivers on four different perspectives viz. Industry,
Academic, Government and Consumer that influence the implementation of GM
in manufacturing SMEs at Indian scenario with the help of intuitionistic fuzzy
based TOPSIS approach.
2. Literature review
In the past, plethora of research work has already been conducted on
methodology, case study, framework, tools/techniques and benefits of GM.
Despite this, there are a limited number of studies that analyzed the drivers of GM

Prioritization of green manufacturing drivers in Indian SMEs through if-TOPSIS approach 279
in manufacturing SMEs at Indian scenario. Agan et al. [6] averred that rule and
regulations, internal motivation, customer demands and firm performance are the
key drivers of environmental process. Law and Gunasekaran [7] recognized prime
motivating factors in implementation of sustainable strategies in Hong Kong.
Singh et al. [8] conducted a survey in Indian industry and identified fourteen
drivers that motivate GM practices. Diabat, et al. [9] developed a structural model
of drivers while using ISM techniques that affects the implementation of GSCM.
Massoud et al. [10] identified the influencing factors in implementation of EMS in
the Lebanese food industry. Zhang et al. [11] examined thirteen drivers that
influence enterprises to implement environmental management practices in China.
Gabzdylova et al. [12] examined the drivers, stakeholders and practices for the
wine industry in New Zealand. Yuksel [13] examined the drivers to adopt cleaner
production techniques from the survey questionnaire of 105 large scale industries
in Turkey. Pun et al. [14] identified the success factors which influence the
implementation of EMS and found that competitive pressure, customer
requirement and resource conservation are the prime drivers. Hui et al. [15]
conducted a survey to investigate influencing factors in adoption of GM in Hong
Kong.
It is evident from the review of past literatures that the quantum of
research work to identify and prioritize the drivers to implement GM in small and
medium manufacturing sector at Indian scenario is not in proportion with the
incredible growth in the industrial activities. Therefore, the present study attempts
to bridge that gap by identify more influential drivers of GM and subsequently
evaluating them to obtain a ranking preorders which shows the most important
driver. The list of eighteen common drivers of GM adoption is provided in Table
1.
The key highlights of this study are as follows:
• Identify the common drivers of GM through an extensive literature review
and experts suggestions.
• Proposed a framework to prioritize GM drivers in manufacturing SMEs
using IF-TOPSIS approach.
• Validate the obtained results with existing literature and feedback from
government, industry and academic experts.
3. The framework of the study
The framework of the study to analyze eighteen drivers to implement GM
in Indian SMEs is demonstrated in Figure 1, which broadly consists of three main
stages. The primary stage encompasses the identification of divers based on past
literature and through experts suggestion. In the subsequent stage, IF-TOPSIS
280 Piyush Jaiswal, Amaresh Kumar, Sumit Gupta
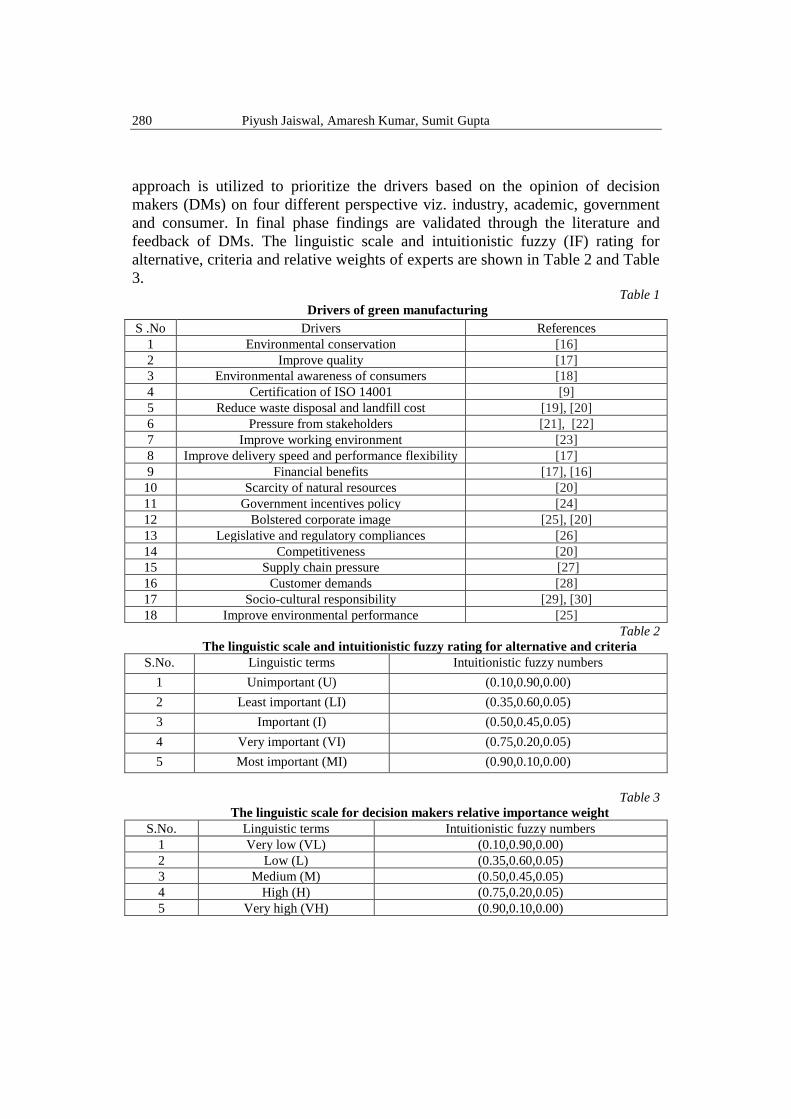
approach is utilized to prioritize the drivers based on the opinion of decision
makers (DMs) on four different perspective viz. industry, academic, government
and consumer. In final phase findings are validated through the literature and
feedback of DMs. The linguistic scale and intuitionistic fuzzy (IF) rating for
alternative, criteria and relative weights of experts are shown in Table 2 and Table
3. Table 1
Drivers of green manufacturing
Table 2
The linguistic scale and intuitionistic fuzzy rating for alternative and criteria
S.No. Linguistic terms Intuitionistic fuzzy numbers
1 Unimportant (U) (0.10,0.90,0.00)
2 Least important (LI) (0.35,0.60,0.05)
3 Important (I) (0.50,0.45,0.05)
4 Very important (VI) (0.75,0.20,0.05)
5 Most important (MI) (0.90,0.10,0.00)
Table 3
The linguistic scale for decision makers relative importance weight
S.No. Linguistic terms Intuitionistic fuzzy numbers
1 Very low (VL) (0.10,0.90,0.00)
2 Low (L) (0.35,0.60,0.05)
3 Medium (M) (0.50,0.45,0.05)
4 High (H) (0.75,0.20,0.05)
5 Very high (VH) (0.90,0.10,0.00)
S .No Drivers References
1 Environmental conservation [16]
2 Improve quality [17]
3 Environmental awareness of consumers [18]
4 Certification of ISO 14001 [9]
5 Reduce waste disposal and landfill cost [19], [20]
6 Pressure from stakeholders [21], [22]
7 Improve working environment [23]
8 Improve delivery speed and performance flexibility [17]
9 Financial benefits [17], [16]
10 Scarcity of natural resources [20]
11 Government incentives policy [24]
12 Bolstered corporate image [25], [20]
13 Legislative and regulatory compliances [26]
14 Competitiveness [20]
15 Supply chain pressure [27]
16 Customer demands [28]
17 Socio-cultural responsibility [29], [30]
18 Improve environmental performance [25]

Prioritization of green manufacturing drivers in Indian SMEs through if-TOPSIS approach 281
Literature review
Identify essential drivers to implement GM
Academic expert Industrial expert
Stage 1
Questionnaire with common drivers in Indian
context
Decision maker
(DM1)
IF-weight
(0.90,0.10,0.00)
Analysis the drivers of GM based on four decision makers through
IF-TOPSIS approach
Decision maker
(DM2)
IF-weight
(0.50,0.45,0.05)
Decision maker
(DM3)
IF-weight
(0.75,0.20,0.05)
Decision maker
(DM4)
IF-weight
(0.50,0.45,0.05)
Stage 2
Stage 3
Results and discussion from feedback of decision makers and comparison with past literature
Existing literature Academic expert Industrial expert
Validate the results from feedback of experts
Fig. 1. The proposed framework of the study
4. Application of proposed framework
The stages performed in the proposed framework are described below:
Stage 1: Identification of GM drivers
In this stage common drivers of GM are collected through existing
literature and experts suggestion. A systematic literature review approach is
employed. The electronic databases such as “Google scholar”, “Web of science”,
“Scopus” etc., is used with search topics that contained combination of exact word
like “Green manufacturing”, “Cleaner production”, “Environmental conscious
manufacturing”, “Sustainable manufacturing”, “Drivers”, “SMEs” and time span
of search string was 1990 to 2017. After many rounds of discussions and content
affirmation with experts eighteen common drivers are considered for the study.

282 Piyush Jaiswal, Amaresh Kumar, Sumit Gupta
Stage 2: Application of IF-TOPSIS approach
In this stage, firstly data collection process began by scheduling an onsite
meeting with DMs and the span of time of interviews with each DMs was
approximately one to two hours and subsequently IF-TOPSIS approach is
employed. TOPSIS is widely acceptable and very useful technique to solve
MCDM problems that was developed in 1981 by Hwang [31]. It worked on the
scheme that optimal alternative should have shortest distance from positive ideal
solution (PIS) and have a longest distance from negative ideal solution (NIS).
TOPSIS method used the distances from PIS and NIS to evaluate the preference
order of the relative closeness coefficient. Owing to the massive intricacy in
decision making process, fuzzy sets are commonly used by DMs to deal with the
ambiguity and uncertainty [32]. In 1986 intuitionistic fuzzy set (IFS) is proposed
by Atanassov that is extensive form of classical fuzzy set that tackle imprecision
in planned manner in uncertain settings [33].
Consider X is finite set then IFS A in X is as follows:
( ) ( )( ) x, , AAA x x x X =
Where, ( ) : 0.00,1.00A
x X → , ( ) : 0.00,1.00A x X → represents membership
function and non-memberships function respectively
( ) ( )0 1,xAAx x X + (1)
The factor ( )A x is represents the hesitation level of x X to A and
( )0 1,A x x X which are calculated as follows:
( ) ( ) ( )1A AAx x x = − − (2)
If A and B is IFS of set X , then multiplication operator is calculated as:
( ) ( ) ( ) ( ) ( ) ( ). , . }{ A B A BBAA B x x x x x x x X = + − (3)
The IF-TOPSIS methodology requires the following steps [34]:
Step1: Assessment the rating of drivers and perspectives
Suppose that1 2 3 4, , , ,..., mA A A A A A= be the set of possible alternatives
and 1 2 3 4, x , x , x ,..., xnx x= be the set of criteria and the weight of criteria are
represented as 1 2 3 4, , , ,....,j nw w w w w w= . The ratings of each DMs for each alternative
with respect to criteria are denoted k , that is based on position, work experience
and education qualification that is shown in Table 4. This study copes with
eighteen drivers and four perspectives. The linguistic assessment of drivers and
perspectives by the DMs are shown in Table 5 and Table 6 respectively.

Prioritization of green manufacturing drivers in Indian SMEs through if-TOPSIS approach 283
Table 4
The Brief profile of DMs S.No. Decision makers Designation Type of organization Experience
1 DM 1 Deputy general manager
(Subject expert)
Manufacturing
industry
16
2 DM2 Senior manager Manufacturing
industry
12
3 DM3 Professor (Subject
expert)
Academic institution 20
4 DM4 Manager Non-governmental
organization (CII)
08
Table 5
Linguistic assessment of drivers
S
.No.
Driver Industry
perspective
Academic
perspective
Government
perspective
Consumer
Perspective
1 D1 VI I VI I
2 D2 VI VI MI VI
3 D3 I VI MI I
4 D4 MI I MI I
5 D5 VI MI MI I
6 D6 VI MI MI VI
7 D7 MI VI VI VI
8 D8 I MI MI I
9 D9 MI MI VI MI
10 D10 I MI I VI
11 D11 VI MI VI I
12 D12 MI VI VI I
13 D13 MI MI MI I
14 D14 I MI VI VI
15 D15 I MI MI VI
16 D16 I VI MI VI
17 D17 I I VI I
18 D18 VI VI MI I
Table 6
Linguistic assessment of the perspectives
S.No. Criteria DM1 DM2 DM3 DM4
1 Industry perspective MI MI VI MI
2 Academic perspective VI MI I VI
3 Government perspective VI I MI MI
4 Consumer perspective I I I VI

284 Piyush Jaiswal, Amaresh Kumar, Sumit Gupta
Step2: Calculate the weight of DMs
Suppose , ,k k k kD = be an IF number for rating of thk DMs. Then
weight of thk DMs are obtained by equation (4) as shown in Table 7.
1
kk k
k k
kl
kk k
kk k
=
+ +
=
+ +
(4)
Where, 1,2,3,4,....,k l=
Step3: Construct IF decision matrix
The intuitionistic fuzzy decision matrix ( )R for the drivers can be represent
as follows and that is shown in Table 8.
( ) ( ) ( ) ( ) ( ) ( ) ( ) ( ) ( )
( ) ( ) ( ) ( ) ( ) ( ) ( ) ( ) ( )
( ) ( ) ( ) ( ) ( ) ( ) ( ) ( ) ( )
1 1 1 1 1 11 1 1
2 2 2 2 2 22 2 2
1 1 1 2 2 2
1 1 1 2 2 2
1 1 1 2 2 2
, , , , , ,
, , , , , ,
, , , , , ,m m m m m mm m m
A A A A A An n nA A A
A A A A A An n nA A A
A A A A A An n nA A A
x x x x x x x x x
x x x x x x x x xR
x x x x x x x x x
=
Step4: Calculate aggregate weight of the criteria (Perspective)
Suppose , ,k k k k
j j j jw = be the IF number that assigned to criteria jx by thk
DMs. Then aggregate weight of criteria is calculated by utilizing intuitionistic
fuzzy weighted averaging (IFWA) operator by equation (5) that is shown in Table
9. ( ) ( ) ( ) ( )( )
( ) ( ) ( ) ( )
( )( ) ( )( ) ( )( ) ( )( )
1 2 3
1 2 3
1 2 3
1 1 1 1
, , ,......,
........
1 1 , , 1k k k
l
j j j j j
l
j j j j l j
l l l lk k k k
j j j j jk k k k
w IFWA w w w w
w w w w w
w
= = = =
=
=
= − − − −
(5)
Where, 1,2,3,.....,j n=
Table 7
The importance of decision makers and their weights DM1 DM2 DM3 DM3
Linguistic terms MI I VI I
Intuitionistic
fuzzy numbers
(0.90,0.10,0.00) (0.50,0.45,0.05) (0.75,0.20,0.05) (0.50,0.45,0.05)
Crisp weight 0.3282 0.1919 0.2878 0.1919

Prioritization of green manufacturing drivers in Indian SMEs through if-TOPSIS approach 285
Table 8
The intuitionistic fuzzy decision matrix
S
.No
Drivers Industry
perspective
Academic
perspective
Government
Perspective
Consumer
Perspective
1 D1 (0.75,0.20,0.05) (0.50,0.45,0.05) (0.75,0.20,0.05) (0.50,0.45,0.05)
2 D2 (0.75,0.20,0.05) (0.75,0.20,0.05) (0.90,0.10,0.00) (0.50,0.45,0.05)
3 D3 (0.50,0.45,0.05) (0.75,0.20,0.05) (0.90,0.10,0.00) (0.35,0.60,0.05)
4 D4 (0.90,0.10,0.00) (0.50,0.45,0.05) (0.90,0.10,0.00) (0.50,0.45,0.05)
5 D5 (0.75,0.20,0.05) (0.90,0.10,0.00) (0.90,0.10,0.00) (0.90,0.10,0.00)
6 D6 (0.75,0.20,0.05) (0.90,0.10,0.00) (0.90,0.10,0.00) (0.75,0.20,0.05)
7 D7 (0.90,0.10,0.00) (0.75,0.20,0.05) (0.75,0.20,0.05) (0.75,0.20,0.05)
8 D8 (0.50,0.45,0.05) (0.90,0.10,0.00) (0.90,0.10,0.00) (0.50,0.45,0.05)
9 D9 (0.90,0.10,0.00) (0.90,0.10,0.00) (0.75,0.20,0.05) (0.90,0.10,0.00)
10 D10 (0.50,0.45,0.05) (0.90,0.10,0.00) (0.50,0.45,0.05) (0.75,0.20,0.05)
11 D11 (0.75,0.20,0.05) (0.90,0.10,0.00) (0.75,0.20,0.05) (0.90,0.10,0.00)
12 D12 (0.90,0.10,0.00) (0.75,0.20,0.05) (0.75,0.20,0.05) (0.50,0.45,0.05)
13 D13 (0.90,0.10,0.00) (0.90,0.10,0.00) (0.90,0.10,0.00) (0.50,0.45,0.05)
14 D14 (0.50,0.45,0.05) (0.90,0.10,0.00) (0.75,0.20,0.05) (0.75,0.20,0.05)
15 D15 (0.50,0.45,0.05) (0.90,0.10,0.00) (0.90,0.10,0.00) (0.75,0.20,0.05)
16 D16 (0.50,0.45,0.05) (0.75,0.20,0.05) (0.90,0.10,0.00) (0.75,0.20,0.05)
17 D17 (0.50,0.45,0.05) (0.50,0.45,0.05) (0.75,0.20,0.05) (0.50,0.45,0.05)
18 D18 (0.75,0.20,0.05) (0.75,0.20,0.05) (0.90,0.10,0.00) (0.50,0.45,0.05)
Table 9
The aggregate intuitionistic fuzzy weight of criteria Perspective DM1 DM2 DM3 DM4 Aggregate weight
P1 (0.90,0.10,0.00) (0.90,0.10,0.00) (0.75,0.20,0.05) (0.90,0.10,0.00) (0.8698,0.1221,0.0081)
P2 (0.75,0.20,0.05) (0.90,0.10,0.00) (0.50,0.45,0.05) (0.75,0.20,0.05) (0.7440,0.2212,0.0348)
P3 (0.75,0.20,0.05) (0.50,0.45,0.05) (0.90,0.10,0.00) (0.90,0.10,0.00) (0.8160,0.1676,0.0164)
P4 (0.50,0.45,0.05) (0.50,0.45,0.05) (0.50,0.45,0.05) (0.75,0.20,0.05) (0.5623,0.3852,0.0525)
Step5: Compute aggregated weighted IF decision matrix
The aggregated weighted IF decision matrix ( ')R is evaluated with
the help of equation (6) and (7), as shown in Table 10.
( ) ( ) ( ) ( ) ( ) ( ) ( ).W 1Ai Ai w Ai w Ai wx x x x x x x = − − − + (6)
( ) ( ) ( ) ( ) ( ) ( ) , . ,Ai w Ai w Ai wR W x x x x x x x x X = + − (7)
The aggregated IF weighted decision matrix ( ')R is defined as follows:
( ) ( ) ( ) ( ) ( ) ( ) ( ) ( ) ( )
( ) ( ) ( ) ( ) ( ) ( ) ( ) ( ) ( )
( ) ( ) ( ) ( ) ( ) ( ) ( ) ( ) ( )
1 1 1 1 1 11 1 1
2 2 2 2 2 22 2 2
1 1 1 2 2 2
1 1 1 2 2 2
1 1 1 2 2 2
, , , , , ,
, , , , , ,'
, , , , , ,m m m m m mm m m
AW AW AW AW AW AWn n nAW AW AW
A W A W A W A W A W A Wn n nA W A W A W
A W A W A W A W A W A Wn n nA W A W A W
x x x x x x x x x
x x x x x x x x xR
x x x x x x x x x
=

286 Piyush Jaiswal, Amaresh Kumar, Sumit Gupta
Table 10
The aggregate weighted intuitionistic fuzzy decision matrix Driver Industry perspective Academic perspective Government perspective Consumer perspective
D1 (0.6523,0.2976,0.0500) (0.3720,0.6288,0.2510) (0.6120,0.3340,0.0539) (0.2811,0.6618,0.0570)
D2 (0.6523,0.2976,0.0500) (0.5580,0.3769,0.0650) (0.7344,0.2508,0.0147) (0.4217,0.5081,0.0696)
D3 (0.4349,0.5171,0.0479) (0.5580,0.3769,0.0650) (0.7344,0.2508,0.0147) (0.2811,0.6618,0.0570)
D4 (0.7828,0.2098,0.0073) (0.3720,0.6288,0.2510) (0.7344,0.2508,0.0147) (0.2811,0.6618,0.0570)
D5 (0.6523,0.2976,0.0500) (0.6696,0.2990,0.0313) (0.7344,0.2508,0.0147) (0.2811,0.6618,0.0570)
D6 (0.6523,0.2976,0.0500) (0.6696,0.2990,0.0313) (0.7344,0.2508,0.0147) (0.4217,0.5081,0.0696)
D7 (0.7828,0.2098,0.0073) (0.5580,0.3769,0.0650) (0.6120,0.3340,0.0539) (0.4217,0.5081,0.0696)
D8 (0.4349,0.5171,0.0479) (0.6696,0.2990,0.0313) (0.7344,0.2508,0.0147) (0.2811,0.6618,0.0570)
D9 (0.7828,0.2098,0.0073) (0.6696,0.2990,0.0313) (0.6120,0.3340,0.0539) (0.5060,0.4466,0.0473)
D10 (0.4349,0.5171,0.0479) (0.6696,0.2990,0.0313) (0.4080,0.5421,0.0498) (0.4217,0.5081,0.0696)
D11 (0.6523,0.2976,0.0500) (0.6696,0.2990,0.0313) (0.6120,0.3340,0.0539) (0.2811,0.6618,0.0570)
D12 (0.7828,0.2098,0.0073) (0.5580,0.3769,0.0650) (0.6120,0.3340,0.0539) (0.2811,0.6618,0.0570)
D13 (0.7828,0.2098,0.0073) (0.6696,0.2990,0.0313) (0.7344,0.2508,0.0147) (0.2811,0.6618,0.0570)
D14 (0.4349,0.5171,0.0479) (0.6696,0.2990,0.0313) (0.6120,0.3340,0.0539) (0.4217,0.5081,0.0696)
D15 (0.4349,0.5171,0.0479) (0.6696,0.2990,0.0313) (0.7344,0.2508,0.0147) (0.4217,0.5081,0.0696)
D16 (0.4349,0.5171,0.0479) (0.5580,0.3769,0.0650) (0.7344,0.2508,0.0147) (0.4217,0.5081,0.0696)
D17 (0.4349,0.5171,0.0479) (0.3720,0.6288,0.2510) (0.6120,0.3340,0.0539) (0.2811,0.6618,0.0570)
D18 (0.6523,0.2976,0.0500) (0.5580,0.3769,0.0650) (0.7344,0.2508,0.0147) (0.2811,0.6618,0.0570)
IFPIS (0.7828,0.2098,0.0073) (0.6696,0.2990,0.0313) (0.7344,0.2508,0.0147) (0.5060,0.4466,0.0473)
IFNIS (0.4349,0.5171,0.0479) (0.3720,0.6288,0.2510) (0.4080,0.5421,0.0498) (0.2811,0.6618,0.0570)
Step6: Calculate IF positive ideal solution (IFPIS) and IF negative ideal
solutions (IFNIS) with the help of equation (8) and (9).
( )1 2 3 .W .W .W, , ,....., ( (x ), (x ), (x )), j 1,2,3,...., ni i in A j A j A jA r r r r − − − − − − − −= = = (8)
( )* * * * * * * *
1 2 3 .W .W .W, , ,......, ( (x ), (x ), (x )), j 1,2,3,....., ni i in A j A j A jA r r r r = = = (9)
Where;
*
.W .W
*
.W .W
.W .W
.W .W
(x ) {max (x ) j 1,2,3,..., n}
(x ) {min (x ) j 1,2,3,..., n}
(x ) {max (x ) j 1,2,3,..., n}
(x ) {min (x ) j 1,2,3,..., n}
i i
i i
i i
i i
A j A ji
A j A ji
A j A ji
A j A ji
−
−
= =
= =
= =
= =
Step7: Evaluate the distance from the alternatives (Drivers) and IFPIS as
well as IFNIS, with the help of equation (10) and (11).
* * *
* 2 2 2
.W .W .W.W .W .W1
1( (x ) (x )) ( (x ) (x )) ( (x ) (x ))
2 i i ii i i
n
A j j A j j A j jA A Aj
Sn
=
= − + − + − (10)

Prioritization of green manufacturing drivers in Indian SMEs through if-TOPSIS approach 287
2 2 2
.W .W .W.W .W .W1
1( (x ) (x )) ( (x ) (x )) ( (x ) (x ))
2 i i ii i i
n
A j j A j j A j jA A Aj
Sn
− − −
−
=
= − + − + − (11)
Step7: Evaluate the relative closeness coefficient of alternative with
respect to IFPIS by utilizing equation (12).
*
*
i
i
i i
SC
S S
−
−=
+ (12)
Where, *0 1( 0,1,2,3...., )i
C i m =
Step 8: The rank of drivers is evaluated according to score of relative
closeness coefficient *
iC as shown in Table 11.
Table 11
Separation measures and the relative closeness coefficient of alternatives
S.No. Drivers *S S − *
iC Rank
1 D1 0.2215 0.1501 0.4039 17
2 D2 0.0848 0.2492 0.7461 4
3 D3 0.2042 0.2115 0.5088 15
4 D4 0.2069 0.2263 0.5224 14
5 D5 0.1242 0.2583 0.6753 6
6 D6 0.0689 0.2686 0.7958 2
7 D7 0.0824 0.2527 0.7541 3
8 D8 0.1981 0.2340 0.5415 13
9 D9 0.0540 0.2838 0.8401 1
10 D10 0.2294 0.1900 0.4530 16
11 D11 0.1355 0.2307 0.6299 9
12 D12 0.1322 0.2416 0.6463 7
13 D13 0.1100 0.2862 0.7224 5
14 D14 0.1774 0.2162 0.5492 12
15 D15 0.1690 0.2454 0.5921 10
16 D16 0.1761 0.2239 0.5597 11
17 D17 0.2699 0.1030 0.2762 18
18 D18 0.1337 0.2491 0.6402 8
Stage 3: Result validation
In the last stage, to verify the reliability of the results, the obtained
outcomes are discussed with the industrial and academic experts by making an
onsite meeting and conversation lasted more than one hours. In the discussion, it
was found that the results obtained significantly corroborated with that of the
expert opinions. Also, support from the literature is provided to validate the
obtained results.
288 Piyush Jaiswal, Amaresh Kumar, Sumit Gupta
5. Results and discussion
This study prioritized the common drivers in implementation of GM in
Indian SMEs through IF-TOPSIS approach with the help of four decision makers
having extensive experience and deep knowledge in the manufacturing sector. The
prioritization of common drivers of GM is based on relative closeness coefficient
(RCC). The findings of the results show that “Financial benefits” is the most
essential driver with RCC score 0.8401. Whereas “Socio-cultural responsibility”
is the least important driver to implement GM with the score 0.2762.
On the basis of RCC values of common drivers, prioritization of drivers in
decreasing order is as follows:D9>D6>D7>D2>D13>D5>D12>D18>D11>D15>
D16>D14>D8>D4>D3>D10>D1>D17. D9, D6, D7, D2 and D13 are the top five
most important drivers having enormous influence on small and medium
manufacturing industries to adopt GM. The management of SMEs recognized
various financial benefits in short term and long term tenure from GM practices.
In present scenario material, energy and water are the prime concern for the
manufacturing industries and it is well known that GM implementation in
industries can reduce the cost by smart use of material and energy efficient
equipment. Lee [23] divulges in the study of Korean manufacturing SMEs that
reduction of material, water usage by 13% and 21% after adoption of GM.
Rutherford et al. [35] also advocated that better GM practices improve the costs as
well as relationships with the ultimate customers. Pressure from stakeholder (D6)
is the second most important drivers. Stakeholder such as media, NGO, local
community, etc., is directly influencing the industries to adopt green related
practices to reduce the environmental impact. Improve working environment (D7)
and improve quality (D2) are the third and fourth essential drivers respectively.
Safe working environment is one of the most important considerations for
workers performing various activities in the workplace. Better working
environment and safety are the prime concern of large scale industries, but SMEs
is lacking in these standard. GM practices provided better working environment
by reducing pollutants and air emissions on shop floor due to which productivity
of worker has drastically improved Lee [23]. GM system is better and more
efficient than traditional manufacturing system and has the gigantic ability to
produce eco-friendly products with very short period of time at a lesser price with
better quality. Pil et al. [36] applied environmental practices in a paint shop and
observed that changes in the production process had the additional benefits of
quality improvement along with environmental improvements. Legislative and
regulatory compliances (D13) are the fifth most important drivers for GM
adoption in SMEs. Due to the significant environmental impact from industrial
waste, government legislative organizations introduce regulations, policies and
laws to control and regulate the environmental performances. Zhu et al. [18] also

Prioritization of green manufacturing drivers in Indian SMEs through if-TOPSIS approach 289
supported environmental regulation is the one of major drivers to enforce GM
practices to protect environment all over the world. Under the regulatory pressure
and government efforts, manufacturing sector is driven towards green practices.
Government of India also promotes zero effect zero defect (ZED) strategies for
micro, small and medium enterprises under the UNIDO-GEPF-MSME scheme.
Due to their pertinent benefits, other drivers are also assisting in effective
implementation of GM in manufacturing SMEs.
6. Conclusions
GM has become the need of urgency for small and medium manufacturing
sector because of the huge amount of waste generated by them. In developing
countries, like India penetrations of green practices are still lacking. So, in order
to increase the rate of implementation, identification of essential drivers is needed
that influence the management of SMEs to adopt GM practices. Therefore, this
study provides eighteen essential drivers based on extensive literature and
suggestions from experts. Subsequently, intuitionistic fuzzy-TOPSIS approach
has been utilized to prioritize the common drivers of GM with the help of four
decision makers. Financial benefits (D9), Pressure from stakeholders (D6),
Improve working environment (D7), Improve quality (D2) and Legislative and
regulatory compliances (D13) are the five most important drivers of GM for
manufacturing SMEs. It is well known that implementation of GM strategy will
help the SMEs to take competitive advantage and financial benefits through
subsidies and tax exemptions. For effective and efficient adoption of GM
practices in manufacturing firms, understanding the essential drivers are
important. The present study assists the management of SMEs to prioritize the
essential drivers for successful implementation of GM practices in their industries.
This study collected the data from four decision makers which have vast
knowledge and experience in manufacturing sectors. The future scope could be to
analyze the essential drivers in different sectors such as food industry, textile
industry with more experts opinion.

290 Piyush Jaiswal, Amaresh Kumar, Sumit Gupta
R E F E R E N C E S
[1]. Mittal V.K, Sindhwani R, and Kapur P.K, “Two-Way assessment of Barriers to Lean–Green
Manufacturing System: Insights From India”, International Journal of System Assurance
Engineering and Management., vol. 7(4), 2016, pp.400-407.
[2]. Government of Indian, Annual report 2014-2015, Ministry of Micro, Small and Medium.
[online]
http://msme.gov.in/sites/default/files/MEME%20ANNUAL%20REPORT%202015-
16%20ENG.pdf. (Accessed on march 15, 2017).
[3]. Confederation of Indian industry (CII). A Theme Paper titled ‘Building Globally Competitive
MSMEs: The Way Forward’ was unveiled during the MSME Conclave 2016 held on 1
March, 2016 at Jaipur.
[4]. Vyas V, Raitani S, Roy A and Jain P, “Analysing Critical Success Factors in Small and
Medium Enterprises Banking”, World Review of Entrepreneurship, Management and
Sustainable Development., vol. 11(1), 2015, pp.106-123.
[5]. Dornfeld, David, et al, “Introduction to Green Manufacturing. Green Manufacturing. Springer
US., 2013 pp1-23.
[6]. Agan Y, Acar M.F and Borodin A, “Drivers of Environmental Processes and Their Impact on
Performance: a Study of Turkish SMEs”, Journal of Cleaner Production., vol. 51, 2013,
pp.23-33.
[7]. Law, K.M.Y. and Gunasekaran, A, “Sustainability Development in High-Tech Manufacturing
Firms in Hong Kong: Motivators and Readiness”, International Journal of Production
Economics., Vol. 137(1), 2012, pp. 116-125.
[8]. Singh A, Singh B and Dhingra A.K, “Drivers and Barriers of Green Manufacturing Practices:
A Survey of Indian industries”, International Journal of Engineering Sciences., vol. 1(1),
2012, pp.5-19.
[9]. Diabat Ali and Kannan Govindan, “An analysis of the Drivers Affecting the Implementation
of Green Supply Chain Management”, Resources, Conservation and Recycling., vol. 55(6),
2010, pp.659-667.
[10]. Massoud, M.A., Fayad, R., Kamleh, R. and El-Fadel, M, “Environmental Management
System (ISO 14001) Certification in Developing Countries: Challenges and Implementation
Strategies”, Environmental Science & Technology., vol. 44(6), 2010, pp.1884-1887.
[11]. Zhang B, Bi J and Liu B, “Drivers and Barriers to Engage Enterprises in Environmental
Management Initiatives in Suzhou Industrial Park, China”, Frontiers of Environmental
Science & Engineering in China., vol. 3(2), 2009, pp.210-220.
[12]. Gabzdylova B, Raffensperger JF, and Castka P, “Sustainability in the New Zealand Wine
Industry: Drivers, Stakeholders and Practices”, Journal of Cleaner Production., vol. 17(11),
2009, pp.992-998.
[13]. Yuksel H,“An Empirical Evaluation of Cleaner Production Practices in Turkey”, Journal of
Cleaner Production., vol. 16(1), 2008, pp.S50-S57.
[14]. Pun K.F, Hui, I.K, Lau H.C, Law H.W and Lewis W.G, “Development of an EMS planning
framework for environmental management practices. International Journal of Quality &
Reliability Management., vol. 19(6), 2002, pp.688-709.
[15]. Hui I.K, Chan A.H, and Pun K.F,“A Study of the Environmental Management System
Implementation Practices”, Journal of Cleaner Production., vol. 9(3), 2001, pp.269-276.
[16]. Govindan K, Diabat A, and Shankar K.M, “Analyzing the Drivers of Green Manufacturing
with Fuzzy Approach”, Journal of Cleaner Production., vol. 96, 2015, pp.182-193.

Prioritization of green manufacturing drivers in Indian SMEs through if-TOPSIS approach 291
[17]. Shankar K.M, Kumar P.U, and Kannan D, “Analyzing the Drivers of Advanced Sustainable
Manufacturing System Using AHP Approach”, Sustainability., vol. 8(8), 2016, pp.824(1-
10).
[18]. Zhu Q and Geng Y, “Drivers and Barriers of Extended Supply Chain Practices For Energy
Saving and Emission Reduction Among Chinese Manufacturers”, Journal of Cleaner
Production., vol. 40, 2013, pp.6-12.
[19]. Perez‐Sanchez D, JR Barton and D Bowe, “Implementing Environmental Management in
SMEs”, Corporate Social Responsibility and Environmental Management., vol. 10(2),
2003, pp.67-77.
[20]. Luthra, Sunil, Dixit Garg, and Abid Haleem, “Critical Success Factors of Green Supply
Chain Management For Achieving Sustainability in Indian Automobile Industry”,
Production Planning & Control., vol. 26(5), 2015, pp.339-362.
[21]. Mont O, and Leire C, “Socially Responsible Purchasing in Supply Chains: Drivers and
Barriers in Sweden”, Social Responsibility Journal., vol. 5(3), 2009, pp.388-407.
[22]. Montalvo C, “General Wisdom Concerning the Factors Affecting the Adoption of Cleaner
Technologies: A Survey 1990–2007”, Journal of Cleaner Production., vol. 16(1), 2008,
pp.S7-S13.
[23]. Lee Ki-Hoon, “Why and How to Adopt Green Management into Business Organizations?
The Case Study of Korean SMEs in Manufacturing Industry”, Management Decision.,
vol. 47(7), 2009, pp.1101-1121.
[24]. Parker C.M, Redmond J, and Simpson M, “A Review of Interventions to Encourage SMEs to
Make Environmental Improvements”, Environment and Planning C: Government and
Policy., vol. 27(2), 2009, pp.279-301.
[25]. Tice J, Ahouse L and Larson T, “Lean Production and EMSs: Aligning Environmental
Management with Business Priorities”, Environmental Quality Management., vol. 15(2),
2005, pp.1-12.
[26]. Tyagi M, Kumar P and Kumar D, “Analysis of Interactions Among the Drivers of Green
Supply Chain management”, International Journal of Business Performance and Supply
Chain Modeling., vol. 7(1), 2015, pp.92-108.
[27]. Ervin David, et al, “Motivations and Barriers to Corporate Environmental Management”,
Business Strategy and the Environment., vol. 22(6), 2013, pp.390-409.
[28]. Giunipero LC, Hooker RE, and Denslow D, “Purchasing and Supply Management
Sustainability: Drivers and Barriers”, Journal of Purchasing and Supply Management., vol.
18(4), 2012, pp.258-269.
[29]. Khidir ElTayeb, Tarig, Suhaiza Zailani, and Krishnaswamy Jayaraman, “The Examination
on the Drivers For Green Purchasing Adoption Among EMS 14001 Certified Companies in
Malaysia”, Journal of Manufacturing Technology Management., vol. 21(2), 2010, pp.206-
225.
[30]. Hsu C.C et al, “Supply Chain Drivers that Foster the Development of Green Initiatives in an
Emerging Economy”, International Journal of Operations & Production Management.,
vol. 33(6), 2013, pp.656-688.
[31]. Hwang CL and Yoon K, “Methods For Multiple Attribute Decision Making. In Multiple
Attribute Decision Making”, Springer Berlin Heidelberg., 1981, pp58-191.
[32]. Chang, S.H and Tseng H.E, “Fuzzy TOPSIS Decision Method For Configuration
Management”, International Journal of Industrial Engineering: Theory, Applications and
Practice., vol. 15(3), 2008, pp304-313.

292 Piyush Jaiswal, Amaresh Kumar, Sumit Gupta
[33]. Atanassov K.T, “Intuitionistic fuzzy sets”, Fuzzy Sets and System., vol., 20(1), 1986, pp87-
96.
[34]. Boran, Fatih Emre, et al, “A Multi-Criteria Intuitionistic Fuzzy Group Decision Making For
Supplier Selection With TOPSIS Method”, Expert Systems with Applications., vol. 36(8),
2009, pp.1363-11368.
[35]. Rutherfoord R, Blackburn R.A and Spence L.J, “Environmental Management and the Small
Firm: an International Comparison”, International Journal of Entrepreneurial Behavior &
Research., vol. 6(6), 2000, pp.310-326.
[36]. Pil FK, and Rothenberg S, “Environmental Performance as a Driver of Superior
Quality”, Production and Operations Management., vol. 12(3), 2003, pp.404-415.