prioritizing effective 7ms to improve production systems
TRANSCRIPT
International Review of Business Research Papers
Vol. 5 No. 3 April 2009 Pp. 257‐277
Prioritizing Effective 7Ms to Improve Production Systems Performance by Using AHP Technique
Reza Rostamzadeh1 and Saudah bt. Sofian2
As it arises from the paper, present research is prioritizing effective 7Ms in order to improve production systems performance, using AHP technique. In this research systematic approach has been used for organization and production system inputs, named as 7Ms (Management, Man power, Marketing, Method, Machine, Material, Money) and the factors which play critical roles to improve these 7Ms, have been investigated. This research has been done on a manufacturing plant, but it can also be used for other types of organizations paying attention to their situation in competitive environment.
Keywords: 7Ms, AHP, Production System
Field of Research: Management
1. Introduction
In every organization there are some activities which are in interacting with each other and their environment and these together determine the organization’s final performance. These activities must be measured. Of course this is caused by today’s competitive world and the only way to remain and maintain in such a condition is accuracy of actions and being of a high level efficiency and effectiveness. The mentioned items cannot be obtained without planning, supervising, controlling and evaluating activities continuously. For this reason managers must possess a systematic approach to improve organization performance and try as much as possible to employ methods like value analysis and value management for decreasing system inputs without having negative effect on system outputs. Therefore, in such an environmental conditions the belief is that the company must utilize all of its resources with maximum efficiency and as an integrated whole to compete with its global competitors (Radford and Noori, 1995), (Bagherpour and Ebrahim, 2005).
1 . Corresponding author Email: [email protected] Tel: +6-017-3040034 2 . [email protected] Tel: +6-019-7277416 Fax: +6075566911

Rostamzadeh & Sofian
258
1.1. Problem Statement
Nowadays in industrialized world which is under pressure of market competitiveness, necessity of quality and price for organization managers has become more challenging issue. In other words, desirability of product or service quality in the market cannot be the main factor to succeed in competition and remain in the market, but numerous factors are brought forth for discussion which the most important one is assuring of customers on company capabilities to continue the quality of its product. In fact it can be said that the main attention for desirability of product or final service has changed to quality of all functions and processes influences to quality and price throughout the organization structure in the form of software and hardware. Mangers without systematic approach and regarding to system inputs will not be able to achieve organization goals (Taghizadeh, 2001).
Among the mentioned features above, system inputs and using way of them have high priority. Therefore, for using minimum resources to gain maximum outputs, we must know the creative factor of 7Ms and their relatives to improve both the factors and maximize the system productivity. For this reason the researchers want to prioritize 7Ms effective on production system performance using AHP and for improving systems performance and do effective actions for each item.
1.2. Objective of Research
With regarding to this point that responsibility to the customer needs is known as a basis to remain in markets, so necessity of attention to factors like; price, quality, time, … and preparing them in acceptable level is counted as a major function of organization. For achieving these goals, managers should take a notice to the heart of their organizations which indeed is the production process, because at this place their goods are value added. Improving performance of this part influences the final product directly and it can be helpful for organization to reach their goals which undeniably is customer satisfaction and profitability and it will possible only if the organizations have inputs with appropriate efficiency. In consideration to the above mentioned, the main objectives of this research are as follow:
1. Studying and verifying effective 7Ms in order to improve production systems performance.
2. Studying effective 7Ms to improve production systems performance from theoretical view point.
3. Offering suggestions to improve production systems performance.
In the following figure, inputs and outputs of system are shown:

Rostamzadeh & Sofian
259
Production system feedback
Figure 1-1 Production system
Source: Taghizadeh (2001)
The main questions of the research are:
1. Which of these effective 7Ms has the priority to improve production systems performance over the others?
2. How do we can arrange the effective 7Ms with regard to their priority?
1.3. Analytic Hierarchical Process
The AHP was developed by Saaty (1990a) who demonstrated the feasibility of expressing, either verbally or numerically, the importance of one element (or alternative) relative to another with respect to a given criterion. Expert judgment concerning alternatives is elicited using a pair-wise comparison method based on the response to a question such as: ``In terms of realizing the goal, which of the two alternatives is more important, A or B? Quantify the relative importance of A over B (or vice versa).'' The expert first has to judge which alternative is the more important or makes the greater contribution, and then quantify the degree of importance/contribution. Each pair of alternatives is considered in turn using the numerical scale or linguistic responses given by Saaty (Table 1). The judgments are recorded in a matrix, which describes a set of equations that can be solved for the principal right Eigen vector. This vector gives the normalized weights for all of the alternatives, which are used as factors to indicate the degree of correlation between individual component effects and their parent.
Management
Manpower
Material
Method
Money
Marketing
Machine
Production processProduct
Loss

Rostamzadeh & Sofian
260
(Table 1) Source: Saaty (1990a, b)
Numerical scale Verbal scale Explanation 1.0 Equal importance of both elements. Two elements contribute equally. 3.0 Moderate importance of one element Experience and judgment favor one over another. element over another. 5.0 Strong importance of one element an element is strongly favored. over another. 7.0 Very strong importance of one an element is very strongly dominant. element over another. 9.0 Extreme importance of one element an element is favored by about an over another. order of magnitude of difference. 2.0, 4.0, 6.0, 8.0 intermediate value between two Used for compromise between two adjacent judgments. Judgments. Increments of 0.1 Intermediate values in increments of 0.1 Use for even finer graduations of Judgments.
In the computation of the weights, the numerical scale is applied directly as a ratio of importance. Experience has confirmed that a scale of nine units is reasonable and reflects the degree to which humans can quantify relationships among elements (Saaty, 1990b).
2. Methodology
The populations of this research were managers, assistance managers, analysts and experts of company X (which is a manufacturing plant). Total number of populations was 46; therefore all the population was taken as a sample. For gathering needed information, the researchers has used interviews, questionnaire and making expert work groups for getting AHP tables needed data. See appendix for questionnaire form. According to the AHP rules, one of the most important stages of this model is allocating weights to each one of the variables as a pair-wise comparison. In this research for comparing 7Ms, the researcher has used managers and experts opinions of company X by questionnaire. The questionnaire was designed based on the data needed for AHP model. For weighting tables, the researchers has used table which was provided by Saaty. After gathering the data, weights and inconsistency ratio was calculated by Expert Choice software and if inconsistency ratio of pair-wise comparison was more than 0.1, the questionnaire is being returned to the company. In this research the main purpose of designing questionnaire was to obtain the information needed for the AHP model. After designing and formulating, the questionnaire was tested for validity and ambiguities. Final framework of the questionnaire includes 8 tables. At the end, to test the reliability of gathered data the researcher has used Spearman rank correlation coefficient.

Rostamzadeh & Sofian
261
For determining the reliability of questionnaire retest method is used. In this way that the researcher chose 5 samples randomly from the population in two different times (at least 2 weeks) the questionnaires were distributed to them. After that, Spearman rank correlation coefficient and meaningful test of population was calculated. The following formula shows the Spearman rank correlation coefficient calculation (Van der Wareden, 1969):
For calculating , if n , so we can approximate with normal distribution in this way we need E ( and V ( . Therefore under , E ( and V ( are as follow:
E ( = 0
7Ms reliability test was calculated, other calculations are the same. Reliability of questionnaire was at 95% confidence coefficient. The variable X illustrates the first time of delivering questionnaire and variable Y shows the second time.
Table1. Relative weight of 7Ms
1 2 3 4 5
X Y X Y X Y X Y X Y
Management 0.27 0.397 .0328 0.247 0.165 0.145 0.114 0.375 0.241 0.25 Manpower 0.287 0.232 0.135 0.281 0.143 0.186 0.148 0.238 0.143 0.19 Marketing 0.183 0.109 0.195 0.198 0.285 0.161 0.426 0.19 0.237 0.168 Material 0.083 0.053 0.023 0.084 0.093 0.157 0.079 0.046 0.032 0.024 Machines 0.032 0.054 0.022 0.112 0.041 0.129 0.045 0.047 0.028 0.022 Method 0.103 0.039 0.082 0.036 0.127 0.129 0.047 0.057 0.099 0.184 Money 0.04 0.03 0.216 0.042 0.147 0.093 0.143 0.046 0.321 0.161
1- Hypothesis : :
2- Spearman correlation coefficient

Rostamzadeh & Sofian
262
3- Test
4- Critical amount: because n > 10, distribution is approximately normal so:
= W (Z
5- Decision making: because of calculated Z (Z= 5.71), is located in critical area, so we reject . Therefore we can say there is a meaningful correlation in between two variable X and Y.
2.1. Implementation Of AHP In This Research
Stage 1: Problem statement and drawing decision making hierarchy tree
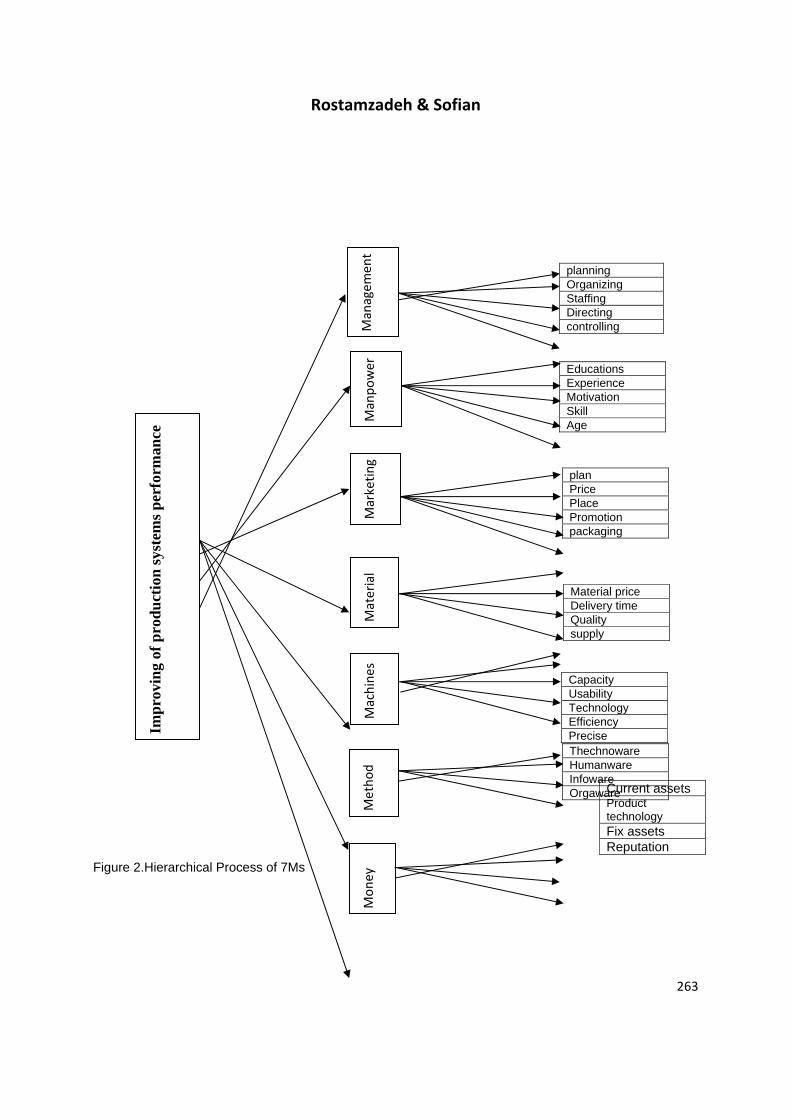
Hierarchical is a graphical show of real complexity problem which in the top level there is total goal and at the next levels there are criteria and alternatives (Ghodsipour, 2001). In this research, the first level there was improving production system performance. In the second level there are criteria of research which are 7Ms and in the third level there are sub-criteria of 7Ms. Figure 2 shows the hierarchical process.
Rostamzadeh & Sofian
263
planning Organizing Staffing Directing controlling
Figure 2.Hierarchical Process of 7Ms
Educations Experience Motivation Skill Age
plan Price Place Promotion packaging
Material price Delivery time Quality supply
Capacity Usability Technology Efficiency Precise Thechnoware Humanware Infoware Orgaware Current assets
Product technology Fix assets Reputation
Impr
ovin
g of
pro
duct
ion
syst
ems p
erfo
rman
ce
Managem
ent
Manpo
wer
Marketin
g Machine
s Metho
d Mon
ey
Material

Rostamzadeh & Sofian
264
Stage 2: Pair wise comparison and computing research variables weight
In pair wise comparison, criteria and sub-criteria were brought to each level, sequence and two by two were compared. The comparison was based on the table that suggested by Saaty. In this research at second level 7 criteria and at third level 32 sub-criterions are located in 7 groups. The pair wise comparison of variables were conducted by managers and assistance managers of company X. after pair-wise comparison was finished, we made the matrix which by that matrix the relative weight of elements was calculated. In total, a pair wise comparison matrix is shown as following which a is the prefer element of i to element j. now with having a we can find elements weight.
A= A=
…
Apart from the eigenvector method, there are several methods to find out weights from the pair-wise comparison matrices. Among them the most important are: Least squares Method (Jenson, 1984), Logarithmic Least Squares method (Crawford and Williams, 1985), and approximation methods.
Stage 3: Calculating inconsistency ratio
Continually in AHP we can compute the consistence or inconsistency of decision and then we can judge the acceptance. It is clear that the ratio of the inconsistency is depend on the decision maker. But Saaty suggests 0.1 as an acceptable boundary and believes that if inconsistency ratio is more than 0.1, it is better to revise the decision. In this research inconsistency ratio of pair-wise comparisons are calculated to assure decisions.

Rostamzadeh & Sofian
265
Next, inconsistency ratio for 7Ms, are calculated.
3.1. Wi
7Ms Wi Management 0.165 Manpower 0.143 Marketing 0.285 Material 0.093 Machines 0.041 Method 0.127 Money 0.147
3.2. Estimating W for :
1 1 1.2 4 3 1 1 0.165 1.219
1 1 1.2 3 3 1 1.2 0.143 1.053
2 1.2 1 3 6 3 2 0.285 1.885
A.W = 1.4 1.3 1.3 1 3 1 1 0.093 = 0.664
1.3 1.3 1.6 1.3 1 1.4 1.3 0.041 0.299
1 1 1.3 1 4 1 1 0.127 0.993
1 2 1.2 1 3 1 1 0.147 1.083
3.2.1. Calculating of max:

Rostamzadeh & Sofian
266
3.2.2. Calculating Inconsistency Index
3.2.3. Calculating of Inconsistency Ratio
As it is clear, I.R for this matrix equals to 0.027 that is less than 0.1, so consistency of it is acceptable. Being acceptable of inconsistency index for the matrix is determining by the following table which for this matrix is 1.32 (Rafikul, 2003):
Stage 4: prioritizing
After mentioned above stages, by final calculated scores we can prioritize alternatives and choose the best one.
At last, by the final calculated weight, 7Ms and its elements are prioritized and the results are summarized in the following tables:
Table1. 7Ms prioritizing
n 1 2 3 4 5 6 7 8 9 10 11 12 13 14 I.I.R 0.0 0.0 0.58 0.9 1.12 1.24 1.32 1.41 1.45 1.49 1.51 1.48 1.56 1.57
7M Management Manpower Marketing Material Method Machine Money Final weight 0.272 0.192 0.187 0.045 0.077 0.035 0.193 Grade 1 3 4 6 7 5 2
Rostamzadeh & Sofian
267
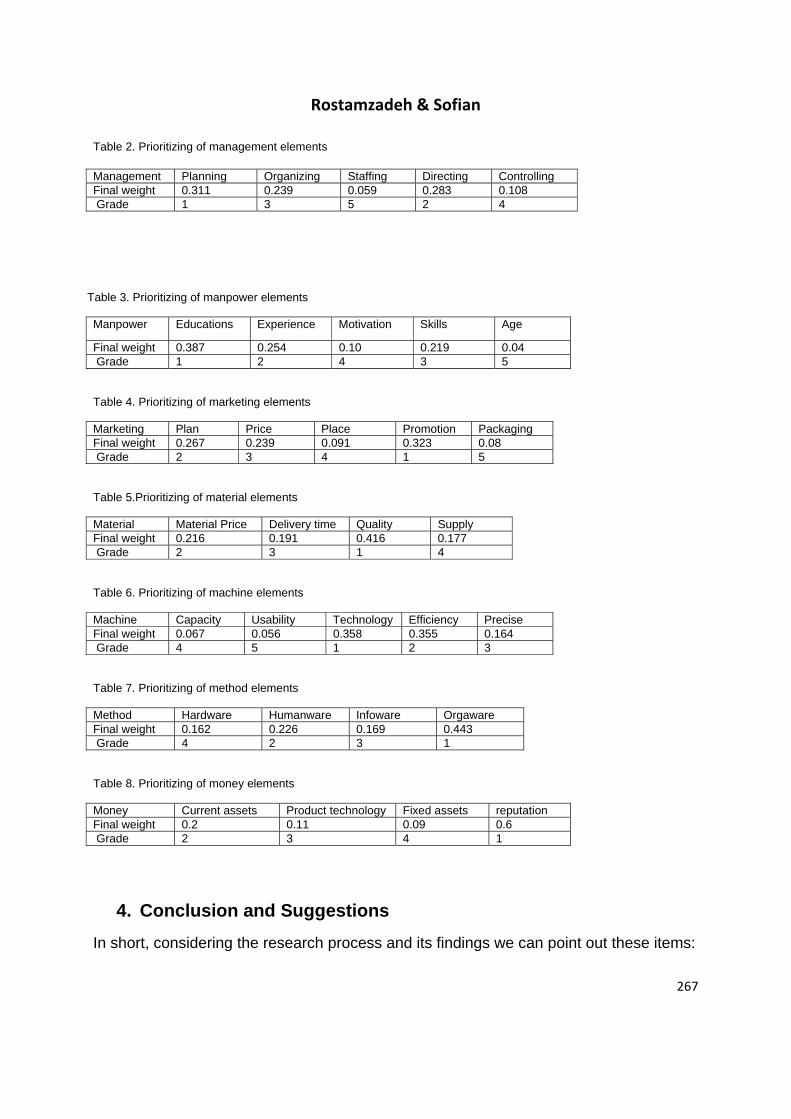
Table 2. Prioritizing of management elements
Table 3. Prioritizing of manpower elements
Manpower Educations Experience Motivation Skills Age
Final weight 0.387 0.254 0.10 0.219 0.04 Grade 1 2 4 3 5
Table 4. Prioritizing of marketing elements
Marketing Plan Price Place Promotion Packaging Final weight 0.267 0.239 0.091 0.323 0.08 Grade 2 3 4 1 5
Table 5.Prioritizing of material elements
Material Material Price Delivery time Quality Supply Final weight 0.216 0.191 0.416 0.177 Grade 2 3 1 4
Table 6. Prioritizing of machine elements
Machine Capacity Usability Technology Efficiency Precise Final weight 0.067 0.056 0.358 0.355 0.164 Grade 4 5 1 2 3
Table 7. Prioritizing of method elements
Method Hardware Humanware Infoware Orgaware Final weight 0.162 0.226 0.169 0.443 Grade 4 2 3 1
Table 8. Prioritizing of money elements
Money Current assets Product technology Fixed assets reputation Final weight 0.2 0.11 0.09 0.6 Grade 2 3 4 1
4. Conclusion and Suggestions
In short, considering the research process and its findings we can point out these items:
Management Planning Organizing Staffing Directing Controlling Final weight 0.311 0.239 0.059 0.283 0.108 Grade 1 3 5 2 4

Rostamzadeh & Sofian
268
1- In this research pair-wise comparison of 7Ms has been done independent in 7 groups by AHP model. So, with taking into account of meaning and concept of each 7Ms which demonstrates the situation of organizational unit (manufacturing or service), from view point of managers and analysts of company X, the most important degree has been allocated to management (0.272)? In the next levels money with (0.193), manpower (0.192), marketing (0.187), methods (0.077), material (0.045) and machines (0.035) have placed.
2- In management groups, the most important degree has been allocated to planning (0.311) and the lowest important degree to staffing (0.059).
3- In manpower groups, the most important degree has been allocated to educations (0.387) and the lowest important degree to age (0.04).
4- In marketing groups, the most important degree has been allocated to promotion (0.323) and the lowest important degree to packaging (0.08).
5- In material groups, the most important degree has been allocated to quality (0.416) and the lowest important degree to supply (0.177).
6- In machines groups, the most important degree has been allocated to machine technology (0.358) and the lowest important degree to usability (0.056).
7- In methods groups, the most important degree has been allocated to orgaware (0.443) and the lowest important degree to hardware (0.162).
8- In money groups, the most important degree has been allocated to reputation (0.6) and the lowest important degree to fix assets (0.09).
Having done our work, interviews were conducted with each one of the population in the field of study. Based on interviews the following results are suggested as research findings:
Management is one of the main parts of production system which following factors are effective to strengthening it:
- Employing managerial appropriate methods - Executing proper suggestion system - Employing inventory control system - Executing quality assurance system(ISO 9000 series) - Benchmarking - Celebrating sessions for solving production problems - Installing of special alarms for preventing happening events - Employing safety principle in job shops - Making suitable work place(cleanness, color, decoration) - Having enough lightness in job shops - Verifying and omitting places causes happening - Flexible organizational structure - Setting goal and choosing appropriate strategies for achieve them - Employing job development in organization as much as it possible - Using job engineering - Using job enrichment - Executing Management Information System(MIS) - Eliminating expected time for materials and parts in job shops

Rostamzadeh & Sofian
269
- Eliminating non-productive works - Creating work teams - Quality Control Cycles(QCC)
Money was found to be a needed investment to production systems playing critical role which can be improved by using following ways:
- Optimum using of company capital - Employing non using goods and changing them to cash - Providing financial resources at right time - Allotting part of profit for new investing and guaranteeing presence at market - Allotting part of profit to purchase new technologies for effective attendance at
competitive market - Allotting part of profit to purchase know-how, recruiting expert manpower and
workers skillfulness educations
Among the 7Ms, human is the only factor which is under mental conditions and response to any motive. Employing, reinforcement and using effectively follow items cause to improve labors performance:
- Workers educations - Job rotation between workers - Training multi-functional employers - Respect to employers - Creating responsibility culture among workers - Examining employers needs and trying to solve the problem - Preparing organizational culture and making it appropriate with organizational
goals - Introducing workers which have high efficiency in organization internal
publication - Manpower planning - Participating organization profit among workers - Improving employers educations - Direct communication between employers and employee for putting forward their
problems - Improving management and workers relations
Marketing has a major role to improve production systems too because if it is not obtained correctly and if product produced cannot be sold at the right time, production system will face with product selling problem. The factors effective on marketing are:
- Formulating policy and customer-driven strategy - To recognize potential market and try to change them to actual one - Satisfying customer and gaining more market place

Rostamzadeh & Sofian
270
- Dividing and locating target markets and providing ways to penetrate them - Survey studies in target markets(voice of customer) - Executing QFD and categorizing customer needs for continuing and remaining at
the market - Creating appropriate mechanism for getting feedback from market, customers
and using them in product - Creating appropriate encouragement and propagatory systems - Good packaging related with product and customer needs - Using after sale service system - Using effective advertisement for producing product - Choosing suitable color for product
It seems that one of the most important factors to improve productivity is work methodology. Because with using different techniques for doing work even as a try and effort, we can find the best and lower cost way. The factors which influence to method are:
- Standardization of work methods ,documentation and - Finding effective activities to produce product and pay attention to them - Omitting excess activities in work methods - Continues improvement of work methods in job shops - Acquiring update information and technologies - Executing different experimental methods and choosing optimum way with
regarding to the feedback - Choosing the method with pay attention to its executing service in inside and
outside of organization - Choosing the method with take notice to the personal experiences of seller - Choosing the method after possibilities studies - Choosing the method with regarding to its role in decreasing cost
Material which is using for making parts and product has an influencing for improving system performance too. Here, we mention some of these factors that have gained from the interview and using references for completing them (Holmberg and Folkeson, 1991), (Lindley, 1988):
- Taking customer needs into notice and converting them into technical specifications
- Attention to the performance and expected cycle life of product - Improving material and parts transportation systems - Supplying the material related in predetermined specifications - Using appropriate containers for preventing damages during transportation - To shorten the paths of material and parts transportation - Holding material with good quality - Omitting non-necessary activities and motions of materials in job shops - Exact determining of Acceptable Quality Level(AQL) for each production part - Formulating materials standard and controlling them - Executing quality control of entering material to the company with regarding to
the formulated standards

Rostamzadeh & Sofian
271
- Improving material quality - Choosing material from the sellers or suppliers which are confident and reputable - Using calibrated equipments for controlling material specifications - Right etiquette in production process
In production system, machine is one of the important elements. With appropriate utilization of machine, one of the main parts of the system can be strengthen and guarantee improving of system performance. Here, we introduce some of the factors which have a major role in machine performance. They are as follow:
- Decreasing set up time of machines and equipments
For doing this, it is better a team made from different experts analysis set up operations and try to use the following instruction in machines set up:
- Separate internal set up from the external( internal set up means that we should switched off the machine in set up time; but external set up doesn’t need to switched off the machine).
- Decrease internal set up time by improving set up time of operations - Decrease internal set up time by improving equipments a little more - Finally , try to decrease set up time to the zero (Yasuhiro, 1991) - Optimum using of machines capacity - Exact planning and controlling of machines work - Right layout causes to omit extra motion and decrease overhead cost - Determining exact time of oiling and servicing machines and calculating parts
failure possibility which causes machines breakdown completely. These help us to recognize failure time of parts and replace before the failure.
- Recovering worn out machinery - Computing machines efficiency and try to increase it - Precise regulation of machines - Decreasing number of machines breakdown times - Actions needed for decreasing amortization factors of machines and equipment - Actions needed for decreasing time of machines using - Safety of machines
By ensuring machines safety, machines wasting time can be avoided.
4.1. Suggestion For Future Research
This research can be developed for follower by:
1- When population including non manufacturing organizations, private and service companies.

Rostamzadeh & Sofian
272
2- Study and comparison of AHP with other multi-attribute evaluation methods such as ELECTRE, DEA, and TOPSIS.
3- Doing the research with fuzzy AHP and comparing the result with classic AHP.
5. References
Bagherpour, Morteza – Ebrahim, Majid, Project weight calculation using AHP with fuzzy criteria, Proceeding of International conference on modeling, simulation & applied optimization, sharjah”, UAE, Feb 2005.
B.C. Van der Wareden, 1969, “Mathematical Statistical”, spring New York.
Crawford, G.B. and Williams, C. 1985, A Note on the Analysis of Subjective Judjment matrics, Journal of Mathematic Psychology, Vol.9, No.3, pp.387-405.
Ghodsipour, S.H, 2001, Analytic Hierarchy Process, Amir Kabir University OF Technology publication.
Holmberg K, Folkeson A, 1991, Operational reliability and systematic maintenance, London, Elsevier Applied Science.
Jenson, R.E. 1982, An Alternative Scaling Method for Priorities in Hierarichical Sructures, Journal of Mathematical Psychology, Vol.28. No. 3, pp. 317-332.
Lindley R Higgins, 1988,” Maintenance engineering handbook”, 4th ed, McGraw-Hill, New York.
Rafikul Islam, 2003, The Analytic Hierarchy Process: an effective multi-criteria decision making tool, International Islamic University Malaysia.
Russell W. Radford and Hamid Noori, 1995,”Production and Operations Management: Total Quality and Responsiveness “, McGraw-Hill.
Saaty, T.L. 1990a, “The Analytic Hierarchy Process”, 2nd ed., RWS Publications, Pittsburgh, PA. Saaty, T.L. 1990b, ``How to make a decision: the analytic hierarchy process'', European Journal of Operational Research, Vol. 48, pp. 9-26.
Taghizadeh, Hooshang, 2001, 7Ms effective on production system performance, journal of Tadbir, Vol. 113, pp. 25-33.
Yasuhiro Monden, 1991, TOYOTA PRODUCTION SYSTEM: An Integrated Approach to Just - In - Time," 2nd ed. (GEORGIA: INDUSTRIAL ENGINEERING), P. 132.

Rostamzadeh & Sofian
273
Appendix Objective of this questionnaire:
Studying importance degree of put forwarded variables (7Ms) as a pair wise comparison which is doing by following table marks.
Numerical amount Preferences 9 Extremely preferred 7 Very strongly preferred 5 Strongly preferred 3 Moderately preferred 1 Equally preferred 2,4,6,8 Preferences between distance
For example:
In following table importance degree of variable A to B is 3(Moderately preferred).
A B C A 1 3 4 B ………. 1 9 C ………. ……… 1
7M
Management
Manpower
Marketing
Material
Method
Machine
Money
Management
1
Manpower
1
Marketing
1
Material
1
Method
1
Machine
1
Money
1

Rostamzadeh & Sofian
274
Table 1: Pair wise comparative questionnaire relative to 7M effective on production system performance
Management Planning
Organizing
Staffing
Directing
Controlling
Planning
1
Organizing
1
Staffing
1
Directing
1
Controlling
1
Table2: Pair wise comparative questionnaire relative to Management
Marketing
Plan
Price
Place
Promotion
Packaging
Plan
1
Price
1
Place
1
Promotion
1
Packaging
1
Table3: Pair wise comparative questionnaire relative to Marketing
Explanation:
Plan: It means product designing, attractiveness, performance (answering customer needs), material and other production considerations.
Manpower
Educations
Experience
Motivation
Skills
Age
Educations
1
Rostamzadeh & Sofian
275
Experience 1 Motivation
1
Skills
1
Age
1
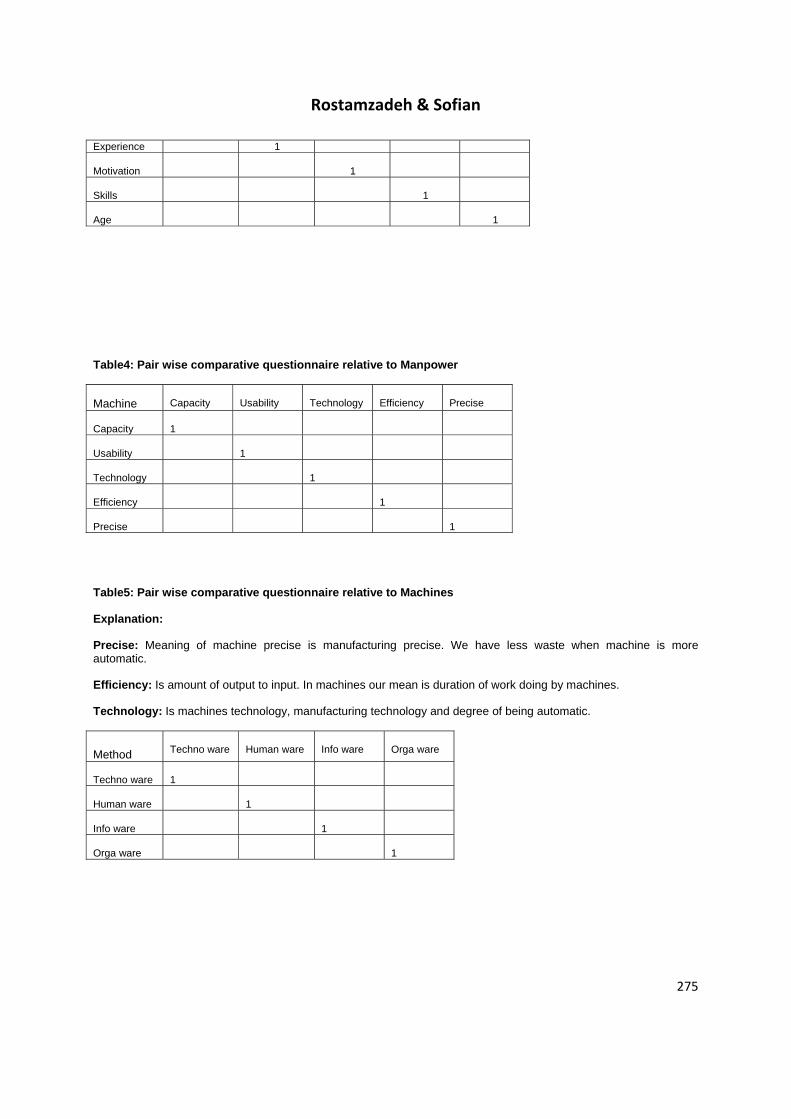
Table4: Pair wise comparative questionnaire relative to Manpower
Machine
Capacity
Usability
Technology
Efficiency
Precise
Capacity
1
Usability
1
Technology
1
Efficiency
1
Precise
1
Table5: Pair wise comparative questionnaire relative to Machines
Explanation:
Precise: Meaning of machine precise is manufacturing precise. We have less waste when machine is more automatic.
Efficiency: Is amount of output to input. In machines our mean is duration of work doing by machines.
Technology: Is machines technology, manufacturing technology and degree of being automatic.
Method
Techno ware
Human ware
Info ware
Orga ware
Techno ware
1
Human ware
1
Info ware
1
Orga ware
1

Rostamzadeh & Sofian
276
Table6: Pair wise comparative questionnaire relative to Method
Explanation:
Hardware: Including equipment, machines, tools, transportation, communication…
Humnanware: Including skills, knowledge, creativity which employing facilities.
Infoware: Including processes, procurement, prescription and communication systems.
Orgaware: Including managerial methods and organizational structure, leading power and creating motivation, decisions optimization, responsibility and finally having commitment to the organizational goals.
Material
Material Price
Delivery Time
Quality
Supply
Material Price
1
Delivery Time
1
Quality
1
Supply
1
Table7: Pair wise comparative questionnaire relative to material
Explanation:
Supply: Our mean is condition of supply and being accessible of material
Money
Current assets
Product Technology
Fixed assets
Reputation
Current assets
1
Product Technology
1
Fixed assets
1

Rostamzadeh & Sofian
277
Reputation 1
Table8: Pair wise comparative questionnaire relative to Money
Explanation:
Current assets: Including any cash and set of assets which in an operational period is expected to be change or to e sell or to be consume. Saving account, bank, receipt documents, receipt accounts, payment in advanced, material inventory, work in process inventory, product inventory.
Product technology: amount of money which company earns from selling special product technology.
Fixed assets: Like goods, equipments that have more than one year useful age and valuable for doing company works. Including land and building, machines, vehicles, official and job shop furniture.
Reputation: The mean is credit which company earn through the products or services that provides to its customer.