priority ranking of skudai river sub...
TRANSCRIPT
PRIORITY RANKING OF SKUDAI RIVER SUB-WATERSHEDS FOR
POTENTIAL FLOOD DAMAGES AND WATER QUALITY PARAMETERS
IRENA BINTI NAUBI
UNIVERSITI TEKNOLOGI MALAYSIA
PRIORITY RANKING OF SKUDAI RIVER SUB-WATERSHEDS FOR
POTENTIAL FLOOD DAMAGES AND WATER QUALITY PARAMETERS
IRENA BINTI NAUBI
A thesis submitted in fulfillment of the
requirements for the award of the degree of
Master of Engineering (Hydraulics and Hydrology)
Faculty of Civil Engineering,
Universiti Teknologi Malaysia
MAY 2016
iii
To these important people in my life:
Azizah binti Ali
Naubi bin Meean
Diana binti Naubi
Muhammad Nasir bin Naubi
Muhamad Shahril bin Mohd. Salleh
What would I do without you? Thank you for EVERYTHING
To my supervisor,
Thank you for helping me in so many ways
iv
ACKNOWLEDGEMENT
I would like to express my sincere appreciation to my supervisor, Dr. Noorul
Hassan Zardari who never fails to guide, help and support me since I started my
Master’s degree. I am grateful and indebted for everything he has taught me. My
sincere thanks also goes to Department of Environment, Department of Irrigation and
Drainage, Department of Statistics and Department of Agriculture for their co-
operation in providing data and information needed in my research. My special thanks
to the thesis external examiner (Dr. Rahmah Elfithri), internal examiner (Assoc. Prof.
Dr. Sharif M. Shirazi) and panel chairman (Dr. Tarmizi Ismail). Their comments and
suggestions on earlier draft of the thesis significantly improved the contents of this
thesis. I acknowledge the sponsors of my research work including Universiti
Teknologi Malaysia support under project vot. 04J98 and MyMaster program from the
Ministry of Higher Education (MOHE). Mom and Dad, thank you for your never-
ending love and support. Sister, you are one of the successful women I look up to,
thank you for being a good example. Nasir, thank you for inspiring me to aim higher
in life. Shahril, thank you for always understanding and encouraging me to achieve my
life goals. Words cannot express how much I appreciate having each and every one of
you in my life. I would also like to extend my appreciation to Ain, Izzati, Rety and
Nang for always motivating me throughout my postgraduate studies. Thank you to
these people who made it so much fun for me to come to the postgraduate office every
day and did our research together: Shikin, Budi, Anis, Jidin, Abang Hairul, Kak
Shakila, Thana and Mimi. Thank you.
v
ABSTRACT
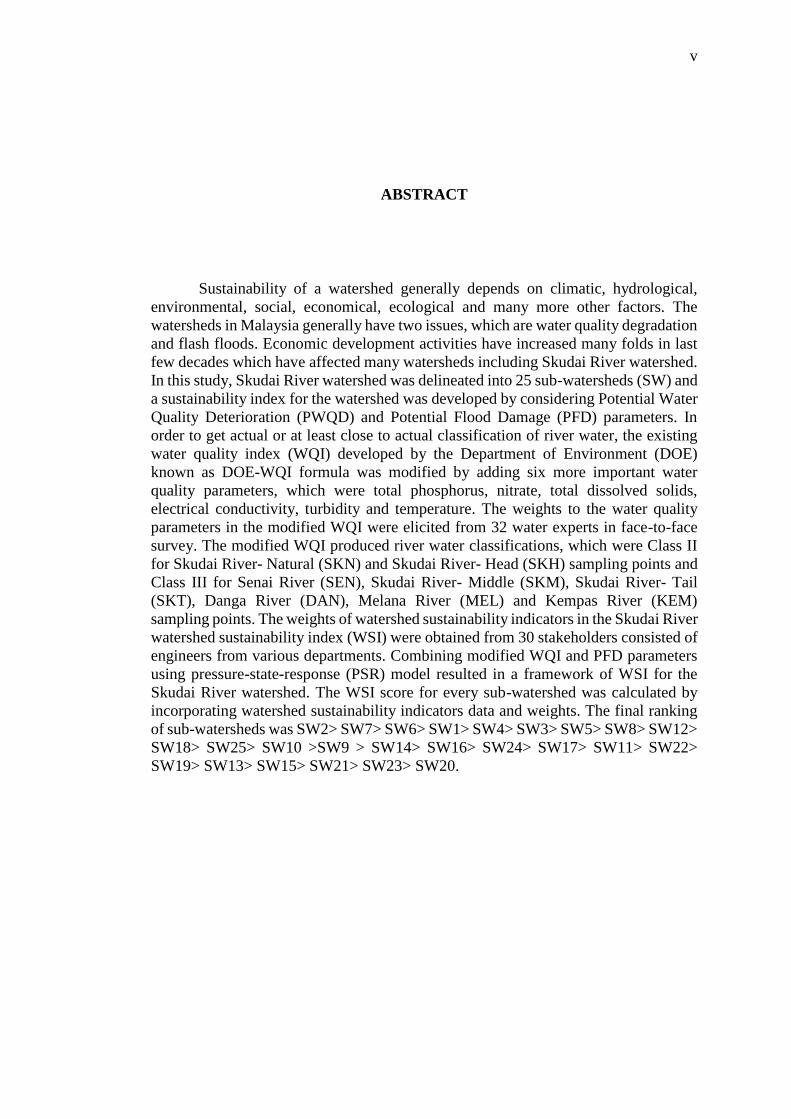
Sustainability of a watershed generally depends on climatic, hydrological,
environmental, social, economical, ecological and many more other factors. The
watersheds in Malaysia generally have two issues, which are water quality degradation
and flash floods. Economic development activities have increased many folds in last
few decades which have affected many watersheds including Skudai River watershed.
In this study, Skudai River watershed was delineated into 25 sub-watersheds (SW) and
a sustainability index for the watershed was developed by considering Potential Water
Quality Deterioration (PWQD) and Potential Flood Damage (PFD) parameters. In
order to get actual or at least close to actual classification of river water, the existing
water quality index (WQI) developed by the Department of Environment (DOE)
known as DOE-WQI formula was modified by adding six more important water
quality parameters, which were total phosphorus, nitrate, total dissolved solids,
electrical conductivity, turbidity and temperature. The weights to the water quality
parameters in the modified WQI were elicited from 32 water experts in face-to-face
survey. The modified WQI produced river water classifications, which were Class II
for Skudai River- Natural (SKN) and Skudai River- Head (SKH) sampling points and
Class III for Senai River (SEN), Skudai River- Middle (SKM), Skudai River- Tail
(SKT), Danga River (DAN), Melana River (MEL) and Kempas River (KEM)
sampling points. The weights of watershed sustainability indicators in the Skudai River
watershed sustainability index (WSI) were obtained from 30 stakeholders consisted of
engineers from various departments. Combining modified WQI and PFD parameters
using pressure-state-response (PSR) model resulted in a framework of WSI for the
Skudai River watershed. The WSI score for every sub-watershed was calculated by
incorporating watershed sustainability indicators data and weights. The final ranking
of sub-watersheds was SW2> SW7> SW6> SW1> SW4> SW3> SW5> SW8> SW12>
SW18> SW25> SW10 >SW9 > SW14> SW16> SW24> SW17> SW11> SW22>
SW19> SW13> SW15> SW21> SW23> SW20.
vi
ABSTRAK
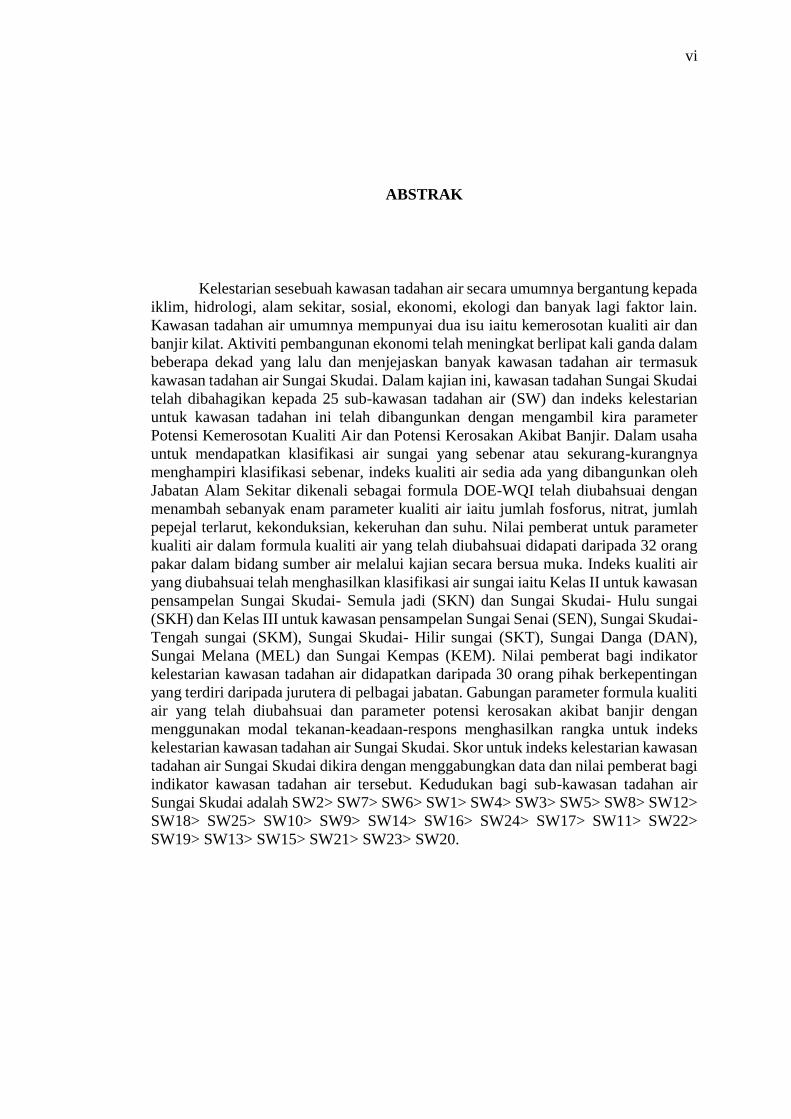
Kelestarian sesebuah kawasan tadahan air secara umumnya bergantung kepada
iklim, hidrologi, alam sekitar, sosial, ekonomi, ekologi dan banyak lagi faktor lain.
Kawasan tadahan air umumnya mempunyai dua isu iaitu kemerosotan kualiti air dan
banjir kilat. Aktiviti pembangunan ekonomi telah meningkat berlipat kali ganda dalam
beberapa dekad yang lalu dan menjejaskan banyak kawasan tadahan air termasuk
kawasan tadahan air Sungai Skudai. Dalam kajian ini, kawasan tadahan Sungai Skudai
telah dibahagikan kepada 25 sub-kawasan tadahan air (SW) dan indeks kelestarian
untuk kawasan tadahan ini telah dibangunkan dengan mengambil kira parameter
Potensi Kemerosotan Kualiti Air dan Potensi Kerosakan Akibat Banjir. Dalam usaha
untuk mendapatkan klasifikasi air sungai yang sebenar atau sekurang-kurangnya
menghampiri klasifikasi sebenar, indeks kualiti air sedia ada yang dibangunkan oleh
Jabatan Alam Sekitar dikenali sebagai formula DOE-WQI telah diubahsuai dengan
menambah sebanyak enam parameter kualiti air iaitu jumlah fosforus, nitrat, jumlah
pepejal terlarut, kekonduksian, kekeruhan dan suhu. Nilai pemberat untuk parameter
kualiti air dalam formula kualiti air yang telah diubahsuai didapati daripada 32 orang
pakar dalam bidang sumber air melalui kajian secara bersua muka. Indeks kualiti air
yang diubahsuai telah menghasilkan klasifikasi air sungai iaitu Kelas II untuk kawasan
pensampelan Sungai Skudai- Semula jadi (SKN) dan Sungai Skudai- Hulu sungai
(SKH) dan Kelas III untuk kawasan pensampelan Sungai Senai (SEN), Sungai Skudai-
Tengah sungai (SKM), Sungai Skudai- Hilir sungai (SKT), Sungai Danga (DAN),
Sungai Melana (MEL) dan Sungai Kempas (KEM). Nilai pemberat bagi indikator
kelestarian kawasan tadahan air didapatkan daripada 30 orang pihak berkepentingan
yang terdiri daripada jurutera di pelbagai jabatan. Gabungan parameter formula kualiti
air yang telah diubahsuai dan parameter potensi kerosakan akibat banjir dengan
menggunakan modal tekanan-keadaan-respons menghasilkan rangka untuk indeks
kelestarian kawasan tadahan air Sungai Skudai. Skor untuk indeks kelestarian kawasan
tadahan air Sungai Skudai dikira dengan menggabungkan data dan nilai pemberat bagi
indikator kawasan tadahan air tersebut. Kedudukan bagi sub-kawasan tadahan air
Sungai Skudai adalah SW2> SW7> SW6> SW1> SW4> SW3> SW5> SW8> SW12>
SW18> SW25> SW10> SW9> SW14> SW16> SW24> SW17> SW11> SW22>
SW19> SW13> SW15> SW21> SW23> SW20.
vii
TABLE OF CONTENTS
CHAPTER TITLE
PAGE
1
2
DECLARATION
DEDICATION
ACKNOWLEDGEMENT
ABSTRACT
ABSTRAK
TABLE OF CONTENTS
LIST OF TABLES
LIST OF FIGURES
LIST OF ABBREVIATIONS
LIST OF APPENDICES
INTRODUCTION
1.1 Introduction
1.2 Background of the Study
1.3 Problem Statement
1.4 Objectives
1.5 Scope of the Study
1.6 Significant of the Study
1.7 Thesis Outline
LITERATURE REVIEW
2.1 Sustainable Management of Watershed
2.2 Index-based Approach
ii
iii
iv
v
vi
vii
xii
xiv
xvi
xviii
1
1
2
4
6
7
7
8
9
9
10
viii
3
2.3 Elements in Watershed Management and WSI
Development
2.3.1 Geographical Information System (GIS)
2.3.1.1 Delineation of Watershed in
Watershed Management
2.3.2 Weighting Methods
2.3.2.1 Pairwise Comparison Method
2.3.2.2 Thermometer Scale Method
2.4 Watershed Sustainability Index (WSI)
2.4.1 Criteria on Indicators Selection in an Index
2.4.2 Potential Flood Damage (PFD)
2.4.3 Potential Water Quality Deterioration
(PWQD)
2.4.3.1 Water Quality Parameters
2.4.3.2 Water Quality Index (WQI)
2.4.3.3 DOE-WQI Formula
2.4.3.4 Limitations of the DOE-WQI
2.5 Priority Ranking Approach for Watershed
Management
2.5.1 MCDM Methods
2.5.2 PROMETHEE Method
2.5.3 Advantages of PROMETHEE Method
MATERIALS AND METHODS
3.1 Introduction
3.2 Study Area
3.3 Application of ArcGIS 10
3.3.1 Watershed Delineation
3.3.2 Topography, Soil Types and Land Use
Data Processing
3.4 Development of WQI
3.4.1 Water Quality Parameters
3.4.2 River Water Sampling
11
11
12
13
14
14
15
18
19
19
20
22
23
25
26
26
26
29
32
32
34
34
35
36
41
41
41
ix
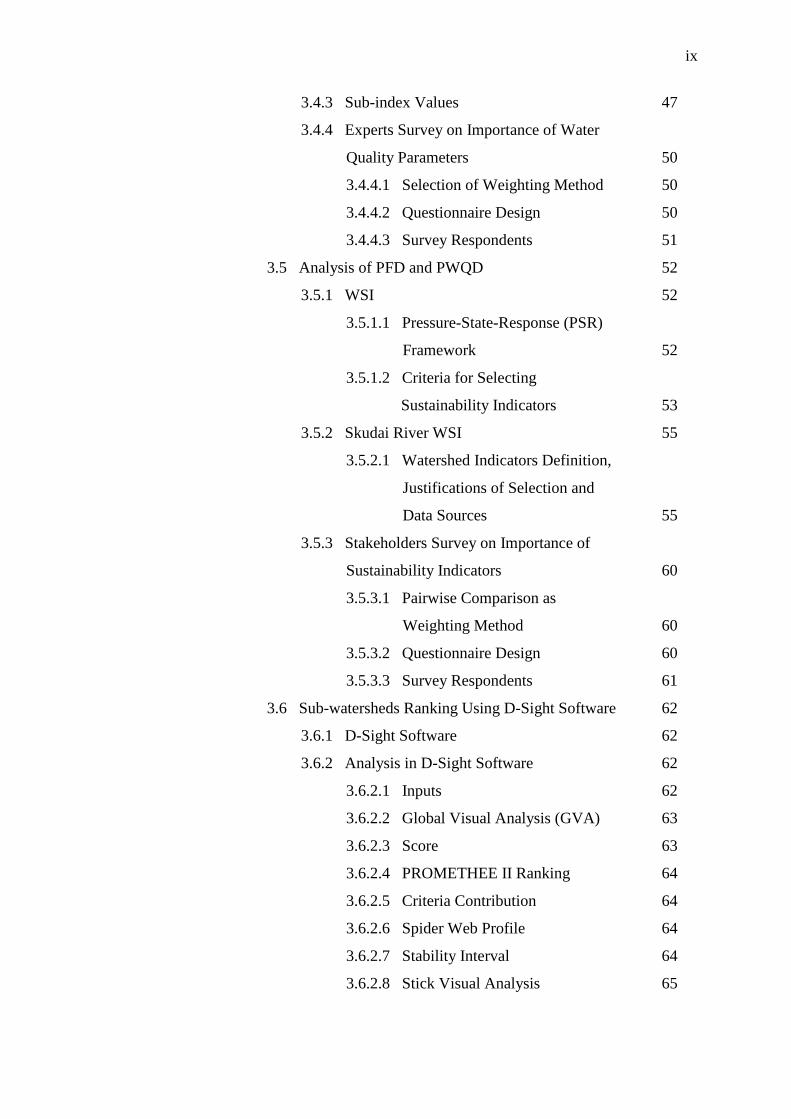
3.4.3 Sub-index Values
3.4.4 Experts Survey on Importance of Water
Quality Parameters
3.4.4.1 Selection of Weighting Method
3.4.4.2 Questionnaire Design
3.4.4.3 Survey Respondents
3.5 Analysis of PFD and PWQD
3.5.1 WSI
3.5.1.1 Pressure-State-Response (PSR)
Framework
3.5.1.2 Criteria for Selecting
Sustainability Indicators
3.5.2 Skudai River WSI
3.5.2.1 Watershed Indicators Definition,
Justifications of Selection and
Data Sources
3.5.3 Stakeholders Survey on Importance of
Sustainability Indicators
3.5.3.1 Pairwise Comparison as
Weighting Method
3.5.3.2 Questionnaire Design
3.5.3.3 Survey Respondents
3.6 Sub-watersheds Ranking Using D-Sight Software
3.6.1 D-Sight Software
3.6.2 Analysis in D-Sight Software
3.6.2.1 Inputs
3.6.2.2 Global Visual Analysis (GVA)
3.6.2.3 Score
3.6.2.4 PROMETHEE II Ranking
3.6.2.5 Criteria Contribution
3.6.2.6 Spider Web Profile
3.6.2.7 Stability Interval
3.6.2.8 Stick Visual Analysis
47
50
50
50
51
52
52
52
53
55
55
60
60
60
61
62
62
62
62
63
63
64
64
64
64
65
x
4
5
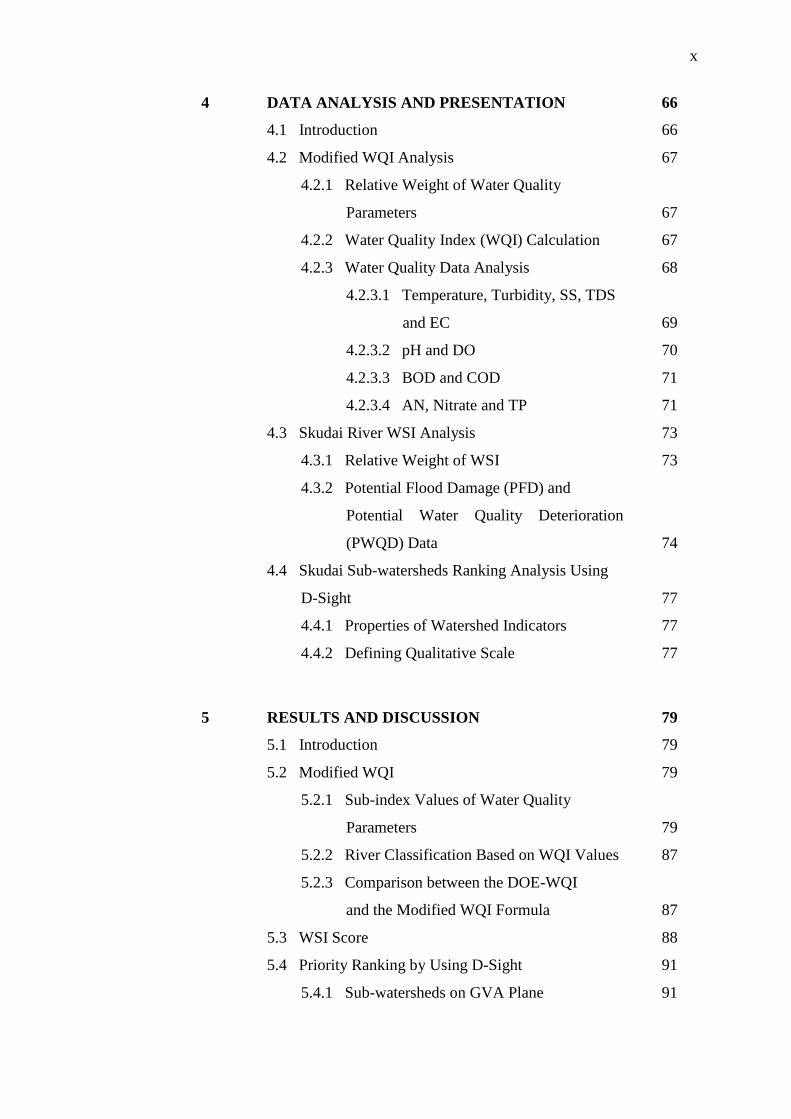
DATA ANALYSIS AND PRESENTATION
4.1 Introduction
4.2 Modified WQI Analysis
4.2.1 Relative Weight of Water Quality
Parameters
4.2.2 Water Quality Index (WQI) Calculation
4.2.3 Water Quality Data Analysis
4.2.3.1 Temperature, Turbidity, SS, TDS
and EC
4.2.3.2 pH and DO
4.2.3.3 BOD and COD
4.2.3.4 AN, Nitrate and TP
4.3 Skudai River WSI Analysis
4.3.1 Relative Weight of WSI
4.3.2 Potential Flood Damage (PFD) and
Potential Water Quality Deterioration
(PWQD) Data
4.4 Skudai Sub-watersheds Ranking Analysis Using
D-Sight
4.4.1 Properties of Watershed Indicators
4.4.2 Defining Qualitative Scale
RESULTS AND DISCUSSION
5.1 Introduction
5.2 Modified WQI
5.2.1 Sub-index Values of Water Quality
Parameters
5.2.2 River Classification Based on WQI Values
5.2.3 Comparison between the DOE-WQI
and the Modified WQI Formula
5.3 WSI Score
5.4 Priority Ranking by Using D-Sight
5.4.1 Sub-watersheds on GVA Plane
66
66
67
67
67
68
69
70
71
71
73
73
74
77
77
77
79
79
79
79
87
87
88
91
91
xi
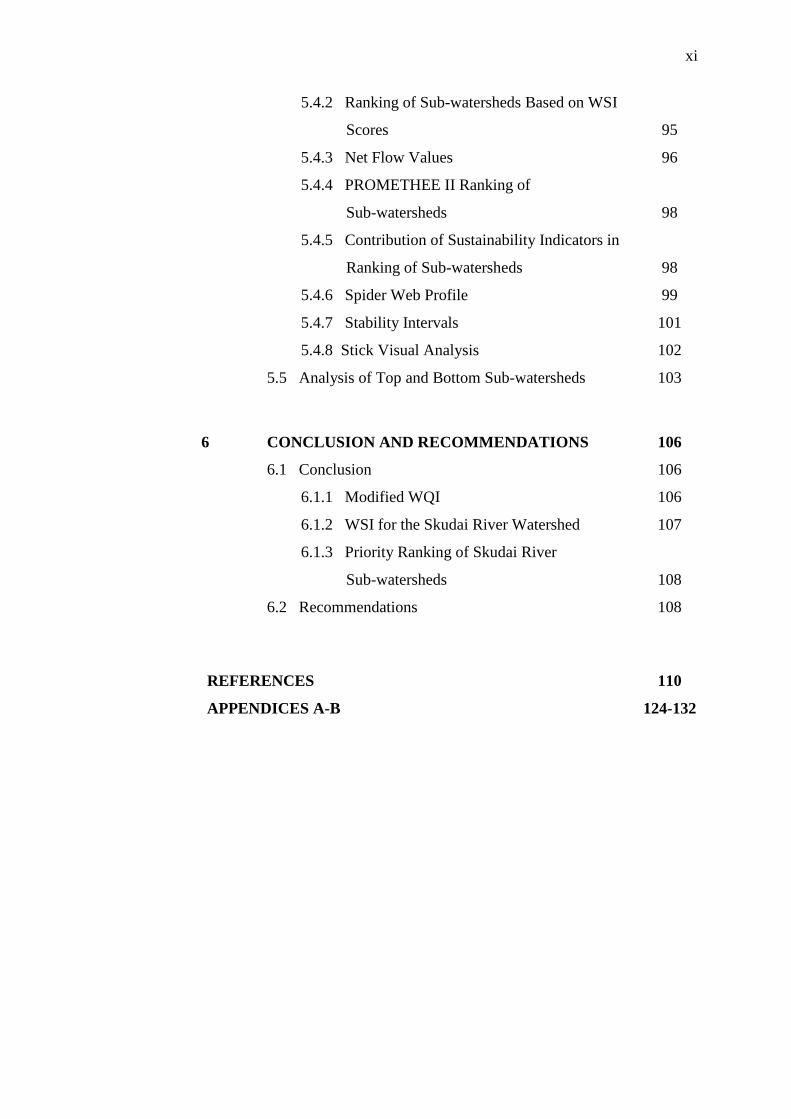
6
5.4.2 Ranking of Sub-watersheds Based on WSI
Scores
5.4.3 Net Flow Values
5.4.4 PROMETHEE II Ranking of
Sub-watersheds
5.4.5 Contribution of Sustainability Indicators in
Ranking of Sub-watersheds
5.4.6 Spider Web Profile
5.4.7 Stability Intervals
5.4.8 Stick Visual Analysis
5.5 Analysis of Top and Bottom Sub-watersheds
CONCLUSION AND RECOMMENDATIONS
6.1 Conclusion
6.1.1 Modified WQI
6.1.2 WSI for the Skudai River Watershed
6.1.3 Priority Ranking of Skudai River
Sub-watersheds
6.2 Recommendations
95
96
98
98
99
101
102
103
106
106
106
107
108
108
REFERENCES
APPENDICES A-B
110
124-132
xii
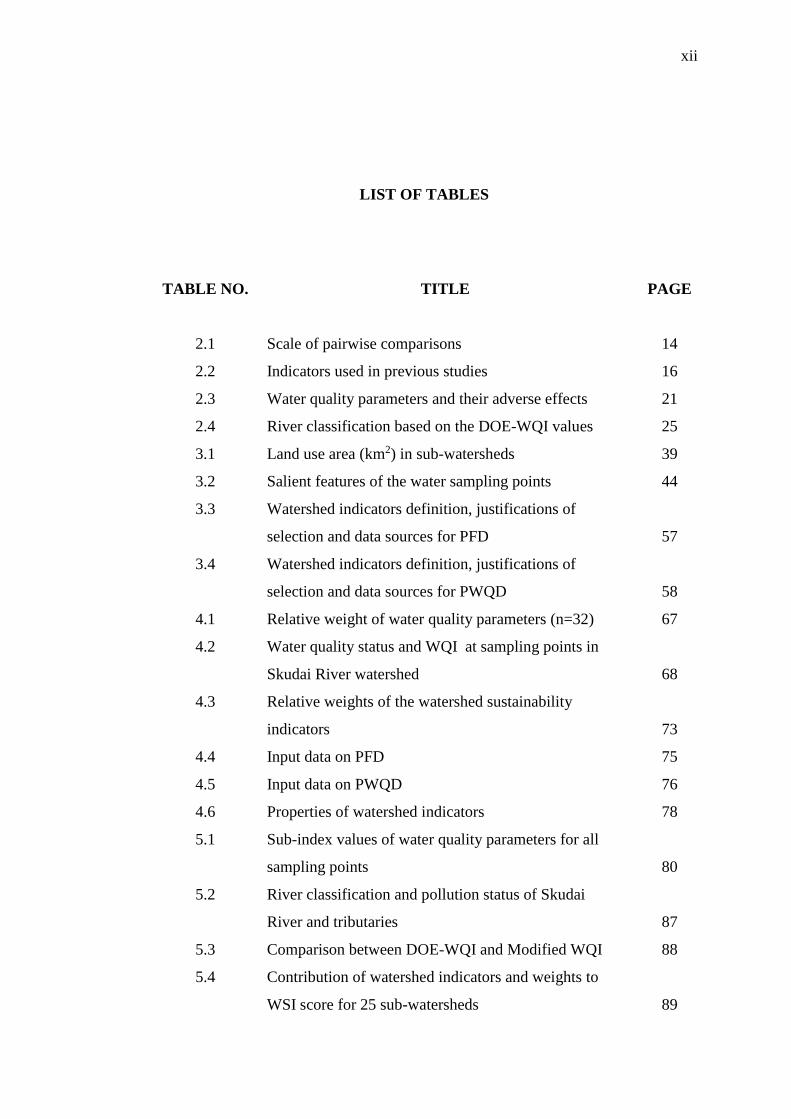
LIST OF TABLES
TABLE NO. TITLE
PAGE
2.1
2.2
2.3
2.4
3.1
3.2
3.3
3.4
4.1
4.2
4.3
4.4
4.5
4.6
5.1
5.2
5.3
5.4
Scale of pairwise comparisons
Indicators used in previous studies
Water quality parameters and their adverse effects
River classification based on the DOE-WQI values
Land use area (km2) in sub-watersheds
Salient features of the water sampling points
Watershed indicators definition, justifications of
selection and data sources for PFD
Watershed indicators definition, justifications of
selection and data sources for PWQD
Relative weight of water quality parameters (n=32)
Water quality status and WQI at sampling points in
Skudai River watershed
Relative weights of the watershed sustainability
indicators
Input data on PFD
Input data on PWQD
Properties of watershed indicators
Sub-index values of water quality parameters for all
sampling points
River classification and pollution status of Skudai
River and tributaries
Comparison between DOE-WQI and Modified WQI
Contribution of watershed indicators and weights to
WSI score for 25 sub-watersheds
14
16
21
25
39
44
57
58
67
68
73
75
76
78
80
87
88
89
xiii
5.5
5.6
5.7
Ranking of sub-watersheds based on WSI score
Net flow values of sub-watershed
Main properties of top 5 and bottom 5 sub-watersheds
96
97
105
xiv
LIST OF FIGURES
FIGURE NO. TITLE
PAGE
1.1
2.1
3.1
3.2
3.3
3.4
3.5
3.6
3.7
3.8
3.9
3.10
3.11
3.12
3.13
3.14
3.15
3.16
3.17
3.18
3.19
3.20
3.21
3.22
PSR Framework
Preference functions in PROMETHEE
Framework of the study
Map of Skudai River watershed
Delineated Skudai River watershed
Topography map of Skudai River watershed
Location of sampling points in the Skudai River watershed
HORIBA multi water quality checker
River water samples
River points at which the water samples were taken
Sub-index rating curve for COD
Sub-index rating curve for BOD
Sub-index rating curve for DO
Sub-index rating curve for AN
Sub-index rating curve for TSS
Sub-index rating curve for pH
Sub-index rating curve for Nitrate
Sub-index rating curve for Turbidity
Sub-index rating curve for TP
Sub-index rating curve for EC
Sub-index rating curve for TDS
Sub-index rating curve for Temperature
Thermometer scale for relative ranking of water quality
parameters
Watershed sustainability indicators for PFD
3
27
33
35
37
38
42
45
45
46
48
48
48
48
48
48
49
49
49
49
49
49
51
56
xv
3.23
3.24
5.1 (a)
5.1 (b)
5.2 (a)
5.2 (b)
5.2 (c)
5.3
5.4
5.5
5.6
5.7
5.8
5.9
5.10
5.11
Watershed sustainability indicators for PWQD
Example of a respondent’s questionnaire answer
Sub-index values for SKN, SKH, SEN and SKM
Sub-index values for MEL, SKT, KEM and DAN
Values of specific water quality parameters for DO,
BOD, COD and AN
Values of specific water quality parameters for SS, pH,
Turbidity and Nitrate
Values of specific water quality parameters for
Temperature, TDS, EC and TP
GVA plane in D-Sight
Example of criterion projection in D-Sight
Projection on decision stick in D-Sight
ROMETHEE II ranking of Sub-watersheds
Contribution of indicators in final ranking of sub-
watersheds
Comparison between top-most ranked sub-watershed
(SW2) and bottom-most sub-watershed (SW20)
Comparison between second-top-most ranked sub-
watershed (SW7) and second-bottom-most sub-
watershed (SW23)
‘Stability intervals’ in D-Sight output
‘Stick Visual Analysis’ in D-Sight (PROMETHEE II)
56
61
81
82
84
85
86
92
94
95
98
99
100
101
102
103
xvi
LIST OF ABBREVIATIONS
AEI Alternative Evaluation Index
APHA American Public Health Association
AN Ammoniacal-nitrogen
BOD Biochemical Oxygen Demand
COD Chemical Oxygen Demand
DAN Danga River
DEM Digital Elevation Model
DO Dissolved Oxygen
DOA Department of Agriculture
DOE Department of Environment
DID Department of Irrigation and Drainage
EC Electrical Conductivity
GIS Geographical Information System
KEM Kempas River
MCDA Multi-criteria Decision Analysis
MCDM Multi-criteria Decision Making
MEL Melana River
NTU Nephelometric Turbidity Units
OECD Organisation for Economic Co-operation and Development
PFD Potential Flood Damage
PROMETHEE Preference Ranking Organization Method
PSD Potential Streamflow Depletion
PWQD Potential Water Quality Deterioration
SEN Senai River
SKH Skudai River (Head)
SKM Skudai River (Middle)
SKN Skudai River (Natural)
xvii
SKT Skudai River (Tail)
SW Sub-watershed
SWAT Soil and Water Assessment Tool
TDS Total Dissolved Solids
TOPSIS Technique for Order of Preference by Similarity to Ideal Solution
TP Total Phosphorus
UNESCO United Nations Educational, Scientific and Cultural Organization
WQI Water Quality Index
WSI Watershed Sustainability Index
xviii
LIST OF APPENDICES
APPENDIX TITLE
PAGE
A
B
Questionnaire on the weighting of the water quality
parameters for developing water quality index (WQI)
in the Skudai River watershed
Questionnaire on the weighting of Skudai River
watershed sustainability index
124
128
CHAPTER 1
INTRODUCTION
1.1 Introduction
The health of a watershed is important for guaranteed water supply with good
quality and usefulness to all water uses such as domestic, industry and agriculture.
For the best evaluation of watershed health, we must understand quantitative and
qualitative indicators that determine the sustainability level of a watershed.
Watershed sustainability index (WSI) is a quantitative output of various
sustainability indicators in a watershed. The index provides a simplified and
multidimensional view of a system (Mayer, 2008). In order to maintain sustainability
of a watershed, decision-makers require timely information on the health of the
watershed. Sustainability indicators and aggregation of these indicators into a single
quantitative unit (i.e. WSI) is increasingly being used by the decision-makers
(Chaves and Alipaz, 2007; Chung and Lee, 2009a; Firdaus et al., 2014; Kim and
Chung, 2014). It is important to emphasize that the WSI is not adequate for
sustainable management of a watershed as additional information unique to each
watershed which is not included in the index is also needed (Hezri and Dovers, 2006;
Ness et al., 2007). Although WSI cannot cover all aspects of the watershed
especially the intangible qualities which are difficult to present in monetary units, it
is useful in providing an initial assessment of the watershed’s health and guides
decision-makers to make better and timely decisions for preventing watersheds from
degradation.
2
A framework can be used to organize indicators. One example of framework
is the pressure-state-response (PSR) which shows relationships between indicators.
Majority of information that determines the sustainability index scores is selected
based on their quantifiable nature, but there are many indicators that are qualitative
(e.g. social values attached to river waters) and are based on the subjectivity factor
(Catano et al., 2009). The qualitative indicators may need to be converted to a
numerical value for determining WSI.
1.2 Background of the Study
Watershed is the area that captures water from various forms and drains it
into common water body such as stream, lake and ocean (DeBarry, 2004). Among
the main functions of watershed are collecting water from sources like rainfall and
snowmelt, storing the water and then discharge it. Most of our activities depend on
watershed thus it is vital to keep our watersheds healthy and sustainable.
Sustainability has been an important concept in watershed managements. The
concept was introduced in Brundtland report that defines sustainability as the
development that meets the needs of the present without compromising the ability of
future generations to meet their own needs (WCED, 1987). Due to rapid
developments and mismanagement, many watersheds all around the world (e.g.,
Chittagong Hill Tracts in Bangladesh (Biswas et al., 2012), Yangtze River Basin in
China (Cui et al., 2012) and Bernam Watershed in Malaysia (Alansi et al., 2009)) are
undergoing degradation and this causes problems such as the reduction of the
quantity as well as the quality of water resources and deterioration of natural
resources. Noticing the watershed problems that bring so much loss to human and the
environment, many studies have been done to devise effective watershed
managements that can prevent and mitigate the problems related to watersheds
(Agostinho et al., 2010; Curtis et al., 2002; Strager et al., 2010; Richardson et al.,
2011; Qi and Altinakar, 2011).
Proper management of a watershed needs a complete understanding of the
current watershed conditions. A prominent way in evaluating the condition of
3
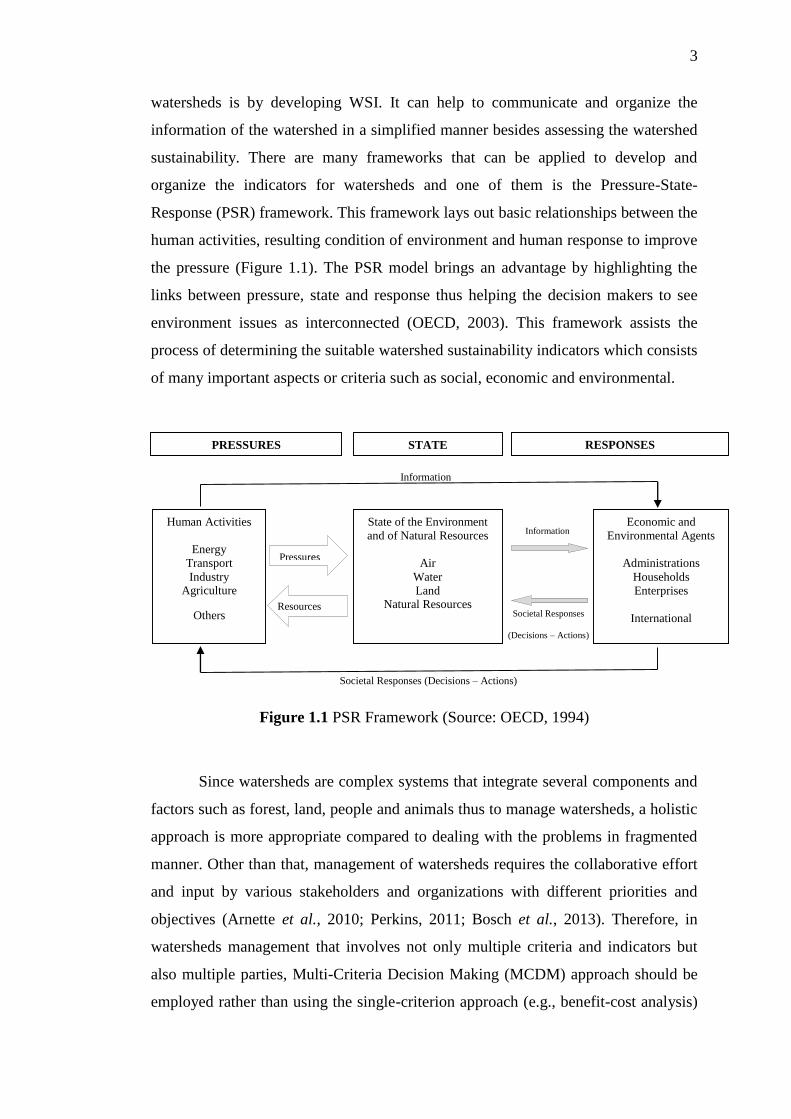
watersheds is by developing WSI. It can help to communicate and organize the
information of the watershed in a simplified manner besides assessing the watershed
sustainability. There are many frameworks that can be applied to develop and
organize the indicators for watersheds and one of them is the Pressure-State-
Response (PSR) framework. This framework lays out basic relationships between the
human activities, resulting condition of environment and human response to improve
the pressure (Figure 1.1). The PSR model brings an advantage by highlighting the
links between pressure, state and response thus helping the decision makers to see
environment issues as interconnected (OECD, 2003). This framework assists the
process of determining the suitable watershed sustainability indicators which consists
of many important aspects or criteria such as social, economic and environmental.
Figure 1.1 PSR Framework (Source: OECD, 1994)
Since watersheds are complex systems that integrate several components and
factors such as forest, land, people and animals thus to manage watersheds, a holistic
approach is more appropriate compared to dealing with the problems in fragmented
manner. Other than that, management of watersheds requires the collaborative effort
and input by various stakeholders and organizations with different priorities and
objectives (Arnette et al., 2010; Perkins, 2011; Bosch et al., 2013). Therefore, in
watersheds management that involves not only multiple criteria and indicators but
also multiple parties, Multi-Criteria Decision Making (MCDM) approach should be
employed rather than using the single-criterion approach (e.g., benefit-cost analysis)
Information
Information
Societal Responses
(Decisions – Actions)
PRESSURES STATE RESPONSES
Human Activities
Energy
Transport
Industry Agriculture
Others
State of the Environment
and of Natural Resources
Air
Water
Land Natural Resources
Economic and
Environmental Agents
Administrations
Households
Enterprises
International
Pressures
Resources
Societal Responses (Decisions – Actions)
4
(Chang et al., 2008; Trenholm et al., 2013). MCDM approach consists of several
methods (e.g., ELECTRE, PROMETHEE and Evamix Method) where each has
different procedures (Corrente et al., 2014; Darji and Rao, 2013; Rogers, 1999). The
interest of decision-makers and researchers in solving watersheds problems by using
MCDM approach has grown rapidly over the years (Biswas et al., 2012; Chung and
Lee, 2009a; Hermans et al., 2007). It is widely used because it can consider different
alternatives on various criteria for selecting the best or the suitable alternative
management strategy.
1.3 Problem Statement
Malaysia is rich in water resources with the annual rainfall ranges from 1800
mm to 2600 millimetres, which is above the global average of annual rainfall of 1123
millimetres (Adnan et al., 2002; Legates and Willmott, 1990). However, the richness
in water resource does not guarantee that watersheds in Malaysia are healthy and safe
from deterioration. Watersheds in Malaysia are affected by increasing rates of
urbanization and industrialization. Many environmental problems (e. g. river water
pollution, flooding, river sedimentation and water shortage) have already been
witnessed in some regions of the country. From the assessment of the river water
quality by the Department of Environment (DOE), it was found that 18 river basins
were polluted, 46 were slightly polluted and 79 were clean (DOE, 2007). Actions
should be taken to improve quality of the polluted and slightly polluted rivers as well
as maintaining the quality of clean rivers in Malaysia. Another major problem that
should be addressed is flooding. Having tropical and humid climate with heavy rain,
some of the areas in Malaysia are prone to flooding and this causes enormous loss
(e.g. humans’ lives, economy, health and environment) and the problem is worsen by
having flash floods due to rapid developments in most cities in the country. The 2007
floods in Johor caused 18 deaths and USD 489 million in damage and the floods in
2008 killed 28 people and caused damage estimated at USD 21.19 million (Chan,
2012).
5
Skudai River watershed is in danger as it faces rapid development activities
in areas such as Kulai, Senai, Tampoi and Johor Bahru City. The major problems
identified in Skudai River watershed are polluted rivers and flooding (Chin and Goh,
1981; DOE, 2007; Salarpour, 2010). Two rivers in the Skudai River watershed (i.e.
Skudai and Melana rivers) were classified as slightly polluted by the DOE. Without
immediate action, the rivers might be more polluted as the population and
urbanization levels increase. Besides that, some areas in Skudai River watershed are
prone to flooding. These problems should not be left without any actions to solve
them. Skudai River watershed needs some drastic measures of rehabilitation.
Rehabilitating a watershed costs hundreds of millions Ringgit Malaysia and the cost
will increase if the problems in the watersheds are more critical. However,
rehabilitation without proper watershed management may cause the watershed
problems to arise again in future.
In this study, Skudai River watershed was delineated into 25 sub-watersheds
based on topography characteristics for better investigation and identification of
more vulnerable areas by using ArcGIS 10. The development of watershed
sustainability index for the Skudai River watershed is proposed by using PSR
framework. Employing PSR framework is useful to determine the suitable watershed
indicators for gaining the information about the watershed. Realizing the importance
of integration approach, the sustainability indicators are developed based on several
aspects that can be linked to the problems in the Skudai River watershed such as
hydrology and environmental. The watershed sustainability indicators were
categorized into two main components which were PFD and PWQD. From the
indicators that were selected in this study, data for the indicators were acquired from
respective departments and authorities.
Since there were many watershed sustainability indicators involved, short-
listing of the indicators was performed from literature review and the Malaysian
watershed conditions and environment. As all the indicators were not of equal
importance for determining sustainability level of the watershed, an expert opinion
survey of 30 experts was conducted to get relative importance weights of the
sustainability indicators. Obtaining the relative importance weights of the
6
sustainability indicators involved many steps including the selection of suitable
weighting method, the mode of survey, the survey participants, the survey sample
size and the suitable survey data analysis tool. Besides that, from previous studies, it
was found that one of the ways to effectively manage a watershed was prioritizing
sub-watersheds so that more vulnerable sub-watersheds could be easily identified
and immediate actions can be initiated. The identification of more vulnerable areas
within a watershed could save resources and fast rehabilitation measures could be
adopted. Thus, in this study, all the sub-watersheds were ranked by using the
PROMETHEE through the D-Sight software (Yu et al., 2013).
1.4 Objectives
The purpose of this study is to develop a priority ranking of Skudai River
sub-watershed based on PFD and PWQD by considering suitable watershed
indicators and stakeholders’ preferences on those sustainability indicators. The
specific objectives of the study are as follows:
i. To modify DOE-WQI for the Skudai River and tributaries for assessing
accurate water quality status in the river.
ii. To identify the problematic areas affected by land use patterns in Skudai
River sub-watersheds for priority rehabilitation measures in the watershed.
iii. To know experts’ preferences on flood damages and water quality parameters
in a pairwise comparison method.
iv. To assess the sustainability level of the Skudai River sub-watersheds from
flood damage and water quality parameters.
7
1.5 Scope of the Study
This study is limited to Skudai River watershed. The watershed sustainability
indicators developed were filtered by several criteria as suggested in literature to
avoid unmanageable number of indicators. Since the duration for this study was
limited to maximum three years, one criterion was more important compared to the
others was the availability of data. Therefore, the sustainability indicators that either
were not available with respective departments or require more time and resources
(human as well as financial resources) to collect were not incorporated in the WSI.
The WSI was also limited to hydrology and environment aspects only.
PROMETHEE was selected for developing priority ranking of sub-watersheds in the
Skudai River watershed. D-Sight software was employed to analyse watershed
problems more efficiently. The expert opinion survey was completed from 30
respondents but the selection of the respondents was not done blindly as the
respondents who are experts in watershed management would provide a fair and
quality response. Despite all the limitations, the study can still have extensive
supporting material for high reliability in the results and the study conclusions.
1.6 Significant of the Study
This study is significant because the results produced can bring contributions
to watershed management and hydrological field in Malaysia. Development of WSI
is seen as an effective method to manage a watershed. It can assist us in finding the
factors that are contributing to watershed problems before taking appropriate actions
to lessen the effects. The WSI can also be developed for other watersheds but we
must be aware that different watersheds may require different sets of watershed
indicators to comprehensively understand the watershed. Sustainability indicators
developed in this study can provide a reference to other researchers where they can
refer to the Skudai River WSI before developing the suitable watershed indicators for
the watershed that they want to investigate.
8
Priority ranking of Skudai River sub-watersheds according to PWQD and
PFD would help the watershed management authority and watershed managers to
know the problematic sub-watersheds thus management strategies can be focused on
them on priority basis. It can definitely contribute to an effective watershed
management. Other than that, this study can be an example of integrated watershed
management (as required by the government) because all the possible indicators that
can contribute to the watershed problems were taken into account. It also includes
many departments and local authority for obtaining watershed related data for the
Skudai River watershed.
1.7 Thesis Outline
Chapter 1 gives the general overview of the study by briefly introducing the
concept of watershed management, WSI, PSR framework and MCDM approach. The
study objectives and scope are also provided in this chapter. Chapter 2 discusses the
literature review which comprises sub-topics such WSI, WQI, PWQD, PFD and
MCDM methods. Chapter 3 describes the methodology of the study. Steps in
achieving study objectives including delineation of the Skudai River watershed by
using ArcGIS 10, river water sample collection, questionnaire design and survey
administration in field are discussed in this chapter. Chapter 4 discusses the data
analysis of river water quality and the WSI. The weights on water quality parameters
and watershed sustainability indicators are shown in this chapter. Chapter 5 provides
in-depth discussion on the study findings. It comprises the results and discussion of
water quality and WQI of Skudai River and its tributaries. The results of WSI score
and sub-watersheds ranking generated from the D-Sight software application are also
discussed in chapter 5. The study conclusion and recommendations are given in
Chapter 6.
REFERENCES
Abbasi, T. and Abbasi, S. A. (2012). Water Quality Indices. (1st edition). Amsterdam:
Elsevier.
Adinarayana, J., Krishna, N. R. and Rao, K. G. (1995). An Integrated Approach for
Prioritization of Watersheds. Journal of Environmental Management, 44, 375-
384.
Adnan, N. A., Loneragan, N. and Connolly, R. (2002). Variability of and the Influence
of Environmental Factors on the Recruitment of Postlarval and Juvenile
Penaeus Merguiensis in the Matang Mangroves of Malaysia. Marine Biology,
141(2), 241-251.
Agostinho, F., Ambrosio, L. A. and Ortega, E. (2010). Assessment of a Large
Watershed in Brazil Using Emergy Evaluation and Geographical Information
System. Ecological Modelling, 221, 1209-1220.
Aher, P. D., Adinarayana, J. and Gorantiwar, S. D. (2013). Prioritization of Watersheds
Using Multi-Criteria Evaluation Through Fuzzy Analytical Hierarchy Process.
Agricultural Engineering International CIGR Journal, 15, 11-18.
Aisien, F. A., Aisien, E. T. and Shaka, F. (2003). The Effects of Rubber Factory
Effluent on Ikpoba River. Journal of Biomedical Engineering, 2, 32-35.
Al-Badaii, F., Shuhaimi-Othman, M. and Gasim, M. B. (2013). Water Quality
Assessment of the Semenyih River, Selangor, Malaysia. Journal of Chemistry,
2013, 1-10.
Alansi, A. W., Amin, M. S., Halim, G. A., Shafri, H. Z. and Aimrun, W. (2009).
Validation of SWAT Model for Stream Flow Simulation and Forecasting in
Upper Bernam Humid Tropical River Basin, Malaysia. Hydrology and Earth
System Sciences Discussions, 6, 7581-7609.
APHA (2005). Standard Methods for the Examination of Water and Waste Water.
Washington DC: American Public Health Association.
111
Arnette, A., Zobel, C., Bosch, D., Pease, J. and Metcalfe, T. (2010). Stakeholder
Ranking of Watershed Goals with the Vector Analytic Hierarchy Process:
Effects of Participant Grouping Scenarios. Environmental Modelling &
Software, 25, 1459-1469.
Athawale, V. M. and Chakraborty, S. (2010). Facility Location Selection Using
PROMETHEE II Method. Proceeding of the 2010 International Conference
on Industrial Engineering and Operations Management. 9-10 January.
Bangladesh, 1-5.
Avvannavar, S. M. and Shrihari, S. (2008). Evaluation of Water Quality Index for
Drinking Purposes for River Netravathi, Mangalore, South India.
Environmental Monitoring and Assessment, 143, 279-290.
Aweng, E. R., Ismid, M. S. and Maketab, M. (2011). The Effects of Land Use on
Physicochemical Water Quality at Three Rivers in Sungai Endau Watershed,
Kluang, Johor, Malaysia. Australian Journal of Basic and Applied Sciences, 5,
923-932.
Badar, B., Romshoo, S. A. and Khan, M. A. (2013). Integrating Biophysical and
Socioeconomic Information for Prioritizing Watersheds in a Kashmir
Himalayan Lake: A Remote Sensing and GIS Approach. Environmental
Monitoring and Assessment, 185, 6419-6445.
Baloch, M. A. and Tanik, A. (2008). Development of an Integrated Watershed
Management Strategy for Resource Conservation in Balochistan Province of
Pakistan. Desalination, 226, 38-46.
Biswas, S., Vacik, H., Swanson, M. E. and Haque, S. M. (2012). Evaluating Integrated
Watershed Management Using Multiple Criteria Analysis: A Case Study at
Chittagong Hill Tracts in Bangladesh. Environmental Monitoring and
Assessment, 184, 2741-2761.
Bosch, N. S., Allan, J. D., Selegean, J. P. and Scavia, D. (2013). Scenario-Testing of
Agricultural Best Management Practices in Lake Erie Watersheds. Journal of
Great Lakes Research, 39, 429-436.
Boyacioglu, H. (2007). Development of a Water Quality Index Based On a European
Classification Scheme. Water SA, 33, 101-106.
Brans, J. P. and Vincke, P. (1985). A Preference Ranking Organization Method, the
PROMETHEE Method. Management Science, 31, 647-656.
112
Brans, J. P. and Mareschal, B. (2005). PROMETHEE Methods. In Figueira, J. R.,
Greco, S. and Ehrgott, M. (Eds.) Multiple Criteria Decision Analysis: State of
the Art Survey. (112-131). New York, USA: Springer.
Brown, R. M., McClelland, N. I., Deininger, R. A. and O’Connor, M. F. (1972). A
Water Quality Index-Crashing the Psychological Barrier. In Thomas, W. A.
(Ed.) Indicators of Environmental Quality (787-794). New York: Pergamon
Press.
Cai, X., McKinney, D. C. and Lasdon, L. S. (2003). Integrated Hydrologic-
Agronomic-Economic Model For River Basin Management. Journal of Water
Resource Planning and Management, 129, 4-17.
Calizaya, A., Meixner, O., Bengtsson, L. and Berndtsson, R. (2010). Multicriteria
Decision Analysis (MCDA) for Integrated Water Resources Management
(IWRM) in the Lake Poopo Basin, Bolivia. Water Resources Management, 24,
2267-2289.
Catano, N., Marchand, M., Staley, S. and Wang, Y. (2009). Development and
Validation of the Watershed Sustainability Index (WSI) for the Watershed of
the Reventazón River. Technical Report. COMCURE.
Chan, N. W. (2012). Impacts of Disasters and Disasters Risk Management in
Malaysia: The Case of Flood.’ In Sawada, Y. and Oum, S. (Eds.) Economic
and Welfare Impacts of Disasters in East Asia and Policy Responses (503-551).
Jakarta: ERIA.
Chang, N. B., Parvathinathan, G. and Breeden, J. B. (2008). Combining GIS with
Fuzzy Multicriteria Decision-Making for Landfill Siting in a Fast-Growing
Urban Region. Journal of Environmental Management, 87, 139-153.
Chaves, H. M. and Alipaz, S. (2007). An Integrated Indicator Based on Basin
Hydrology, Environment, Life, and Policy: The Watershed Sustainability
Index. Water Resources Management, 21(5), 883-895.
Chin, K. K. and Goh, T. N. (1981). Water Quality Management of Skudai River. Water
Resources Bulletin, 17(2), 203-208.
Chowdary, V. M., Chakraborthy, D., Jeyaram, A., Murthy, Y. V. N., Sharma, J. R. and
Dadhwal, V. K. (2013). Multi-Criteria Decision Making Approach for
Watershed Prioritization Using Analytic Hierarchy Process Technique and
GIS. Water Resources Management, 27, 3555-3571.
113
Christensen, V. G., Lee, K. E., McLees, J. M. and Niemela, S. L. (2012). Relations
between Retired Agricultural Land, Water Quality, and Aquatic-Community
Health, Minnesota River Basin. Journal of Environmental Quality, 41, 1459-
1472.
Chung, E. S. and Lee, K. S. (2009a). Prioritization of Water Management for
Sustainability Using Hydrologic Simulation Model and Multi-Criteria
Decision Making Techniques. Journal of Environmental Management, 90(3),
1502-1511.
Chung, E. S. and Lee, K. S. (2009b). Identification of Spatial Ranking of Hydrological
Vulnerability Using Multi-Criteria Decision Making Techniques: Case Study
of Korea. Water Resources Management, 23, 2395-2416.
Cleophas, F., Isidore, F., Han, L. K. and Bidin, K. (2013). Water Quality Status of
Liwagu River, Tambunan, Sabah, Malaysia. Journal of Tropical Biology and
Conservation, 10, 67-73.
Coleman, T. and Niekerk, A. V. (2007). Orange River Integrated Water Resources
Management Plan- Water Quality in the Orange River. Technical Report.
Orange Senqu River Commission (ORASECOM).
Corrente, S., Figueira, J. R. and Greco, S. (2014). The SMAA-PROMETHEE Method.
European Journal of Operational Research, 239, 514-522.
Cruz, R. V. (1999). Integrated Land Use Planning and Sustainable Watershed
Management. Journal of Philippine Development, 47, 27-49.
Cude, C. G. (2001). Oregon Water Quality Index: A Tool for Evaluating Water Quality
Management Effectiveness. Journal of the American Water Resources
Association, 37, 125-137.
Cui, X., Liu, S. and Wei, X. (2012). Impacts of Forest Changes on Hydrology: A Case
Study of Large Watersheds in the Upper Reaches of Minjiang River Watershed
in China. Hydrology and Earth System Sciences, 16, 4279-4290.
Curtis, A., Shindler, B. and Wright, A. (2002). Sustaining Watershed Initiatives:
Lessons From Landcare and Watershed Councils. Journal of the American
Water Resources Association, 38(5), 1207-1216.
Dagdeviren, M. (2008). Decision Making in Equipment Selection: An Integrated
Approach with AHP and PROMETHEE. Journal of Intelligent Manufacturing,
19, 397-406.
114
Dai, T. and Labadie, J. W. (2001). River Basin Network Model for Integrated Water
Quantity/Quality Management. Journal of Water Resources Planning and
Management, 127, 295-305.
Darji, V. P. and Rao, R. V. (2013). Application of AHP/EVAMIX Method for
Decision Making in the Industrial Environment. American Journal of
Operations Research, 3, 542-569.
Davis, A. P. and McCuen, R. H. (2005). Storm Water Management for Smart Growth.
(1st edition). US: Springer.
DeBarry, P. A. (2004). Watersheds: Processes, Assessment and Management. (1st
edition). Hoboken, N.J.: John Wiley.
DOE (1986). Classification of Malaysian Rivers. Malaysia: Department of
Environment Malaysia.
DOE (2007). Malaysia Environmental Quality Report 2006. Technical Report.
Department of Environment Malaysia.
Eckenrode, R. T. (1965). Weighting Multiple Criteria. Management Science, 12, 180-
192.
EEA (1999). Environmental Indicators: Typology and Overview. Report. European
Environment Agency.
Effendi H. (2003). Water Quality Analysis for Aquatic Resources Management.
Yogyakarta: Kanisius.
Effendi, H., Romanto and Wardiatno, Y. (2015). Water Quality Status of
Ciambulawung River, Banten Province, Based on Pollution Index and
NSFWQI. Procedia Environmental Sciences, 24, 228-237.
ESCAP (2004). Guidelines on Strategic Planning and Management of Water
Resources. (1st edition). New York: United Nations Publication.
Firdaus, R., Nakagoshi, N. and Idris, A. (2014). Sustainability Assessment of Humid
Tropical Watershed: A Case of Batang Merao Watershed, Indonesia. Procedia
Environmental Sciences, 20, 722-731.
Fulazzaky, M. A., Teng, W. S. and Masirin, M. I. (2010). Assessment of Water Quality
Status for the Selangor River in Malaysia. Water, Air and Soil Pollution, 205,
63-77.
Gandaseca, S., Rosli, N., Ngayop, J. and Arianto, C. I. (2011). Status of Water Quality
Based On the Physico-Chemical Assessment on River Water at Wildlife
115
Sanctuary Sibuti Mangrove Forest, Miri Sarawak. American Journal of
Environmental Sciences, 7, 269-275.
Gazzaz, N. M., Yusoff, M. K., Aris, A. Z. and Juahir, H. (2015). Artificial Neural
Network Modeling of the Water Quality Index for Kinta River (Malaysia)
using Water Quality Variables as Predictors. Marine Pollution Bulletin, 64,
2409-2420.
Gellis, A. C., Cheama, A. and Lalio, S. M. (2001). Developing an Approach for
Ranking Watershed for Rehabilitation, Zuni Indian Reservation, New Mexico.
Geomorphology, 37, 105-134.
Giri, S., Nejadhashemi, A. P. and Woznicki, S. A. (2012). Evaluation of Targeting
Methods for Implementation of Best Management Practices in the Saginaw
River Watershed. Journal of Environmental Management, 103, 24-40.
Giriyappanavar, B. S. and Patil, R. R. (2013). Application of CCME WQI in Assessing
Water Quality of Fort Lake of Belgaum, Karnataka. Indian Journal of Applied
Research, 3, 32-33.
Goicoechea, A., Stakhiv, E. Z. and Li, F. (1992). Experimental Evaluation of Multiple
Criteria Decision Models for Application to Water Resources Planning. Water
Resources Bulletin, 28, 89-102.
Guimaraes, L. T. and Magrini, A. (2008). A Proposal of Indicators for Sustainable
Development in the Management of River Basins. Water Resources
Management, 22, 1191-1202.
Hajkowicz, S. A., McDonald, G. T. and Smith, P. N. (2000). An Evaluation of Multiple
Objective Decision Support Weighting Techniques in Natural Resource
Management. Journal of Environmental Planning and Management, 43, 505-
518.
Hayez, Q., Smet, Y. D. and Bonney, J. (2011). D-Sight: A New Decision Support
System to Address Multi-Criteria Problems. Technical Report. CoDE-SMG,
Universite Libre de Bruxelles.
Hermans, C., Erickson, J., Noordewier, T., Sheldon, A. and Kline, M. (2007).
Collaborative Environmental Planning in River Management: An Application
of Multicriteria Decision Analysis in the White River Watershed in Vermont.
Journal of Environmental Management, 84, 534-546.
116
Hezri, A. A. and Dovers. S. R. (2006). Sustainability Indicators, Policy and
Governance: Issues for Ecological Economics. Ecological Economics, 60, 86-
99.
Hlaing, K. T., Haruyama, S. and Aye, M. M. (2008). Using GIS-Based Distributed
Soil Loss Modeling and Morphometric Analysis to Prioritize Watershed for
Soil Conservation in Bago River Basin of Lower Myanmar. Frontiers of Earth
Science in China, 2, 465-478.
Hossain, M. A., Sujaul, I. M. and Nasly, M. A. (2013). Water Quality Index: An
Indicator of Surface Water Pollution in Eastern Part of Peninsular Malaysia.
Research Journal of Recent Sciences, 2, 10-17.
Hwang, C. L. and Yoon, K. (1981). Multiple Attributes Decision Making Methods and
Applications. (1st edition). Heidelberg: Springer.
Jaiswal, R. K., Thomas, T., Galkate, R. V., Ghosh, N. C. and Singh, S. (2014).
Watershed Prioritization Using Saaty’s AHP Based Decision Support for Soil
Conservation Measures. Water Resources Management, 28, 475-494.
Javed, A., Khanday, M. Y. and Rais, S. (2011). Watershed Prioritization Using
Morphometric and Land Use/Land Cover Parameters: A Remote Sensing and
GIS-Based Approach. Journal of the Geological Society of India, 78, 63-75.
Jun, K. S., Sung, J. Y., Chung, E. S. and Lee, K. S. (2011). Development of Spatial
Water Resources Vulnerability Index Considering Climate Change Impacts.
Science of the Total Environment, 409, 5228-5242.
Juwana, I. (2012). Development of a Water Sustainability Index for West Java,
Indonesia. Doctor Philosophy, Victoria University.
Juwana, I., Muttil, N. and Perera, B. J. C. (2012). Indicator-based Water Sustainability
Assessment- A Review. Science of the Total Environment, 438, 357-371.
Karageorgis, A. P., Kapsimalis, V., Kontogianni, A., Skourtos, M., Turner, K. R. and
Salomons, W. (2006). Impact of 100-Year Human Interventions on the Deltaic
Coastal Zone of the Inner Thermaikos Gulf (Greece): A DPSIR Framework
Analysis. Environmental Management, 38, 304-315.
Karthik, D., Vijayarekha, K. and Sekar, S. (2014). Profiling Water Quality Using the
Multivariate Chemometric Method. Polish Journal of Environmental Studies,
23, 573-576.
117
Khan, A., Gupta, V. P. and Moharana, P. C. (2001). Watershed Prioritization Using
Remote Sensing and Geographical Information System: A Case Study from
Guhiya, India. Journal of Arid Environments, 49, 465-475.
Kim, Y. and Chung, E. S. (2012). Integrated Assessment of Climate Change and
Urbanization Impact on Adaptation Strategies: A Case Study in Two Small
Korean Watersheds. Climatic Change, 115, 853-872.
Kim, Y. and Chung, E. S. (2014). An Index-based Robust Decision Making
Framework for Watershed Management in a Changing Climate. Science of the
Total Environment, 473-474, 88-102.
Kumar, B. and Kumar, U. (2011). Micro-Watershed Characterization and
Prioritization Using Geomatics Technology for Natural Resources
Management. International Journal of Geomatics and Geosciences, 1, 789-
802.
Legates, D. R. and Willmott, C. J. (1990). Mean Seasonal and Spatial Variability in
Gauge-Corrected, Global Precipitation. International Journal of Climatology,
10, 111-127.
Lee, K. S. and Chung, E. S. (2007a). Hydrological Effects of Climate Change,
Groundwater Withdrawal, and Land Use in a Small Korean Watershed.
Hydrological Processes, 21, 3046-3056.
Lee, K. S. and Chung, E. S. (2007b). Development of Integrated Watershed
Management Schemes for an Intensively Urbanized Region in Korea. Journal
of Hydro-environment Research, 1(2), 95-109.
Lee, K. S., Chung, E. S. and Kim, Y. (2008). Integrated Watershed Management for
Mitigating Streamflow Depletion in an Urbanized Watershed in Korea.
Integrated Water Resources Management in a Changing World, 33, 382-394.
Lescesen, I., Pantelic, M., Dolinaj, D., Stojanovic, V. and Milosevic, D. (2015).
Statistical Analysis of Water Quality Parameters of the Drina River (West
Serbia), 2004-11. Polish Journal of Environmental Studies, 24, 555-561.
Liverman, D. M., Hanson, M. E., Brown, B. J. and Merideth Jr., R. W. (1988). Global
Sustainability: Toward measurement. Environmental Management, 12 (2),
133-143.
Loomer, H., A. and Cooke, S., E. (2011). Water Quality in the Grand River Watershed:
Current Conditions & Trends (2003-2008). Draft. Grand River Conservation
Authority.
118
Macharis, C., Springael, J., Brucker, K. D. and Verbeke, A. (2004). PROMETHEE
and AHP: The Design of Operational Synergies in Multicriteria Analysis:
Strengthening PROMETHEE with Ideas of AHP. European Journal of
Operational Research, 153, 307-317.
Mahazar, A., Shuhaimi-Othman, M., Kutty, A. A. and Desa, M. N. M. (2013).
Monitoring Urban River Water Quality Using Macroinvertebrate and Physico-
Chemical Parameters: Case Study of Penchala River, Malaysia. Journal of
Biological Sciences, 13, 474-482.
Mahvi, A. H. and Razavi, M. (2005). Application of Polyelectrolyte in Turbidity
Removal from Surface Water. American Journal of Applied Sciences, 2, 397-
399.
Maidment, D. R. (2002). Arc Hydro: GIS for Water Resources. (1st edition). Redlands,
Ca: ESRI Press.
Malczewski, J. (1999). GIS and Multicriteria Decision Analysis. New York: Wiley.
Mamun, A. A., Idris, A., Sulaiman, W. N. A. and Muyibi, S. A. (2007). A Revised
Water Quality Index Proposed for the Assessment of Surface Water Quality in
Malaysia. Pollution Research Journal, 26, 523-529.
Martin, D. and Saha, S. K. (2007). Integrated Approach of Using Remote Sensing and
GIS to Study Watershed Prioritization and Productivity. Journal of the Indian
Society of Remote Sensing, 35, 21-30.
Martinez, F. B. and Galera, I. C. (2011). Monitoring and Evaluation of the Water
Quality of Taal Lake, Talisay, Batangas, Philippines. Academic Research
International, 1, 229-236.
Mateo, J. R. (2012). Multi Criteria Analysis in the Renewable Energy Industry. (1st
edition). London: Springer.
Mayer, A. L. (2008). Strengths and Weaknesses of Common Sustainability Indices for
Multidimensional Systems. Environment International, 34, 277-291.
MDBMC (2001). Integrated Catchment Management in the Murray-Darling Basin
2001-2010. Technical Report. Murray-Darling Basin Ministerial Council.
Mikulic, J., Kozic, I. and Kresic, D. (2015). Weighting Indicators of Tourism
Sustainability: A Critical Note. Ecological Indicators, 48, 312-314.
Mohamed, I. (2011). Water Quality Assessment of Sg. Skudai. Bachelor’s Degree,
Universiti Teknologi Malaysia, Skudai.
119
Murty, C. V. and Venkatachalam, P. (1992). Delineation of Erosion Cells in a
Watershed Using GIS. Journal of Environmental Management, 36, 159-166.
Nasiri, H., Boloorani, A. D., Sabokbar, H. A. F., Jafari, H. R., Hamzeh, M. and Rafii,
Y. (2013). Determining the Most Suitable Areas for Artificial Groundwater
Recharge Via an Integrated PROMETHEE II-AHP Method in GIS
Environment (Case Study: Garabaygan Basin, Iran). Environmental
Monitoring and Assessment, 185, 707-718.
Nasirian, M. (2007). A New Water Quality Index for Environmental Contamination
Contributed by Mineral Processing: A Case Study of Amang (Tin Tailing)
Processing Activity. Journal of Applied Sciences, 7(20), 2977-2987.
Naubi, I., Zardari, N. H., Shirazi, S. M., Ibrahim, N. F. and Baloo, L. (2016).
Effectiveness of Water Quality Index for Monitoring Malaysian River Water
Quality. Polish Journal of Environmental Studies, 25, 231-239.
Ness, B., Urbel-Piirsalu, E., Anderberg, S. and Olsson, L. (2007). Categorizing Tools
for Sustainability Assessment. Ecological Economics, 60, 498-508.
OECD (1994). Environmental Indicators: OECD Core Set. Report. Organisation for
Economic Cooperation and Development.
OECD (1999). Environmental Indicators for Agriculture: Volume 1 Concepts and
Frameworks. Report. Organisation for Economic Cooperation and
Development.
OECD (2003). Environmental Indicators: Development, Measurement and Use.
Annual Report. The Organisation for Economic Co-operation and
Development.
Ozgen, A., Tuzkaya, G., Tuzkaya, U. R. and Ozgen, D. (2011). A Multi-criteria
Decision Making Approach for Machine Tool Selection Problem in a Fuzzy
Environment. International Journal of Computational Intelligent Systems, 4(4),
431-445.
Pai, N., Saraswat, D. and Daniels, M. (2011). Identifying Priority Sub-watersheds in
the Illinois River Drainage Area in Arkansas Watershed Using a Distributed
Modeling Approach. Advances in Watershed Management, 54, 2181-2196.
Paul, J. M. and Inayathulla, M. (2012). Morphometric Analysis and Prioritization of
Hebbal Valley in Bangalore. Journal of Mechanical and Civil Engineering, 2,
31-37.
120
Perkins, P. E. (2011). Public Participation in Watershed Management: International
Practices for Inclusiveness. Physics and Chemistry of the Earth, 36, 204-212.
Pullar, D. and Springer, D. (2000). Towards Integrating GIS and Catchment Models.
Environmental Modeling and Software, 15, 451-459.
Vojinovic, Z. and Abbott, M. B. (2012). Flood Risk and Social Justice: From
Quantitative to Qualitative Flood Risk Assessment and Mitigation (Urban
Hydroinformatics). (1st edition). London: IWA Publishing.
Qi, H. and Altinakar, M. S. (2011). A GIS-based Decision Support System for
Integrated Flood Management under Uncertainty with Two Dimensional
Numerical Simulations. Environmental Modelling & Software, 26, 817-821.
Raja, P. A. and Kumar, D. N. (1998). Ranking Multi-Criterion River Basin Planning
Alternatives Using Fuzzy Numbers. Fuzzy Sets and Systems, 100, 89-99.
Ramu, K. V. (2004). Brantas River Basin Case Study Indonesia. Background Paper.
Agriculture and Rural Development Department at the World Bank.
Randhir, T. O., O'Connor, R., Penner, P. R. and Goodwin, D. W. (2001). A Watershed-
Based Land Prioritization Model for Water Supply Protection. Forest Ecology
and Management, 143, 47-56.
Rocchini, R. and Swain, L. G. (1995). The British Columbia Water Quality Index.
Report. Water Quality Branch, Environmental Protection Department, British
Columbia Ministry of Environment, Land and Parks.
Rogers, M. G., Bruen, M. and Maystre, L. (1999). ELECTRE and Decision Support:
Methods and Applications in Engineering and Infrastructure Investment. (1st
edition). US: Springer.
Rosli, N., Gandaseca, S., Ismail, J. and Jailan, M. I. (2010). Comparative Study of
Water Quality at Different Peat Swamp Forest of Batang Igan Sibu Sarawak.
American Journal of Environmental Sciences, 6, 416-421.
Saaty, T. L. (1988). What is the Analytic Hierarchy Process? in Greenberg, H. J.,
Lootsma, F. A., Rijckaert, M. J., Zimmermann, H. J. and Mitra, G. (Ed.)
Mathematical Models for Decision Support. (109-121). New York: Springer-
Verlag Berlin Heidelberg.
Saaty, T. L. (2008). Decision Making with the Analytic Hierarchy Process.
International Journal of Services Sciences, 1, 83-98.
121
Said, A., Stevens, D. K. and Sehlke, G. (2004). Environmental Assessment an
Innovative Index for Evaluating Water Quality in Streams. Environmental
Management, 34, 406-414.
Saksena, D. N., Garg, R. K. and Rao, R. J. (2008). Water Quality and Pollution Status
of Chambal River in National Chambal Sanctuary, Madhya Pradesh. Journal
of Environmental Biology, 29(5), 701-710.
Salarpour, M. (2010). Flood Mapping of Sungai Skudai Using Infoworks RS. Master’s
Degree, Universiti Teknologi Malaysia, Skudai.
Sanchez, E., Colmenarejo, M. F., Vicente, J., Rubio, A., Garcia, M. G., Travieso, L.
and Borja, R. (2007). Use of the Water Quality Index and Dissolved Oxygen
Deficit as Simple Indicators of Watersheds Pollution. Ecological Indicators, 7,
315-328.
Sarkar, C. and Abbasi, S. A. (2006). Qualidex - A New Software for Generating Water
Quality Indices. Environmental Monitoring and Assessment, 119, 201-231.
Sarma, S. and Saikia, T. (2012). Prioritization of Sub-Watersheds in Khanapara-
Bornihat Area of Assam-Meghalaya (India) Based on Land Use and Slope
Analysis Using Remote Sensing and GIS. Journal of the Indian Society of
Remote Sensing, 40, 435-446.
Schramm, G. (1980). Integrated River Basin Planning in A Holistic Universe. Natural
Resources Journal, 20, 787-805.
Senila, M., Levei, E., Miclean, M., Tanaselia, C., David, L. and Cordos, E. (2007).
Study Regarding the Water Quality in Aries Catchment. Chemical Bulletin of
"POLITEHNICA" University of Timisoara, Romania, 52(66), 169-172.
Sood, A. and Ritter, W. F. (2010). Evaluation of Best Management Practice and Water
Assessment Tool (SWAT) Model. Journal of Water Resource and Protection,
2, 403-412.
Stewart, T. J. and Scott, L. (1995). A Scenario-Based Framework For Multi-Criteria
Decision Analysis in Water Resources Planning. Water Resources Research,
31(11), 2835-2843.
Strager, M. P., Fletcher, J. J., Strager, J. M., Yuill, C. B., Eli, R. N., Petty, J. T. and
Lamont, S. J. (2010). Watershed Analysis with GIS: The Watershed
Characterization and Modeling System Software Application. Computers &
Geosciences, 36, 970-976.
122
Susilo, G. E. and Febrina, R. (2011). The Simplification of DOE Water Quality Index
Calculation Procedures Using Graphical Analysis. Australian Journal of Basic
and Applied Sciences, 5(2), 207-214.
Susser, D. (2010). London’s Flood Risk and Flood Defence Management in Times of
Climate Change. Bachelor’s Degree, University of Oldenburg.
Swer, S. and Singh, O. P. (2004). Status of Water Quality in Coal Mining Areas of
Meghalaya, India. Proceedings of the National Seminar on Environmental
Engineering with special emphasis on Mining Environment. 19-20 March.
Dhanbad, 1-9.
Taner, M. U., Ustün, B. and Erdincler, A. (2011). A Simple Tool for the Assessment
of Water Quality in Polluted Lagoon Systems: A Case Study for
Kücükcekmece Lagoon, Turkey. Ecological Indicators, 11(2), 749-756.
Trenholm, R., Lantz, V., Martínez-Espineira, R. and Little, S. (2013). Cost-Benefit
Analysis of Riparian Protection in an Eastern Canadian Watershed. Journal of
Environmental Management, 116, 81-94.
Tripathi, M. P., Panda, R. K. and Raghuwanshi, N. S. (2003). Identification and
Prioritization of Critical Sub-Watersheds for Soil Conservation Management
Using the SWAT Model. Biosystems Engineering, 85, 365-379.
Tuzkaya, G., Gülsün, B., Kahraman, C. and Özgen, D. (2010). An Integrated Fuzzy
Multi-criteria Decision Making Methodology for Material Handling
Equipment Selection Problem and an Application. Expert Systems with
Applications, 37(4), 2853-2863.
USEPA (2007). Application of Watershed Ecological Risk Assessment Methods to
Watershed Management. Report. National Center for Environmental
Assessment, Washington, DC.
van Delden, H., Luja, P. and Engelen, G. (2007). Integration of Multi-Scale Dynamic
Spatial Models of Socio-Economic and Physical Processes for River Basin
Management. Environmental Modelling & Software, 22, 223-238.
Volk, M., Hirschfeld, J., Dehnhardt, A., Schmidt, G., Bohn, C., Liersch, S. and
Gassman, P. W. (2008). Integrated Ecological-Economic Modelling of Water
Pollution Abatement Management Options in the Upper Ems River Basin.
Ecological Economics, 66, 66-76.
123
Wang, X. and Yin Z. (1997). Using GIS to Assess the Relationship between Land Use
and Water Quality at a Watershed Level. Environment International, 23, 103-
114.
Wang, F., Ding, Y., Ge, L., Ren, H. and Ding, L. (2010). Effect of High-Strength
Ammonia Nitrogen Acclimation on Sludge Activity in Sequencing Batch
Reactor. Journal of Environmental Sciences, 22(11), 1683-1688.
WCED (1987). Our Common Future. Technical Report. World Commission on
Environment and Development.
Yang, J. S., Chung, E. S., Kim, S. U. and Kim, T. W. (2012). Prioritization of Water
Management under Climate Change and Urbanization Using Multicriteria
Decision Making Methods. Hydrology and Earth System Sciences, 16, 801-
814.
Yisa, J. and Jimoh, T. (2010). Analytical Studies on Water Quality Index of River
Landzu. American Journal of Applied Sciences, 7, 453-458.
Yu, X., Xu, Z. and Ma, Y. (2013). Prioritized Multi-Criteria Decision Making Based
on the Idea of PROMETHEE. Procedia Computer Science, 17, 449-456.
Zanetta, A. (1994). Indicators and Indices of Water Quality for Environmental Impact
Assessment. Report EUR 15865 EN. Joint Research Centre, European
Commission.
Zardari, N. H., Cordery, I. and Sharma, A. (2010). An Objective Multiattribute
Analysis Approach for Allocation of Scarce Irrigation Water Resources.
Journal of the American Water Resources Association, 46, 412-428.
Zardari, N. H., Yusop, Z., Shirazi, S. M. and Roslan, N. A. (2015a). Prioritization of
Farmlands in a Multicriteria Irrigation Water Allocation: PROMETHEE and
GAIA Applications. Transactions of the ASABE, 58(1), 73-82.
Zardari, N. H., Ahmed, K., Shirazi, S. M. and Yusop, Z. B. (2015b). Weighting
Methods and their Effects on Multi-Criteria Decision Making Model Outcomes
in Water Resources Management. (1st edition). New York: Springer
International Publishing.