prism datasets aug2016 - oregon state university · descriptions of prism spatial climate datasets...
TRANSCRIPT

1
DescriptionsofPRISMSpatialClimateDatasetsfortheConterminousUnitedStates
Created June 2013 Last revised August 2016
Summary of August 2016 revisions:
Creation of LT81m, AN81m, and AN81D versions of Vpdmin and Vpdmax (minimum and maximum vapor pressure deficit)
Addition of NCECONET (North Carolina), DEOS (Delaware), and NJWXNET (New Jersey) station networks
The PRISM Climate Group works on a range of projects, some of which support the development of spatial climate datasets. The resulting array of datasets reflects the range of project goals, requiring differing station networks, modeling techniques, and spatial and temporal resolutions. Whenever possible, we offer these datasets to the public, either free of charge, or for a fee, depending on the size and difficulty of delivering the dataset and funding for the activity. In order for users to make informed decisions about which dataset is most appropriate for their needs, this document provides information on the PRISM spatial climate datasets currently available. We start with an overview of the array of PRISM datasets, then discuss each in turn. Summary tables are provided for quick reference.
It should be noted up front that these datasets are not static entities, but are in a constant state of change. New networks are being added periodically to some datasets. Even those designed for long-term consistency experience changes due to improvements in data handling and quality control procedures. We will endeavor to keep this documentation current, but inconsistencies are bound to arise.
Overview
PRISM datasets provide estimates of six basic climate elements: precipitation (ppt), minimum temperature (tmin), maximum temperature (tmax), mean dew point (tdmean), minimum vapor pressure deficit (vpdmin), and maximum vapor pressure deficit (vpdmax). Two derived variables, mean temperature (tmean) and vapor pressure (vpr), are sometimes included, depending on the dataset. Descriptions of the climate elements and derived variables are given in Table 1.

2
Table 1. Descriptions of climate elements available from PRISM datasets. Basic descriptions are for the daily time interval, with additional monthly time interval information given in brackets. Monthly station values are calculated from daily data.
Abbreviation Type Description
Ppt Modeled climate element Daily [monthly] total precipitation (rain+melted snow)
Tmax Modeled climate element Daily maximum temperature [averaged over all days in the month]
Tmin Modeled climate element Daily minimum temperature [averaged over all days in the month]
Tmean Derived variable Daily mean temperature, calculated as (tmax+tmin)/2
Tdmean Modeled climate element Daily mean dew point temperature [averaged over all days in the month]
Vpdmin Modeled climate element Daily minimum vapor pressure deficit [averaged over all days in the month]
Vpdmax Modeled climate element Daily maximum vapor pressure deficit [averaged over all days in the month]
Vpr Derived variable Vapor pressure, derived from tdmean
A summary of the PRISM datasets is given in Table 2. There are two main classes of PRISM datasets: long-term averages and time series. Long-term averages, or “normals,” abbreviated “Norm” in Table 2, are 30-year averages for periods with years ending in 0, such as 1961-90 and 1971-2000. A “71” represents a 1971-2000 climatological average, and “81” represents a 1981-2010 average. An “m” denotes that the dataset has a monthly time step.
Time series datasets are abbreviated with an “LT” or “AN” (Table 2). LT, which stands for long term, refers to time series focused on temporal consistency. AN, which stands for all networks, refers to time series focused on providing the best estimate possible, at the expense of temporal consistency. For time series datasets, a 71 or 81 refers to the start year of the climatology used in the CAI (Climatologically-Aided Interpolation) process; see Time Series Datasets section. A “71” means that the dataset is based on the 1971-2000 climatology, and “81” means that it is based on the 1981-2010 climatology. A “d” denotes a daily time step. An “m” denotes a monthly time step.
When an analysis or re-analysis of a dataset is released, it is given a version number, preceded by an “M” for monthly data, or “D” for daily data; for example, a daily dataset may be denoted as version D2. These version numbers are imbedded in the names of the downloadable zip files.

3
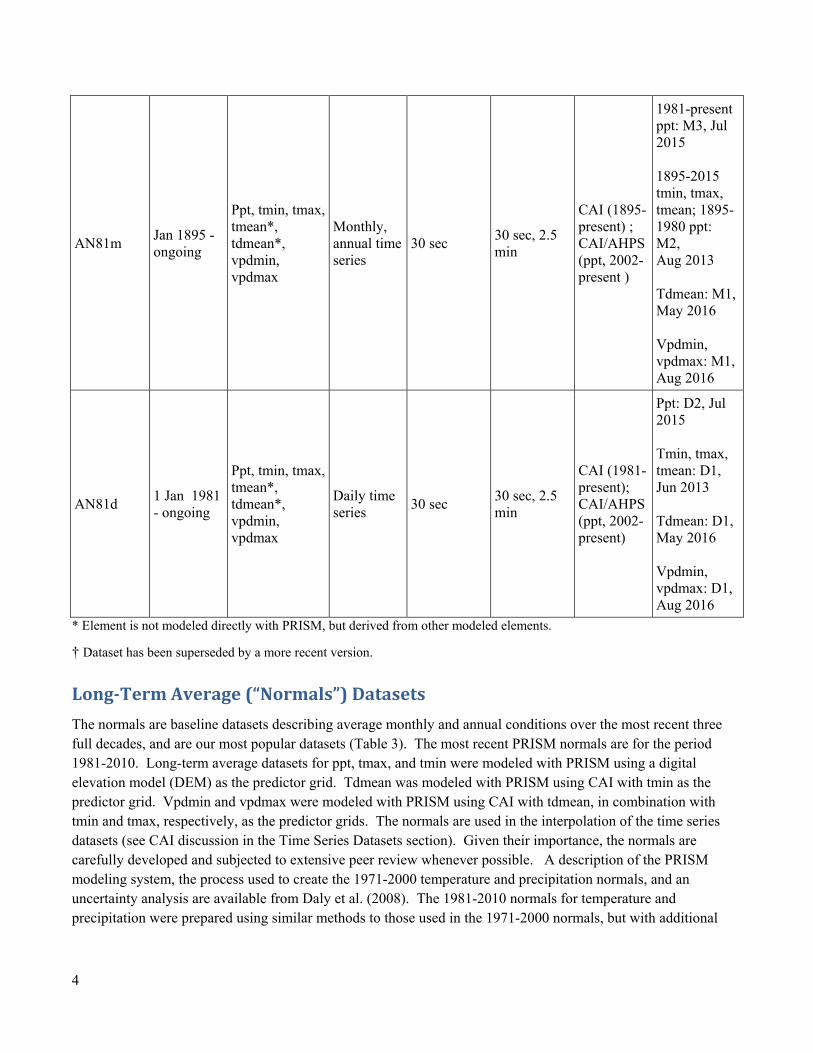
Table 2. Summary of the PRISM spatial climate datasets active as of August 2016. See Table 1 for descriptions of climate elements and derived variables.
Dataset Time
Period Climate
Elements Time Step
Modeling Resolution
Output Resolution
Modeling Method
Latest Version and Release Date
Long-Term Averages
Norm71m† 1971-2000 Ppt, tmin, tmax Monthly, annual average
30 sec (~800m)
30 sec DEM Jul 2007 (no version #)
Norm81m 1981-2010
Ppt, tmin, tmax, tmean*, tdmean, vpdmin, vpdmax
Monthly, annual average
30 sec 30 sec, 2.5 min (~4km)
DEM and CAI
Ppt, tmin, tmax, tmean: M2, Jul 2012 Tdmean, vpdmin, vpdmax: M2, Dec 2014
Time Series
LT71m† Jan 1895 – Dec 2015
Ppt, tmin, tmax, tmean*, tdmean, vpr*
Monthly, annual time series
30 sec 30 sec CAI (1971-2000)
Jul 2008 (no version #)
LT81m Jan 1895 - ongoing
Ppt, tmin, tmax, tmean*, tdmean, vpr*, vpdmin, vpdmax
Monthly, annual time series
30 sec 30 sec CAI (1981-2010)
Ppt, tmin, tmax, tmean: M2, Aug 2013 Tdmean, vpr: M1, May 2016 Vpdmin, vpdmax: M1, Aug 2016
4
AN81m Jan 1895 - ongoing
Ppt, tmin, tmax, tmean*, tdmean*, vpdmin, vpdmax
Monthly, annual time series
30 sec 30 sec, 2.5 min
CAI (1895-present) ; CAI/AHPS (ppt, 2002-present )
1981-present ppt: M3, Jul 2015 1895-2015 tmin, tmax, tmean; 1895-1980 ppt: M2, Aug 2013 Tdmean: M1, May 2016 Vpdmin, vpdmax: M1, Aug 2016
AN81d 1 Jan 1981 - ongoing
Ppt, tmin, tmax, tmean*, tdmean*, vpdmin, vpdmax
Daily time series
30 sec 30 sec, 2.5 min
CAI (1981-present); CAI/AHPS (ppt, 2002-present)
Ppt: D2, Jul 2015 Tmin, tmax, tmean: D1, Jun 2013 Tdmean: D1, May 2016 Vpdmin, vpdmax: D1, Aug 2016
* Element is not modeled directly with PRISM, but derived from other modeled elements.
† Dataset has been superseded by a more recent version.
Long‐TermAverage(“Normals”)Datasets
The normals are baseline datasets describing average monthly and annual conditions over the most recent three full decades, and are our most popular datasets (Table 3). The most recent PRISM normals are for the period 1981-2010. Long-term average datasets for ppt, tmax, and tmin were modeled with PRISM using a digital elevation model (DEM) as the predictor grid. Tdmean was modeled with PRISM using CAI with tmin as the predictor grid. Vpdmin and vpdmax were modeled with PRISM using CAI with tdmean, in combination with tmin and tmax, respectively, as the predictor grids. The normals are used in the interpolation of the time series datasets (see CAI discussion in the Time Series Datasets section). Given their importance, the normals are carefully developed and subjected to extensive peer review whenever possible. A description of the PRISM modeling system, the process used to create the 1971-2000 temperature and precipitation normals, and an uncertainty analysis are available from Daly et al. (2008). The 1981-2010 normals for temperature and precipitation were prepared using similar methods to those used in the 1971-2000 normals, but with additional
5
station networks. The development of 1981-2010 normals for tdmean, vpdmin, and vpdmax is described in Daly et al. (2015).
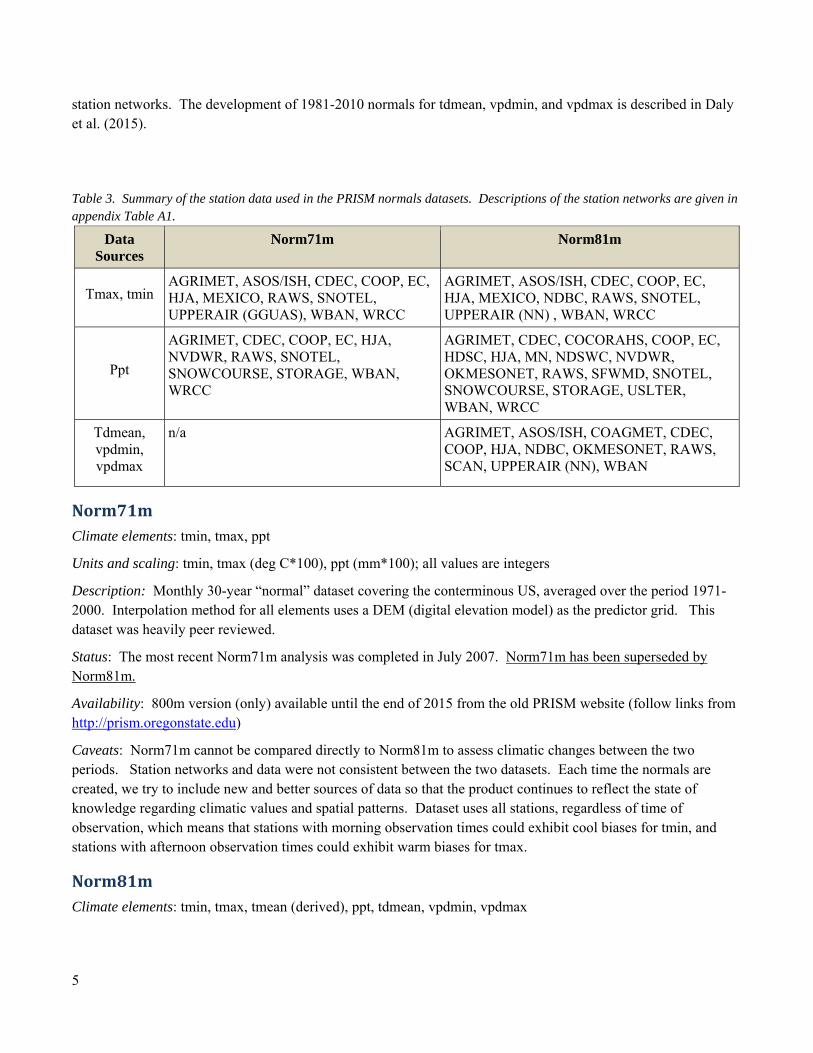
Table 3. Summary of the station data used in the PRISM normals datasets. Descriptions of the station networks are given in appendix Table A1.
Data Sources
Norm71m Norm81m
Tmax, tmin AGRIMET, ASOS/ISH, CDEC, COOP, EC, HJA, MEXICO, RAWS, SNOTEL, UPPERAIR (GGUAS), WBAN, WRCC
AGRIMET, ASOS/ISH, CDEC, COOP, EC, HJA, MEXICO, NDBC, RAWS, SNOTEL, UPPERAIR (NN) , WBAN, WRCC
Ppt
AGRIMET, CDEC, COOP, EC, HJA, NVDWR, RAWS, SNOTEL, SNOWCOURSE, STORAGE, WBAN, WRCC
AGRIMET, CDEC, COCORAHS, COOP, EC, HDSC, HJA, MN, NDSWC, NVDWR, OKMESONET, RAWS, SFWMD, SNOTEL, SNOWCOURSE, STORAGE, USLTER, WBAN, WRCC
Tdmean, vpdmin, vpdmax
n/a AGRIMET, ASOS/ISH, COAGMET, CDEC, COOP, HJA, NDBC, OKMESONET, RAWS, SCAN, UPPERAIR (NN), WBAN
Norm71mClimate elements: tmin, tmax, ppt
Units and scaling: tmin, tmax (deg C*100), ppt (mm*100); all values are integers
Description: Monthly 30-year “normal” dataset covering the conterminous US, averaged over the period 1971-2000. Interpolation method for all elements uses a DEM (digital elevation model) as the predictor grid. This dataset was heavily peer reviewed.
Status: The most recent Norm71m analysis was completed in July 2007. Norm71m has been superseded by Norm81m.
Availability: 800m version (only) available until the end of 2015 from the old PRISM website (follow links from http://prism.oregonstate.edu)
Caveats: Norm71m cannot be compared directly to Norm81m to assess climatic changes between the two periods. Station networks and data were not consistent between the two datasets. Each time the normals are created, we try to include new and better sources of data so that the product continues to reflect the state of knowledge regarding climatic values and spatial patterns. Dataset uses all stations, regardless of time of observation, which means that stations with morning observation times could exhibit cool biases for tmin, and stations with afternoon observation times could exhibit warm biases for tmax.
Norm81mClimate elements: tmin, tmax, tmean (derived), ppt, tdmean, vpdmin, vpdmax

6
Units and scaling: tmin, tmax, tmean, tdmean (deg C); ppt (mm); vpdmin, vpdmax (hPa); all values are floating point
Description: Monthly 30-year “normal” dataset covering the conterminous US, averaged over the period 1981-2010. Interpolation method for tmin, tmax, and ppt used a DEM (digital elevation model) as the predictor grid. Interpolation of tdmean used tmin as the predictor grid. Interpolation of vpdmin and vpdmax used tdmean, in combination with tmin and tmax, respectively, as the predictor grids.
Status: The most recent Norm81m analysis for tmax, tmin, tmean, and ppt was completed in July 2012 (version M2). The most recent Norm81m analysis for tdmean, vpdmin, and vpdmax was completed in December 2014 (version M2).
Availability: 800m and 4km versions available at http://prism.oregonstate.edu
Caveats: Same as Norm71m
TimeSeriesDatasets
The long-term average datasets discussed above are modeled with PRISM using a DEM as the predictor grid. In contrast, the time series datasets are modeled using a method called climatologically-aided interpolation (CAI). In CAI, the long-term average datasets serve as the predictor grids. The idea behind CAI is that the best first guess of the spatial pattern of climatic conditions for a given month or day is the long-term average pattern. CAI is robust to wide variations in station data density, which is necessary when modeling century-long time series.
There are two types of time series datasets: those created to provide the best possible estimates at a given time step, and those created with long-term consistency in mind. Table 4 lists the station networks used in each type of time series dataset. A more detailed description of the station data networks used is given in Appendix A. Time series datasets providing the best possible estimates, abbreviated “AN” (all networks), use all of the station networks and data sources ingested by the PRISM Climate Group. Time series datasets focusing on long-term consistency, abbreviated “LT” (long term), may not use all available station networks, but instead focus on networks that have been in existence for at least twenty years. The goal of the LT datasets is to provide better temporal consistency than the AN datasets. However, even the LT datasets are not currently suitable for calculating multi-decadal climate trends. Although longer-term networks are used, grids still contain non-climatic variations due to station equipment and location changes, stations openings and closings, and varying observation times.
Table 4. Summary of the PRISM time series datasets. Methodological details are provided in the Time Series Datasets section. Descriptions and time histories of the station networks are given in appendix Tables A1-A4.
AN81m AN81d LT71m/LT81m
Focus Best estimate Best estimate Temporal consistency
Data Sources
All stations included, regardless of observation time
All stations included, but with time of observation constraint
Only “long-term” networks having at least some stations with ≥ 20 years of data included. All stations included, regardless of observation time.
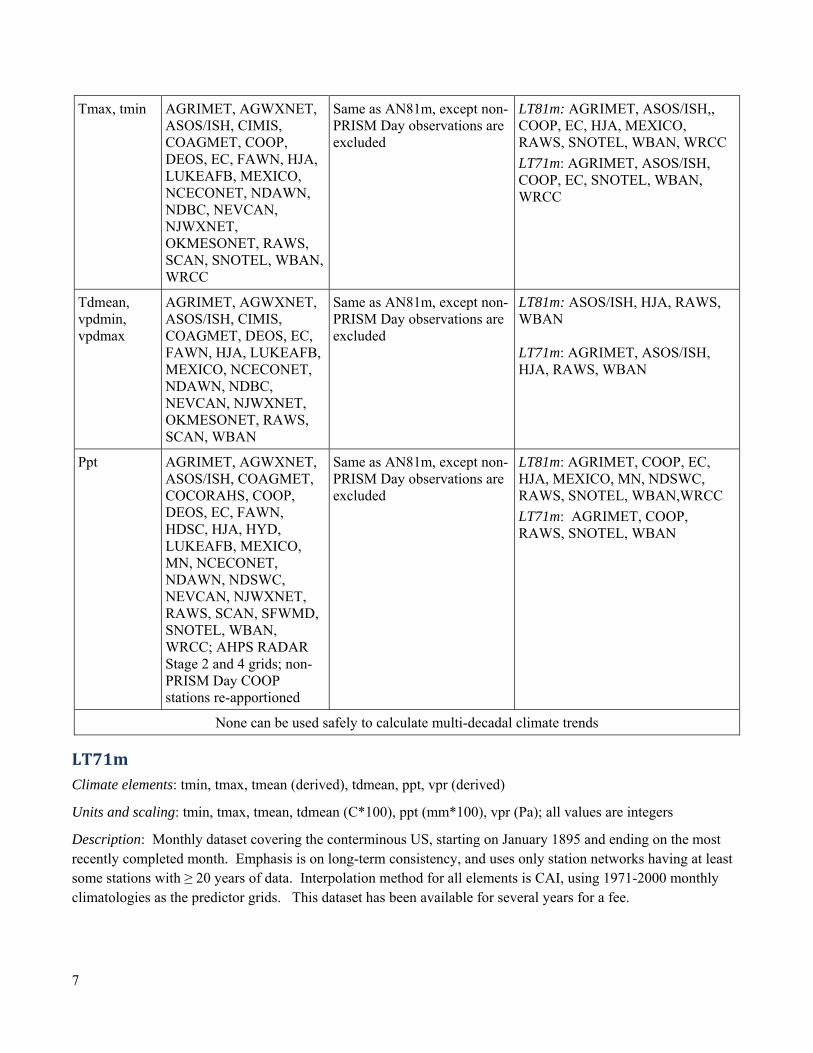
7
Tmax, tmin AGRIMET, AGWXNET, ASOS/ISH, CIMIS, COAGMET, COOP, DEOS, EC, FAWN, HJA, LUKEAFB, MEXICO, NCECONET, NDAWN, NDBC, NEVCAN, NJWXNET, OKMESONET, RAWS, SCAN, SNOTEL, WBAN, WRCC
Same as AN81m, except non-PRISM Day observations are excluded
LT81m: AGRIMET, ASOS/ISH,, COOP, EC, HJA, MEXICO, RAWS, SNOTEL, WBAN, WRCC
LT71m: AGRIMET, ASOS/ISH, COOP, EC, SNOTEL, WBAN, WRCC
Tdmean, vpdmin, vpdmax
AGRIMET, AGWXNET, ASOS/ISH, CIMIS, COAGMET, DEOS, EC, FAWN, HJA, LUKEAFB, MEXICO, NCECONET, NDAWN, NDBC, NEVCAN, NJWXNET, OKMESONET, RAWS, SCAN, WBAN
Same as AN81m, except non-PRISM Day observations are excluded
LT81m: ASOS/ISH, HJA, RAWS, WBAN LT71m: AGRIMET, ASOS/ISH, HJA, RAWS, WBAN
Ppt AGRIMET, AGWXNET, ASOS/ISH, COAGMET, COCORAHS, COOP, DEOS, EC, FAWN, HDSC, HJA, HYD, LUKEAFB, MEXICO, MN, NCECONET, NDAWN, NDSWC, NEVCAN, NJWXNET, RAWS, SCAN, SFWMD, SNOTEL, WBAN, WRCC; AHPS RADAR Stage 2 and 4 grids; non-PRISM Day COOP stations re-apportioned
Same as AN81m, except non-PRISM Day observations are excluded
LT81m: AGRIMET, COOP, EC, HJA, MEXICO, MN, NDSWC, RAWS, SNOTEL, WBAN,WRCC
LT71m: AGRIMET, COOP, RAWS, SNOTEL, WBAN
None can be used safely to calculate multi-decadal climate trends
LT71mClimate elements: tmin, tmax, tmean (derived), tdmean, ppt, vpr (derived)
Units and scaling: tmin, tmax, tmean, tdmean (C*100), ppt (mm*100), vpr (Pa); all values are integers
Description: Monthly dataset covering the conterminous US, starting on January 1895 and ending on the most recently completed month. Emphasis is on long-term consistency, and uses only station networks having at least some stations with ≥ 20 years of data. Interpolation method for all elements is CAI, using 1971-2000 monthly climatologies as the predictor grids. This dataset has been available for several years for a fee.
8
Status: The most recent re-analysis was done in July 2008 (full period of record), and updated with new data through December 2015, at which time it was discontinued. LT71m has been superseded by LT81m; current users of LT71m should migrate to LT81m.
Availability: 800m dataset available for a fee; contact [email protected]
Caveats: Dataset should not be used to calculate multi-decadal climate trends. Although longer-term networks are used, grids still contain non-climatic variations due to station equipment and location changes, station openings and closings, and varying observation times.
LT81mClimate elements: tmin, tmax, tmean (derived), ppt, tdmean, vpr (derived), vpdmin, vpdmax
Units and scaling: tmin, tmax, tmean, tdmean (deg C); ppt (mm); vpr, vpdmin, vpdmax (hPa); all values are floating point
Description: Monthly dataset covering the conterminous US, starting on January 1895 and ending on the most recently completed month. Emphasis is on long-term consistency, and uses only station networks having at least some stations with ≥ 20 years of data. Interpolation method for all elements is CAI, using 1981-2010 monthly climatologies as the predictor grids.
Given that station data for tdmean, vpdmin, and vpdmax extend back to the 1930s at the earliest (most start in the 1940s), data for these climate elements were extended back to 1895 at a subset of approximately 250 long-term stations by estimating their values based on temperature and precipitation. Specifically, monthly tdmean was estimated by multiple linear regression functions with precipitation, tmin, and trange (tmax-tmin) as the independent variables. Vpdmin and vpdmax were estimated in two steps: (1) calculating “first-guess” vpdmin using tmin and the estimated tdmean, and first-guess vpdmax using tmax and the estimated tdmean; and (2) estimating vpdmin and vpdmax by second-order polynomial regression functions with their respective first-guess values as the independent variables.
LT81m supersedes LT71m.
Status: The most recent re-analysis was completed in August 2013 (full period of record), and updated with new data for subsequent months (version M2). This product supersedes LT71m for tmin, tmax, and ppt. LT81m versions of tdmean and vpr became available in May 2016 (M1). Vpdmin and vpdmax became available in August 2016 (M1).
Availability: 800m dataset available for a fee; contact [email protected]
Caveats: Dataset should not be used to calculate multi-decadal climate trends. Although longer-term networks are used, grids still contain non-climatic variations due to station equipment and location changes, station openings and closings, and varying observation times.
AN81mClimate elements: tmin, tmax, tmean (derived), ppt, tdmean, vpdmin, vpdmax
Units and scaling: tmin, tmax, tmean, tdmean (deg C), ppt (mm); vpdmin, vpdmax (hPa); all values are floating point

9
Description: Monthly dataset covering the conterminous US, starting on January 1895 and ending on the most recently completed month. Emphasis is on arriving at the best estimate, regardless of temporal consistency, and uses all station networks ingested by the PRISM Climate Group.
Interpolation method for tmin and tmax is CAI, using 1981-2010 monthly climatologies as the predictor grids.
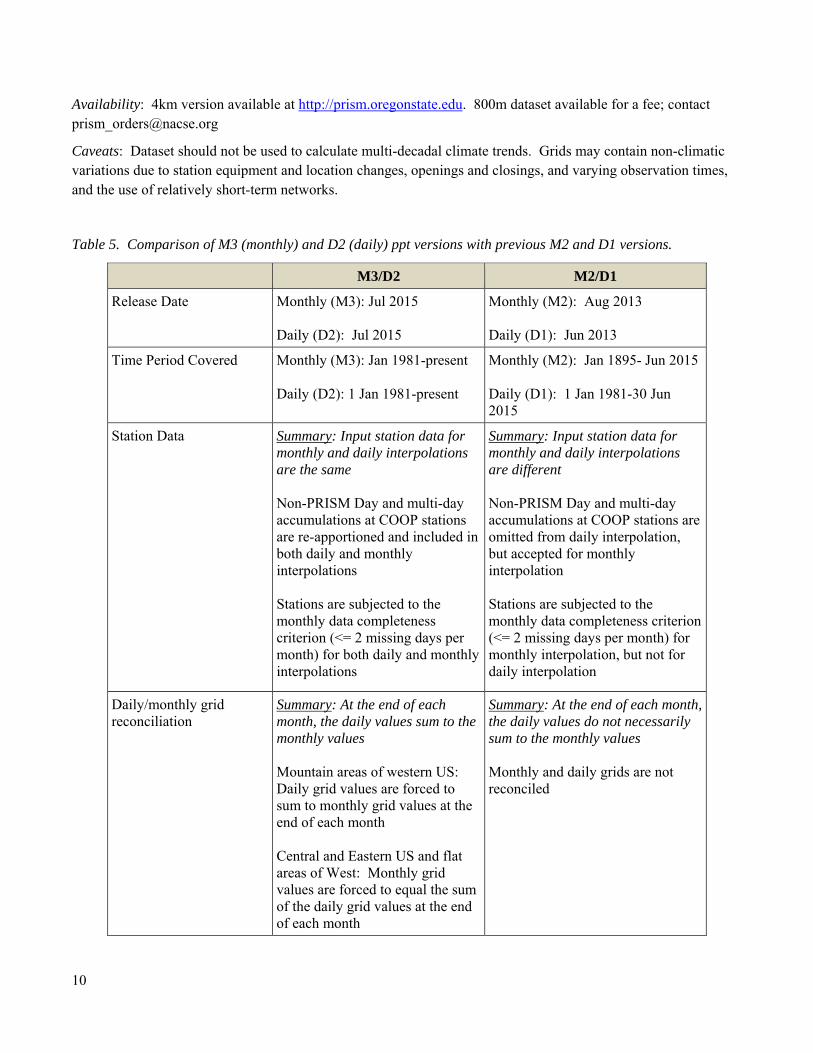
For ppt, the latest version is M3 for 1981-present only. For 1895-1980, the latest version of ppt continues to be M2. Differences between M2 and M3 are summarized in Table 5; the main difference between the two versions is that in M3, the monthly and daily grids are post-processed to be equal to each other at the end of each month. The M3 dataset uses the CAI interpolation method in the western US (Rockies westward) for all years. East of the Rockies, the monthly values are forced to equal the sum of the AN81d daily version D2 values for 1981-present. Thus, the interpolation method in the central and east is effectively the same as AN81d, which is CAI from 1981-2001, and a combination of CAI and RADAR from 2002-present. See the AN81d description for details on M3/D2 interpolation methods and station data handling. The previous M2 ppt dataset uses the monthly time step CAI interpolation method in all areas for all years.
The AN81m version of tdmean is now available (M1). In some western agricultural areas, starting in the 1980s, the AN81m version of tdmean may be very different than that of LT81m. AN81m includes several networks that have stations sited in irrigated fields (e.g., AGRIMET, CIMIS, COAGMET). These locations can have relatively high tdmean values compared to surrounding areas, especially in summer. These networks are not used in LT81m, because they do not represent natural climatic variations, but are used in AN81m, because they provide accurate information at their time and location. See Daly et al. (2015) for details.
Given that station data for tdmean, vpdmin, and vpdmax extend back to the 1930s at the earliest (most start in the 1940s), data for these climate elements were extended back to 1895 at a subset of approximately 250 long-term stations by estimating their values based on temperature and precipitation. Specifically, monthly tdmean was estimated by multiple linear regression functions with precipitation, tmin, and trange (tmax-tmin) as the independent variables. Vpdmin and vpdmax were estimated in two steps: (1) calculating “first-guess” vpdmin using tmin and the estimated tdmean, and first-guess vpdmax using tmax and the estimated tdmean; and (2) estimating vpdmin and vpdmax by second-order polynomial regression functions with their respective first-guess values as the independent variables.
Status: The most recent re-analysis of tmin and tmax is M2, which was released in August 2013 (full period of record). This version, denoted by the “M2” file name identifier, is the active version and is updated with data from subsequent months. The most recent re-analysis of ppt is M3, which was released on 1 July 2015 for the period January 1981- December 2014; an additional update was released on 15 July 2015 for January-June 2015 to bring it fully up to date. This ppt version, denoted by the “M3” file name identifier, is the active version and is updated with new data for subsequent months. Version M2 up through June 2015 will continue to be available via FTP through June 2016 (see ppt_old_method directory), but updates to this version ended on 1 July 2015. Users are encouraged to migrate to ppt version M3 as soon as is practical. Before 1981, the most recent ppt re-analysis continues to be M2, which was released in July 2013.
The AN81m version of tdmean became available in May 2016 (M1). Vpdmin and vpdmax became available in August 2016 (M1).
New station networks are being added periodically, which means Table 4 may be out of date for the most recent months. However, historical data from new networks are not incorporated until a new version of AN81m is developed.
10
Availability: 4km version available at http://prism.oregonstate.edu. 800m dataset available for a fee; contact [email protected]
Caveats: Dataset should not be used to calculate multi-decadal climate trends. Grids may contain non-climatic variations due to station equipment and location changes, openings and closings, and varying observation times, and the use of relatively short-term networks.
Table 5. Comparison of M3 (monthly) and D2 (daily) ppt versions with previous M2 and D1 versions.
M3/D2 M2/D1
Release Date Monthly (M3): Jul 2015 Daily (D2): Jul 2015
Monthly (M2): Aug 2013 Daily (D1): Jun 2013
Time Period Covered
Monthly (M3): Jan 1981-present Daily (D2): 1 Jan 1981-present
Monthly (M2): Jan 1895- Jun 2015 Daily (D1): 1 Jan 1981-30 Jun 2015
Station Data Summary: Input station data for monthly and daily interpolations are the same Non-PRISM Day and multi-day accumulations at COOP stations are re-apportioned and included in both daily and monthly interpolations Stations are subjected to the monthly data completeness criterion (<= 2 missing days per month) for both daily and monthly interpolations
Summary: Input station data for monthly and daily interpolations are different Non-PRISM Day and multi-day accumulations at COOP stations are omitted from daily interpolation, but accepted for monthly interpolation Stations are subjected to the monthly data completeness criterion (<= 2 missing days per month) for monthly interpolation, but not for daily interpolation
Daily/monthly grid reconciliation
Summary: At the end of each month, the daily values sum to the monthly values Mountain areas of western US: Daily grid values are forced to sum to monthly grid values at the end of each month Central and Eastern US and flat areas of West: Monthly grid values are forced to equal the sum of the daily grid values at the end of each month
Summary: At the end of each month, the daily values do not necessarily sum to the monthly values Monthly and daily grids are not reconciled

11
Interpolation Method Summary: Owing to the grid reconciliation, monthly and daily interpolation methods are effectively the same
Monthly: CAI 1895-2001 over entire domain; CAI 1895-present western US; CAI+RADAR in central and eastern US 2002-present
Daily: CAI 1981-2001 over entire domain; CAI 1981-present western US; CAI+RADAR in central and eastern US 2002-present
Summary: Monthly and daily interpolation methods are not necessarily the same
Monthly: CAI over entire domain, entire period
Daily: CAI over entire domain, entire period in western US; CAI+RADAR in central and eastern US 2002-2015
AN81dClimate elements: tmin, tmax, tmean (derived), tdmean, ppt, vpdmin, vpdmax
Units and scaling: tmin, tmax, tmean, tdmean (deg C); ppt (mm); vpdmin, vpdmax (hPa); all values are floating point
Description: Daily dataset covering the conterminous US, starting on 1 January 1981 and ending on the most recent day. Emphasis is on arriving at the best estimate, regardless of temporal consistency, and uses all station networks ingested by the PRISM Climate Group. Interpolation method for tmin and tmax is CAI, using 1981-2010 monthly climatologies as predictor grids.
For ppt, the latest version is D2. Differences between D1 and D2 are summarized in Table 5. Starting on 1 January 2002, both D1 and D2 ppt versions use a combination of CAI and RADAR interpolation in the central and eastern US. The RADAR version is created using the National Weather Service Stage 2 unbiased (ST2un) and 4 (ST4) 4km gridded radar products from the Advanced Hydrometeorological Prediction System (AHPS). On a pixel-by-pixel basis, a “besting” process compares the R2 values from the PRISM regressions of climate vs. station ppt (CAI) and ST2un vs. station ppt (RADAR). ST2un, rather than ST4, is used to estimate the predictive power of RADAR, because ST2un does not have individual station observations incorporated, which makes for a fairer comparison to CAI than ST4, which has many stations assimilated into the grid estimates. Based on this comparison, a RADAR weighting factor (0-1) is calculated. The weighting factor is then applied to the ST4 AHPS grid when averaging it with the CAI grid, to form a hybrid estimate.
Over the entire conterminous US, the daily ppt amounts from AN81d version D2 and monthly AN81m version M3 are processed to equal each other at the end of each month. In mountainous terrain areas of the western US (Rockies westward), the daily grid values are forced to sum to the AN81m monthly grid values. AN81m uses the CAI interpolation method in these areas. The AN81m monthly grids are believed to be superior to the daily grids in mountainous areas because the interpolation of longer time-step data better captures persistent orographic precipitation patterns than daily interpolation. To match the monthly values at the end of a month, the daily values are increased or decreased on a constant percentage basis. In the case where the monthly ppt value is

12
measurable (>= 0.01” or 2.54 mm), and the sum of the daily ppt grids is below measurable but non-zero, new wet days may be added, selected from the wettest ppt days available from the daily grids. An inverse-distance weighted grid of the number of wet days as reported by stations provides the number of wet days that should be added. In the case where the daily grid values sum to zero, i.e., there are no days where non-zero precipitation occurred, no wet days are added and the monthly value is set to zero.
The previous ppt version D1 also uses CAI in the western US but it is performed on a daily, rather than monthly, time step and there is no attempt to reconcile the monthly and daily values.
Station data used in AN81d are screened for adherence to a “PRISM day” criterion. A PRISM day is defined as 1200 UTC-1200 UTC (e.g., 7 AM-7AM EST), which is the same as the AHPS day definition. Once-per day observation times must fall within +/- 4 hours of the PRISM day to be included in the AN81d tmax and tmin datasets. Stations without reported observation times in the NCEI GHCN-D database are currently assumed to adhere to the PRISM day criterion. The dataset uses a day-ending naming convention, e.g., a day ending at 1200 UTC on 1 January is labeled 1 January.
Ppt version D1 does not use stations that fail to meet the PRISM Day criterion, or report multi-day accumulations. In contrast, version D2 takes advantage of an in-house algorithm that estimates PRISM Day station values from non-PRISM Day values at COOP stations, and also disaggregates COOP multi-day accumulations. This is done by creating initial daily ppt grids using PRISM Day stations only, identifying discrete ppt events of one day or more at the station locations, and re-apportioning the non-PRISM Day stations and multi-day accumulations to match the relative ppt amounts taken from the initial gridded PRISM Day ppt events. These re-apportioned daily station values are then added to the daily ppt station dataset and used in a second interpolation run.
In D2, given that the monthly and daily ppt values are reconciled, station values must pass both daily and monthly QC checks to be used in either the daily or monthly interpolation. For example, stations must pass a monthly data completeness check before being used in monthly mapping; if more than two days are missing, the station is rejected for that month. In version D2, stations failing the monthly data completeness check are omitted from the daily interpolation for all days in the month. In version D1, the daily interpolation did not require that the monthly data completeness check be passed.
Status: The most recent re-analysis of tmin and tmax is D1, which was released in July 2013 (full period of record). This version, denoted by the “D1” file name identifier, is the active version and is updated with data from subsequent months. The most recent re-analysis of ppt is D2, which was released on 1 July 2015 for the period 1 January 1981- 31 December 2014; an additional update was released on 15 July 2015 for 1 January – 30 June 2015 to bring it fully up to date. This ppt version, denoted by the “D2” file name identifier, is the active version and is updated with new data for subsequent days. Version D1 up through June 2015 will continue to be available via FTP through June 2016 (ppt_old_method directory), but updates to this version ended on 1 July 2015. Users are encouraged to migrate to ppt version D2 as soon as is practical.
The AN81d version of tdmean became available in May 2016 (D1). Vpdmin and vpdmax became available in August 2016 (D1).
New station networks are being added periodically, which means Table 4 may be out of date for the most recent months. However, historical data from new networks are not incorporated until a new version of AN81d is developed.
Availability: 4km version available at http://prism.oregonstate.edu. 800m dataset available for a fee; contact [email protected]
13
Caveats: Dataset should not be used to calculate multi-decadal climate trends. Grids may contain non-climatic variations due to station equipment and location changes, openings and closings, and the use of RADAR data for ppt starting in 2002. Screening stations for adherence to a “PRISM day” criterion does help to minimize time of tmin and tmax observation bias. However, the downside is that this results in the exclusion of a large percentage of stations from the analysis, especially early in the record. For example, in 1981, non-PRISM day COOP temperature stations outnumbered PRISM day stations by about 2 to 1. The two groups were about equal in size in 1990. By 2010, PRISM day COOP stations outnumbered non-PRISM day stations by about 3 to 1.
References
Daly, C., Halbleib, M., Smith, J.I., Gibson, W.P., Doggett, M.K., Taylor, G.H., Curtis, J., and Pasteris, P.A. 2008. Physiographically-sensitive mapping of temperature and precipitation across the conterminous United States. International Journal of Climatology, 28: 2031-2064. http://www.prism.oregonstate.edu/documents/pubs/2008intjclim_physiographicMapping_daly.pdf
Daly, C., J.I. Smith, and K.V. Olson. 2015. Mapping atmospheric moisture climatologies across the
conterminous United States. PloS ONE 10(10):e0141140. doi:10.1371/journal.pone.0141140. http://www.prism.oregonstate.edu/documents/pubs/2015plosone_humidityMapping_daly.pdf

14
Appendices
TableA1.DescriptionsofStationNetworksUsedinPRISMSpatialClimateDatasets
TableA2.HistoryofstationnetworksusedinPRISMmonthlytimeseriesdatasets:Tmax/Tmin
TableA3.HistoryofstationnetworksusedinPRISMmonthlytimeseriesdatasets:Precipitation
TableA4.HistoryofstationnetworksusedinPRISMmonthlytimeseriesdatasets:Tdmean,Vpdmin,Vpdmax

15
TableA1.DescriptionsofstationnetworksusedinPRISMspatialclimatedatasets Dataset Usage
Network Description Tmax, Tmin Ppt Tdmean,
Vpdmin, Vpdmax
AGRIMET Bureau of Reclamation Agricultural Weather Network
All All Norm81m LT71m AN81m AN81d
AGWXNET Washington State University’s Agricultural Weather Network (AgWeatherNet)
AN81m AN81d
AN81m1
AN81d1 AN81m AN81d
ASOS/ISH
Automated Surface Observing System and related networks (e.g., AWOS), and Integrated Surface Hourly network
Notes: ASOS network began installation in 1996, with poor instrumentation for measuring snowfall.
All AN81m1
AN81d1
All
CDEC California Data Exchange Center
Notes: A collection of stations from various networks operating in California.
Norm71m Norm81m
Norm71m Norm81m
n/a
CIMIS California Irrigation Management Information System AN81m AN81d
n/a AN81m AN81d
COAGMET Colorado Agricultural Meteorological Network AN81m AN81d
AN81m1 AN81d1
Norm81m AN81m
COCORAHS
Community Collaborative Rain, Hail and Snow Network
Notes: Currently the largest ppt observing network in the US.
n/a Norm81m AN81m AN81d
n/a
COOP
National Weather Service Cooperative Observer Program
Notes: These stations are part of the GHCN-D database. COOP is the longest-running climate network in the US.
All All Norm81m LT71m LT81m AN81m (tdmean only)
DEOS Delaware Environmental Observing System AN81m AN81d
AN81m1 AN81d1
AN81m AN81d
EC Environment Canada All
All except LT71m
n/a
FAWN Florida Agricultural Weather Network AN81m AN81d
AN81m AN81d
AN81m AN81d
HDSC
NOAA Hydrometeorological Design Studies Center
Notes: A collection of ppt stations in California used by HDSC and PRISM to produce the NOAA Atlas 14 ppt frequency maps. Period of record ends in 2010.
n/a Norm81m AN81m
n/a
16
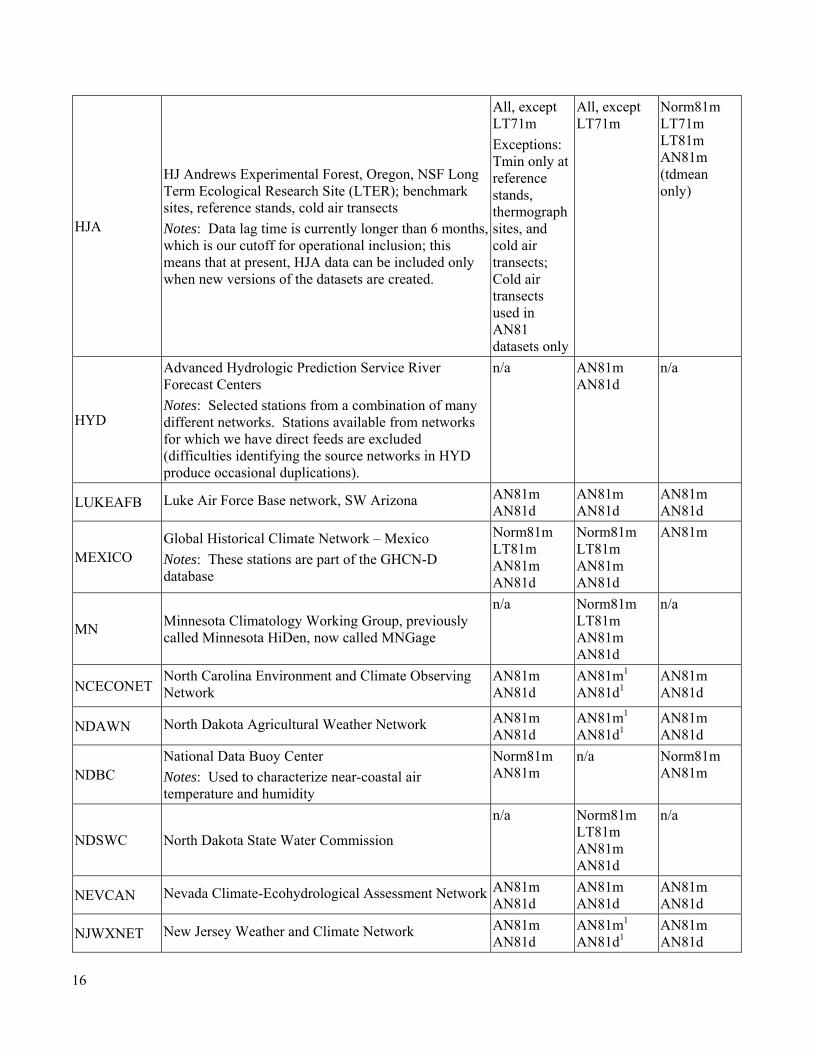
HJA
HJ Andrews Experimental Forest, Oregon, NSF Long Term Ecological Research Site (LTER); benchmark sites, reference stands, cold air transects
Notes: Data lag time is currently longer than 6 months, which is our cutoff for operational inclusion; this means that at present, HJA data can be included only when new versions of the datasets are created.
All, except LT71m
Exceptions: Tmin only at reference stands, thermograph sites, and cold air transects; Cold air transects used in AN81 datasets only
All, except LT71m
Norm81m LT71m LT81m AN81m (tdmean only)
HYD
Advanced Hydrologic Prediction Service River Forecast Centers
Notes: Selected stations from a combination of many different networks. Stations available from networks for which we have direct feeds are excluded (difficulties identifying the source networks in HYD produce occasional duplications).
n/a AN81m AN81d
n/a
LUKEAFB Luke Air Force Base network, SW Arizona AN81m AN81d
AN81m AN81d
AN81m AN81d
MEXICO Global Historical Climate Network – Mexico
Notes: These stations are part of the GHCN-D database
Norm81m LT81m AN81m AN81d
Norm81m LT81m AN81m AN81d
AN81m
MN Minnesota Climatology Working Group, previously called Minnesota HiDen, now called MNGage
n/a Norm81m LT81m AN81m AN81d
n/a
NCECONET North Carolina Environment and Climate Observing Network
AN81m AN81d
AN81m1 AN81d1
AN81m AN81d
NDAWN North Dakota Agricultural Weather Network AN81m AN81d
AN81m1 AN81d1
AN81m AN81d
NDBC National Data Buoy Center
Notes: Used to characterize near-coastal air temperature and humidity
Norm81m AN81m
n/a Norm81m AN81m
NDSWC North Dakota State Water Commission
n/a Norm81m LT81m AN81m AN81d
n/a
NEVCAN Nevada Climate-Ecohydrological Assessment Network AN81m AN81d
AN81m AN81d
AN81m AN81d
NJWXNET New Jersey Weather and Climate Network AN81m AN81d
AN81m1 AN81d1
AN81m AN81d

17
NVDWR Nevada Division of Water Resources
Notes: Collection of ppt gauges in western Nevada.
n/a Norm71m Norm81m
OKMESO-NET
Oklahoma Mesonet Norm81m AN81m AN81d
Norm81m AN81m AN81d
Norm81m AN81m AN81d
RAWS U.S. Forest Service and Bureau of Land Management Remote Automated Weather Stations
All, except AN71m
All1
LT71m LT81m AN81m AN81d
SCAN USDA NRCS Soil Climate Analysis Network AN81m AN81d
AN81m1 AN81d1
Norm81m AN81m AN81d
SFWMD South Florida Water Management District n/a Norm81m
AN81m AN81d
n/a
SNOTEL
Natural Resources Conservation Service Snowpack Telemetry
Notes: The main high elevation network in western mountains.
All All n/a
SNOW-COURSE
Natural Resources Conservation Service Snow Course
Notes: An algorithm was developed to relate April 1 snow water equivalent at the snow courses to winter ppt. Useful in remote mountain areas lacking actual ppt measurements.
NA Norm71m Norm81m
NA
STORAGE
Miscellaneous Long-Term Precipitation Storage Gage Stations
Notes: Storage gauges from various agencies in remote areas of the western US that are checked monthly to yearly.
n/a Norm71m Norm81m
n/a
UPPERAIR
National Centers for Environmental Prediction/National Center for Atmospheric Research
Notes: GGUAS is the Gridded Global Upper Air Statistics dataset, and NN is the NCAR/NCEP reanalysis dataset. Used to represent mean temperatures at high elevations in free-air topographic positions.
Norm71m (GGUAS) Norm81m (NN)
n/a Norm81m
USLTER Selected stations from NSF Long Term Ecological Research Sites: Hubbard Brook, Coweeta, Sevietta, Niwot Ridge
n/a Norm81m n/a
WBAN
Weather Bureau, Army, Navy
Notes: These stations are part of the GHCN-D database. In 1996, many WBAN stations converted to ASOS instrumentation.
All All1 Norm81m LT71m (tdmean only) LT81m AN81m AN81d

18
WRCC Western Regional Climate Center All All n/a
1 Network uses unheated tipping bucket rain gauges, which are not suited for measuring snowfall. Given that this network covers areas with significant seasonal snowfall, precipitation data are used during May-Sep only.
19
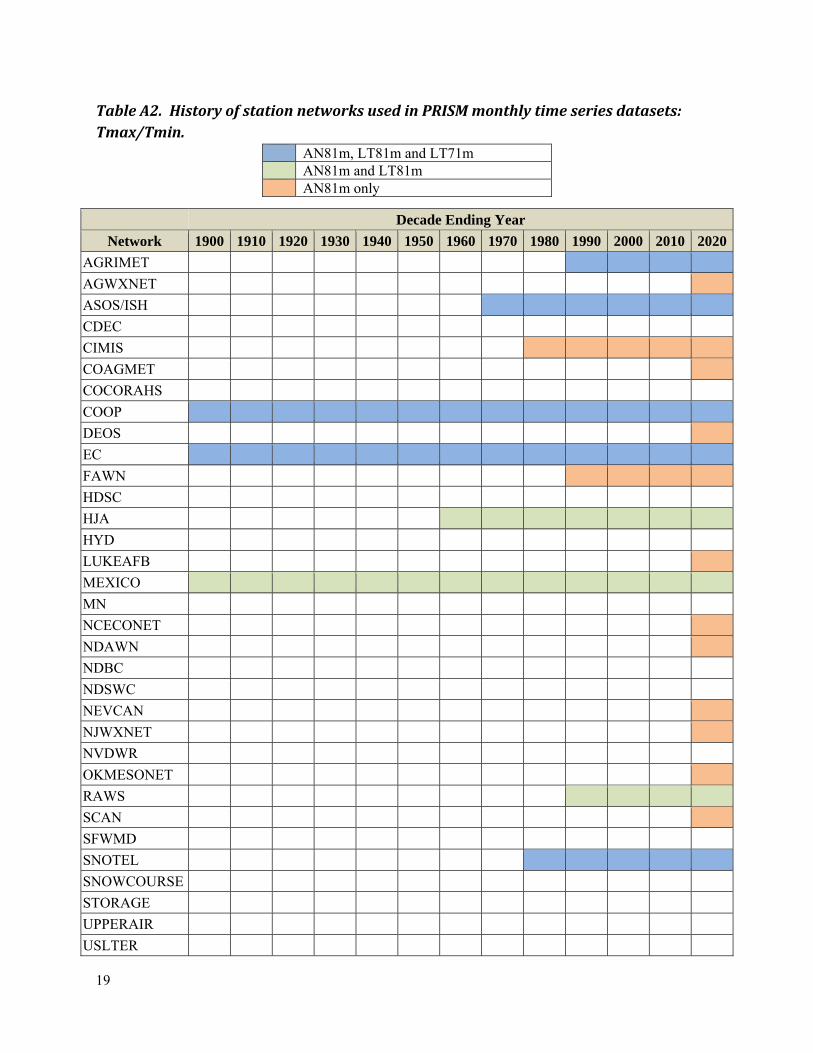
TableA2.HistoryofstationnetworksusedinPRISMmonthlytimeseriesdatasets:Tmax/Tmin.
AN81m, LT81m and LT71m AN81m and LT81m AN81m only
Decade Ending Year
Network 1900 1910 1920 1930 1940 1950 1960 1970 1980 1990 2000 2010 2020
AGRIMET
AGWXNET
ASOS/ISH
CDEC
CIMIS
COAGMET
COCORAHS
COOP
DEOS
EC
FAWN
HDSC
HJA
HYD
LUKEAFB
MEXICO
MN
NCECONET
NDAWN
NDBC
NDSWC
NEVCAN
NJWXNET
NVDWR
OKMESONET
RAWS
SCAN
SFWMD
SNOTEL
SNOWCOURSE
STORAGE
UPPERAIR
USLTER

20
WBAN
WRCC
TableA3.HistoryofstationnetworksusedinPRISMmonthlytimeseriesdatasets:Precipitation.
AN81m, LT81m and LT71m AN81m and LT81m AN81m only
Network Decade Ending Year
1900 1910 1920 1930 1940 1950 1960 1970 1980 1990 2000 2010 2020
AGRIMET
AGWXNET
ASOS/ISH
CDEC
CIMIS
COAGMET
COCORAHS
COOP
DEOS
EC
FAWN
HDSC
HJA
HYD
LUKEAFB
MEXICO
MN
NCECONET
NDAWN
NDBC
NDSWC
NEVCAN
NJWXNET
NVDWR
OKMESONET
RAWS
SCAN
SFWMD

21
SNOTEL
SNOWCOURSE
STORAGE
UPPERAIR
USLTER
WBAN
WRCC
TableA4.HistoryofstationnetworksusedinPRISMmonthlytimeseriesdatasets:Tdmean,Vpdmin,Vpdmax.
AN81m, LT81m and LT71m AN81m and LT81m AN81m only
Network Decade Ending Year
1900 1910 1920 1930 1940 1950 1960 1970 1980 1990 2000 2010 2020
AGRIMET
AGWXNET
ASOS/ISH
CDEC
CIMIS
COAGMET
COCORAHS
COOP
DEOS
EC
FAWN
HDSC
HJA
HYD
MEXICO
MN
NCECONET
NDBC
NDSWC
NEVCAN
NJWXNET
NVDWR
OKMESONET
RAWS

22
SCAN
SFWMD
SNOTEL
SNOWCOURSE
STORAGE
UPPERAIR
USLTER
WBAN
WRCC